

Published: Dec 16, 2025 by Isaac Johnson
There have been a few updates recently to the telemetry Gemini CLI can provide to us and I’ve been meaning to circle back on those for the last month.
We’ll set up telemetry gather in GCP Monitoring (instead of Datadog or NewRelic). We’ll show some of the new metrics, logs and span details, but also cover how we can alert on them as well.
Gemini CLI update
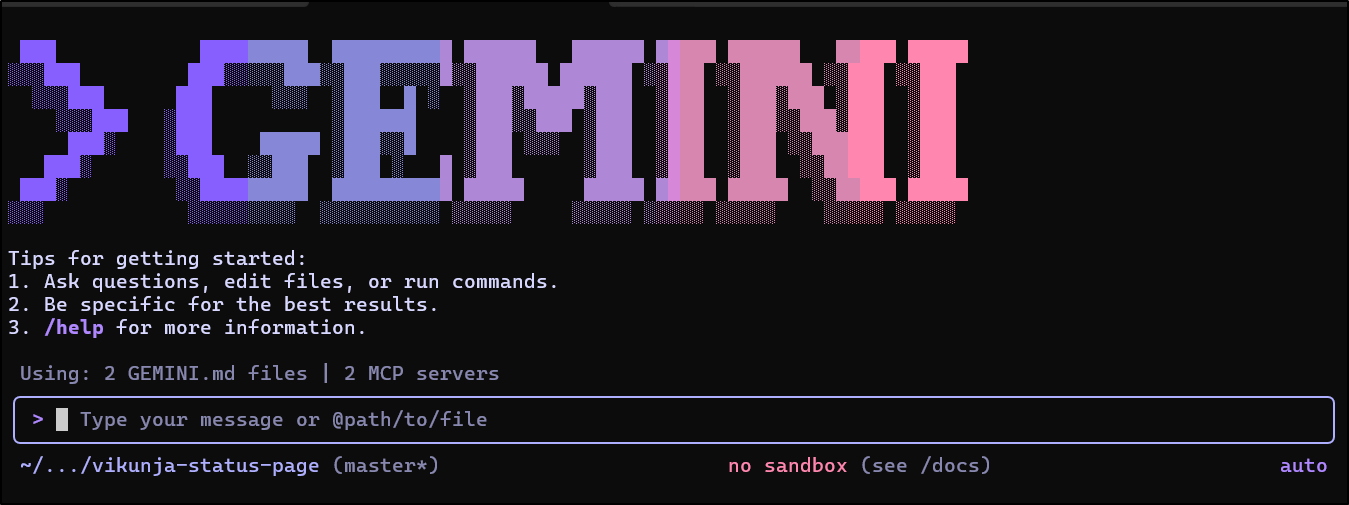
Whenever you launch Gemini CLI it will check for updates
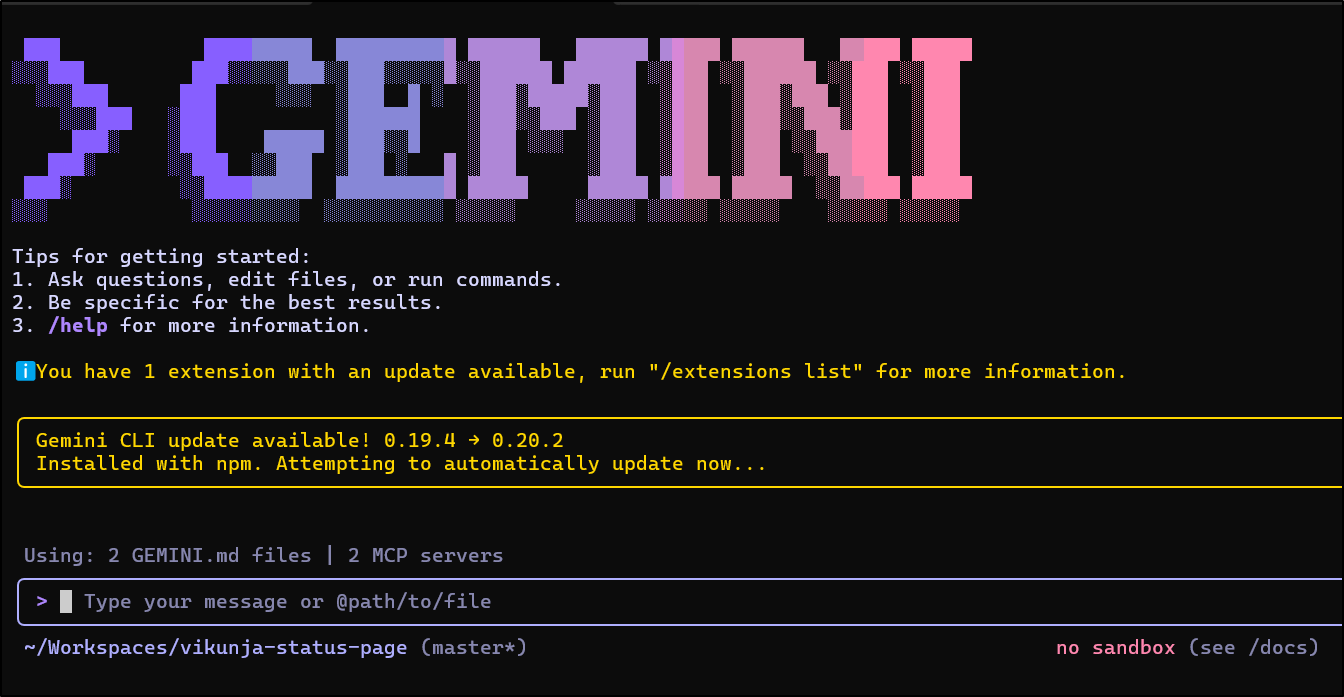
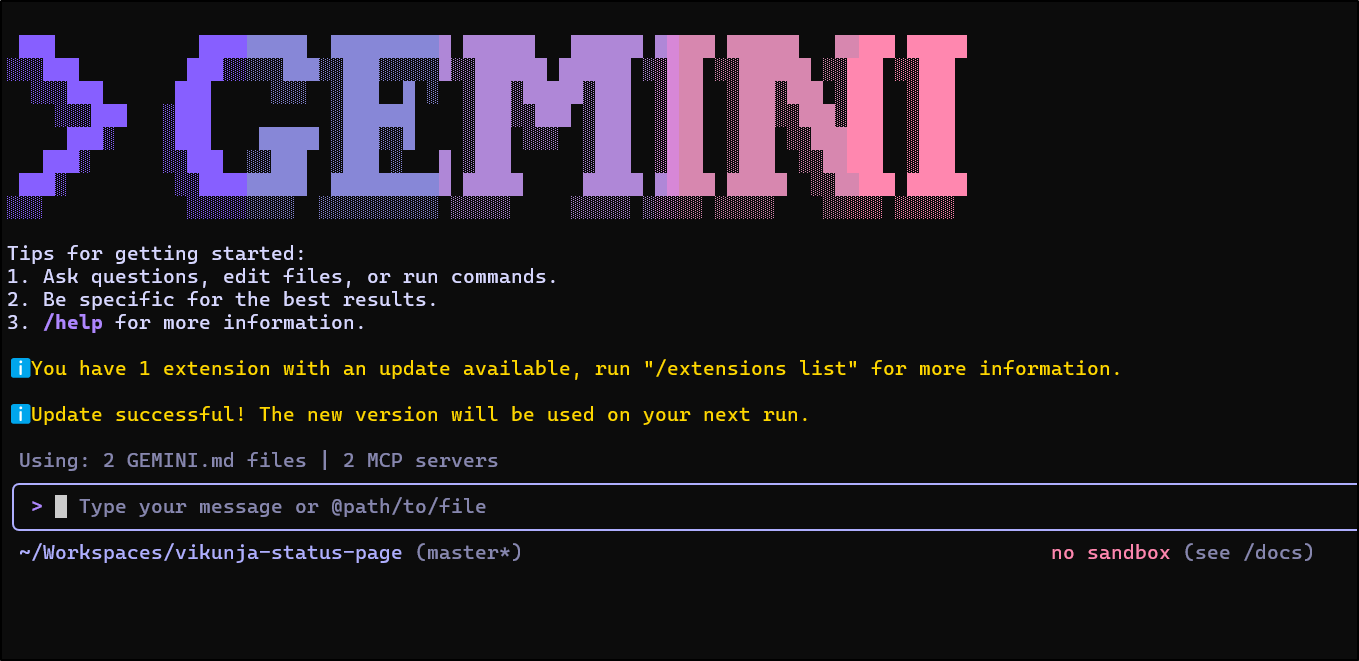
and if you give it a moment, it will download and install new versions automatically (quick enough it happened when i was writing this line)
As you see, I have an update available to NanoBanana’s extension
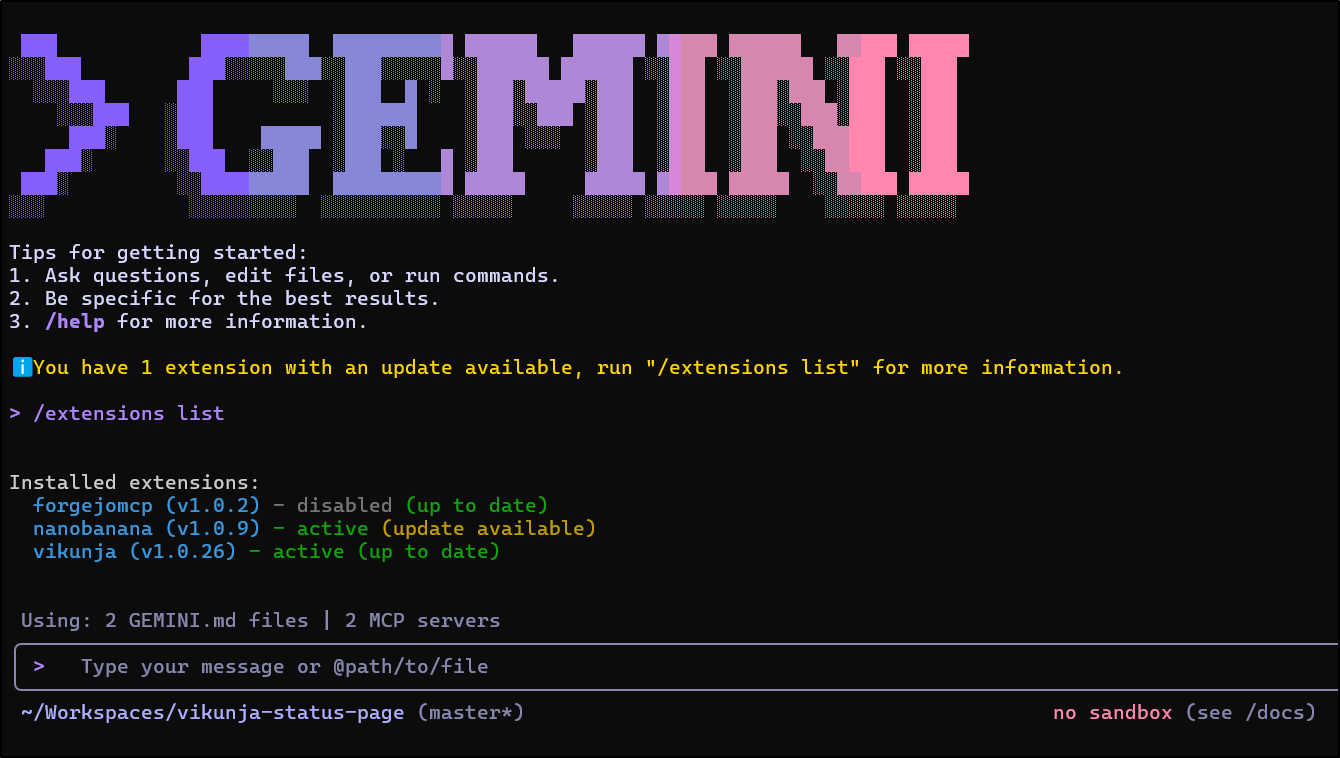
I can just use /extensions update --all to catch up on any outstanding extensions updates
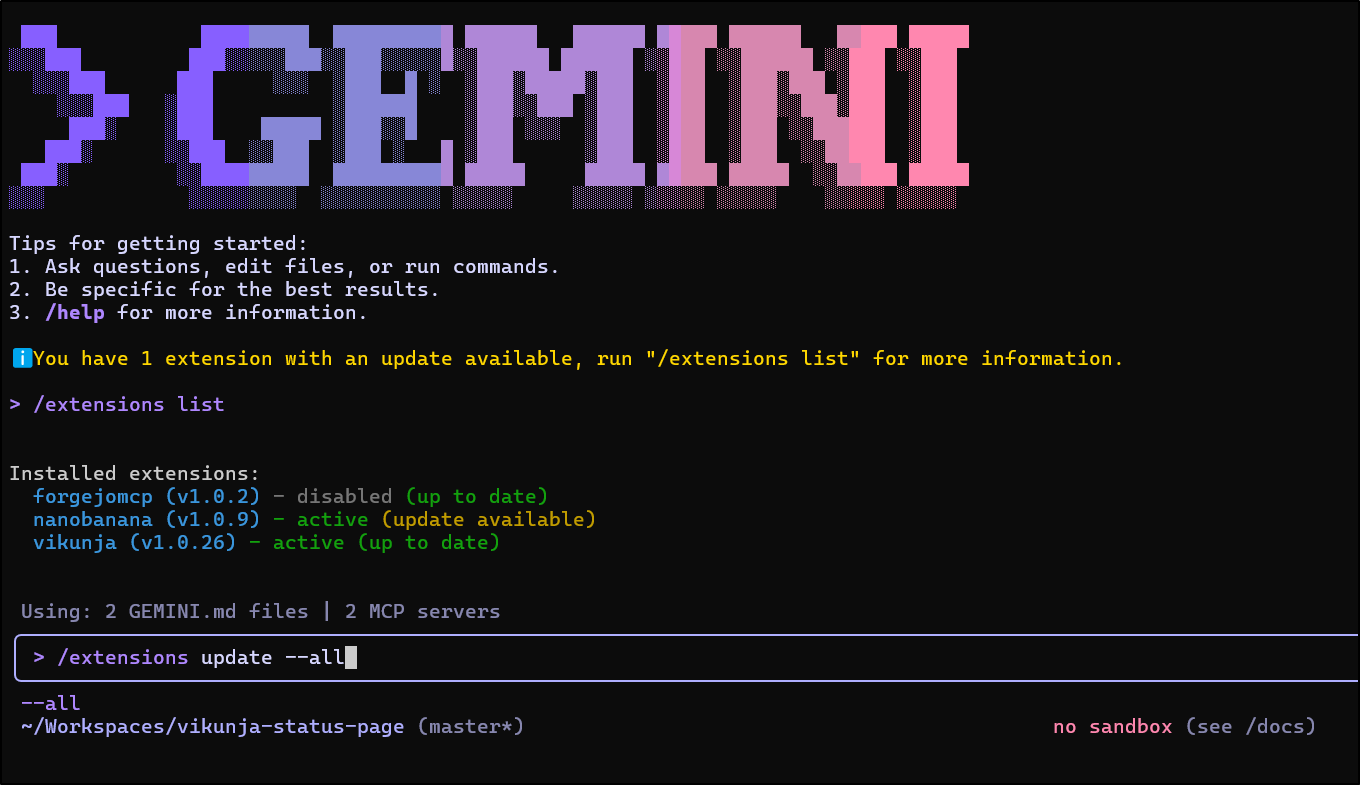
In this case, it needs me to restart Gemini CLI (with crtl-c)
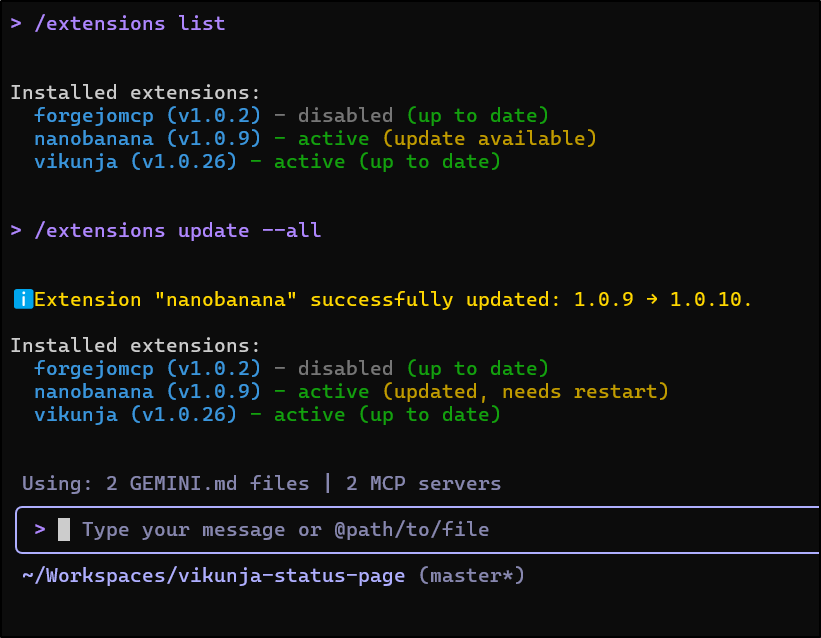
We’re now up to date
Telemetry in GCP
I have written on sending Telemetry to Datadog and New Relic, but up till now I haven’t really covered the most straightforward approach; sending it to GCP.
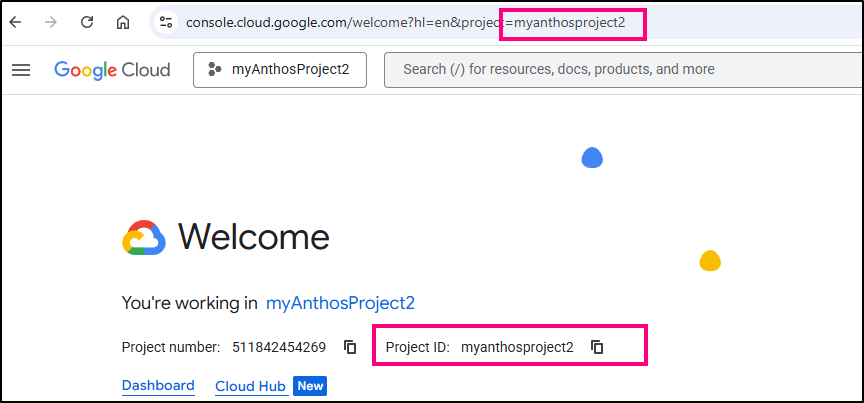
First, I’ll double check I have the right APIs enabled in my myanthosproject2 project.
If you ever get confused as to the “Project ID”, it’s listed on your main cloud.google.com page:
I’ll first login with the application-default login
$ gcloud auth application-default login
Your browser has been opened to visit:

    https://accounts.google.com/o/oauth2/auth?response_type=code&client_id=764086051850-6qr4p6gpi6hn506pt8ejuq83di341hur.apps.googleusercontent.com&redirect_uri=http%3A%2F%2Flocalhost%3A8085%2F&scope=openid+https%3A%2F%2Fwww.googleapis.com%2Fauth%2Fuserinfo.email+https%3A%2F%2Fwww.googleapis.com%2Fauth%2Fcloud-platform+https%3A%2F%2Fwww.googleapis.com%2Fauth%2Fsqlservice.login&state=g8yiO8gFyNDB4m4KcOKlWjcZV5Udge&access_type=offline&code_challenge=76sXohbSKJkcCKrJYIc1QijupXpWcPHo1Jc1ilQH6V0&code_challenge_method=S256


Credentials saved to file: [/home/builder/.config/gcloud/application_default_credentials.json]

These credentials will be used by any library that requests Application Default Credentials (ADC).

Quota project "myanthosproject2" was added to ADC which can be used by Google client libraries for billing and quota. Note that some services may still bill the project owning the resource.


To take a quick anonymous survey, run:
  $ gcloud survey
I’ll make sure to set the env var for my project and enable any APIs I need
$ export OTLP_GOOGLE_CLOUD_PROJECT="myanthosproject2"
$ gcloud services enable \
  cloudtrace.googleapis.com \
  monitoring.googleapis.com \
  logging.googleapis.com \
  --project="$OTLP_GOOGLE_CLOUD_PROJECT"
Operation "operations/acat.p2-511842454269-7d8bbe01-a4a7-4721-adf4-d5365a2a22d5" finished successfully.
Update global settings
My current settings look something like this with the “OLD” variables noting the prior OTel collectors
{
  "security": {
    "auth": {
      "selectedType": "oauth-personal"
    }
  },
  "telemetry": {
    "enabled": false,
    "target": "local",
    "otlpEndpoint": "https://otlp.nr-data.net:4318",
    "otlpProtocol": "http",
    "OLDERotlpEndpoint": "http://192.168.1.121:4317",
    "OLDotlpEndpoint": "http://192.168.1.33:30921",
    "otlpHeaders": {
      "api-key": "xxxxxxxxxxxxxxxxxxxxxxxxxxxxxxxxxxNRAL"
    },
    "logPrompts": true
  },
  "ui": {
    "theme": "Shades Of Purple"
  },
  "mcpServers": {},
  "general": {
    "previewFeatures": true
  }
}
And no, that otlpHeaders block is not yet implemented (working on it).
The updated block looks like this:
{
  "security": {
    "auth": {
      "selectedType": "oauth-personal"
    }
  },
  "telemetry": {
    "enabled": false,
    "target": "gcp",
    "useCliAuth": true,
    "logPrompts": true
  },
  "ui": {
    "theme": "Shades Of Purple"
  },
  "mcpServers": {},
  "general": {
    "previewFeatures": true
  }
}
If you are following along, yes, i realize in a few that i left “enabled: false” errantly. go ahead and set that to enabled: true for telemetry
Let’s give it some work
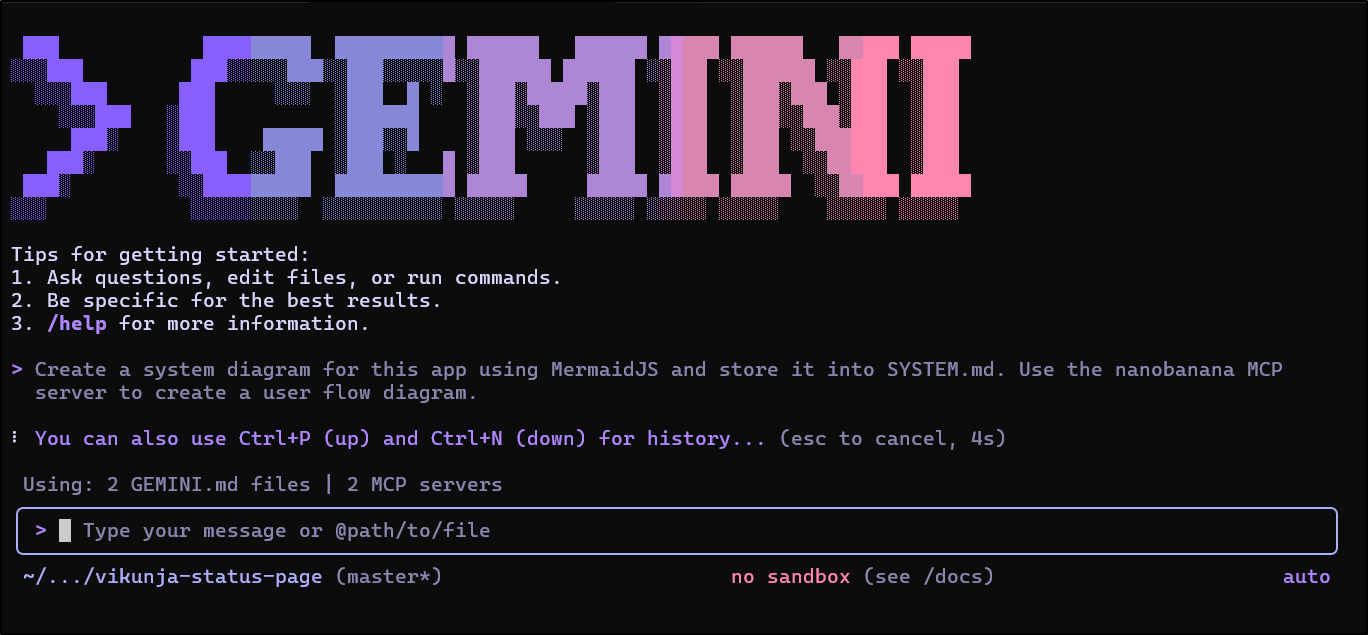
I got close, but neglected to set my GEMINI_API_KEY prior to firing this off so Nano Banana couldn’t do its work
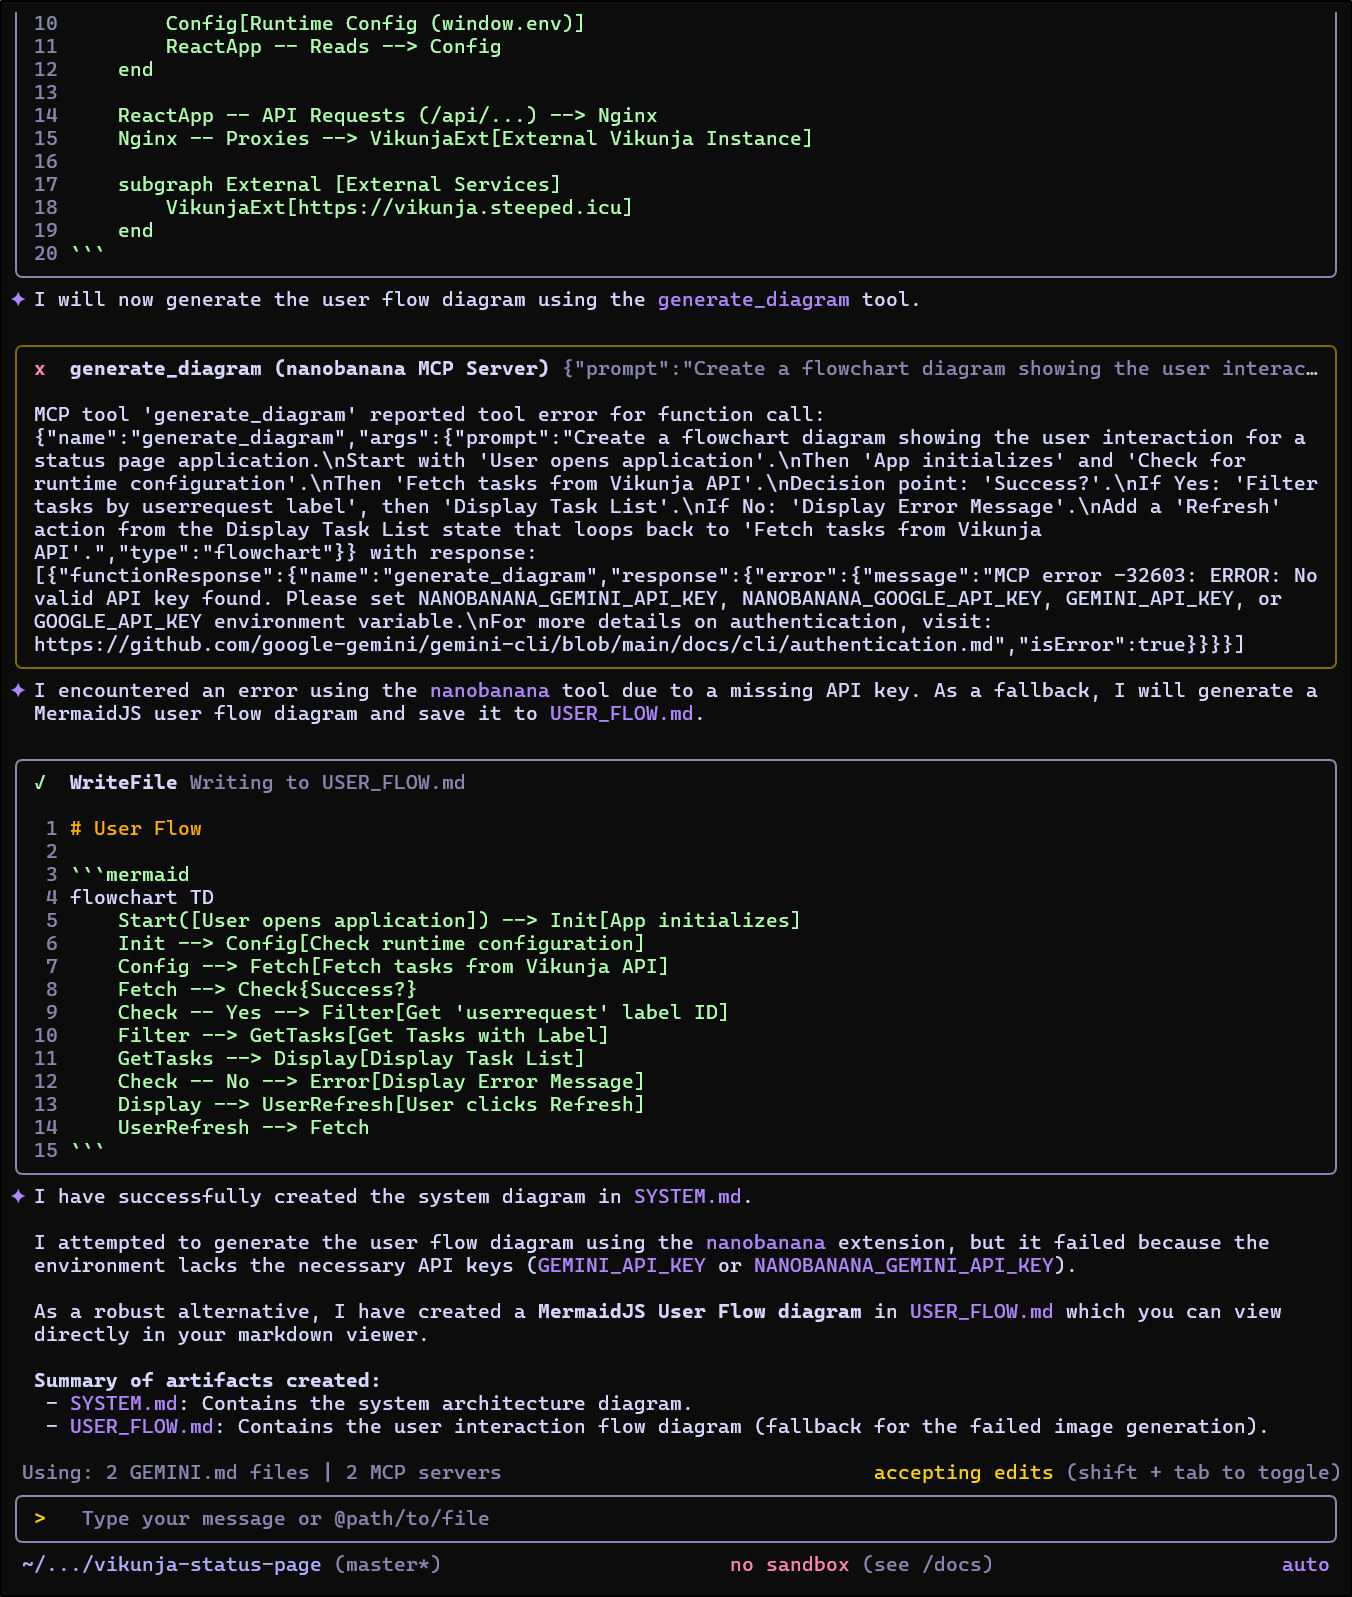
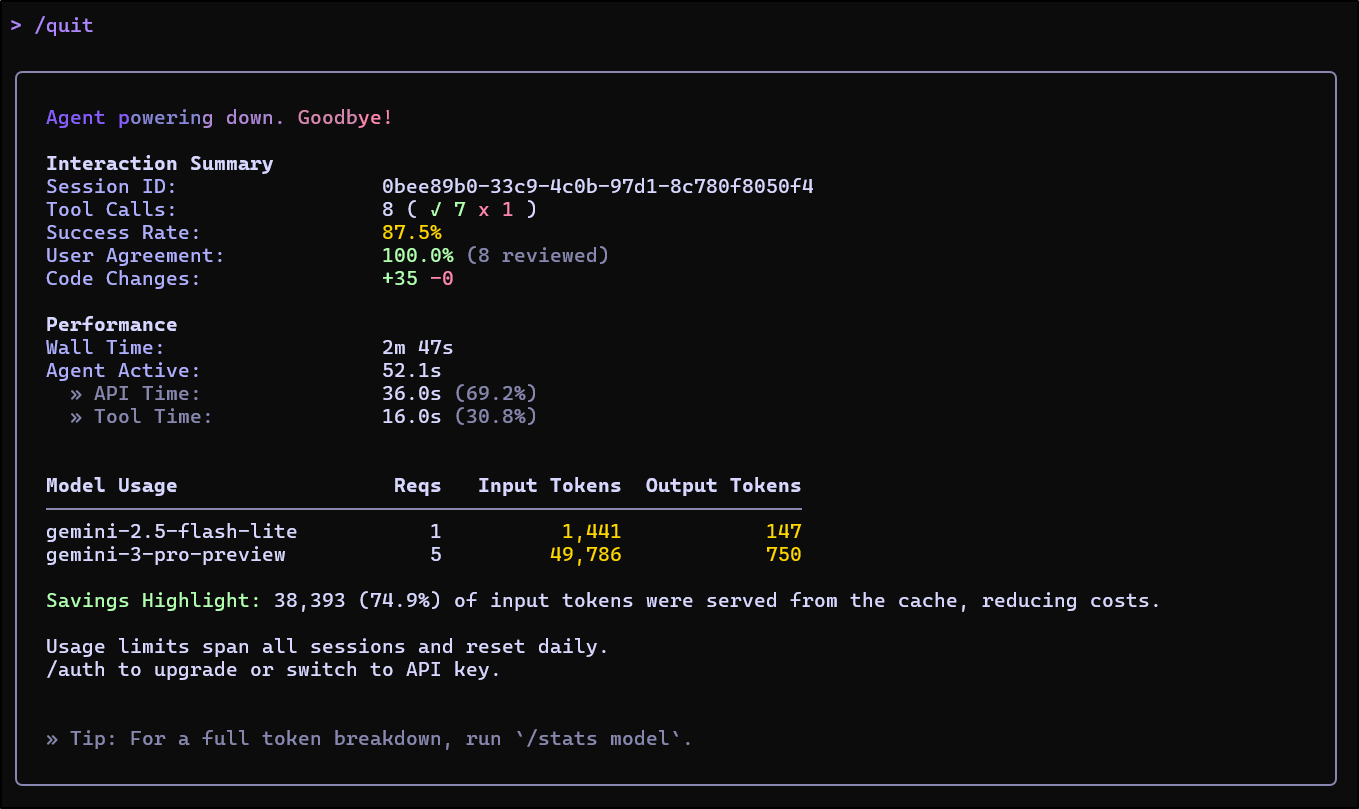
I can see some basic usage details when I conclude
I set my GEMINI_API_KEY and used the up arrow to pull up my last chat (love that feature)
Let’s try it again
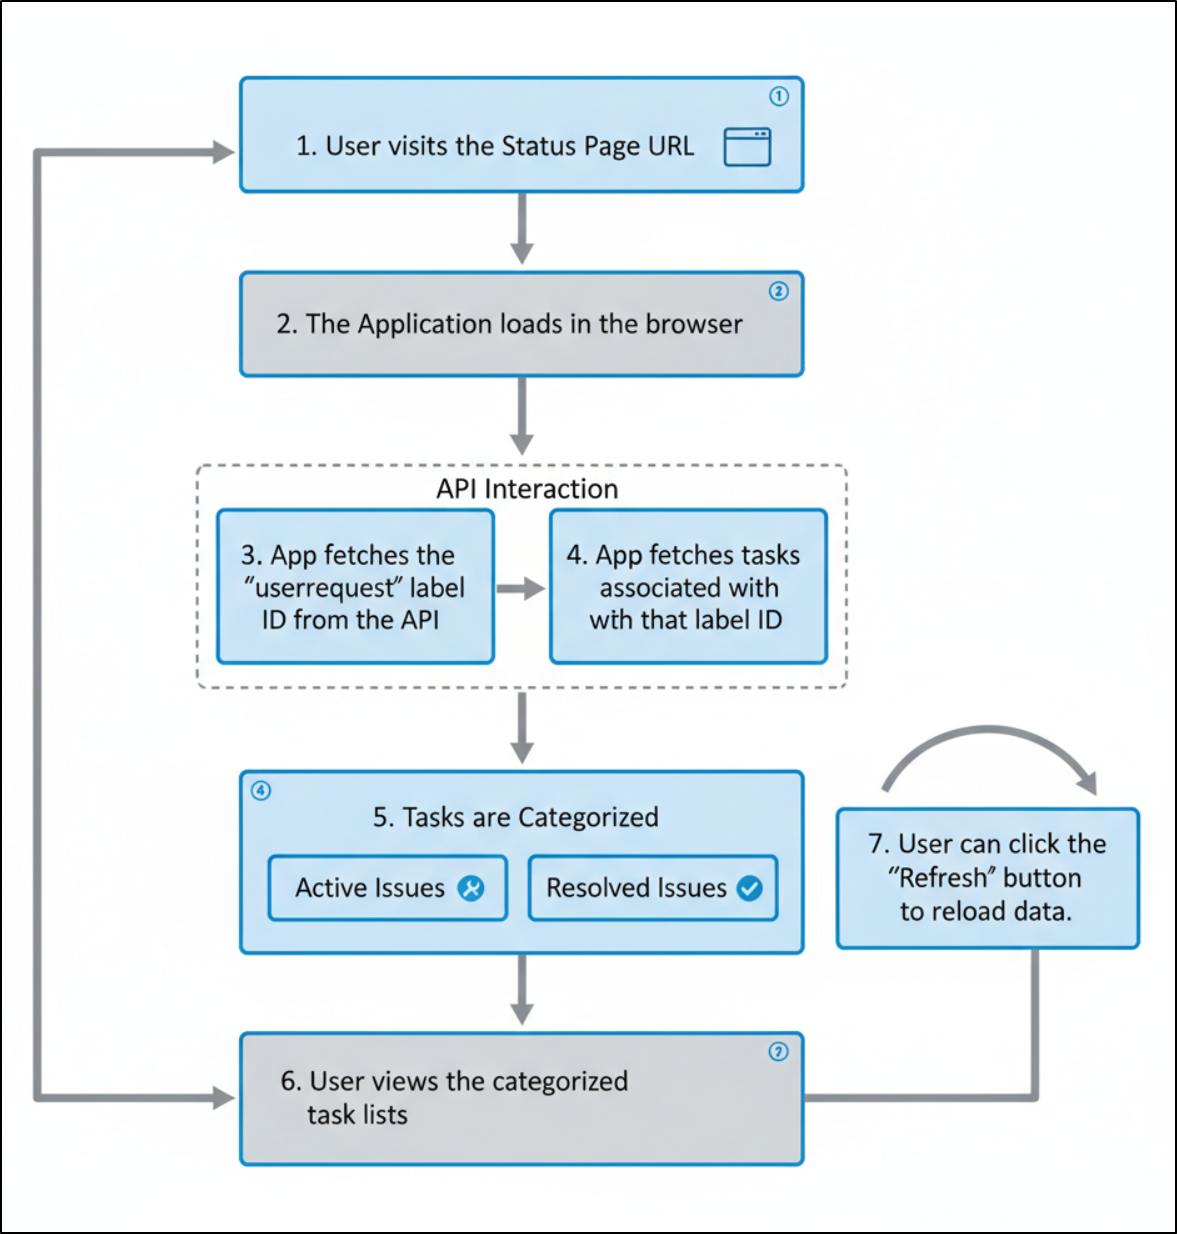
I don’t know about you, but I think these diagrams are pretty darn good
Here we see the generated User Flow diagram that used Nano Banana
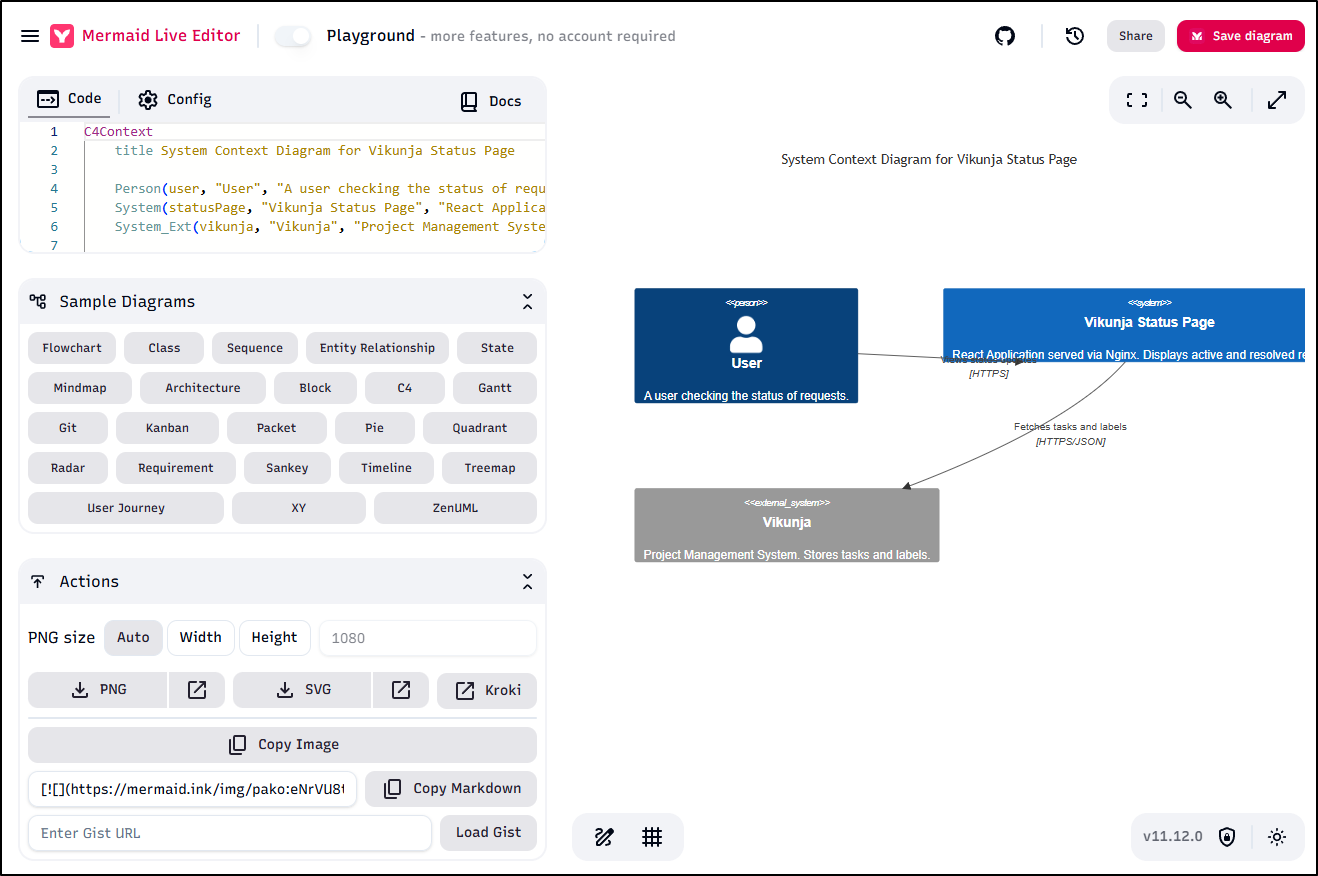
The Mermaid diagrams look okay - they are accurate but the text flows over itself in parts
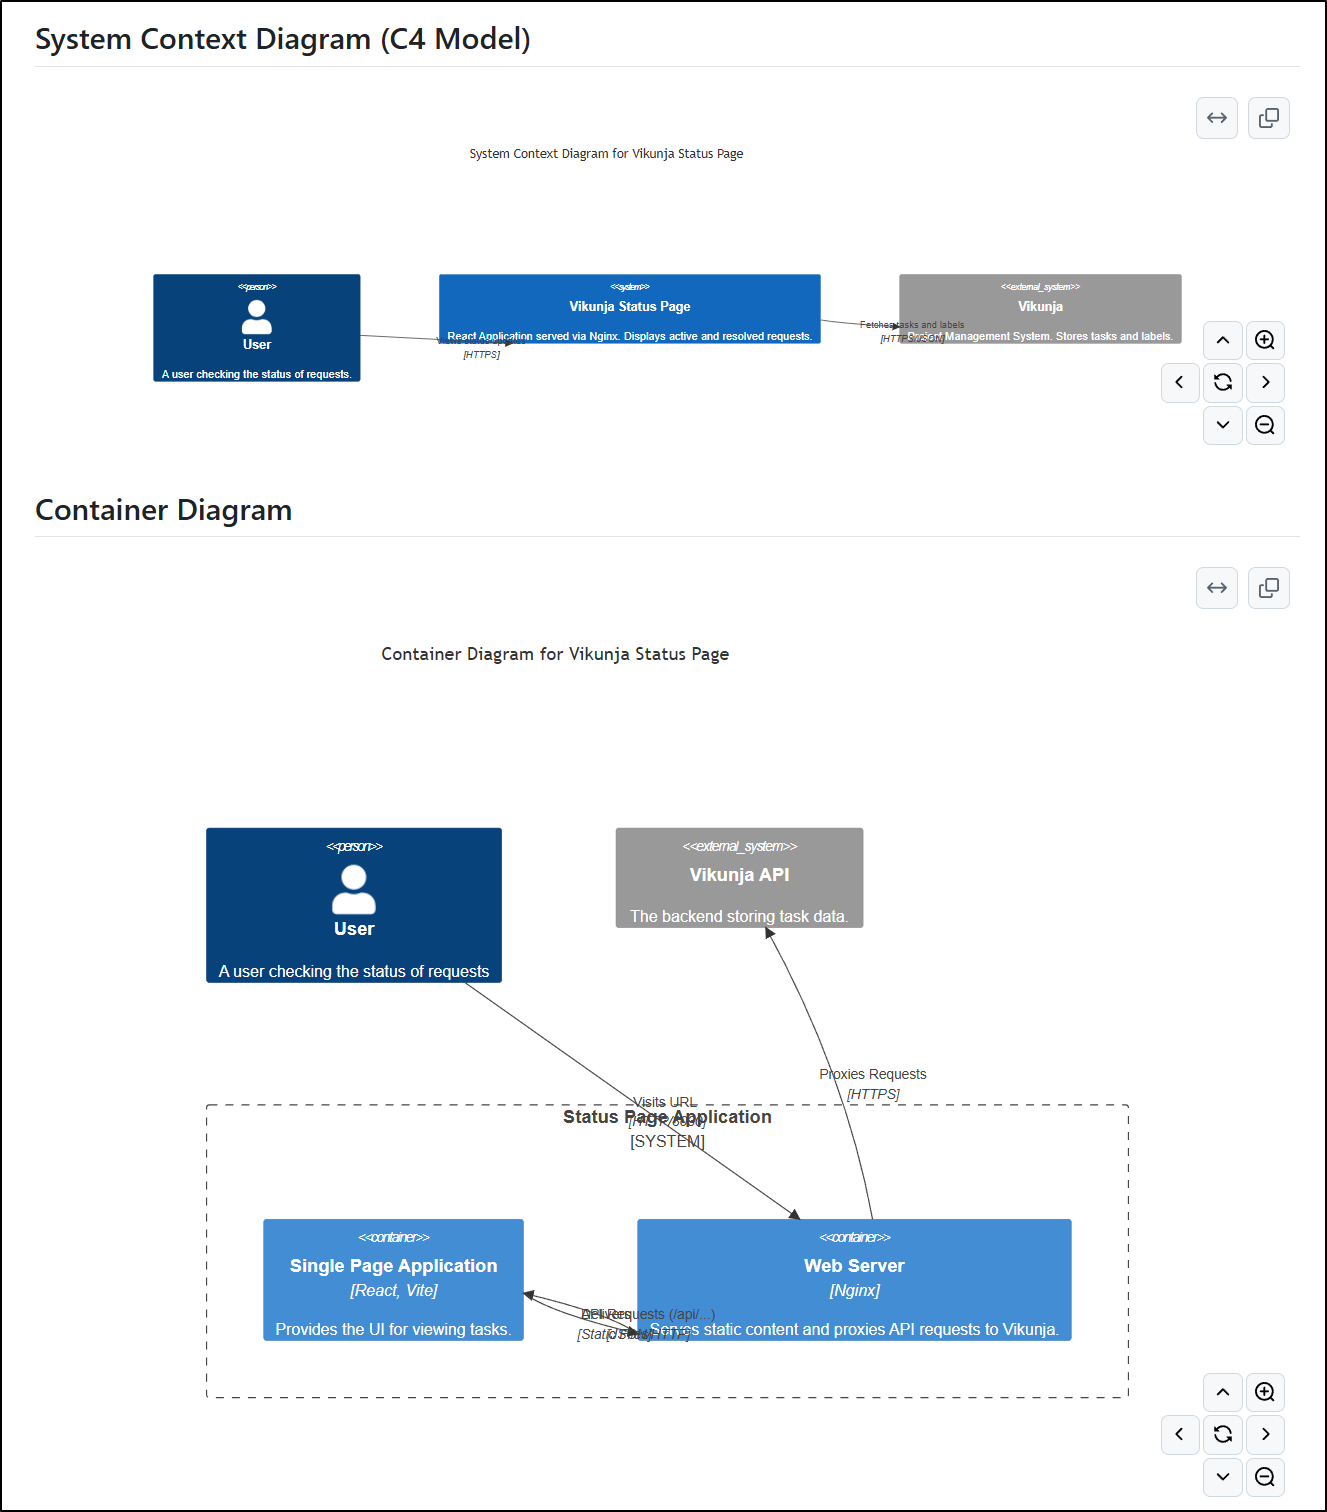
I pulled that into mermaid.live and I don’t really see a way to improve it (save for using a different diagram model than C4Context)
Telemetry
Oh yeah, I was going to write about Metrics and Telemetry data, wasn’t I? I got distracted (as I often do) with the updates Gemini CLI actually made to my app.
It might be a bit confusing at times for where our data ends up in the GCP Console.
Our Logs will be in Logs Explorer if any are collected.
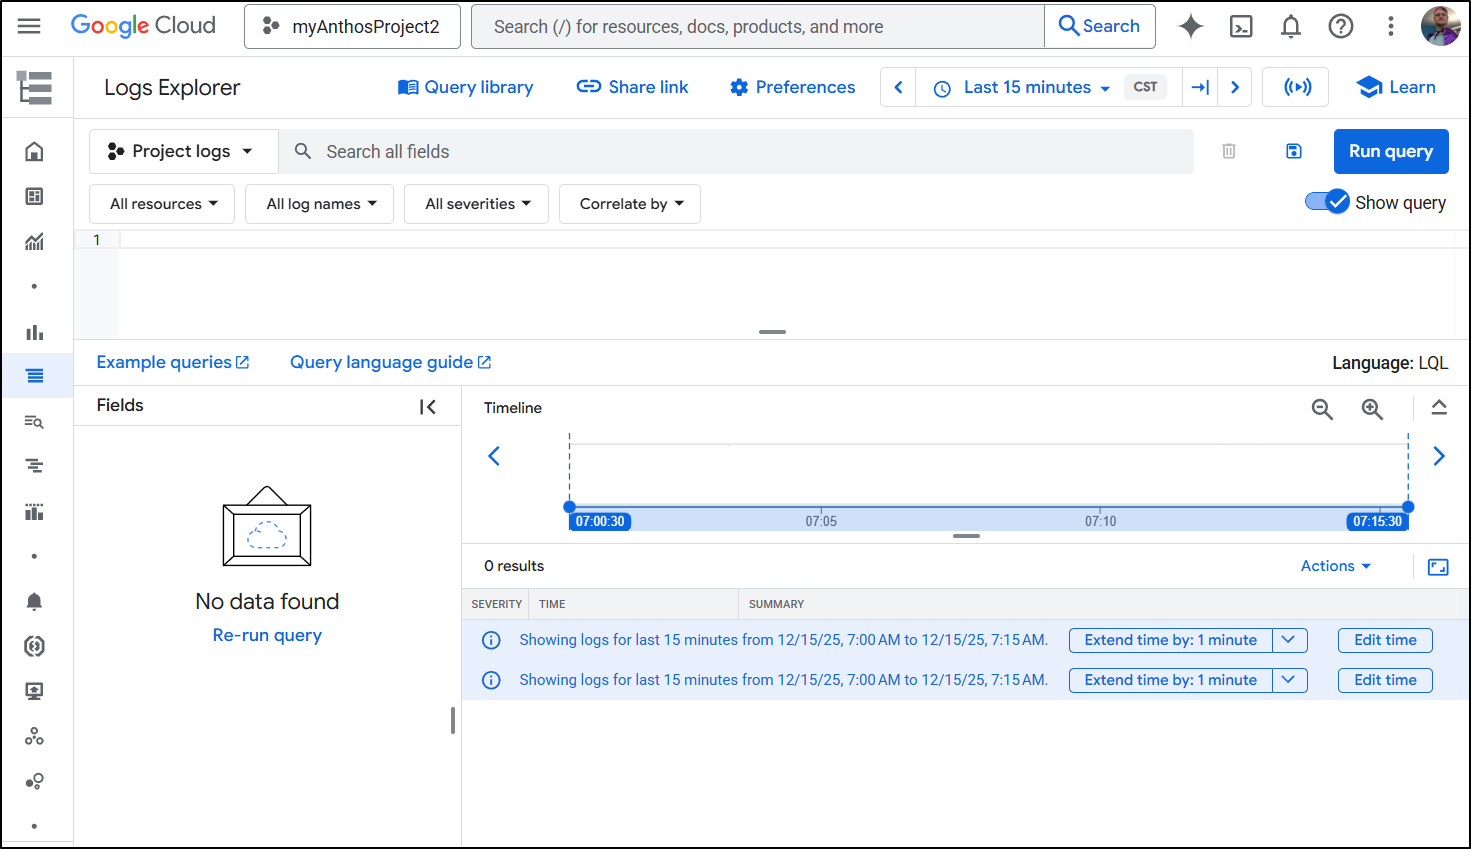
I went back 30m to see I was looking in the right place and I do see my operations to enable API listed there.
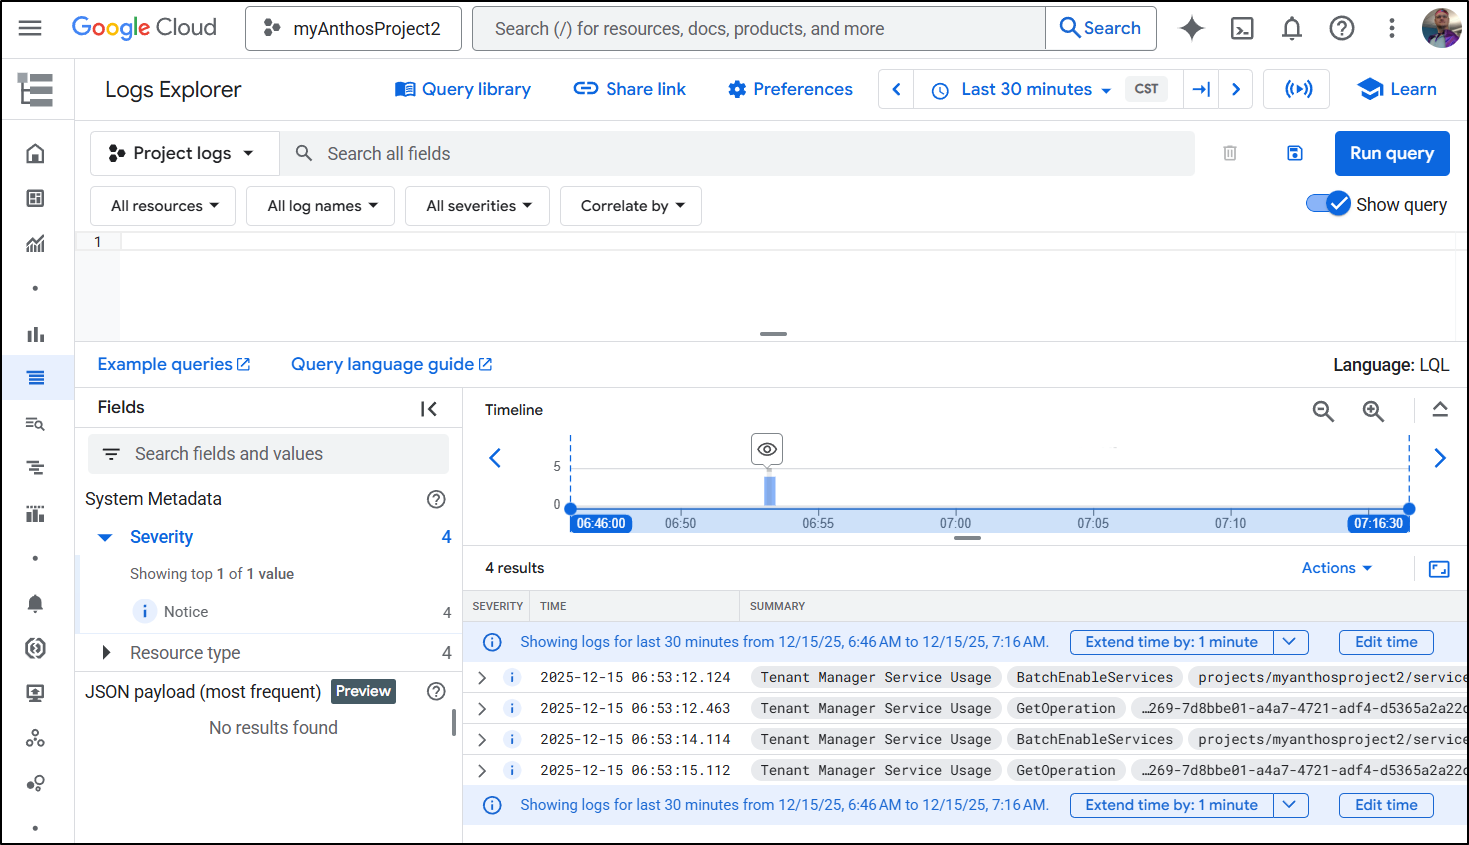
After a few I realized I screwed up and left “enabled: false” because I had been debugging a different OTel setting prior.
I corrected:
$ cat ~/.gemini/settings.json
{
  "security": {
    "auth": {
      "selectedType": "oauth-personal"
    }
  },
  "telemetry": {
    "enabled": true,
    "target": "gcp",
    "useCliAuth": true,
    "logPrompts": true
  },
  "ui": {
    "theme": "Shades Of Purple"
  },
  "mcpServers": {},
  "general": {
    "previewFeatures": true
  }
and then ran some more Gemini CLI updates to fix my README.md up
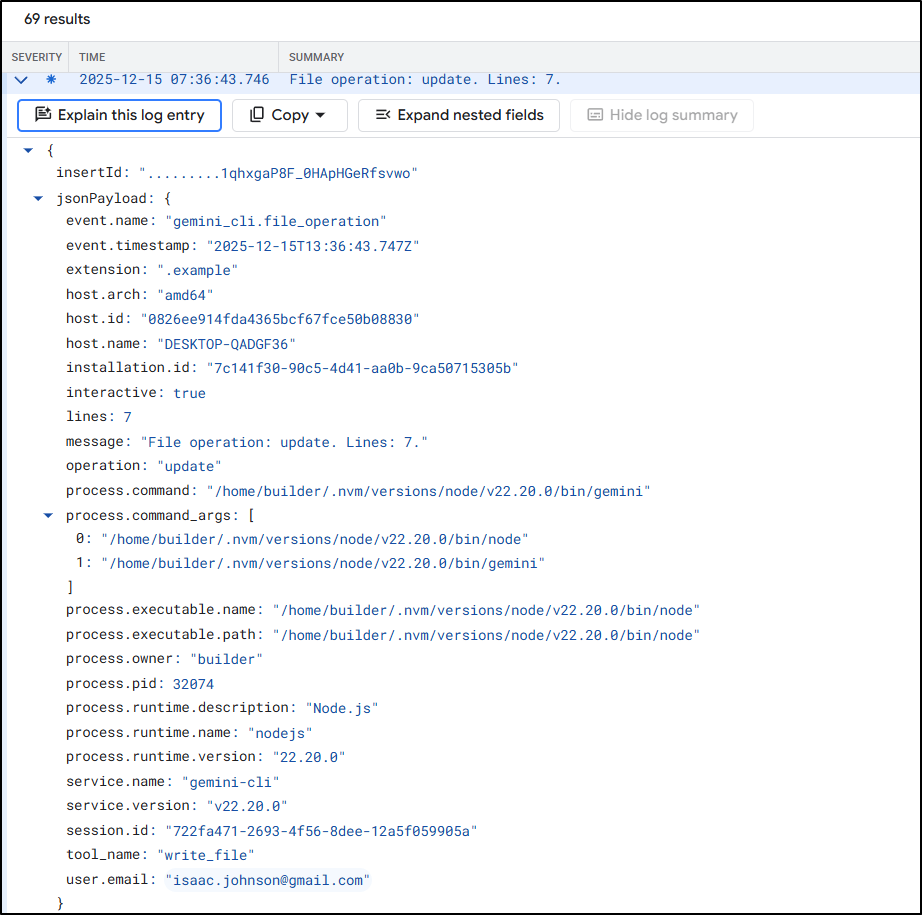
I now see lots of log lines in there
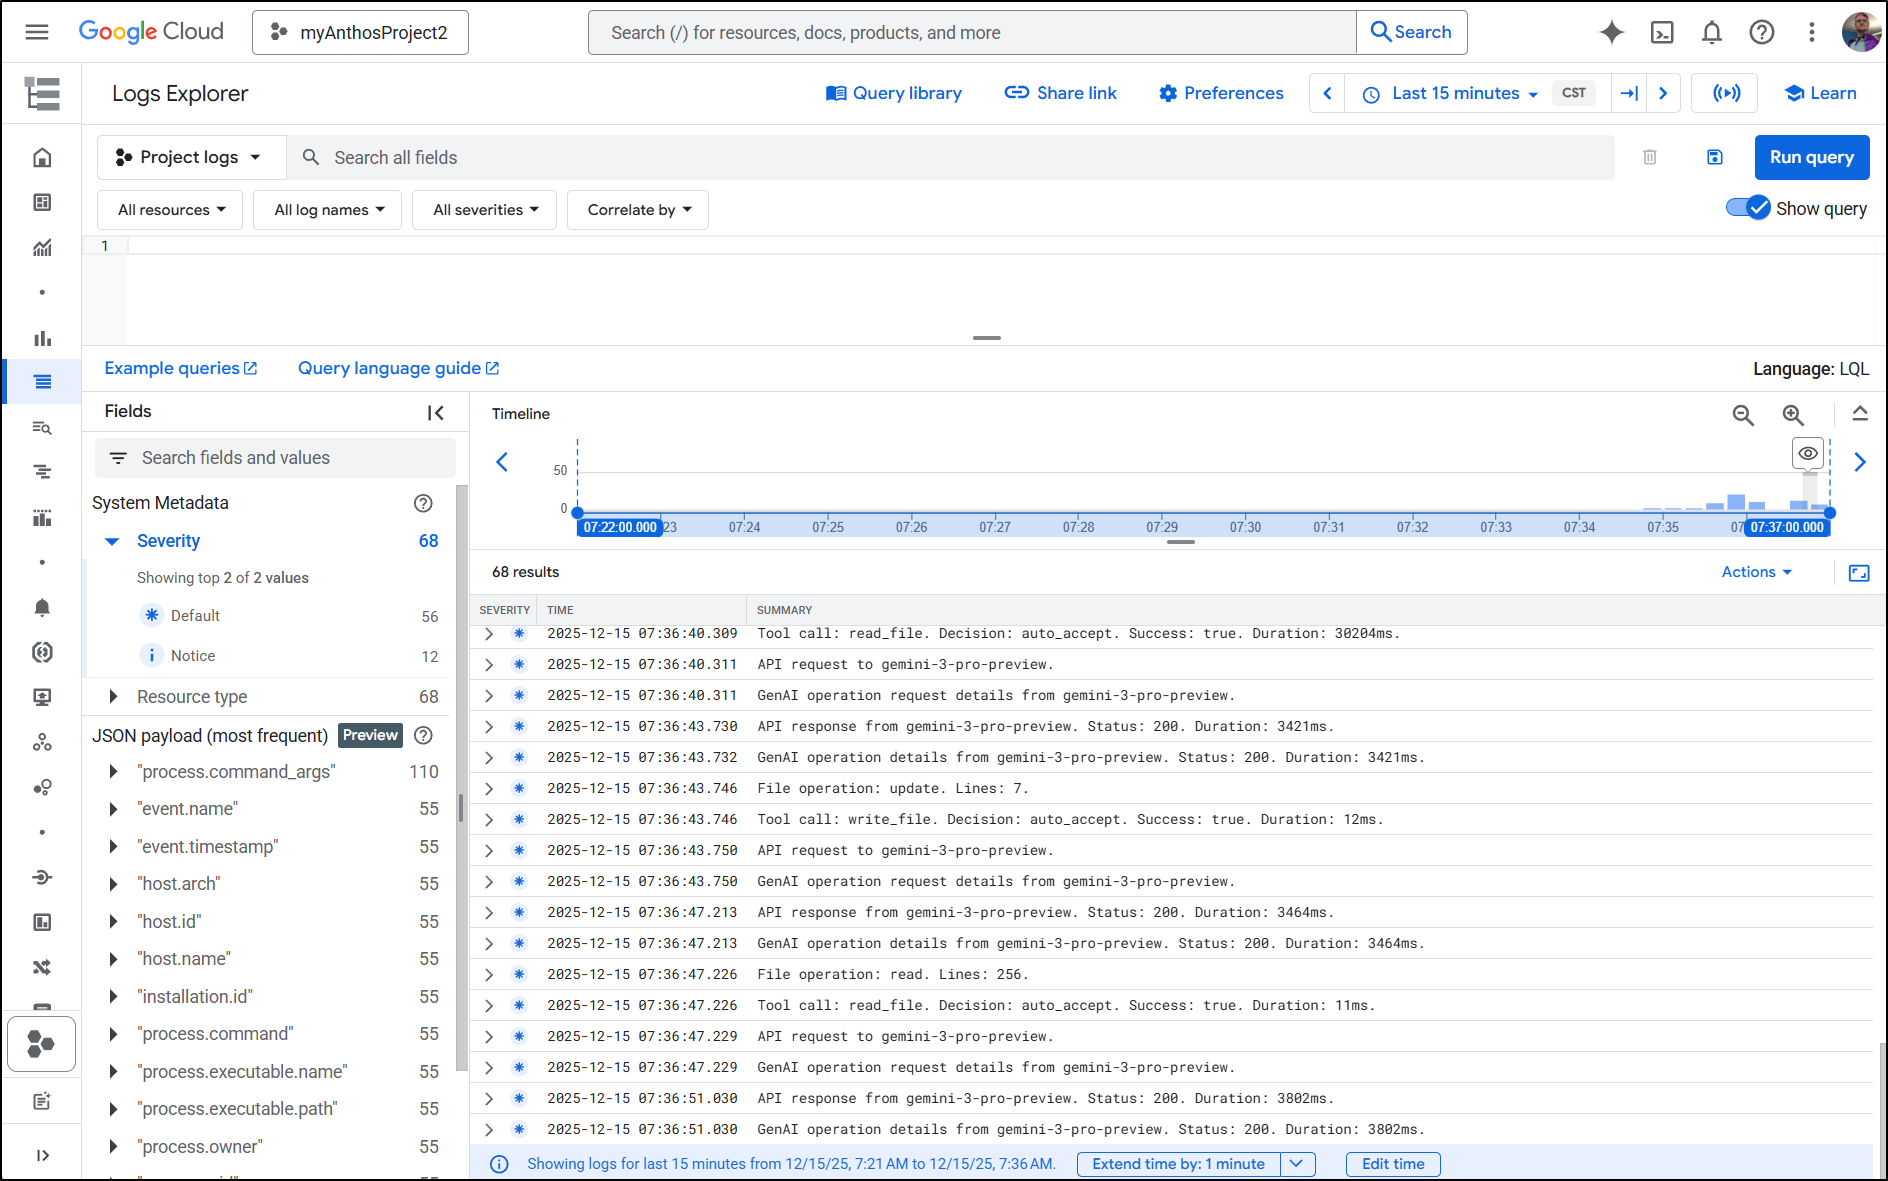
They give all sorts of details like the version of Gemini CLI, to the operation and user that was authed in
Metrics
Our Metrics should be in Observability Monitoring / Metrics explorer
Here we can see them listed under “Generic Node”. Gemini API usage as well as Gemini Code Assist live under “Gemini for Google Cloud Instance”, not Gemini CLI
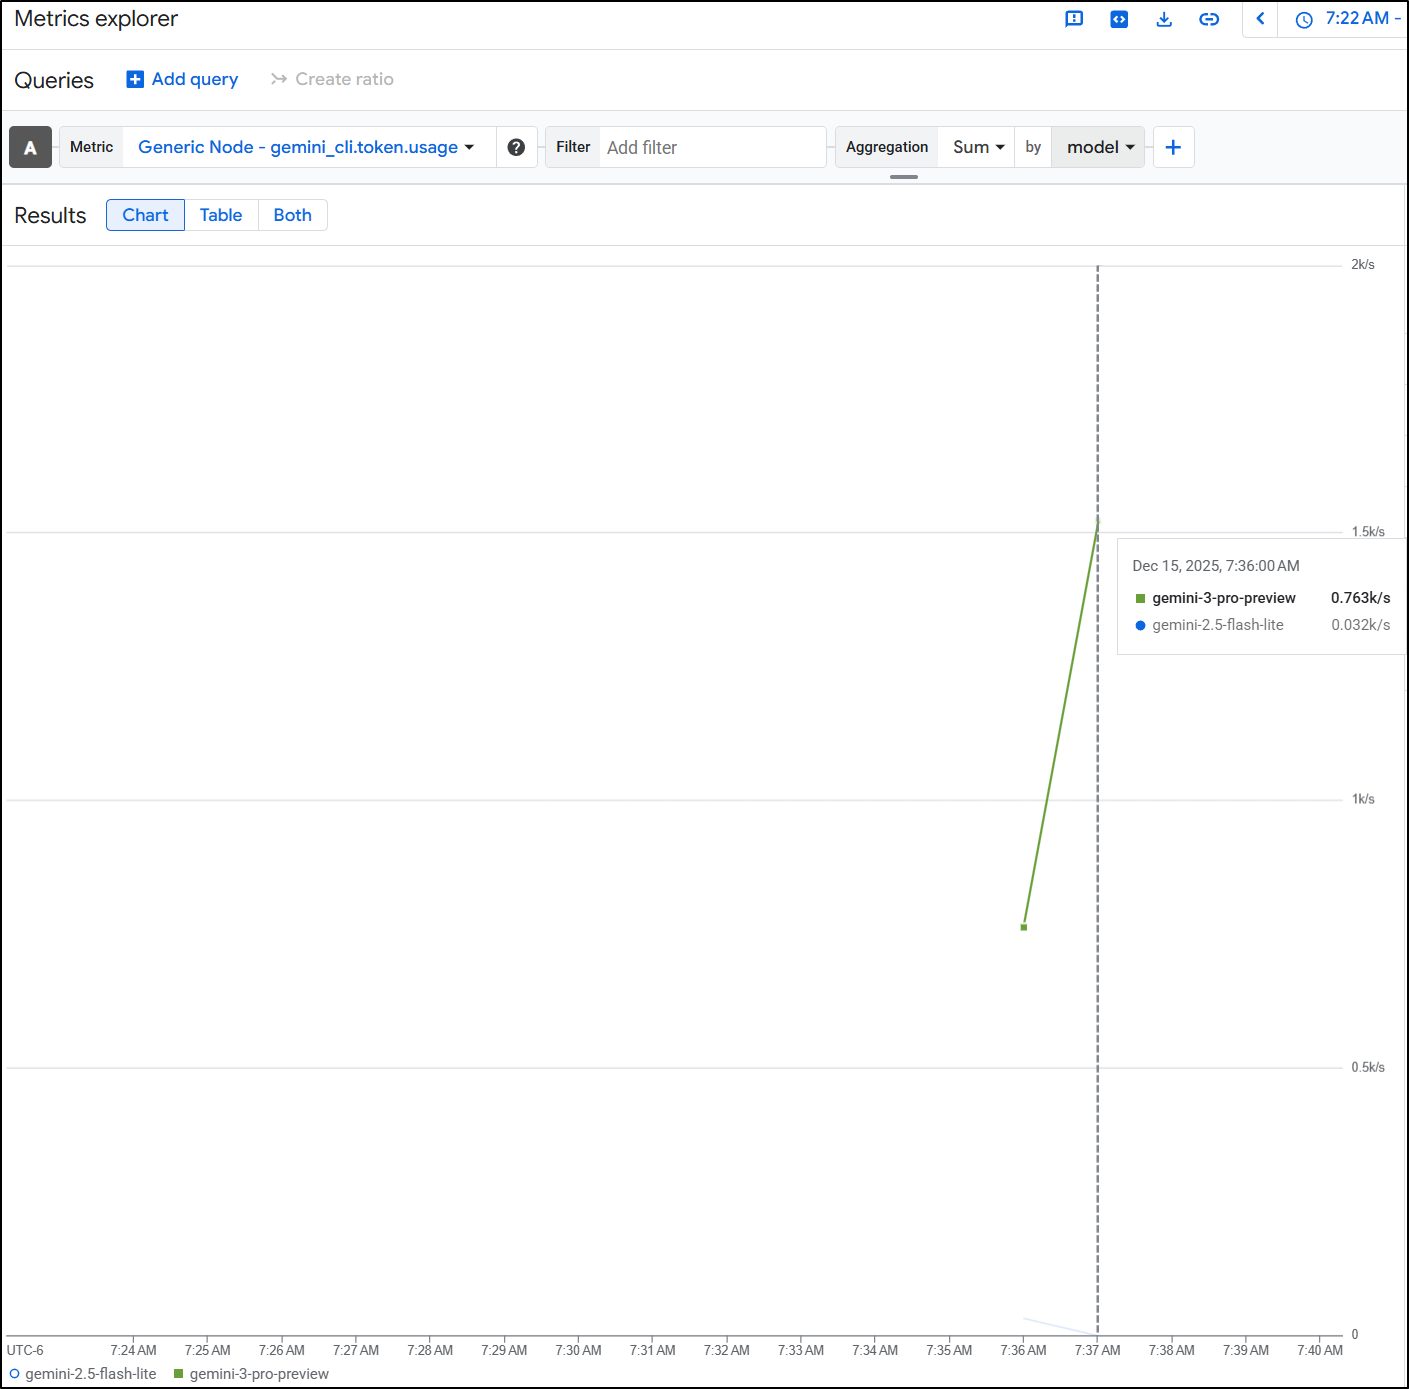
One thing I like here is i can, of course see token usage
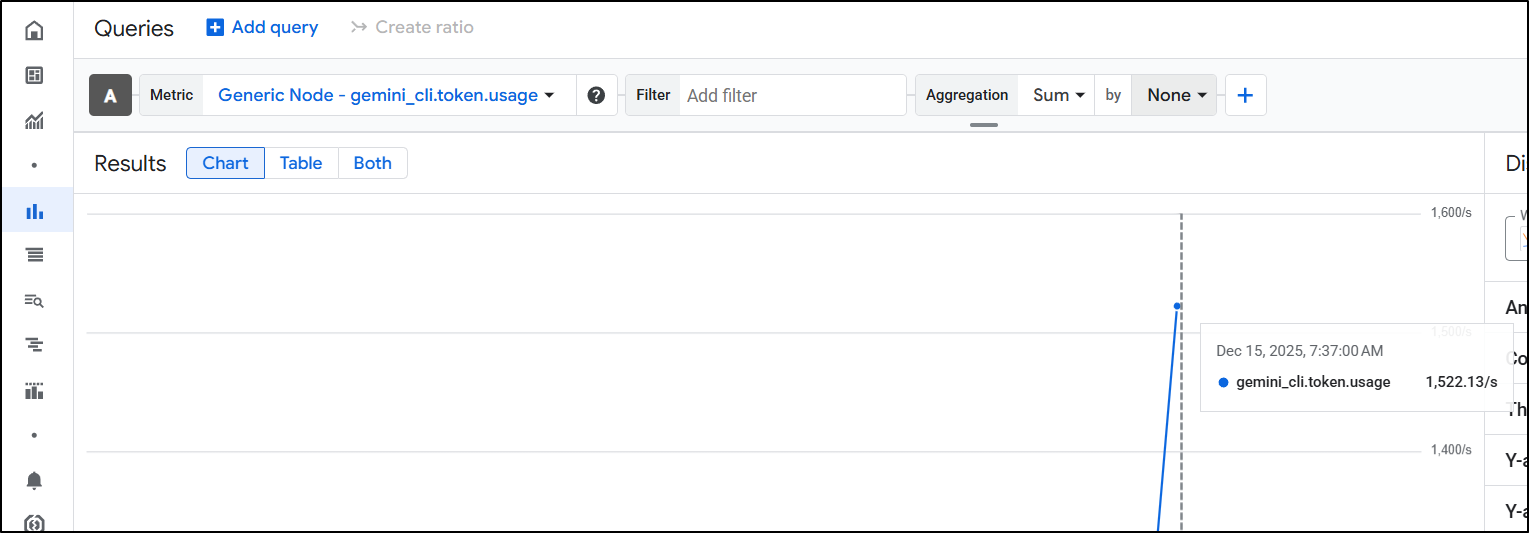
But I can further break it down by Model
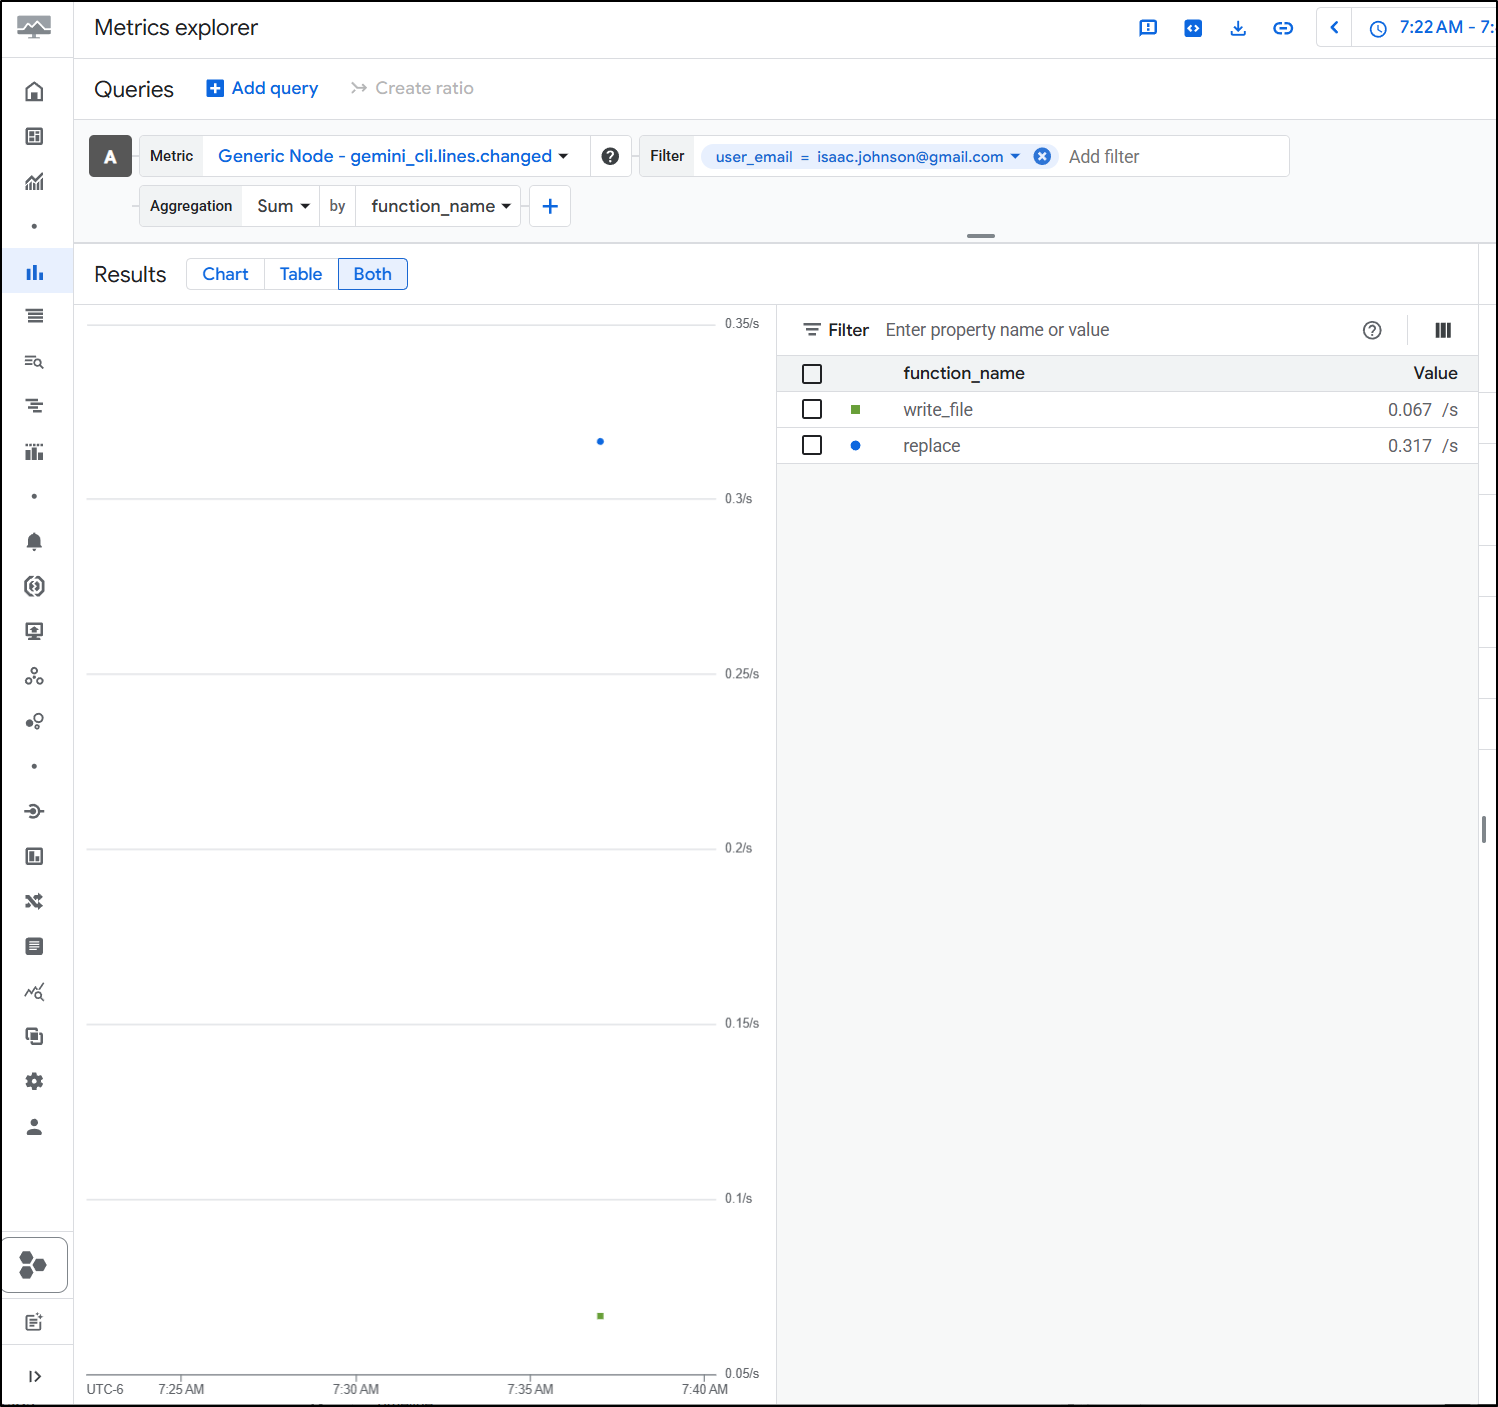
The factors get kind of wild. I can see a Sum of lines changed but then break it down by function. Maybe I want to know what a given user is doing with Gemini CLI. Are they writing files or just reading them?
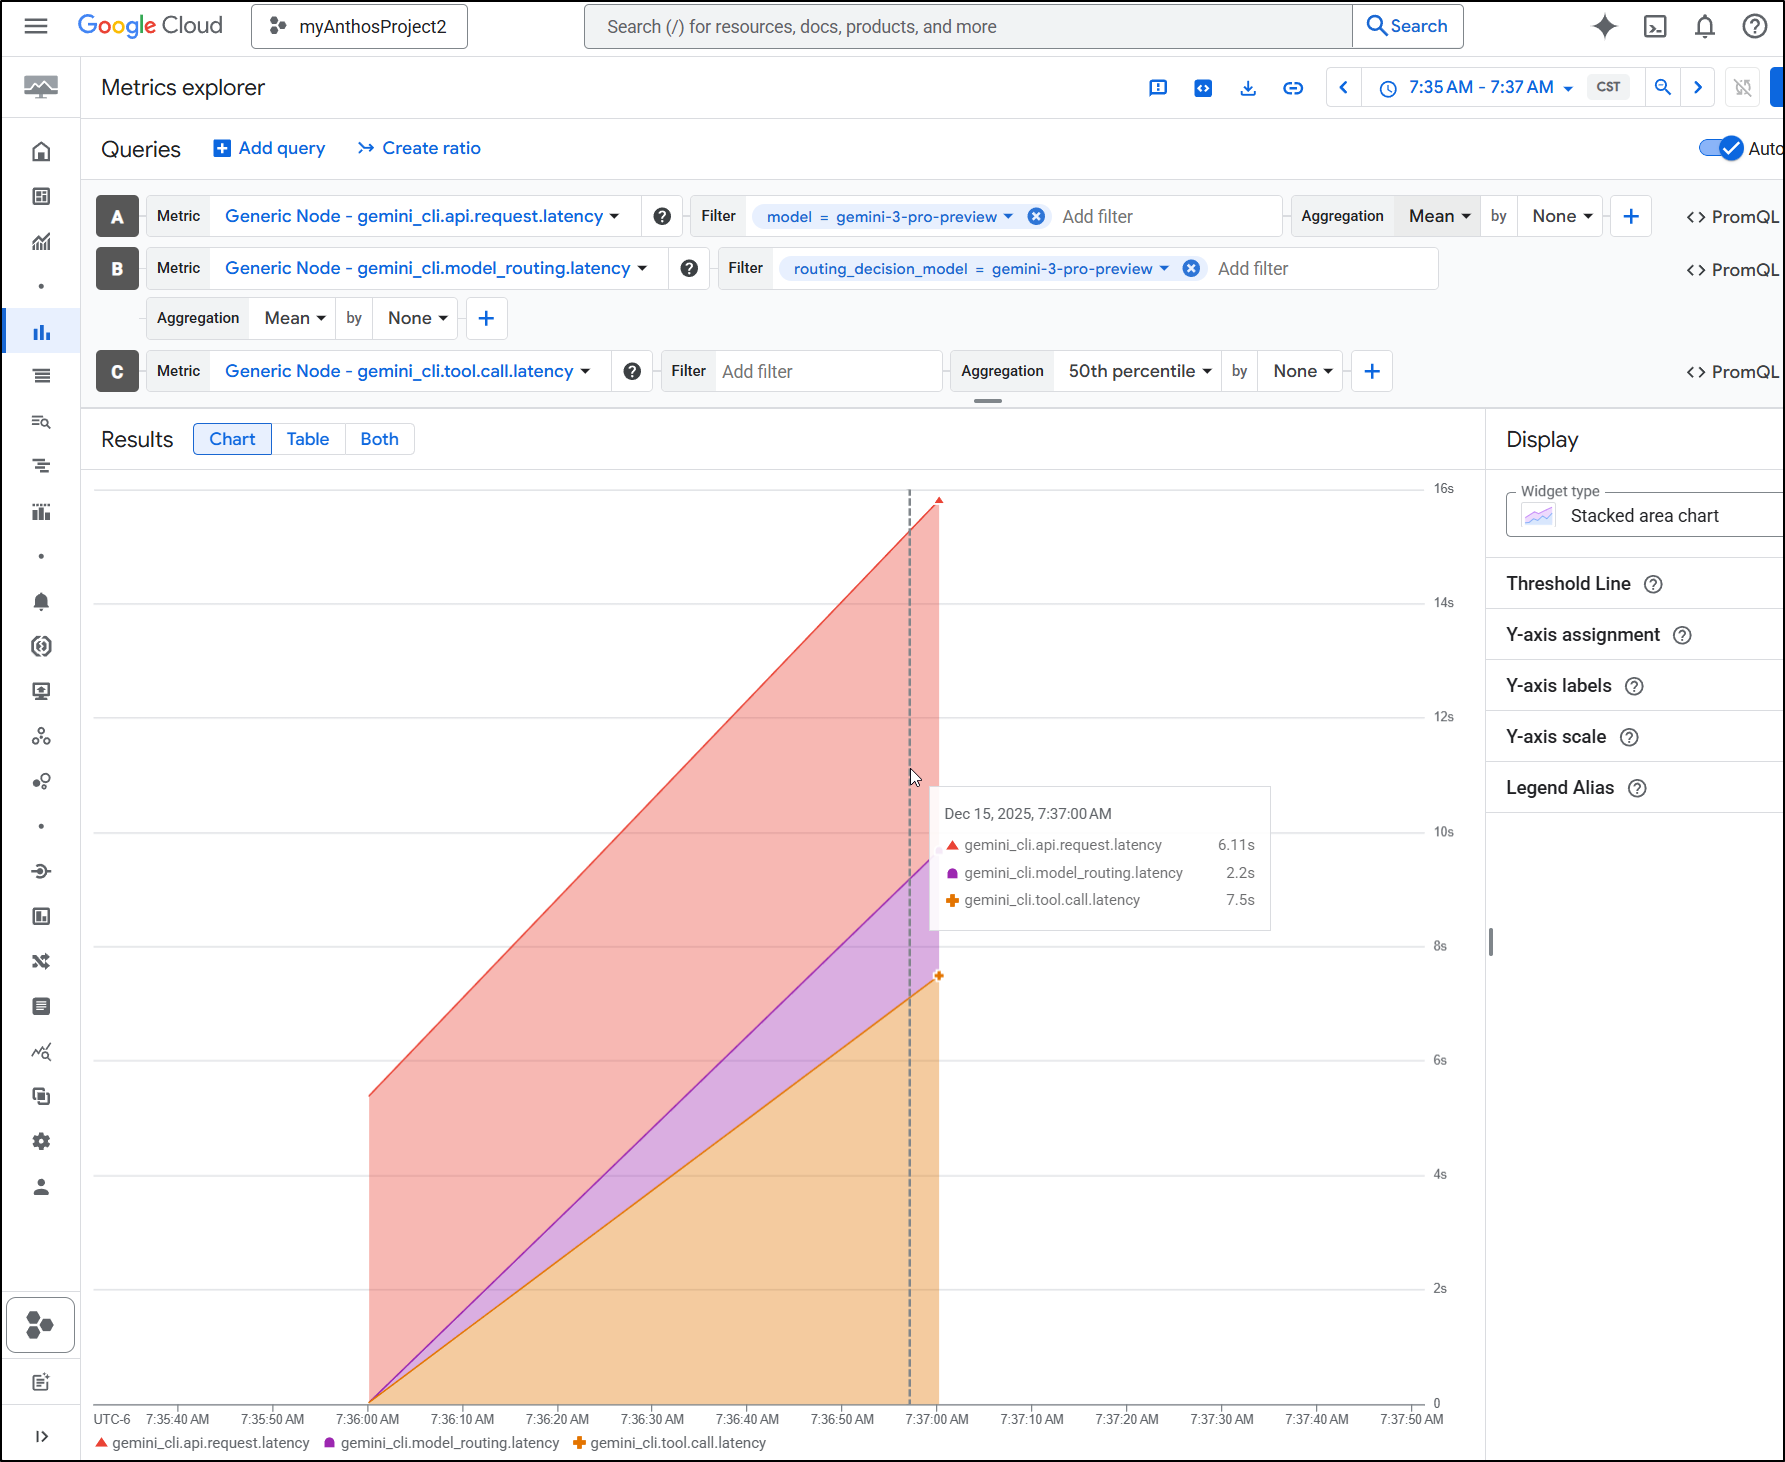
Perhaps I am trying to see how performant Gemini CLI is for a given user. I can lookup latency metrics
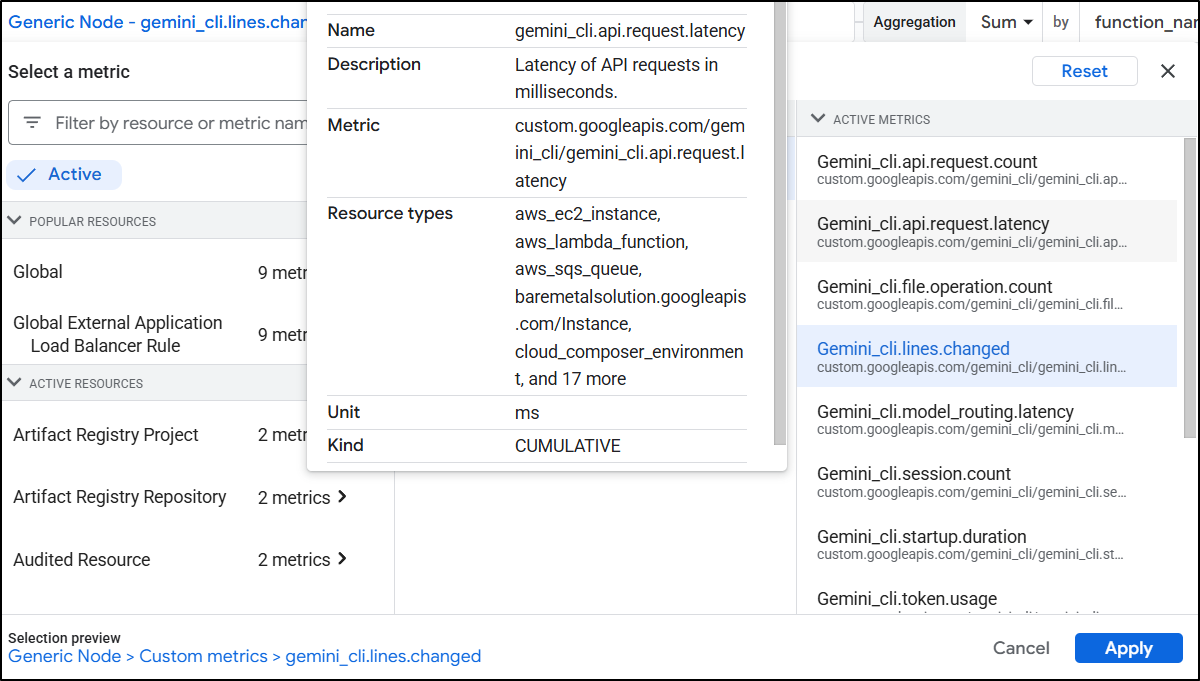
I can then break them down over request, routing and call
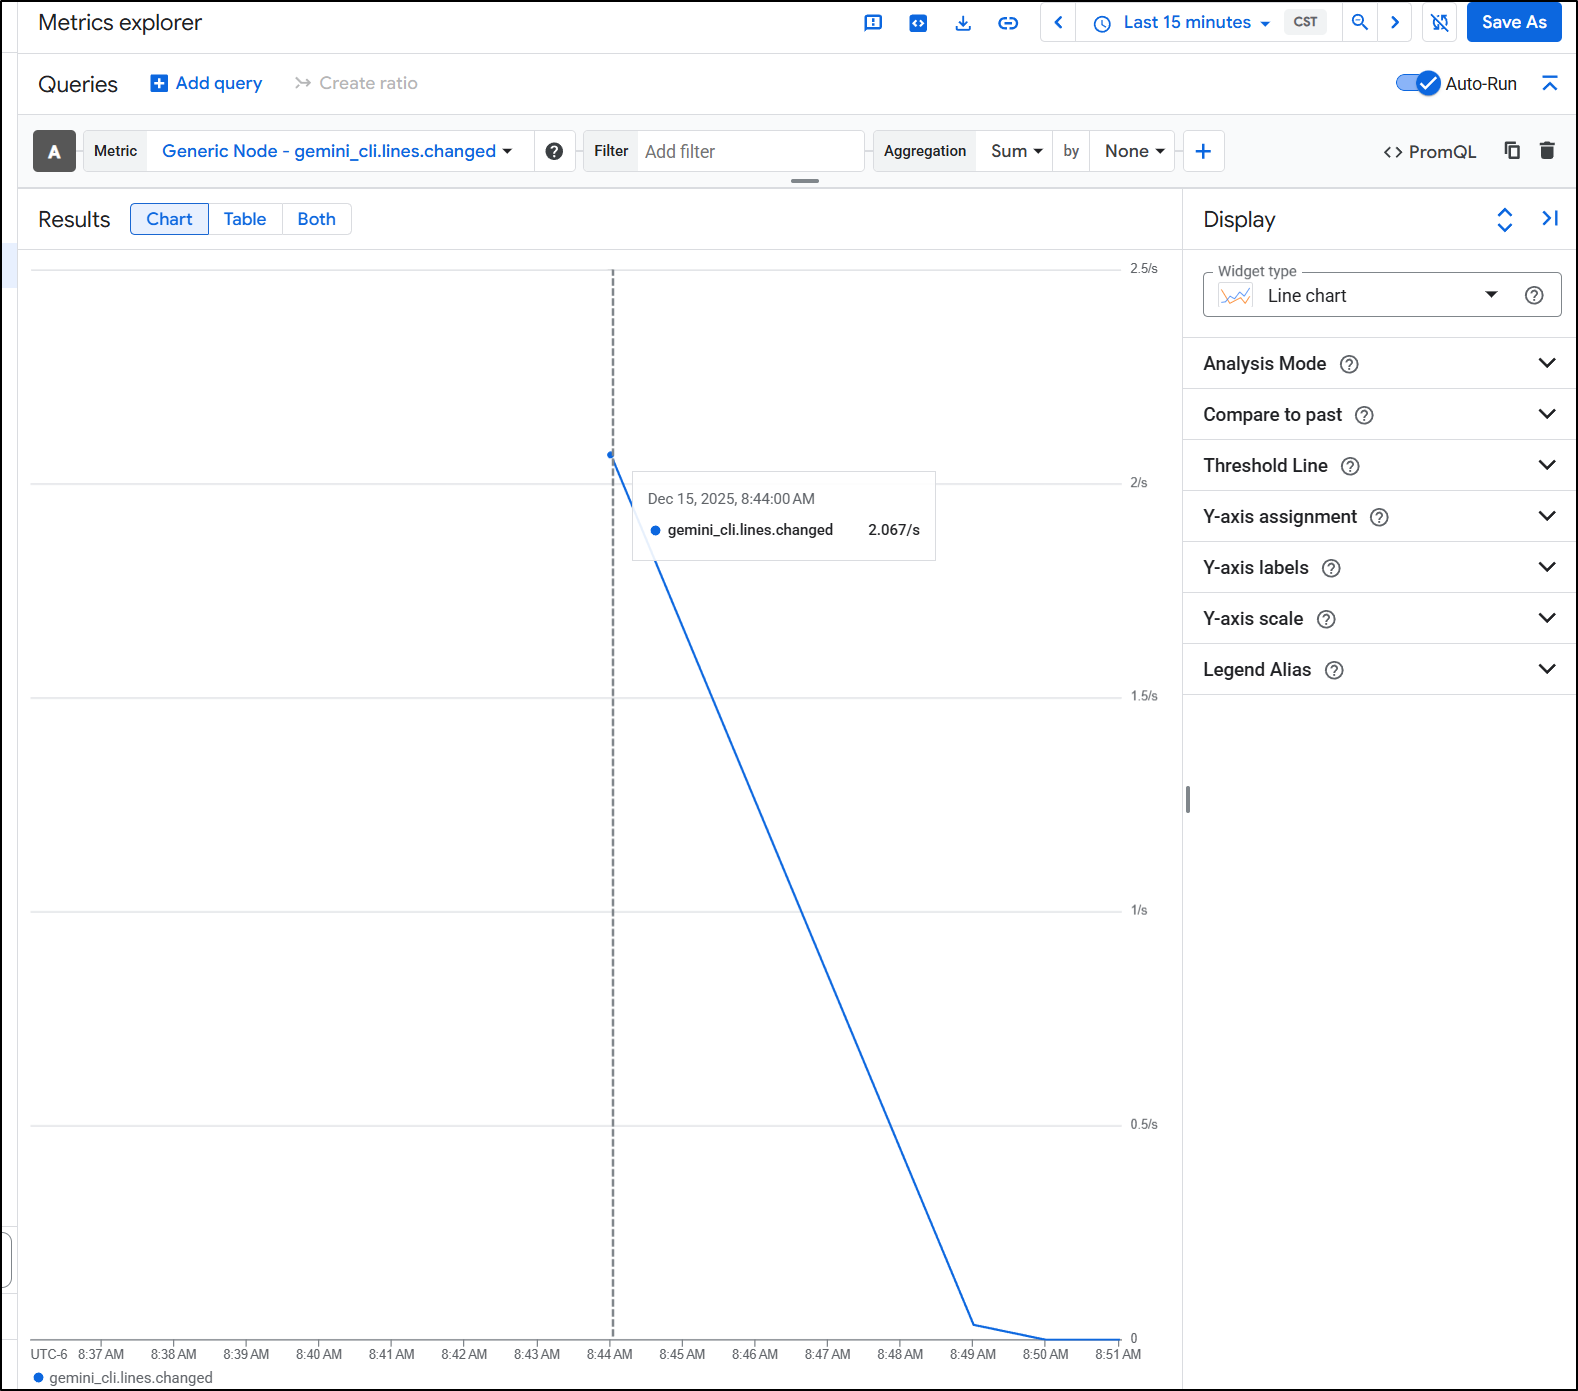
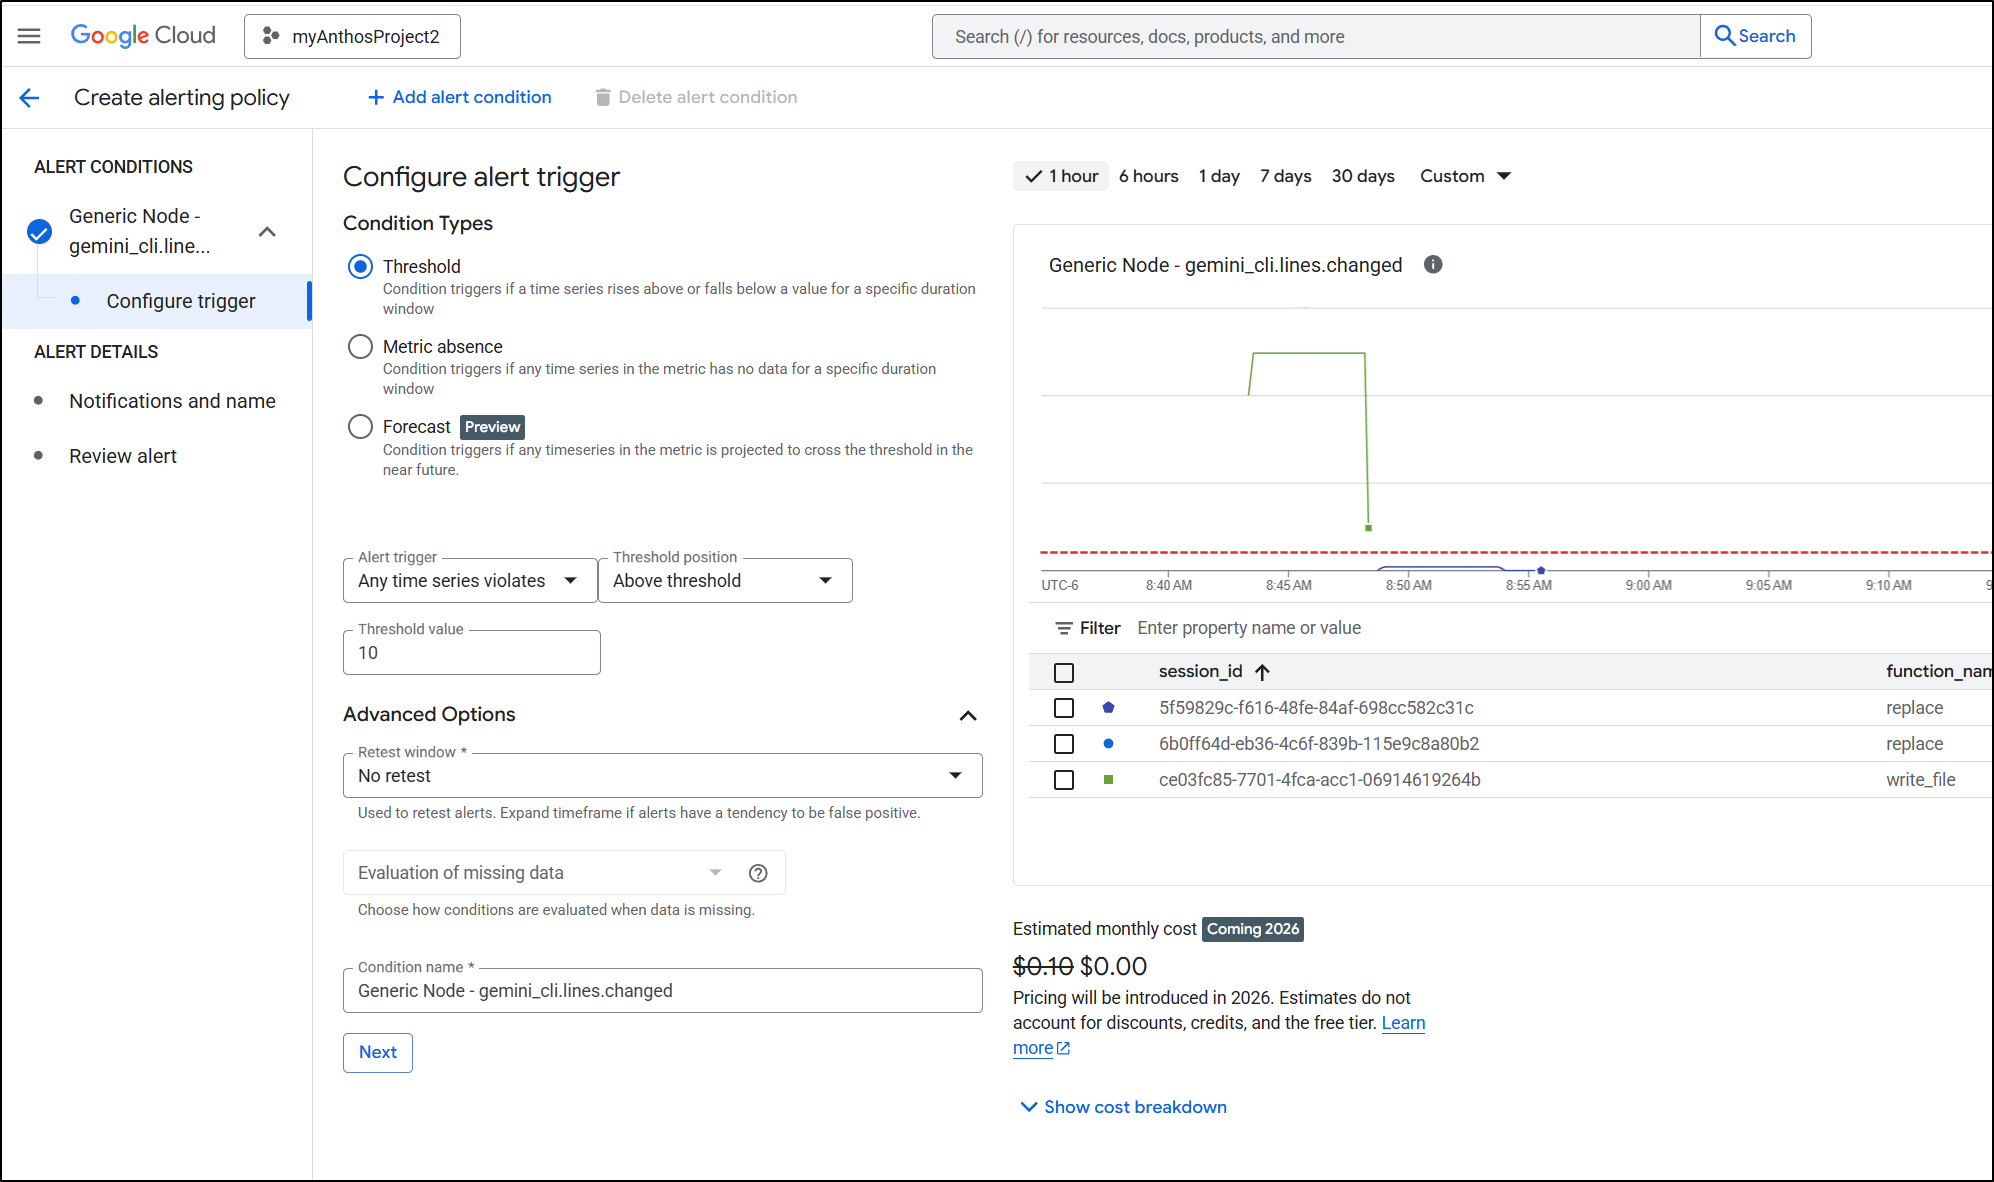
I can also see lines changed. This is a bit of a funny graph (I’m still tinkering with it). But here we can see Gemini CLI changed two lines around 8:44am
I can also compare Gen AI token usage to Gemini CLI token usage
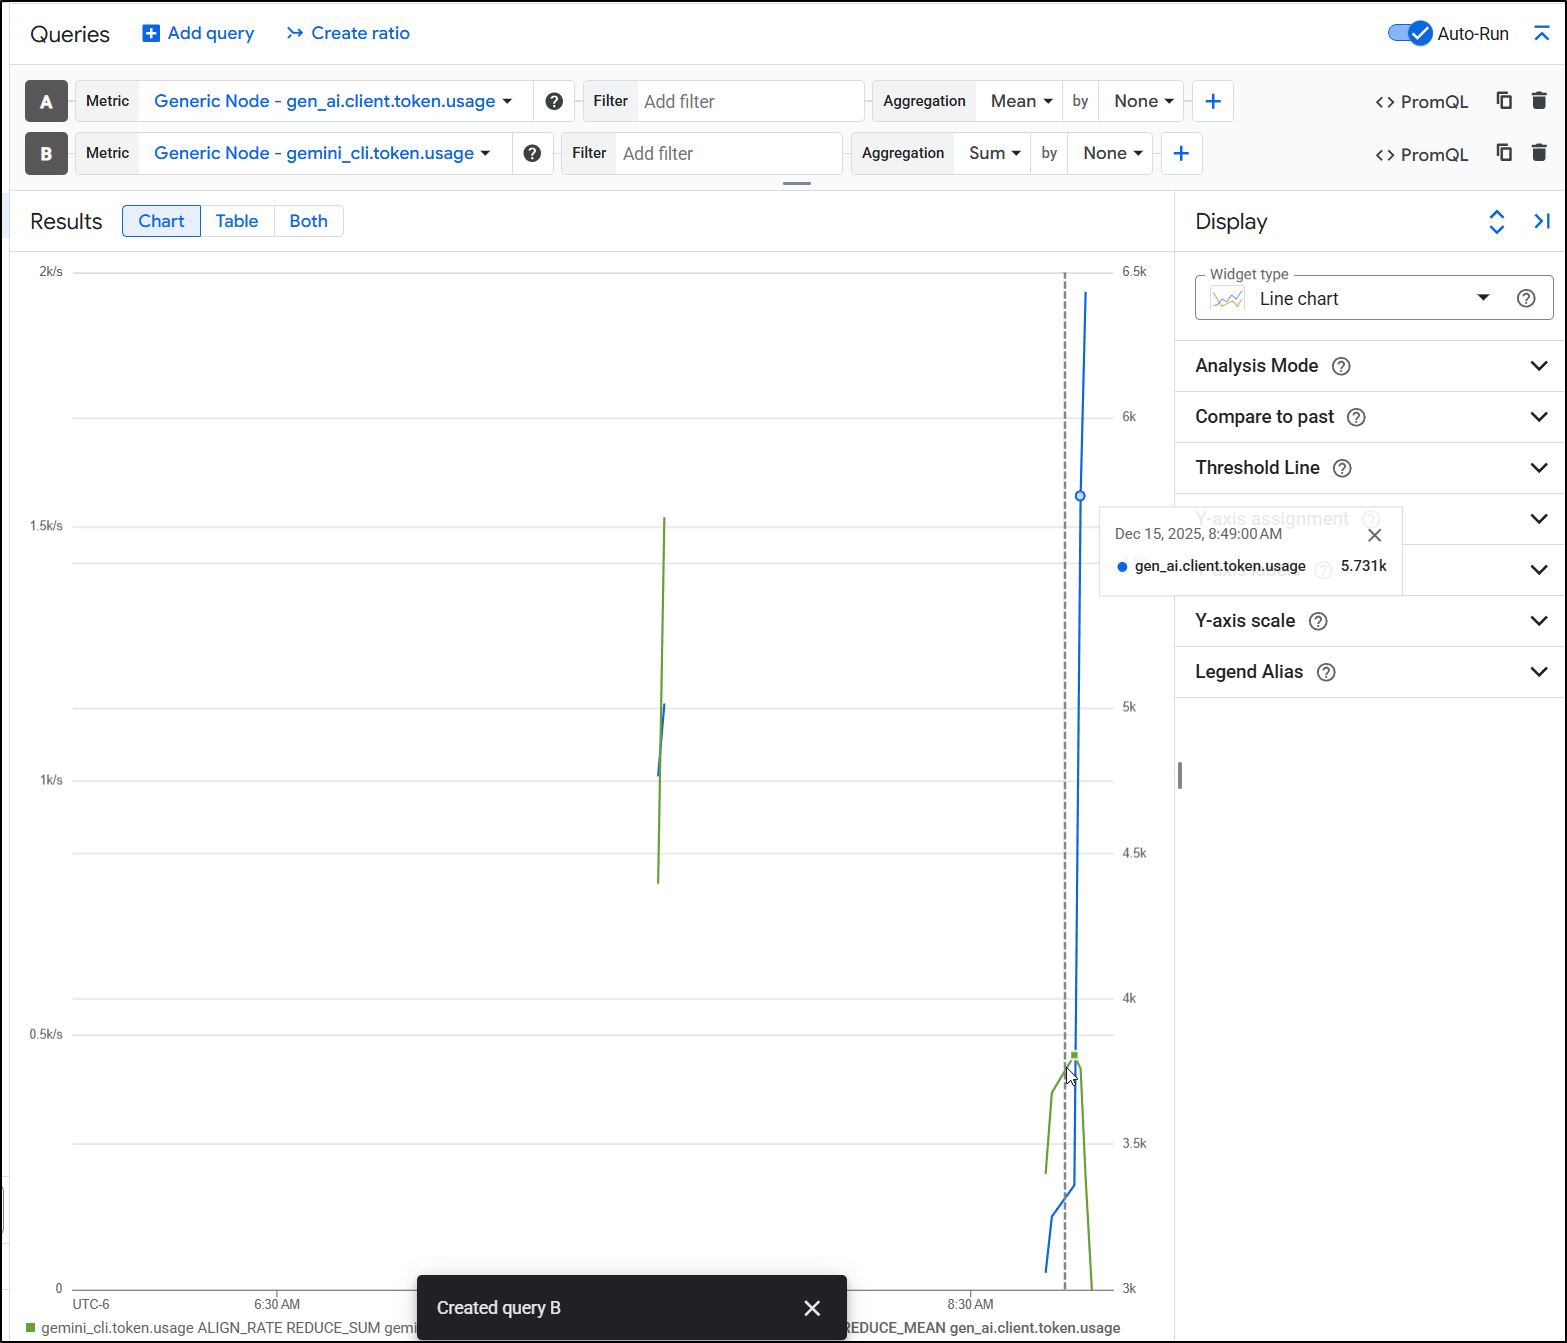
At first I was through by the GenAI usage being much higher, but then realized images take a lot and I used my Gemini API key with NanoBanana to make those diagram images.
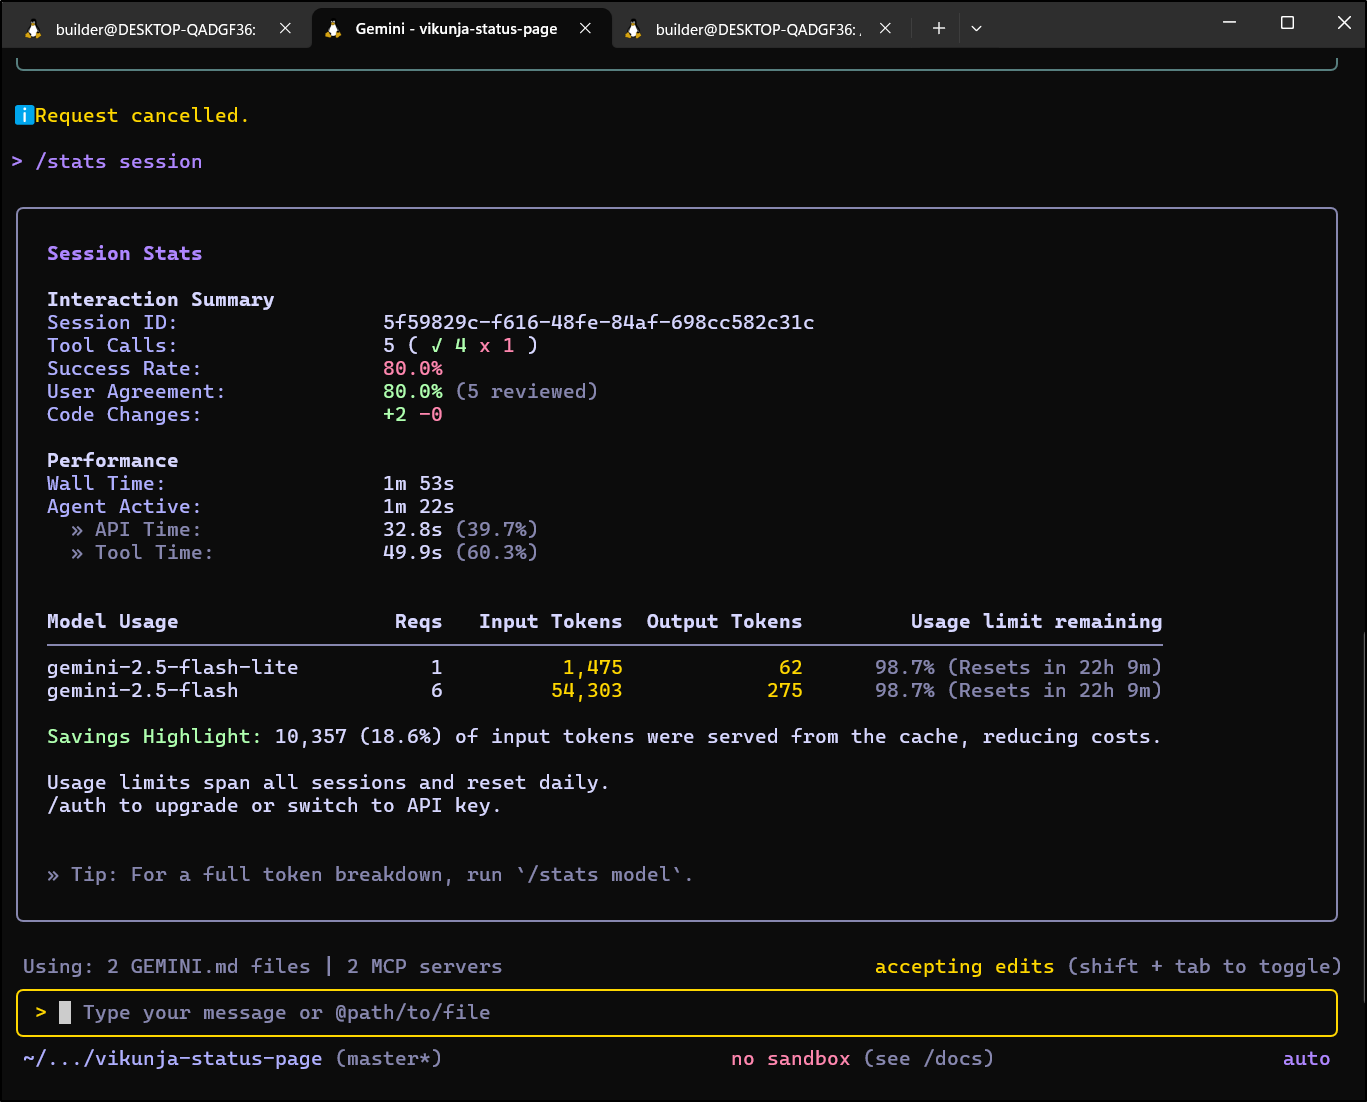
But if we wanted to see “live” results, there is a “/stats” feature we can use in Gemini CLI
Model Stats
Something we can now do without exiting Gemini CLI is see our model usage. If we are cranking away and get a bit worried, but don’t want to end our session, we can use /stats session to get a live update
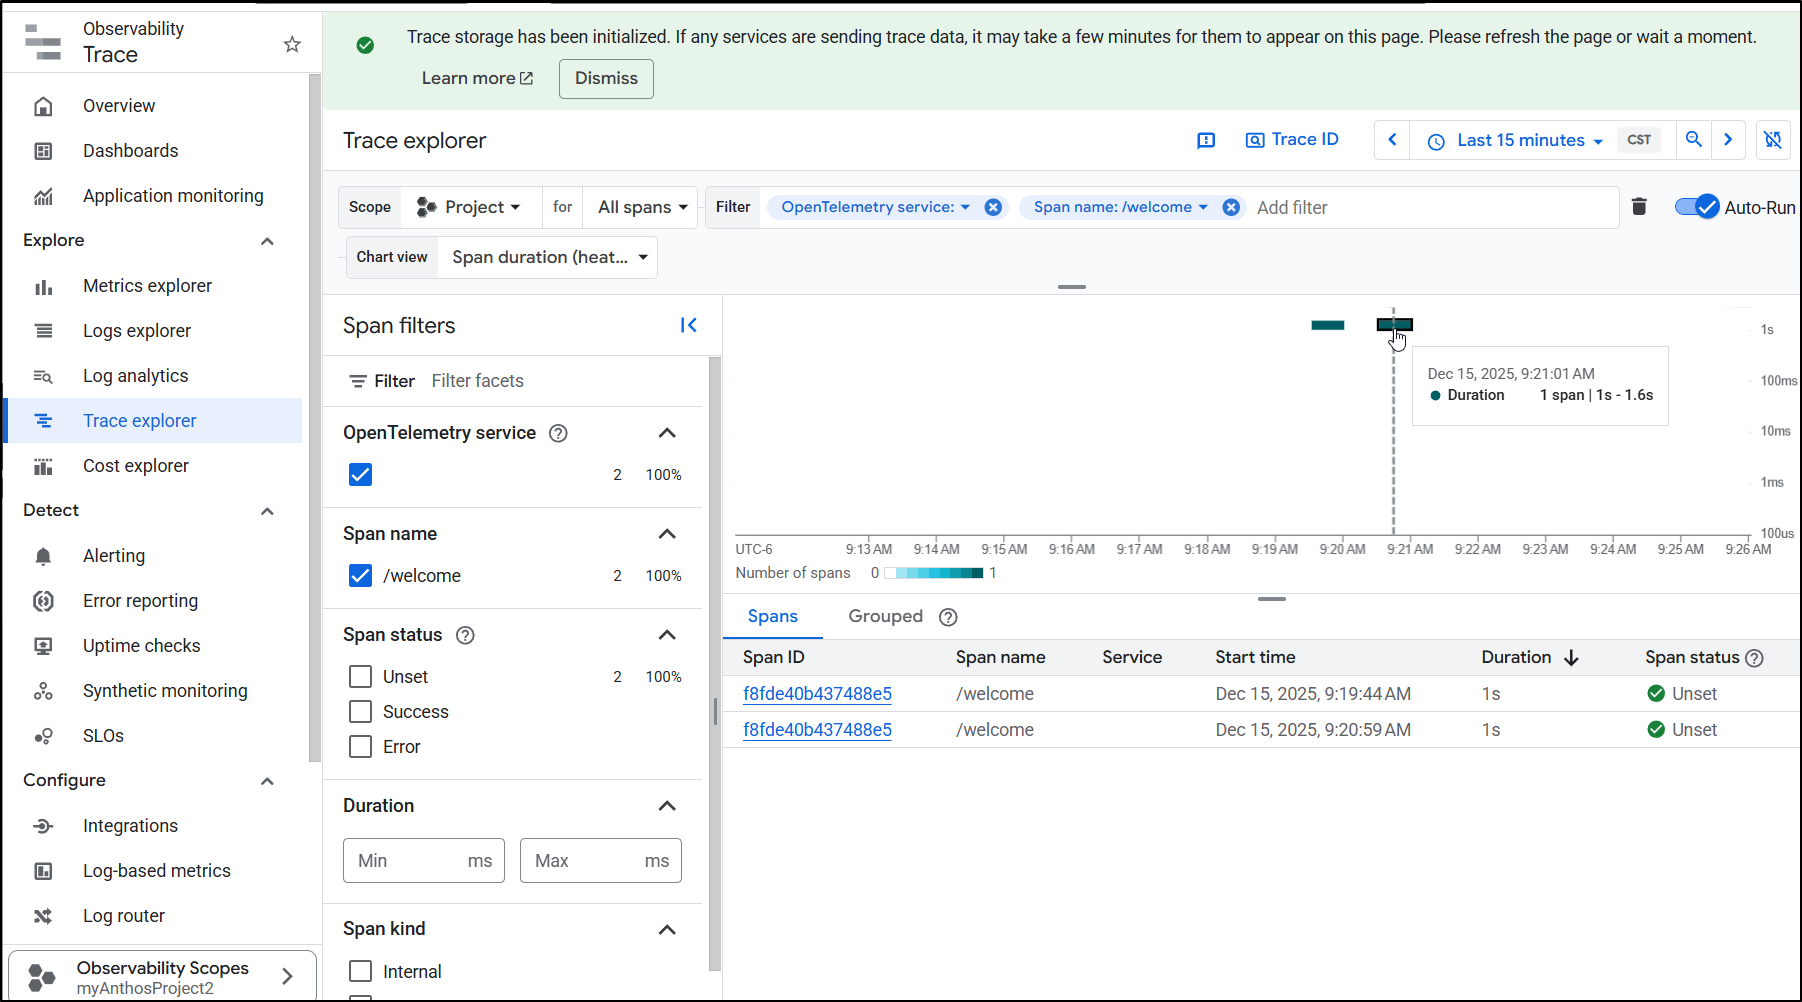
Traces
If we have Trace storage enabled, we can get some very basic traces. I only saw the “/welcome” endpoint but at least I did get a trace/span
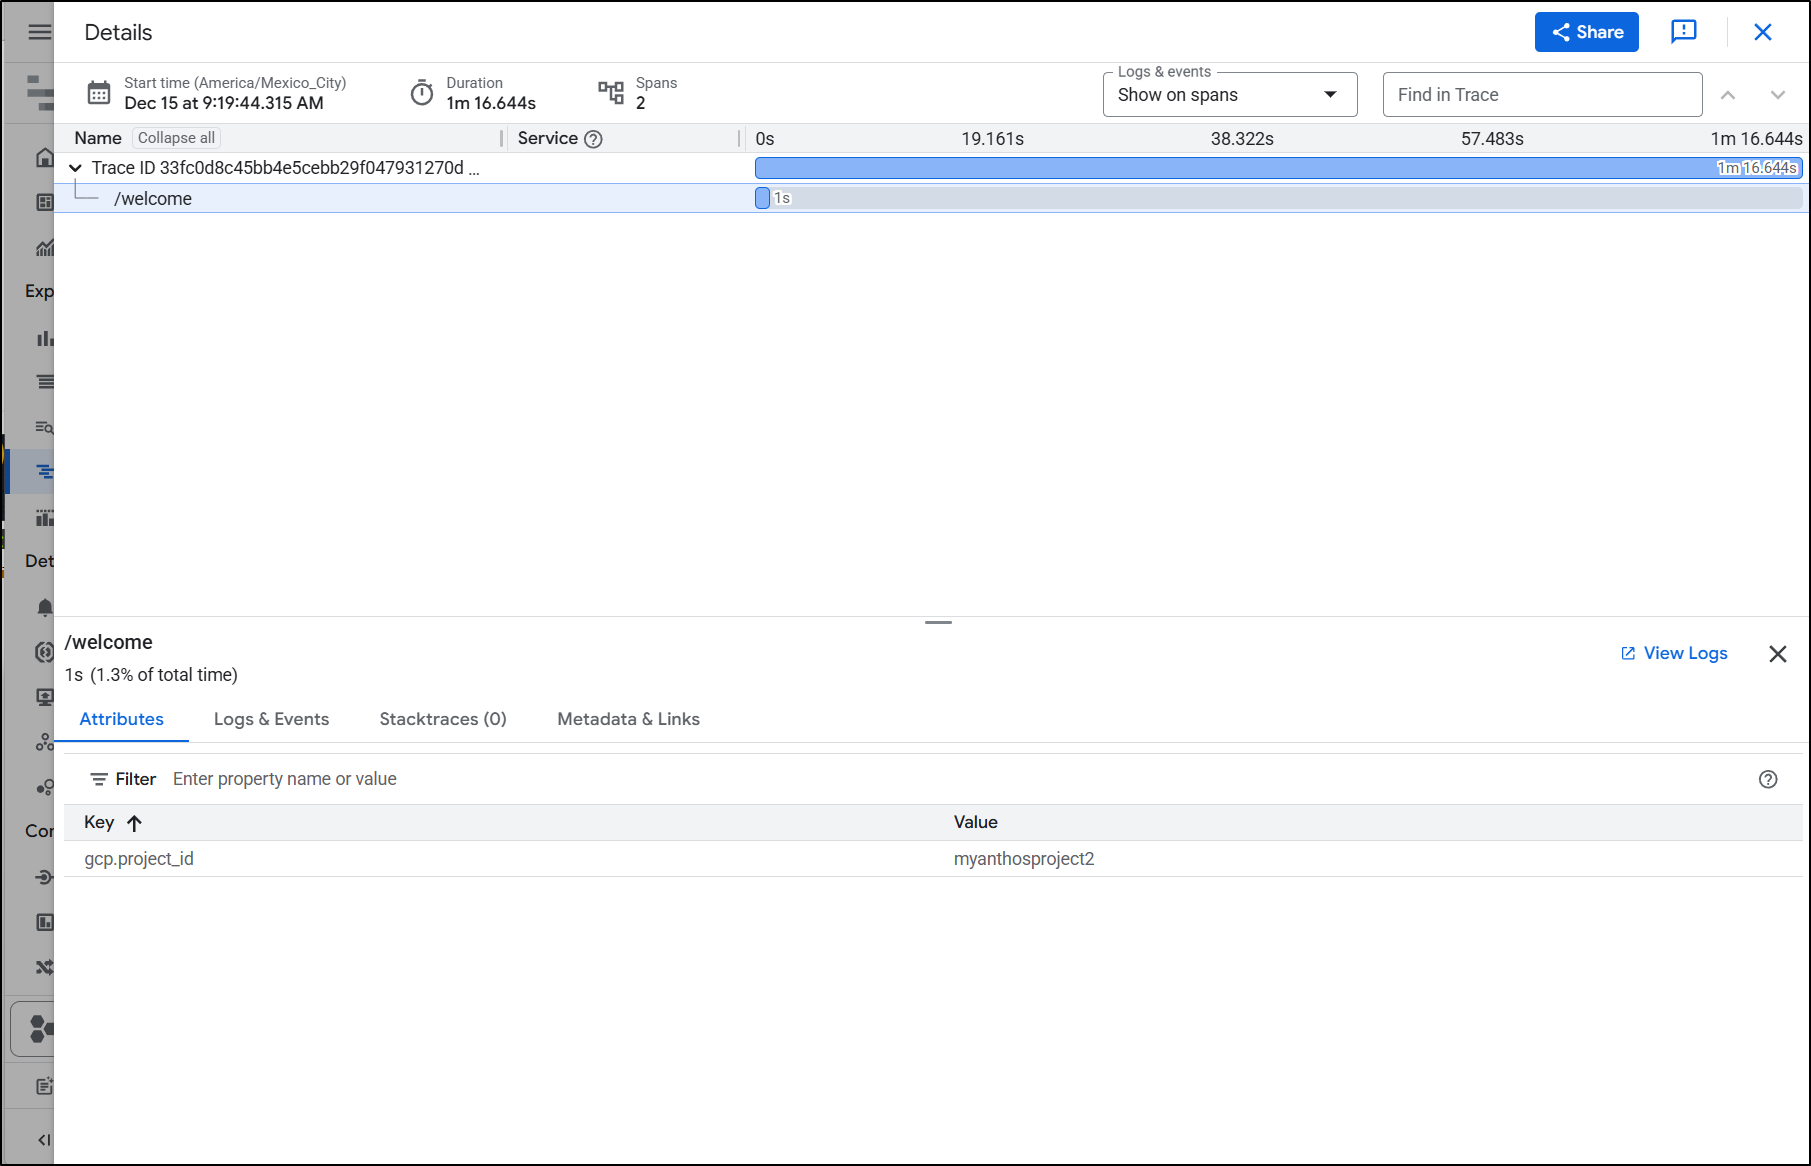
And we can see some basic details
Alerts
One of the features worth mentioning is creating Alerting Policies so we can know when things go awry.
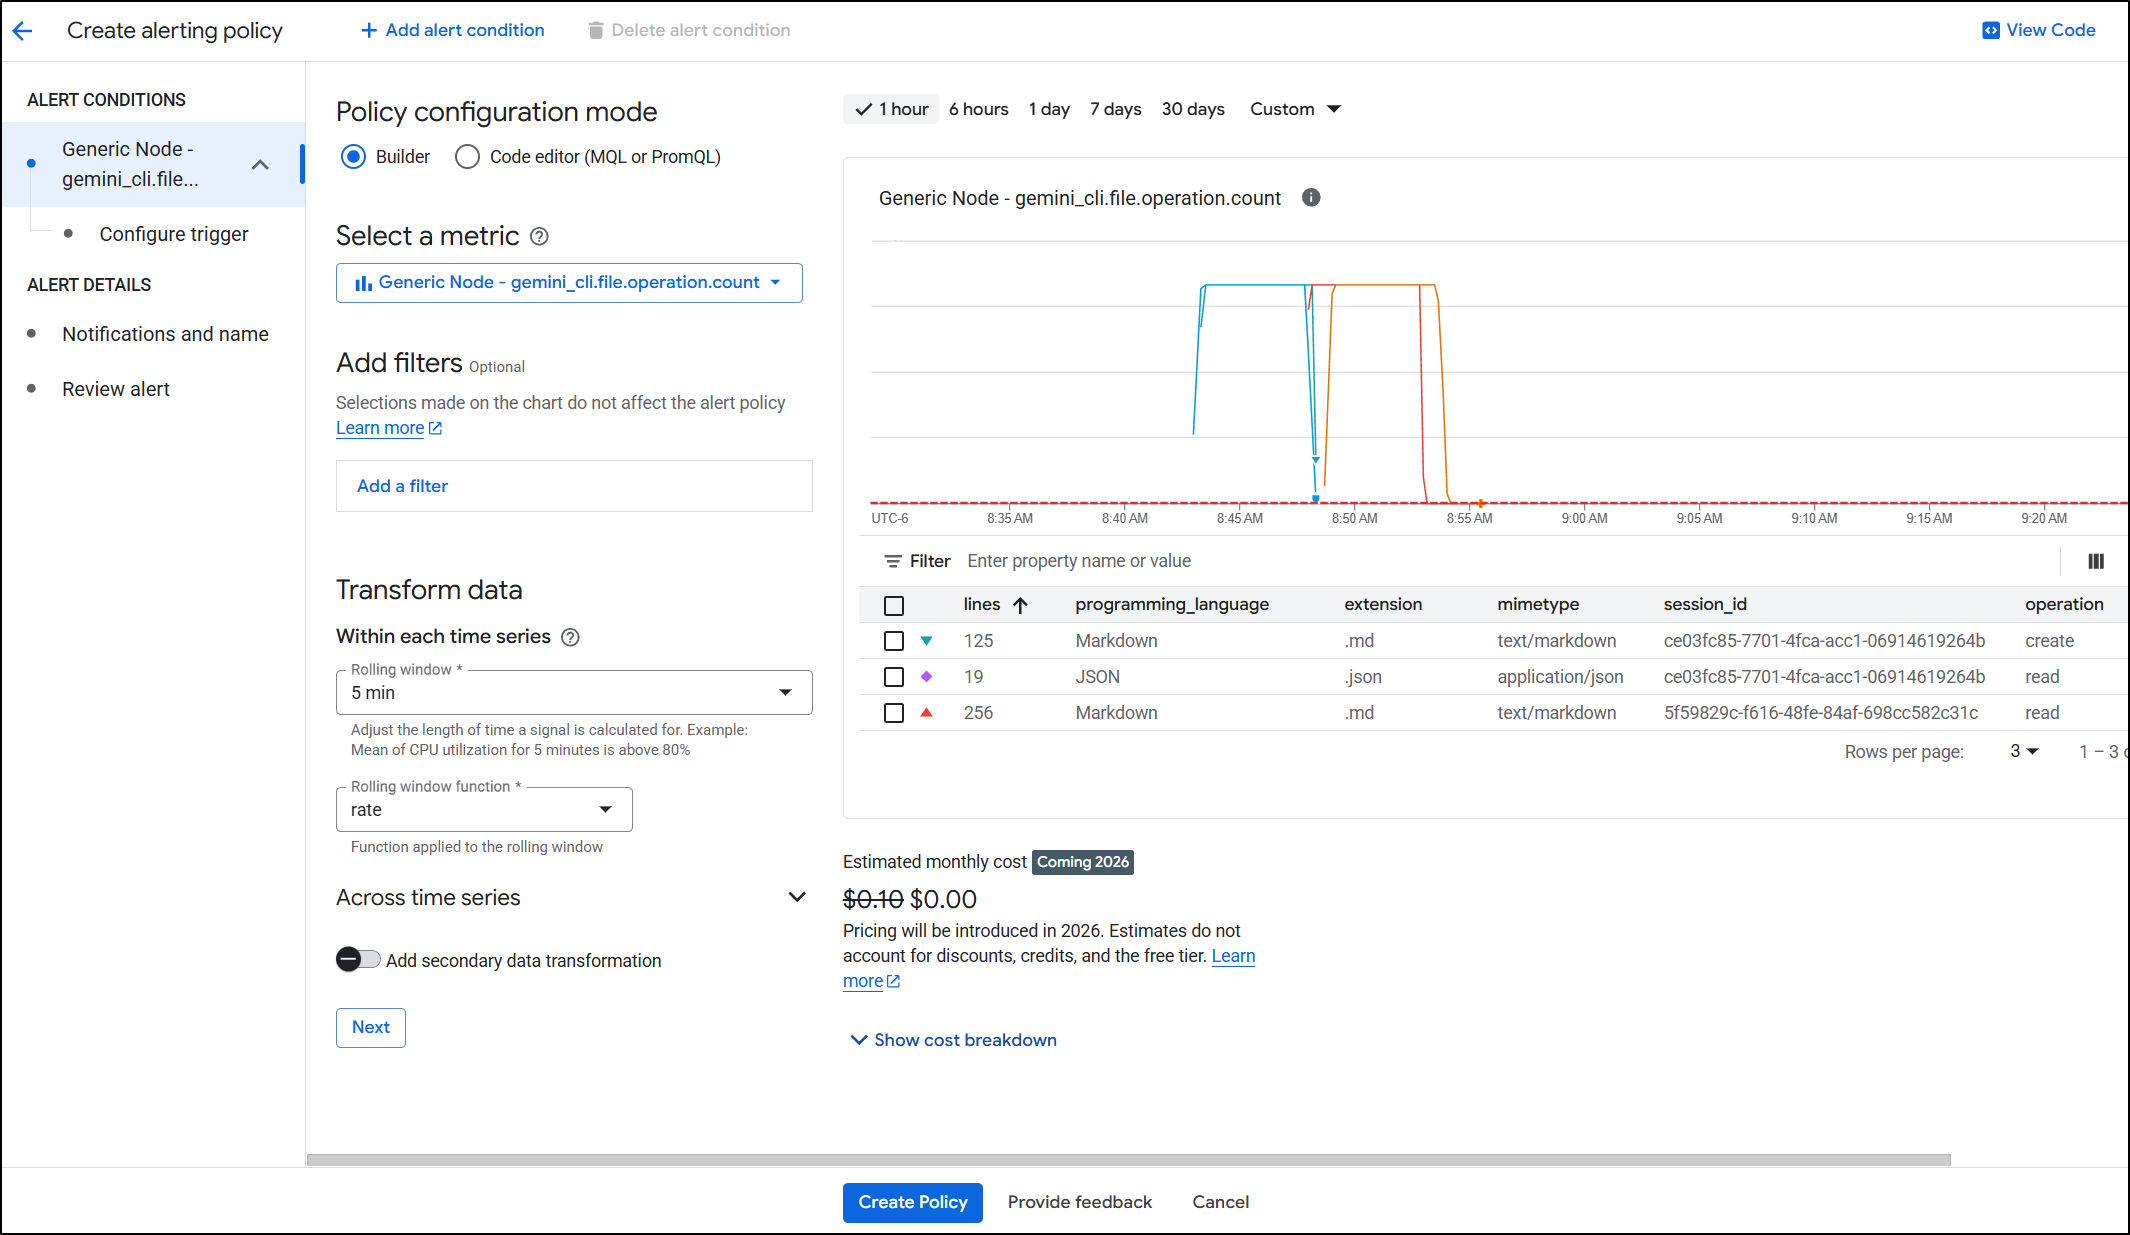
Perhaps I want to catch people spiking requests
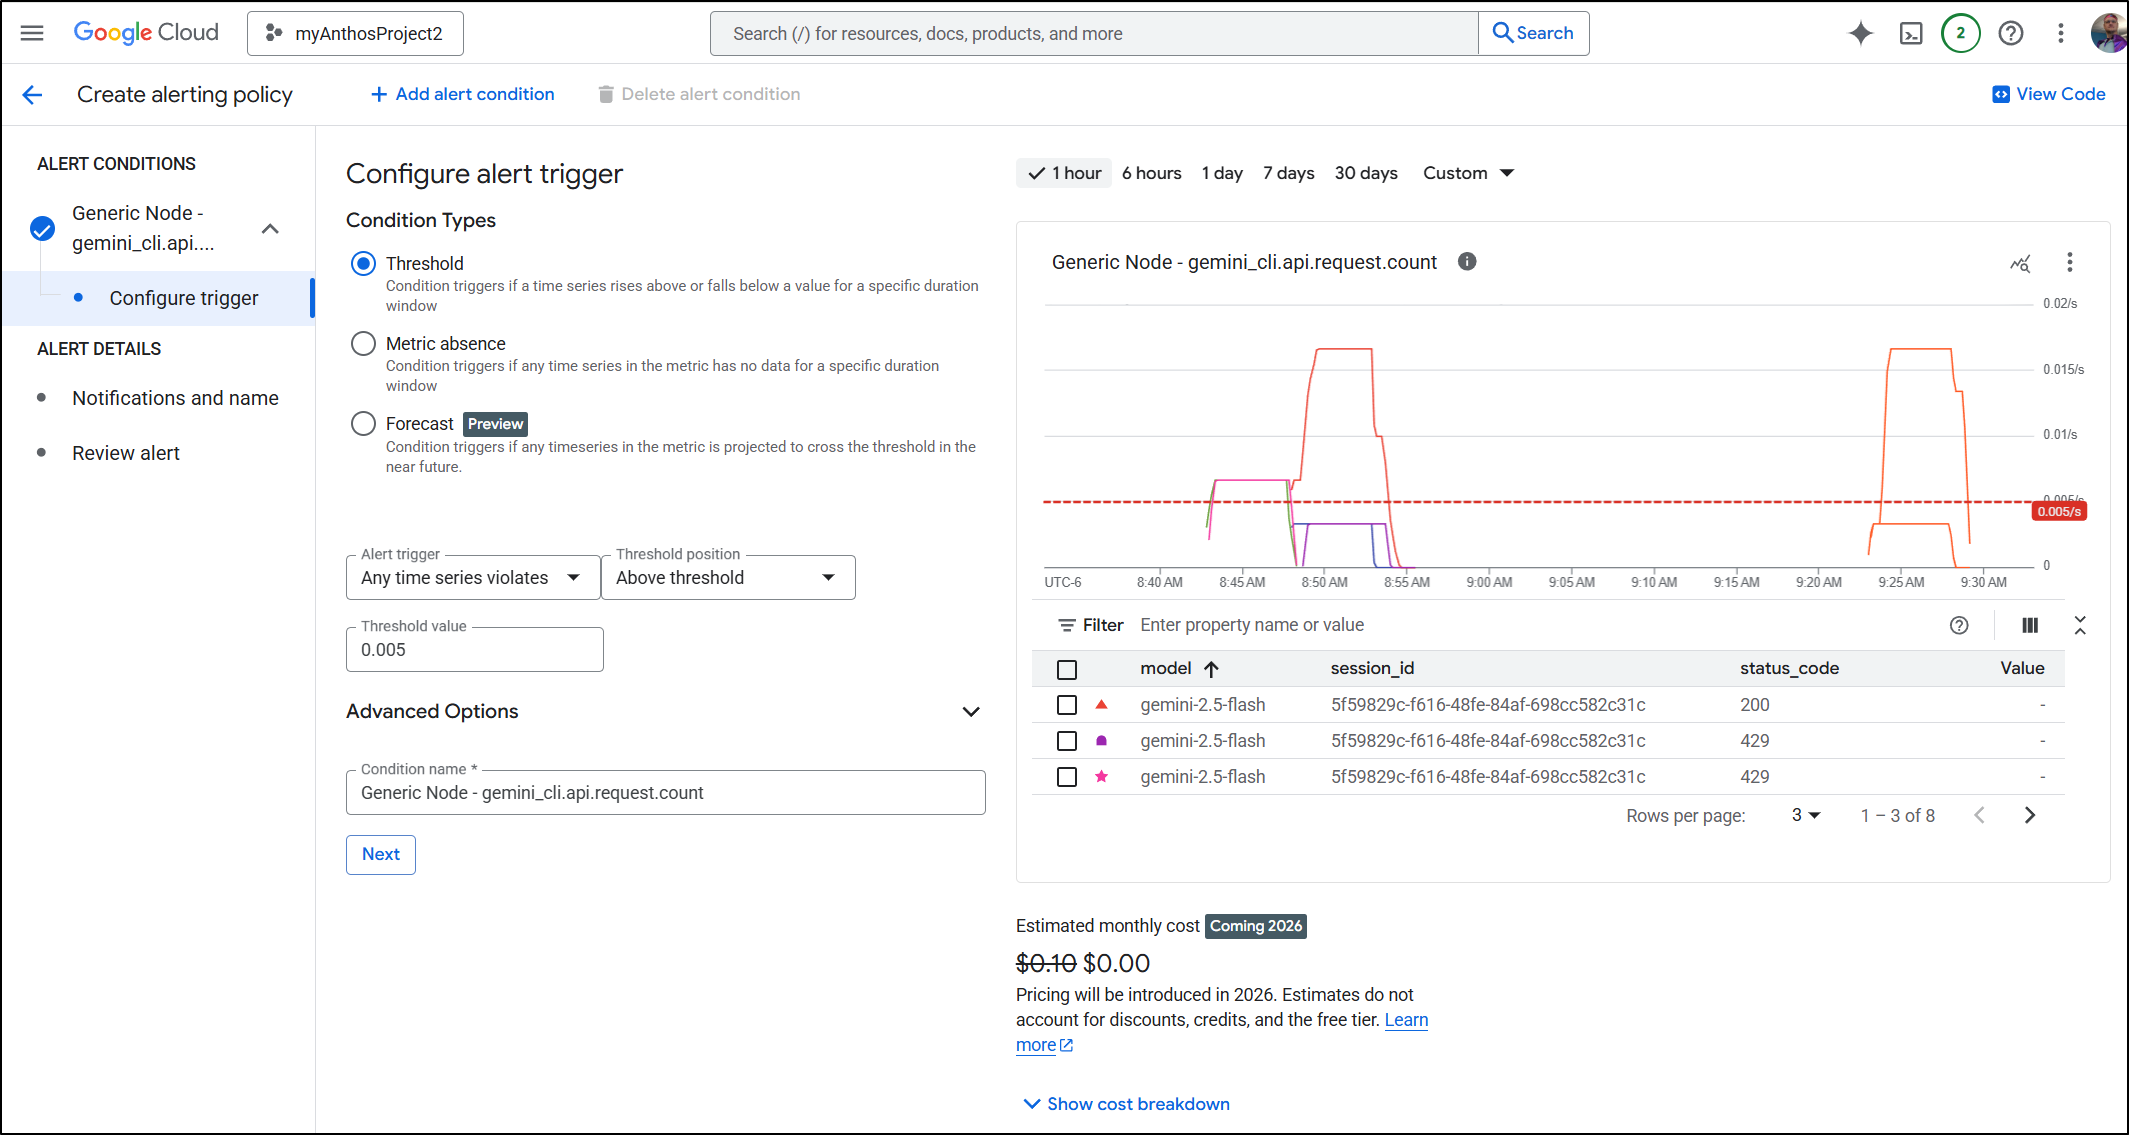
or writing a lot of new lines
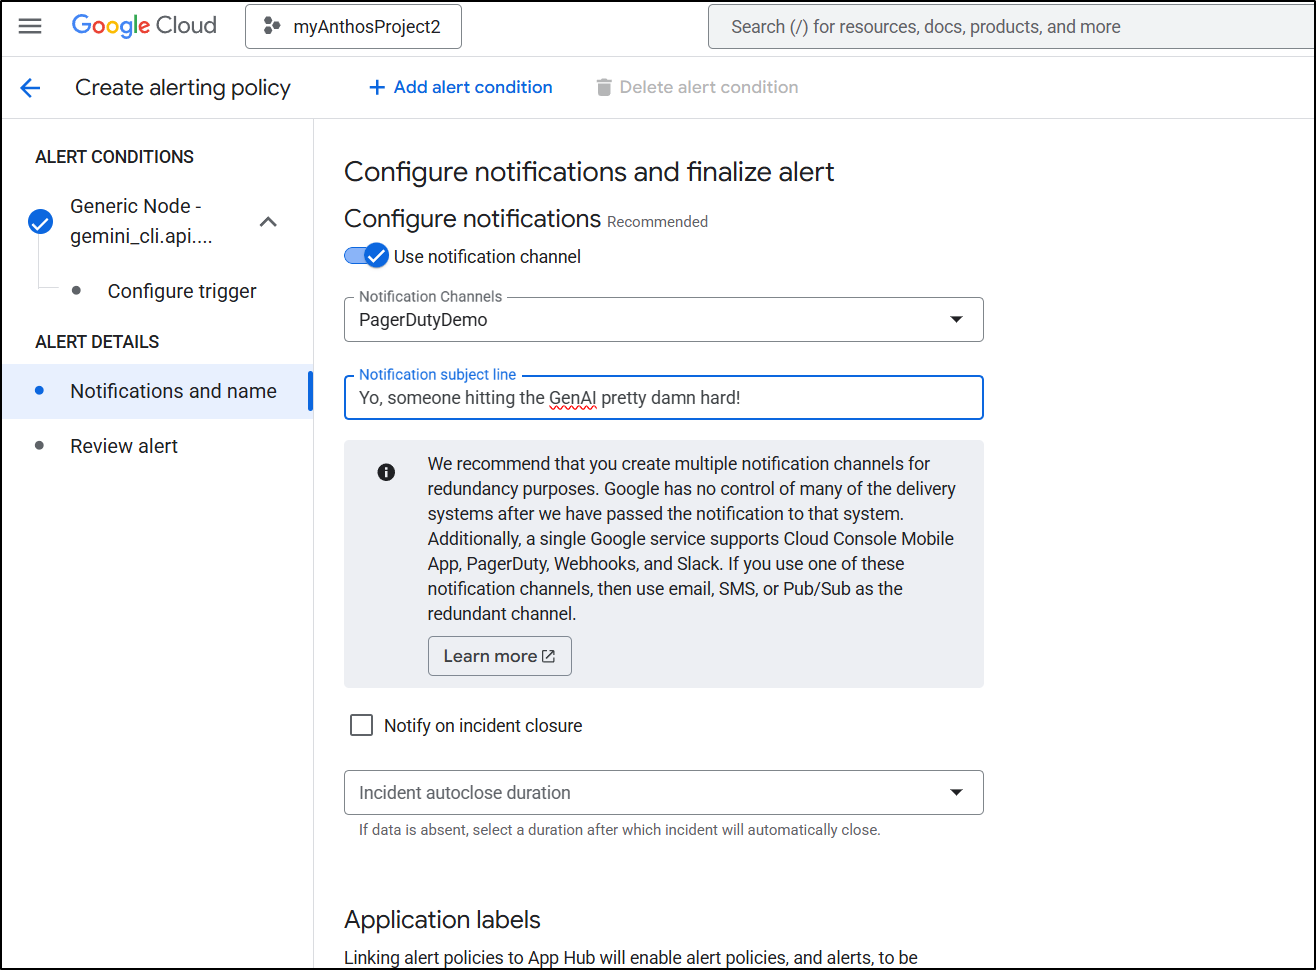
Then message my PagerDuty to do something about it
There is a note that they plan to start charging for alerting
Starting no sooner than May 1, 2026, Cloud Monitoring will begin charging for alerting. The pricing model is as follows: $0.10 per month for each condition in an alerting policy. $0.35 per 1,000,000 time series returned by the query of a metric alerting policy condition.
And I am not saying they won’t do this. I have no insider info on that. But I also know they’ve been saying they’ll start charging now for years and I have yet to see them do it. So take that for what it’s worth.
Costs
In most cases, we can just look at our Cloud bills to sort out costs:
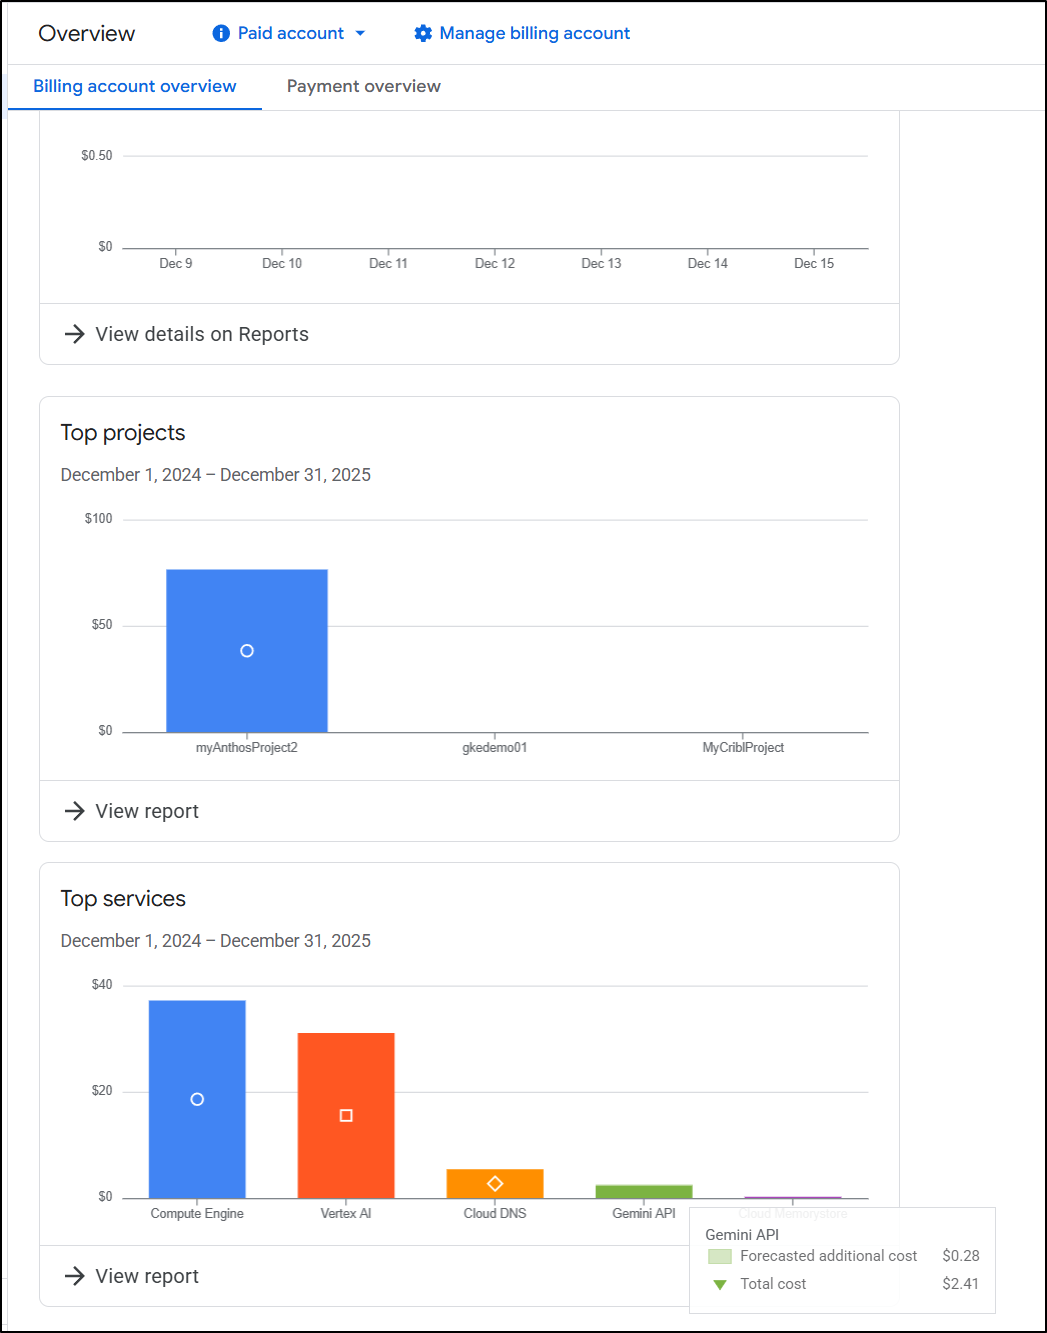
As you can see, so far this month I might be out about $2.50 for all the Gemini CLI and Antigravity work I’ve been doing.
The massive Vertex AI cost is a big lesson learned.
Basically if you ask for a Video and use 1080p and leave the default slider to 4 results:
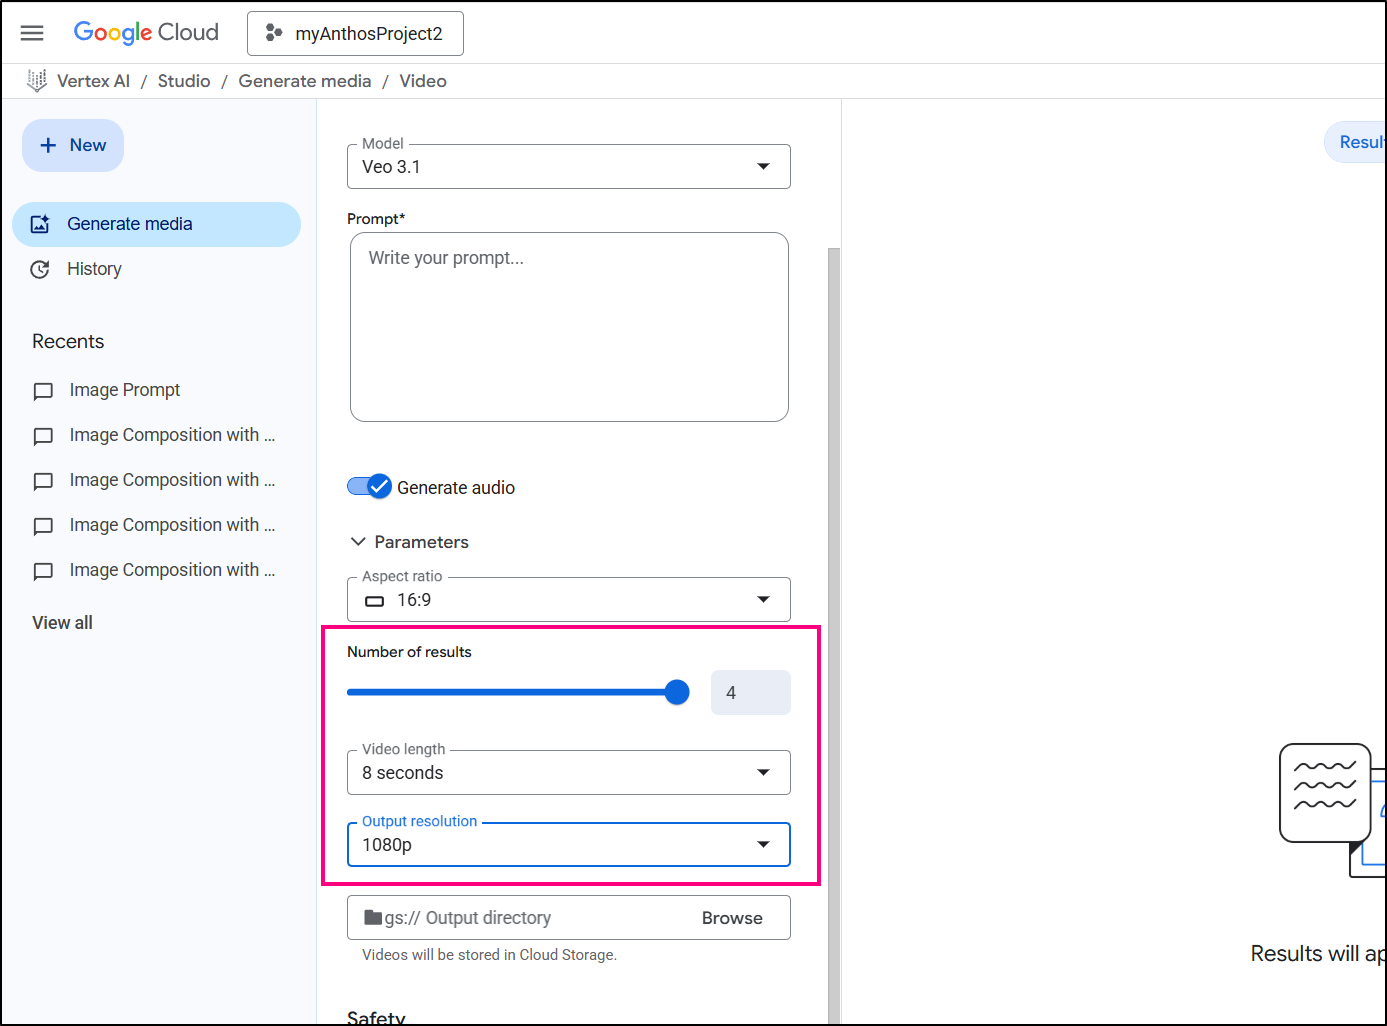
You’ll be out about $25. Thats a lot (at least to me).
However, if you have Gemini Pro (which I have added to my Google Pixel phone), then going to Gemini.google.com and using “Create Video” (at least for me, limited to 3 times a day), is just part of the plan. I can’t customize it as much as Veo03 in Vertex AI, but I sure like $0 more than $25.
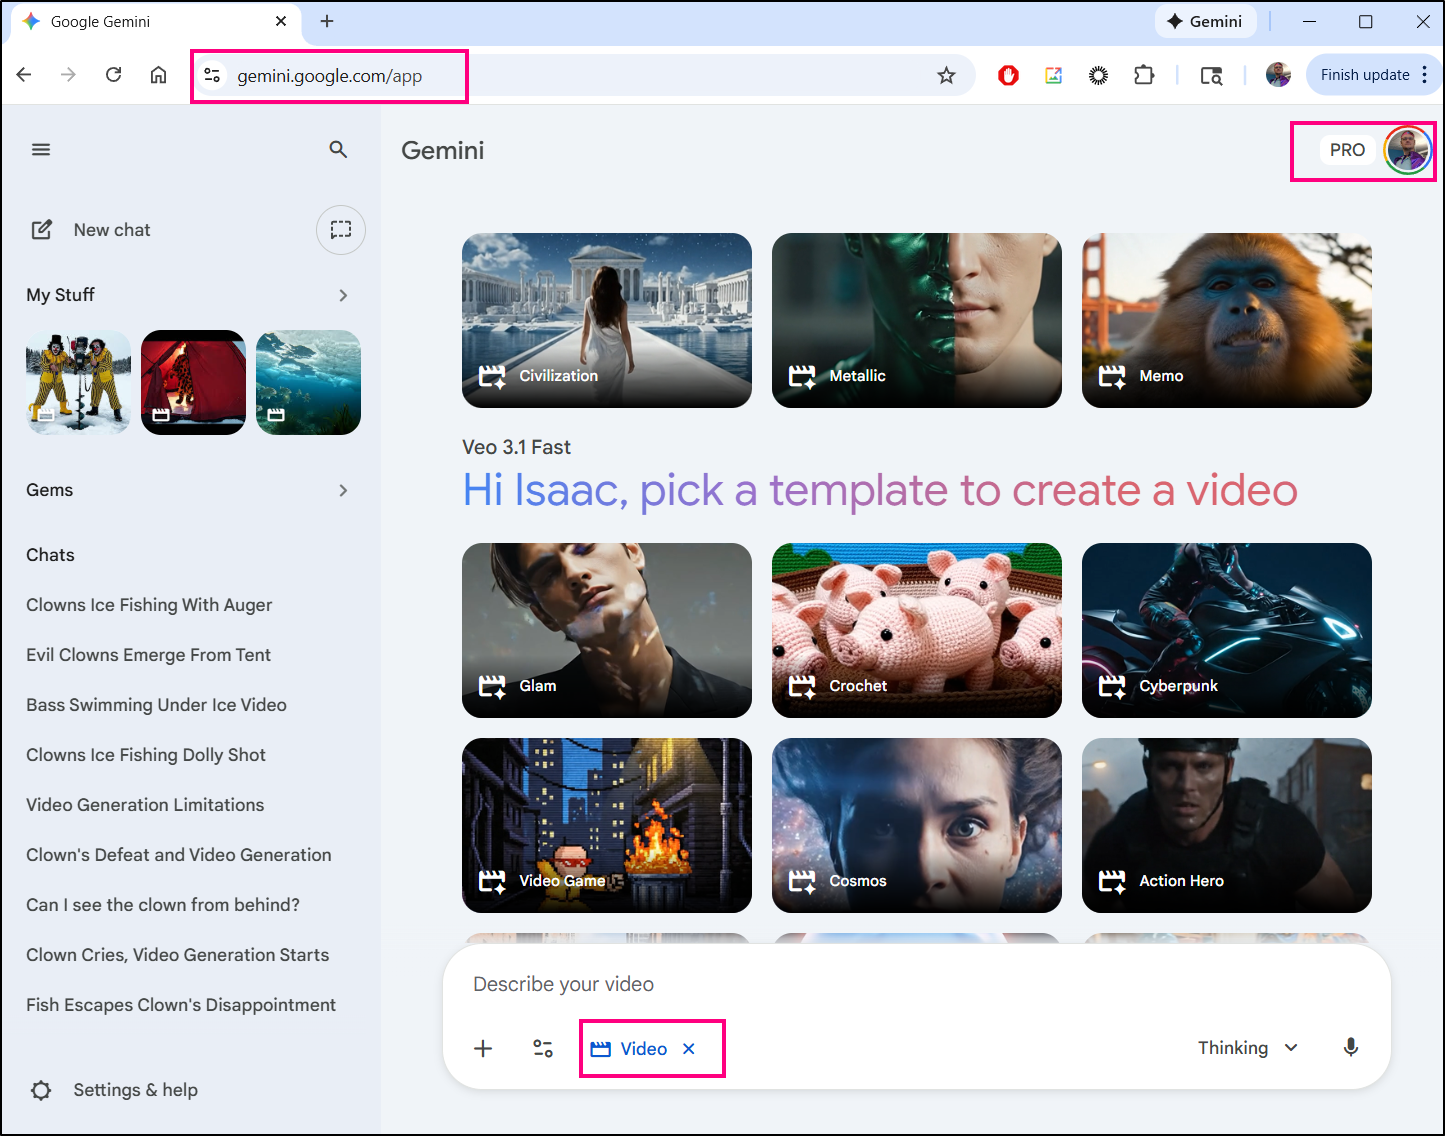
You can see the plans here which say with that I am using “Veo 3.1 Fast”
I believe the “AI Ultra” plan gives 5 videos (to the AI Pro’s 3), but does cost a lot more per month (as of today, $250/mo vs $20/mo).
Now my current flow is to use my 3 credits a day on the idea for a video then if I plan to have a video sequence move off to music (so I don’t care about background audio), then I screen grab the last image of a video clip from Veo3 and use that as a basis in my $10/mo MidJourney. You can also use MJ to bridge scenes by feeding a first and last shot in there.
Telemetry costs
If you don’t need logs, I recommend disabling those. I find they can really add up over time.
$ cat ~/.gemini/settings.json
{
  "security": {
    "auth": {
      "selectedType": "oauth-personal"
    }
  },
  "telemetry": {
    "enabled": true,
    "target": "gcp",
    "useCliAuth": true,
    "logPrompts": false
  },
  "ui": {
    "theme": "Shades Of Purple"
  },
  "mcpServers": {},
  "general": {
    "previewFeatures": true
  }
}
Additionally, if you want to just stop all Telemetry data for now, you can disable the telemetry block with “enabled”:
$ cat ~/.gemini/settings.json
{
  "security": {
    "auth": {
      "selectedType": "oauth-personal"
    }
  },
  "telemetry": {
    "enabled": false,
    "target": "gcp",
    "useCliAuth": true,
    "logPrompts": true
  },
  "ui": {
    "theme": "Shades Of Purple"
  },
  "mcpServers": {},
  "general": {
    "previewFeatures": true
  }
}
Summary
Today we looked at some of the Gemini CLI new Telemetry data we can send directly to GCP. These included logs, metrics and some tracing (span) data.
They have really expanded on the Metrics making it far more useful for monitoring and alerting.
I mentioned that this can add up - especially logs - so I noted how to disable logging of CLI prompts as well as disabling telemetry altogether when not needed.
Lastly, I know i just touched on it, but i really like the new “/stats” option to see model usage as I go along. There are days I’m vibe coding myself into a hole and seeing if it’s just using cached data or Flash models is good to know (let’s keep digging that hole!) or if it’s using lots of tokens on a Pro model (whoa, let’s take a break and re-evaluate!).
The fact I can use GCP Metrics explorer to view token using of Gen AI and Gemini CLI usage lets me have a cohesive picture that can show the full usage of GCP “stuff” from Veo3 to Imagen2/NanoBanana on through to Gemini for Code generation. The more we lean into using MCP tools, the more we want to see the full picture of spend.
