

Published: Nov 18, 2025 by Isaac Johnson
Today we are going to circle back on Sumo Logic which I last explored 3 years ago.
We will setup their Open Telemetry collector and show how to send sample traces, then look at how to tie it to Dapr by way of a centralized collector through to Sumo Logic.
I’ll only touch on some of the features outside of APM/traces (as a lot has changed in the last 3 years).
Let’s start with Collectors…
Collector Installation
Let’s start with the Collector install.
We have the option of firing off on a host, like a Linux host, with a one-liner command

Or into Kubernetes using Helm
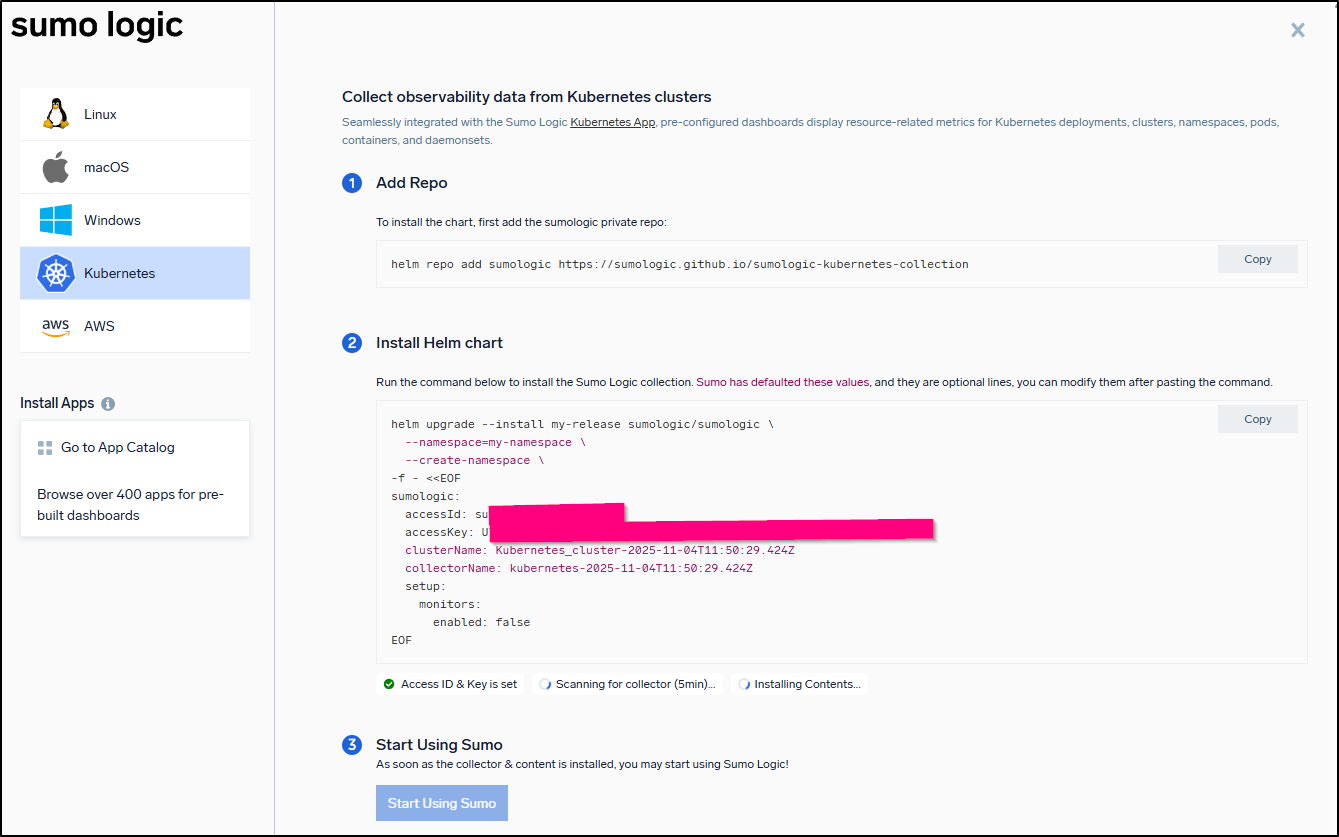
I was a bit disappointed they didn’t just have a Docker install. If one has Kubernetes, the logic to turn that into a docker compose is pretty trivial.
I’ll use Linux:
builder@bosgamerz9:~$ sudo curl -sL https://download-otel.sumologic.com/latest/download/install.sh | SUMOLOGIC_INSTALLATION_TOKEN="xxxxxxxxxxxxxxxxxxxxxxxxxxxxxxxxxxxxxxxxxxxxxxxxxxxx==" sudo -E bash -s -- --install-hostmetrics --tag "host.group=default" --tag "deployment.environment=default"
DOWNLOAD_URI = https://download-otel.sumologic.com
Detected OS type:       linux
Detected architecture:  amd64
Version specified:
dpkg-query: no packages found matching otelcol-sumo
Detected operating system as Ubuntu/noble.
Checking for curl...
Detected curl...
Checking for gpg...
Detected gpg...
Detected apt version as 2.7.14
Running apt-get update... done.
Installing apt-transport-https... done.
Installing /etc/apt/sources.list.d/sumologic_stable.list...done.
Importing packagecloud gpg key... gpg: WARNING: unsafe ownership on homedir '/home/builder/.gnupg'
Packagecloud gpg key imported to /etc/apt/keyrings/sumologic_stable-archive-keyring.gpg
done.
Running apt-get update... done.

The repository is setup! You can now install packages.
Hit:1 https://download.docker.com/linux/ubuntu noble InRelease
Hit:2 http://us.archive.ubuntu.com/ubuntu noble InRelease
Hit:3 https://packages.microsoft.com/repos/code stable InRelease
Get:4 http://us.archive.ubuntu.com/ubuntu noble-updates InRelease [126 kB]
Hit:5 http://security.ubuntu.com/ubuntu noble-security InRelease
Hit:6 https://repo.jellyfin.org/ubuntu noble InRelease
Get:7 http://us.archive.ubuntu.com/ubuntu noble-backports InRelease [126 kB]
Get:9 http://us.archive.ubuntu.com/ubuntu noble-updates/main amd64 Components [175 kB]
Get:10 http://us.archive.ubuntu.com/ubuntu noble-updates/restricted amd64 Components [212 B]
Get:11 http://us.archive.ubuntu.com/ubuntu noble-updates/universe amd64 Components [378 kB]
Hit:12 https://ppa.launchpadcontent.net/obsproject/obs-studio/ubuntu noble InRelease
Hit:8 https://packages.sumologic.com/sumologic/stable/ubuntu noble InRelease
Get:13 http://us.archive.ubuntu.com/ubuntu noble-updates/multiverse amd64 Components [940 B]
Get:14 http://us.archive.ubuntu.com/ubuntu noble-backports/main amd64 Components [7,156 B]
Get:15 http://us.archive.ubuntu.com/ubuntu noble-backports/restricted amd64 Components [212 B]
Get:16 http://us.archive.ubuntu.com/ubuntu noble-backports/universe amd64 Components [10.9 kB]
Get:17 http://us.archive.ubuntu.com/ubuntu noble-backports/multiverse amd64 Components [212 B]
Fetched 825 kB in 1s (963 kB/s)
Reading package lists...
Installing otelcol-sumo
Reading package lists...
Building dependency tree...
Reading state information...
The following packages were automatically installed and are no longer required:
  libllvm17t64 python3-netifaces
Use 'sudo apt autoremove' to remove them.
The following NEW packages will be installed:
  otelcol-sumo
0 upgraded, 1 newly installed, 0 to remove and 209 not upgraded.
Need to get 88.4 MB of archives.
After this operation, 335 MB of additional disk space will be used.
Get:1 https://packages.sumologic.com/sumologic/stable/ubuntu noble/main amd64 otelcol-sumo amd64 0.137.0-2400 [88.4 MB]
Fetched 88.4 MB in 2s (37.4 MB/s)
Selecting previously unselected package otelcol-sumo.
(Reading database ... 210744 files and directories currently installed.)
Preparing to unpack .../otelcol-sumo_0.137.0-2400_amd64.deb ...
Unpacking otelcol-sumo (0.137.0-2400) ...
Setting up otelcol-sumo (0.137.0-2400) ...
-e Setting the CAP_DAC_READ_SEARCH Linux capability on the  collector binary to allow it to read host metrics from the  /proc directory:  setcap 'cap_dac_read_search=ep' "usr/local/bin/otelcol-sumo"
-e You can remove it with the following command:  sudo setcap -r "usr/local/bin/otelcol-sumo"
-e Without this capability, the collector will not be able to  collect some of the host metrics.
/usr/sbin/setcap
/usr/local/bin/otelcol-sumo
/usr/local/bin/otelcol-config
Running otelcol-sumo --version to verify installation
Installation succeded:  otelcol-sumo version 0.137.0-sumo-0-ed82f0b5d8e581391556e6bd783a362fb30303f3
We are going to get and set up a default configuration for you
Generating configuration and saving it in /etc/otelcol-sumo
Installing linux hostmetrics configuration
Reloading systemd
Enable otelcol-sumo service
Created symlink /etc/systemd/system/multi-user.target.wants/otelcol-sumo.service → /usr/lib/systemd/system/otelcol-sumo.service.
Starting otelcol-sumo service
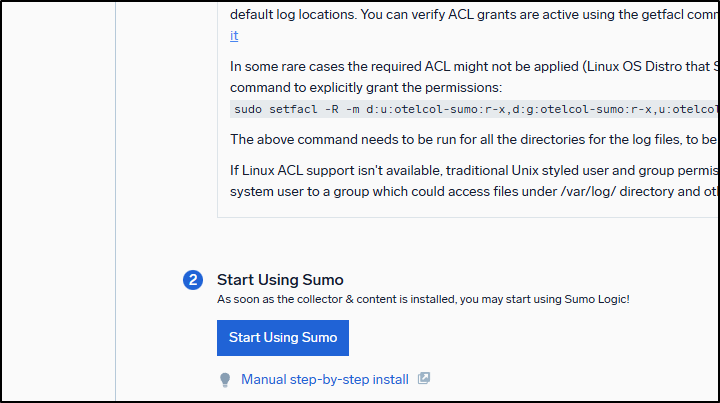
When it went live (sorry I neglected to capture it, it caught me off-guard), the web page shot out some animated confetti and the “Start Using Sumo” button went live:
I next want to send some sample traces tto the collector:
$ cat test_span_grpc.json
{
    "resourceSpans": [
    {
        "resource": {
        "attributes": [
            {
            "key": "service.name",
            "value": {
                "stringValue": "my-fbs-service"
            }
            }
        ]
        },
        "scopeSpans": [
        {
            "spans": [
            {
                "traceId": "01aa0589aa0e8940adeee48303efcdef",
                "spanId": "feaaba9876543210",
                "name": "my-fbs-operation",
                "kind": "SPAN_KIND_SERVER",
                "startTimeUnixNano": "1762240451123456789",
                "endTimeUnixNano": "1762240451234567890"
            }
            ]
        }
        ]
    }
    ]
}

$ cat test_span.json
{
 "resourceSpans": [
   {
     "resource": {
       "attributes": [
         {
           "key": "service.name",
           "value": {
             "stringValue": "test-with-curl-fbs"
           }
         }
       ]
     },
     "scopeSpans": [
       {
         "scope": {
           "name": "manual-test"
         },
         "spans": [
           {
             "traceId": "71699b6aa85982c7c8995ea3d9c95df2",
             "spanId": "3c1aad03fa8be065",
             "name": "spanitron",
             "kind": 2,
             "droppedAttributesCount": 0,
             "events": [],
             "droppedEventsCount": 0,
             "status": {
               "code": 1
             }
           }
         ]
       }
     ]
   }
 ]
}

$ cat test_span2.json
{
 "resourceSpans": [
  {
   "resource": {
    "attributes": [
     {
      "key": "service.name",
      "value": {
       "stringValue": "test-with-curl-fbs"
      }
     }
    ]
   },
   "scopeSpans": [
    {
     "scope": {
      "name": "manual-test"
     },
     "spans": [
      {
       "traceId": "716aab6faa5982c7c8995ea3d9c95df3",
       "spanId": "3c1aadaafa8be066",
       "name": "spanitron",
       "kind": 2,
       "startTimeUnixNano": "1762240451123456789",
       "endTimeUnixNano": "1762240451234567890",
       "droppedAttributesCount": 0,
       "events": [],
       "droppedEventsCount": 0,
       "status": {
        "code": 1
       }
      }
     ]
    }
   ]
  }
 ]
}
One of the things that took me a few to figure out is that I needed to ensure that I set the startTime and endTime in the examples to a reasonable value. To do that, I used an epoch time generator to get the first part of the value and replace it so it was within the last hour or so.
I can then fire all three sample traces (though only grpc and test_span2 were picked up)
$ curl -i http://127.0.0.1:4318/v1/traces -X POST -H "Content-Type: application/json" -d @test_span_grpc.json  && curl -i http://127.0.0.1:4318/v1/traces -X POST -H "Content-Type: application/json" -d @test_span2.json && curl -i http://127.0.0.1:4318/v1/traces -X POST -H "Content-Type: application/json" -d @test_span.json
HTTP/1.1 200 OK
Content-Type: application/json
Date: Tue, 04 Nov 2025 12:24:25 GMT
Content-Length: 21

{"partialSuccess":{}}HTTP/1.1 200 OK
Content-Type: application/json
Date: Tue, 04 Nov 2025 12:24:25 GMT
Content-Length: 21

{"partialSuccess":{}}HTTP/1.1 200 OK
Content-Type: application/json
Date: Tue, 04 Nov 2025 12:24:25 GMT
Content-Length: 21

{"partialSuccess":{}}
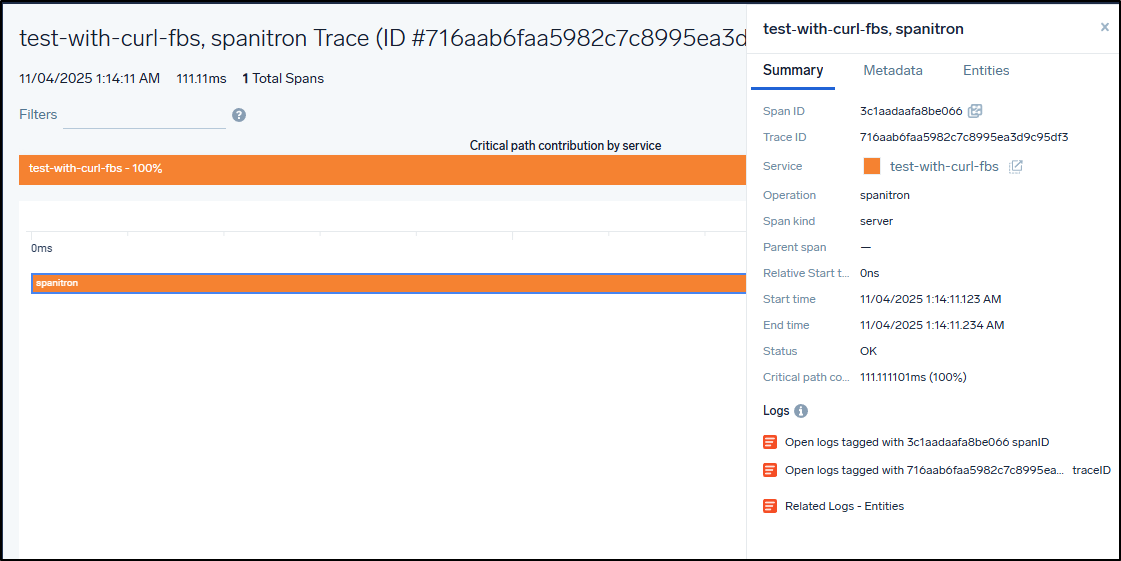
I now see them show up in sample traces

I can view the details on any trace
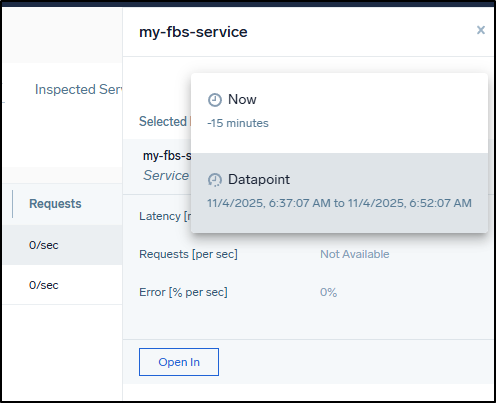
I can also view them in the “Services” page

If you click on the upper right, you can see the datapoints that lead to creating this service
Dapr Distributed Calculator
One of my favourite tools for testing out APM in any provider is the Dapr Distributed Calculator from the Dapr Quickstarts
Adding Dapr to a Kubernetes Cluster
if you haven’t setup Dapr yet, I would start by installing (or updating) the Dapr CLI
$ wget -q https://raw.githubusercontent.com/dapr/cli/master/install/install.sh -O - | /bin/bash
We can then use that to setup Dapr in Kubernetes
$ dapr init -k
Now, they do have a helm chart, but I have found over time the CLI tool has been far more successfull.
Valkey / Redis
I know that I’ll want to have a keystore running for the statestore component that the Calculator app uses. I’ll get ahead of this by installing the latest Valkey from Bitnami
$ helm install valkey oci://registry-1.docker.io/bitnamicharts/valkey --set auth.enabled=true --set auth.password=test_pwd
The current redis.yaml in the Quickstarts assumes a Redis install, so it’s a quick change of the secret name, key, and hostname in the YAML to point it to that Valkey instance
$ cat ~/Workspaces/quickstarts/tutorials/distributed-calculator/deploy/redis.yaml
apiVersion: dapr.io/v1alpha1
kind: Component
metadata:
  name: statestore
spec:
  type: state.redis
  version: v1
  metadata:
  # These settings will work out of the box if you use `helm install
  # bitnami/redis`.  If you have your own setup, replace
  # `redis-master:6379` with your own Redis master address, and the
  # Redis password with your own Secret's name. For more information,
  # see https://docs.dapr.io/operations/components/component-secrets .
  - name: redisHost
    value: valkey-primary:6379
  - name: redisPassword
    secretKeyRef:
      name: valkey
      key: valkey-password
auth:
  secretStore: kubernetes
I also want to point out two minor changes I make to the charts.
The first is to set some memory limits and requests on the dotnet app. I found, at least for my latest K3s instance, it was starved for resources and took way to long to boot. I also found that the latest image (was just a couple days old when i tested) was failing so I used 1.14.0 which was a couple months old and likely more stable.
--- a/tutorials/distributed-calculator/deploy/dotnet-subtractor.yaml
+++ b/tutorials/distributed-calculator/deploy/dotnet-subtractor.yaml
@@ -21,7 +21,14 @@ spec:
     spec:
       containers:
       - name: subtract
-        image: ghcr.io/dapr/samples/distributed-calculator-csharp:latest
+        image: ghcr.io/dapr/samples/distributed-calculator-csharp:1.14.0 # ghcr.io/dapr/samples/distributed-calculator-csharp:latest-linux-amd64
         ports:
         - containerPort: 80
         imagePullPolicy: Always
+        resources:
+          limits:
+            cpu: 800m
+            memory: 256Mi
+          requests:
+            cpu: 200m
+            memory: 128Mi
diff --git a/tutorials/distributed-calculator/deploy/react-calculator.yaml b/tutorials/distributed-calculator/deploy/react-calculator.yaml
index f72f5de7..10e8e09e 100644
The other change was to change the LoadBalancer to port 8080 (instead of the default 80). More often than not I have an existing Nginx LB or traffik instance serving up Port 80 already
--- a/tutorials/distributed-calculator/deploy/react-calculator.yaml
+++ b/tutorials/distributed-calculator/deploy/react-calculator.yaml
@@ -9,7 +9,7 @@ spec:
     app: calculator-front-end
   ports:
   - protocol: TCP
-    port: 80
+    port: 8080
     targetPort: 8080
   type: LoadBalancer
Now just deploy the stack
builder@DESKTOP-QADGF36:~/Workspaces/quickstarts/tutorials/distributed-calculator/deploy$ cd ..
builder@DESKTOP-QADGF36:~/Workspaces/quickstarts/tutorials/distributed-calculator$ kubectl apply -f ./deploy/
configuration.dapr.io/appconfig unchanged
deployment.apps/subtractapp unchanged
deployment.apps/addapp unchanged
deployment.apps/divideapp unchanged
deployment.apps/multiplyapp unchanged
service/calculator-front-end unchanged
deployment.apps/calculator-front-end unchanged
component.dapr.io/statestore unchanged
There is also an open telemetry appconfig and zipkin instance in the “Observability” folder we will want to apply
builder@DESKTOP-QADGF36:~/Workspaces/quickstarts/tutorials/observability$ kubectl apply -f ./deploy/
configuration.dapr.io/appconfig unchanged
deployment.apps/multiplyapp unchanged
deployment.apps/zipkin unchanged
service/zipkin unchanged
We can now test the Calculator App with Zipkin to show it’s getting APM data
Switching to Sumo Logic’s Otel
To have the app config send things over to the Sumo Logic OTel Collector.
I hoped I could just add recievers for all interfaces for HTTP/GRPC as well as Zipkin
builder@bosgamerz9:~$ sudo vi /etc/otelcol-sumo/conf.d/common.yaml
builder@bosgamerz9:~$ sudo cat /etc/otelcol-sumo/conf.d/common.yaml
receivers:
  otlp:
    protocols:
      grpc:
        endpoint: "0.0.0.0:4317"
      http:
        endpoint: "0.0.0.0:4318"
  zipkin:
    endpoint: "0.0.0.0:9411"
builder@bosgamerz9:~$ sudo systemctl restart otelcol-sumo
builder@bosgamerz9:~$ sudo systemctl status otelcol-sumo
But it’s pretty clear the container only listens on the standard OTLP ports
builder@bosgamerz9:~$ sudo lsof -i tcp:4318
COMMAND       PID         USER   FD   TYPE   DEVICE SIZE/OFF NODE NAME
otelcol-s 2153496 otelcol-sumo   14u  IPv6 54577440      0t0  TCP *:4318 (LISTEN)
builder@bosgamerz9:~$ sudo lsof -i tcp:4317
COMMAND       PID         USER   FD   TYPE   DEVICE SIZE/OFF NODE NAME
otelcol-s 2153496 otelcol-sumo   13u  IPv6 54577438      0t0  TCP *:4317 (LISTEN)
builder@bosgamerz9:~$ sudo lsof -i tcp:9411
builder@bosgamerz9:~$
This just means, unfortunately for my demo, I’ll need a middle man.
Otel to Otel
We can always ingest Zipkin traces in a centralized Open Telemetry collector then send them on to Sumo Logics collector. It will cause a minor delay, but shouldn’t be too bad.
Thankfully, I’ve already setup a collector in my production cluster:
$ kubectl get deployments | grep opentelemetry
my-opentelemetry-collector          1/1     1            1           451d
I have many articles covering setting up the base collector. I might look at Setting it up with Dynatrace from 2022, or just running it in Docker for a .NET MVC app from 2024.
The key thing is that once it is up and running, we just need to configure the exporter block and the pipeline:service block to add another destination.
The two sections below I need to add are:
exporters:
      otlp:
        endpoint: "http://192.168.1.143:4318/v1/traces"
and
    service:
      pipelines:
        traces:
          exporters:
          - otlp
That then has my config map looking like:
$ cat my-opentelemetry-collector.yaml.new
apiVersion: v1
data:
  relay: |
    exporters:
      debug: {}
      zipkin:
        endpoint: "http://zipkin.default.svc.cluster.local:9411/api/v2/spans"
      otlphttp:
        endpoint: "http://192.168.1.143:4318"
    extensions:
      health_check:
        endpoint: ${env:MY_POD_IP}:13133
    processors:
      batch: {}
      memory_limiter:
        check_interval: 5s
        limit_percentage: 80
        spike_limit_percentage: 25
    receivers:
      jaeger:
        protocols:
          grpc:
            endpoint: ${env:MY_POD_IP}:14250
          thrift_compact:
            endpoint: ${env:MY_POD_IP}:6831
          thrift_http:
            endpoint: ${env:MY_POD_IP}:14268
      otlp:
        protocols:
          grpc:
            endpoint: ${env:MY_POD_IP}:4317
          http:
            endpoint: ${env:MY_POD_IP}:4318
      prometheus:
        config:
          scrape_configs:
          - job_name: opentelemetry-collector
            scrape_interval: 10s
            static_configs:
            - targets:
              - ${env:MY_POD_IP}:8888
      zipkin:
        endpoint: ${env:MY_POD_IP}:9411
    service:
      extensions:
      - health_check
      pipelines:
        logs:
          exporters:
          - debug
          processors:
          - memory_limiter
          - batch
          receivers:
          - otlp
        metrics:
          exporters:
          - debug
          processors:
          - memory_limiter
          - batch
          receivers:
          - otlp
          - prometheus
        traces:
          exporters:
          - debug
          - zipkin
          - otlphttp
          processors:
          - memory_limiter
          - batch
          receivers:
          - otlp
          - jaeger
          - zipkin
      telemetry:
        metrics:
          readers:
          - pull:
              exporter:
                prometheus:
                  host: ${env:MY_POD_IP}
                  port: 8888
kind: ConfigMap
metadata:
  annotations:
    meta.helm.sh/release-name: my-opentelemetry-collector
    meta.helm.sh/release-namespace: default
  labels:
    app.kubernetes.io/component: standalone-collector
    app.kubernetes.io/instance: my-opentelemetry-collector
    app.kubernetes.io/managed-by: Helm
    app.kubernetes.io/name: opentelemetry-collector
    app.kubernetes.io/part-of: opentelemetry-collector
    app.kubernetes.io/version: 0.134.1
    helm.sh/chart: opentelemetry-collector-0.133.0
  name: my-opentelemetry-collector
  namespace: default
Again, I just want to highlight where one needs to make changes:
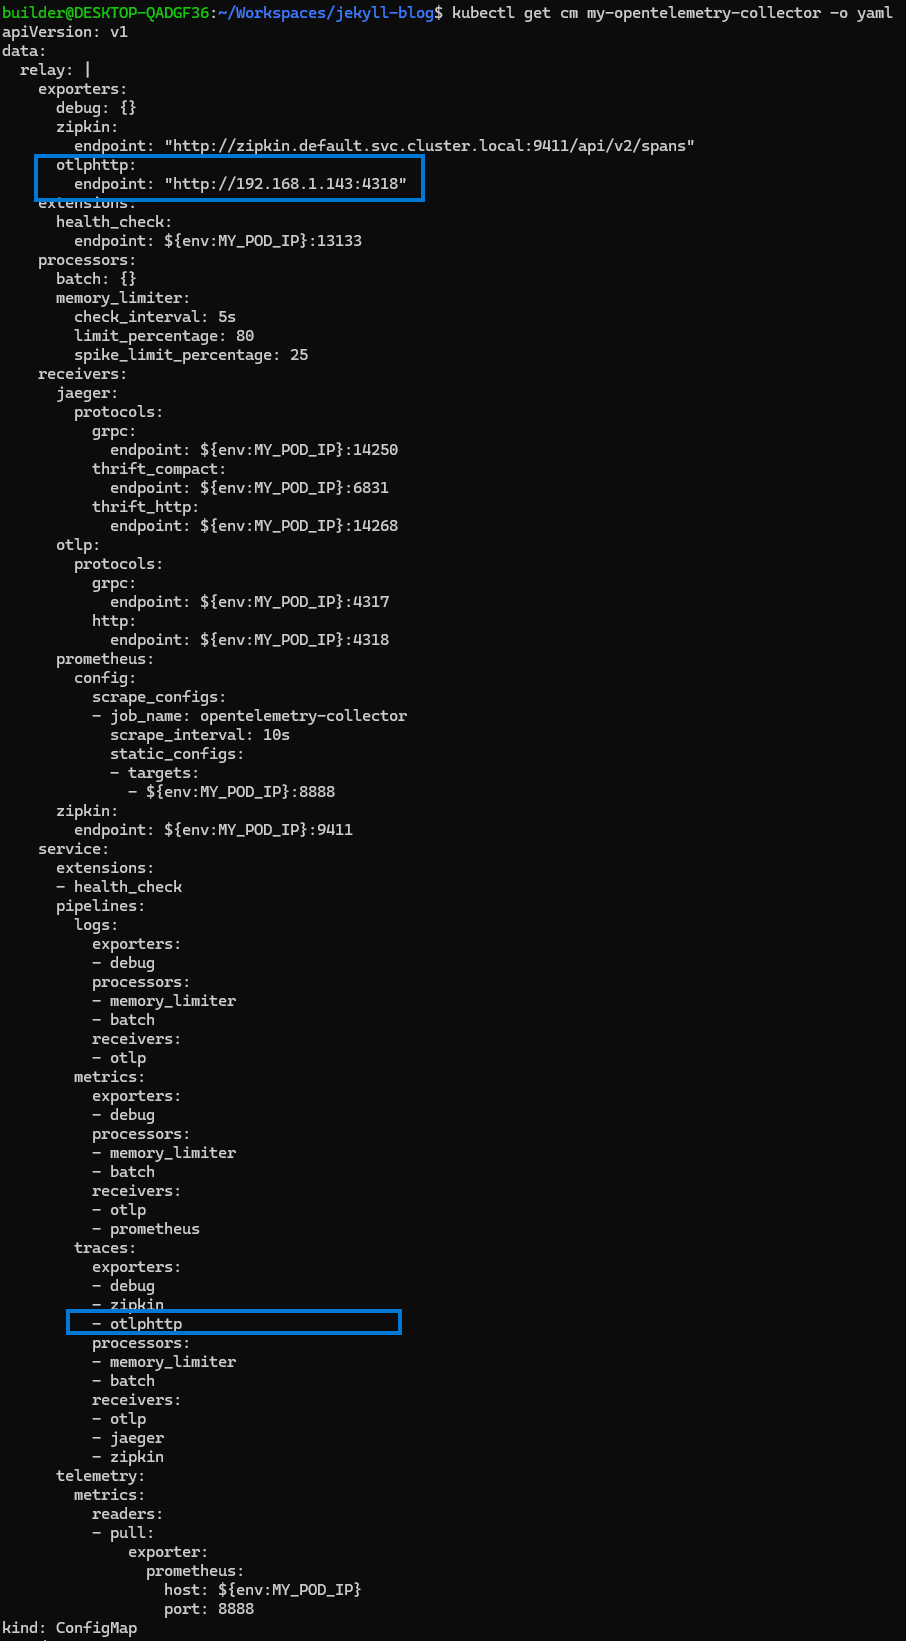
We can see that is handing off otel traces to Sumo on the .143 host:
builder@bosgamerz9:~$ ifconfig | grep 192.168
        inet 192.168.1.142  netmask 255.255.255.0  broadcast 192.168.1.255
        inet 192.168.1.143  netmask 255.255.255.0  broadcast 192.168.1.255
builder@bosgamerz9:~$ sudo lsof -i tcp:4318
COMMAND       PID         USER   FD   TYPE   DEVICE SIZE/OFF NODE NAME
otelcol-s 2153496 otelcol-sumo   14u  IPv6 54577440      0t0  TCP *:4318 (LISTEN)
Dapr Changes
At this point we have our Dapr app configuration, appconfig, set to send traces just to Zipkin
$ kubectl get configuration appconfig -o yaml
apiVersion: dapr.io/v1alpha1
kind: Configuration
metadata:
  annotations:
    kubectl.kubernetes.io/last-applied-configuration: |
      {"apiVersion":"dapr.io/v1alpha1","kind":"Configuration","metadata":{"annotations":{},"name":"appconfig","namespace":"default"},"spec":{"tracing":{"samplingRate":"1","zipkin":{"endpointAddress":"http://zipkin.default.svc.cluster.local:9411/api/v2/spans"}}}}
  creationTimestamp: "2025-11-03T13:00:37Z"
  generation: 3
  name: appconfig
  namespace: default
  resourceVersion: "7804292"
  uid: c445dc51-d74e-4728-8657-06e2977f61fc
spec:
  metric:
    enabled: true
  metrics:
    enabled: true
  tracing:
    samplingRate: "1"
    zipkin:
      endpointAddress: http://zipkin.default.svc.cluster.local:9411/api/v2/spans
and we know we have a standard Open-Telemetry collector running in the cluster that will send them on to the Sumo Logic collector. I can even double check it is listening on zipkin’s 9411 port:
$ kubectl get svc my-opentelemetry-collector
NAME                         TYPE        CLUSTER-IP      EXTERNAL-IP   PORT(S)                                                   AGE
my-opentelemetry-collector   ClusterIP   10.43.254.157   <none>        6831/UDP,14250/TCP,14268/TCP,4317/TCP,4318/TCP,9411/TCP   28d
A quick pro-tip on changing the Open Telemetry configuration - always do a rollout and test to see if you made a typo. For instance, the first time I tried this, I left “v1/traces” in the URL (not needed for OTLP GRPC endpoints)
$ kubectl edit cm my-opentelemetry-collector
configmap/my-opentelemetry-collector edited
$ kubectl rollout restart deployment -l app.kubernetes.io/instance=my-opentelemetry-collector
deployment.apps/my-opentelemetry-collector restarted

# check that it is good
$ kubectl get po -l app.kubernetes.io/instance=my-opentelemetry-collector
NAME                                          READY   STATUS    RESTARTS     AGE
my-opentelemetry-collector-68686d4bf6-v26bv   0/1     Error     1 (8s ago)   9s
my-opentelemetry-collector-86d6f478bf-g8v2n   1/1     Running   0            44h

# figure out my mistake
$ kubectl logs my-opentelemetry-collector-68686d4bf6-v26bv
Error: invalid configuration: exporters::otlp: invalid port "4318/v1/traces"
2025/11/07 13:07:26 collector server run finished with error: invalid configuration: exporters::otlp: invalid port "4318/v1/traces"
A quick fix shows it’s running now
$ kubectl edit cm my-opentelemetry-collector
configmap/my-opentelemetry-collector edited
$ kubectl rollout restart deployment -l app.kubernetes.io/instance=my-opentelemetry-collector
deployment.apps/my-opentelemetry-collector restarted
$ kubectl get po -l app.kubernetes.io/instance=my-opentelemetry-collector
NAME                                          READY   STATUS              RESTARTS   AGE
my-opentelemetry-collector-65bf697787-jxfgb   0/1     ContainerCreating   0          3s
my-opentelemetry-collector-86d6f478bf-g8v2n   1/1     Running             0          44h
$ kubectl get po -l app.kubernetes.io/instance=my-opentelemetry-collector
NAME                                          READY   STATUS    RESTARTS   AGE
my-opentelemetry-collector-65bf697787-jxfgb   0/1     Running   0          7s
my-opentelemetry-collector-86d6f478bf-g8v2n   1/1     Running   0          44h
$ kubectl get po -l app.kubernetes.io/instance=my-opentelemetry-collector

NAME                                          READY   STATUS    RESTARTS   AGE
my-opentelemetry-collector-65bf697787-jxfgb   0/1     Running   0          10s
my-opentelemetry-collector-86d6f478bf-g8v2n   1/1     Running   0          44h

$ kubectl get po -l app.kubernetes.io/instance=my-opentelemetry-collector
NAME                                          READY   STATUS    RESTARTS   AGE
my-opentelemetry-collector-65bf697787-jxfgb   0/1     Running   0          14s
my-opentelemetry-collector-86d6f478bf-g8v2n   1/1     Running   0          44h
$ kubectl get po -l app.kubernetes.io/instance=my-opentelemetry-collector
NAME                                          READY   STATUS    RESTARTS   AGE
my-opentelemetry-collector-65bf697787-jxfgb   0/1     Running   0          17s
my-opentelemetry-collector-86d6f478bf-g8v2n   1/1     Running   0          44h
$ kubectl get po -l app.kubernetes.io/instance=my-opentelemetry-collector
NAME                                          READY   STATUS    RESTARTS   AGE
my-opentelemetry-collector-65bf697787-jxfgb   1/1     Running   0          22s
Lastly, let’s change that app config:
$ kubectl get svc my-opentelemetry-collector
NAME                         TYPE        CLUSTER-IP      EXTERNAL-IP   PORT(S)                                                   AGE
my-opentelemetry-collector   ClusterIP   10.43.254.157   <none>        6831/UDP,14250/TCP,14268/TCP,4317/TCP,4318/TCP,9411/TCP   28d

$ kubectl get configuration appconfig -o yaml
apiVersion: dapr.io/v1alpha1
kind: Configuration
metadata:
  annotations:
    kubectl.kubernetes.io/last-applied-configuration: |
      {"apiVersion":"dapr.io/v1alpha1","kind":"Configuration","metadata":{"annotations":{},"name":"appconfig","namespace":"default"},"spec":{"tracing":{"samplingRate":"1","zipkin":{"endpointAddress":"http://zipkin.default.svc.cluster.local:9411/api/v2/spans"}}}}
  creationTimestamp: "2025-11-03T13:00:37Z"
  generation: 3
  name: appconfig
  namespace: default
  resourceVersion: "7804292"
  uid: c445dc51-d74e-4728-8657-06e2977f61fc
spec:
  metric:
    enabled: true
  metrics:
    enabled: true
  tracing:
    samplingRate: "1"
    zipkin:
      endpointAddress: http://zipkin.default.svc.cluster.local:9411/api/v2/spans

$ kubectl edit configuration appconfig
configuration.dapr.io/appconfig edited

$ kubectl get configuration appconfig -o yaml
apiVersion: dapr.io/v1alpha1
kind: Configuration
metadata:
  annotations:
    kubectl.kubernetes.io/last-applied-configuration: |
      {"apiVersion":"dapr.io/v1alpha1","kind":"Configuration","metadata":{"annotations":{},"name":"appconfig","namespace":"default"},"spec":{"tracing":{"samplingRate":"1","zipkin":{"endpointAddress":"http://zipkin.default.svc.cluster.local:9411/api/v2/spans"}}}}
  creationTimestamp: "2025-11-03T13:00:37Z"
  generation: 4
  name: appconfig
  namespace: default
  resourceVersion: "7986313"
  uid: c445dc51-d74e-4728-8657-06e2977f61fc
spec:
  metric:
    enabled: true
  metrics:
    enabled: true
  tracing:
    samplingRate: "1"
    zipkin:
      endpointAddress: http://my-opentelemetry-collector.default.svc.cluster.local:9411/api/v2/spans
If we did all this right, we should now have a setup that looks like:
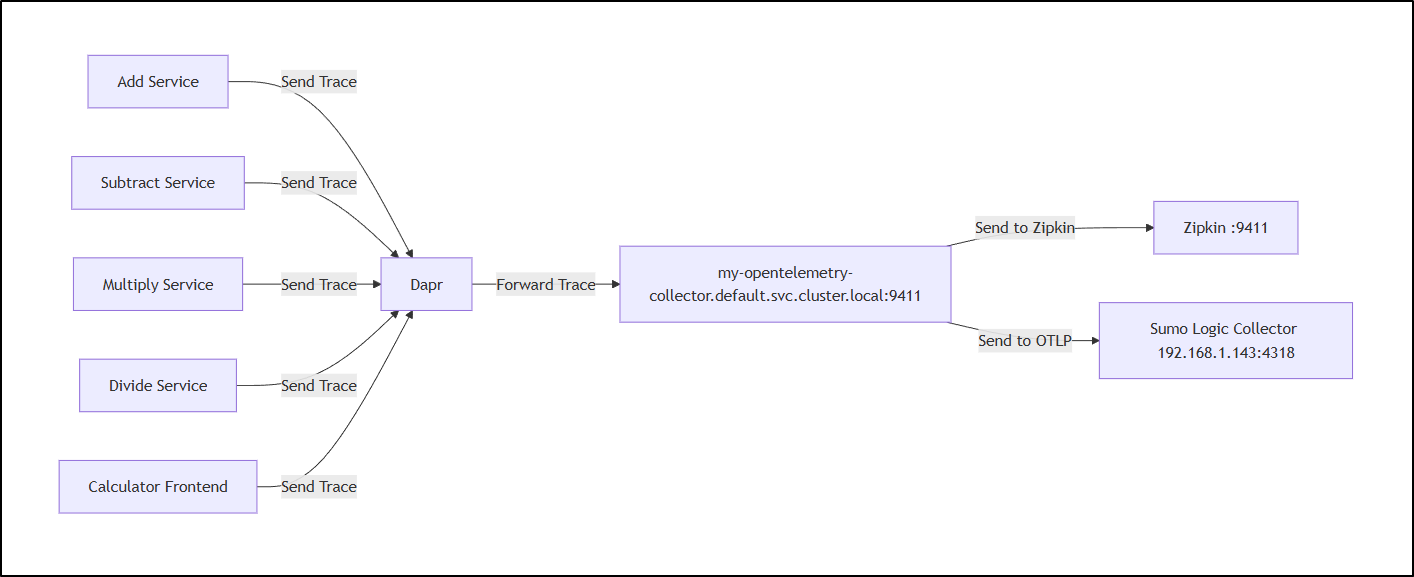
Let’s test:
Monitors
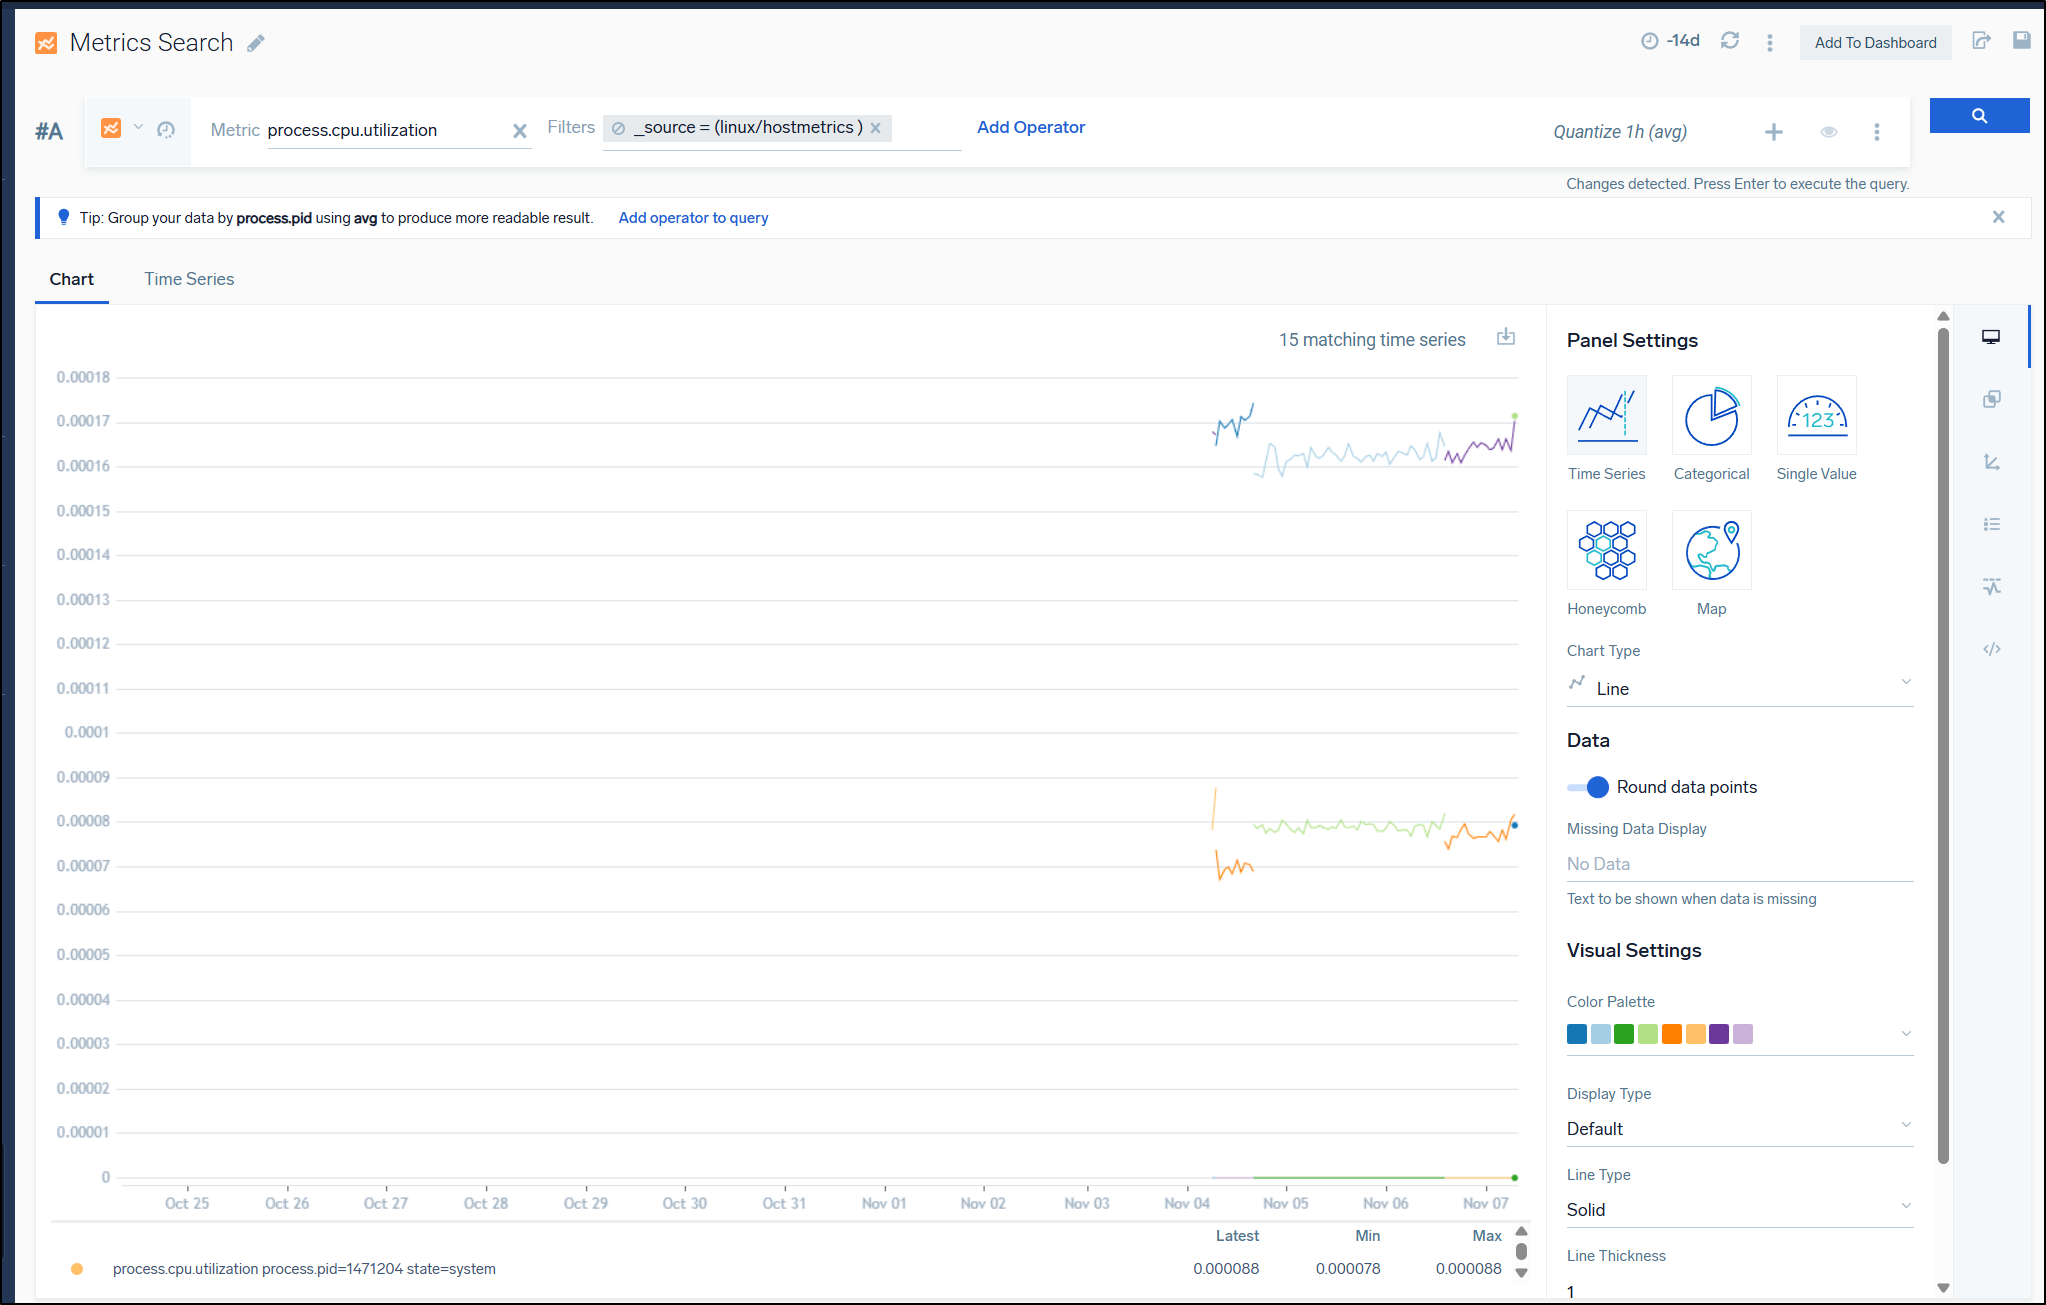
We briefly ran the Sumo Logic host monitor which meant we did pull some metrics
If we go to monitors, we can now add a monitor. As you can see, a couple years ago I was monitoring one of my AKS clusters using Sumo Logic
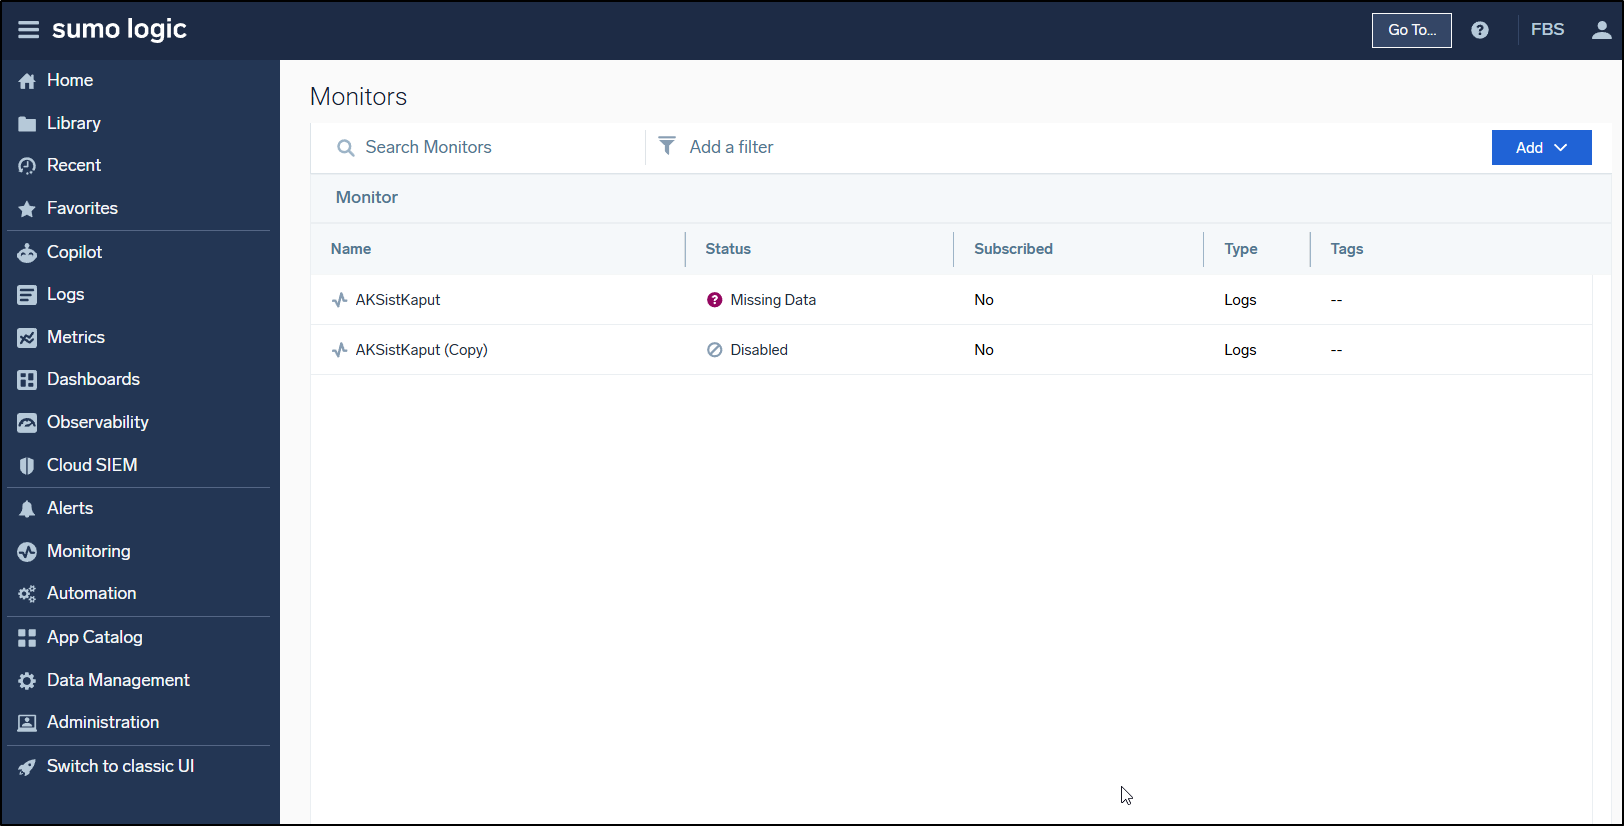
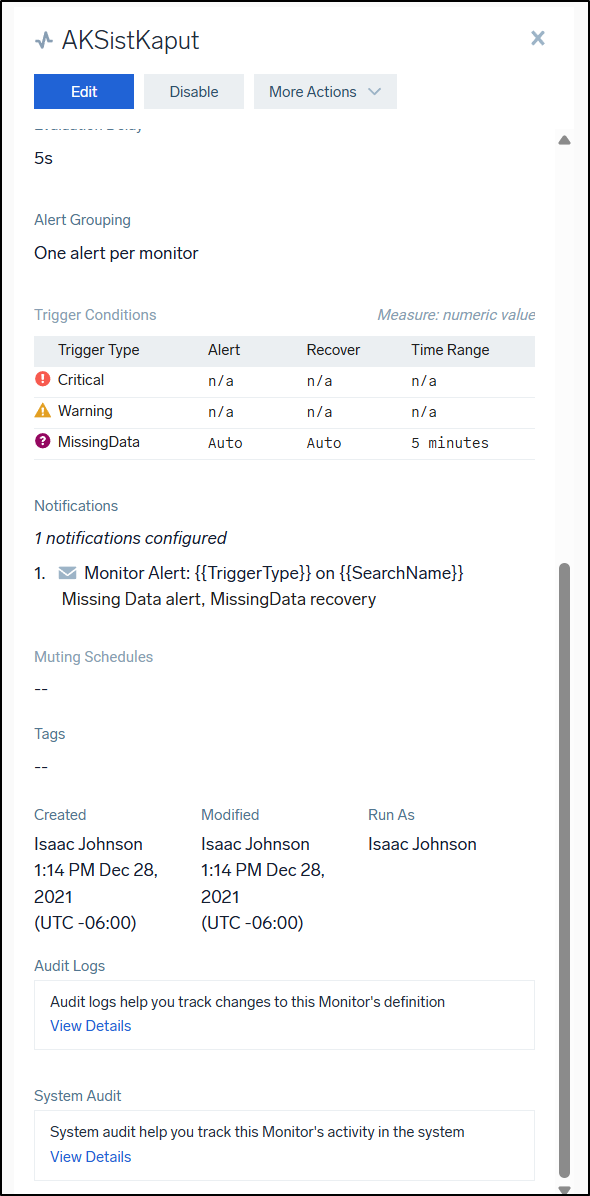
It was set to alert when AKS stopped reporting
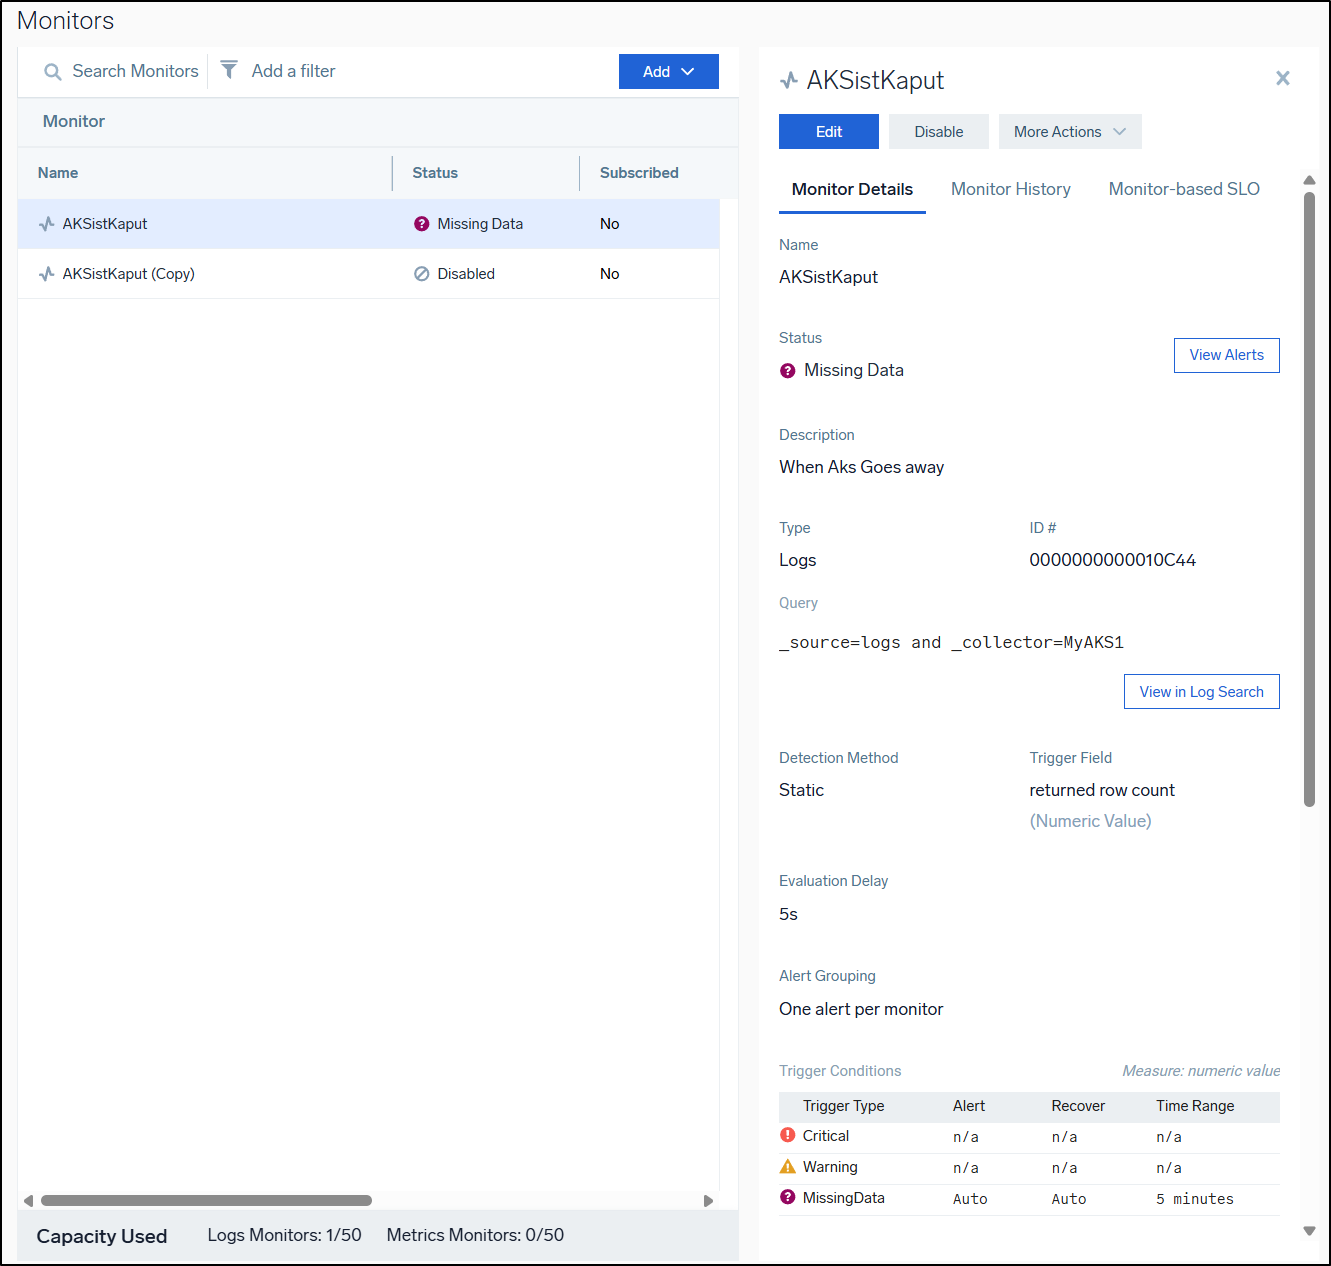
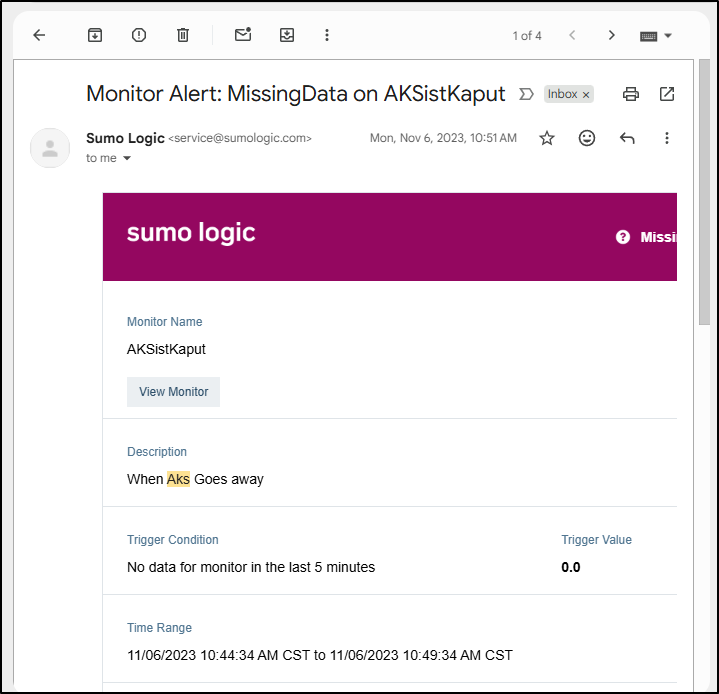
and email me about it
which it dutifully did
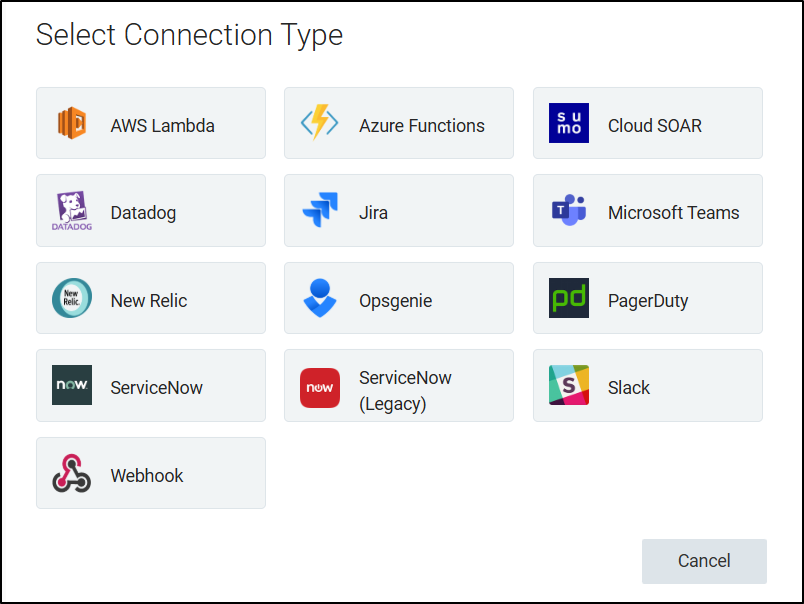
What I find rather interesting is that there is a built-in connector out to Datadog so I can monitor with Sumo Logic, but then push events to Datadog for correlation and alerting
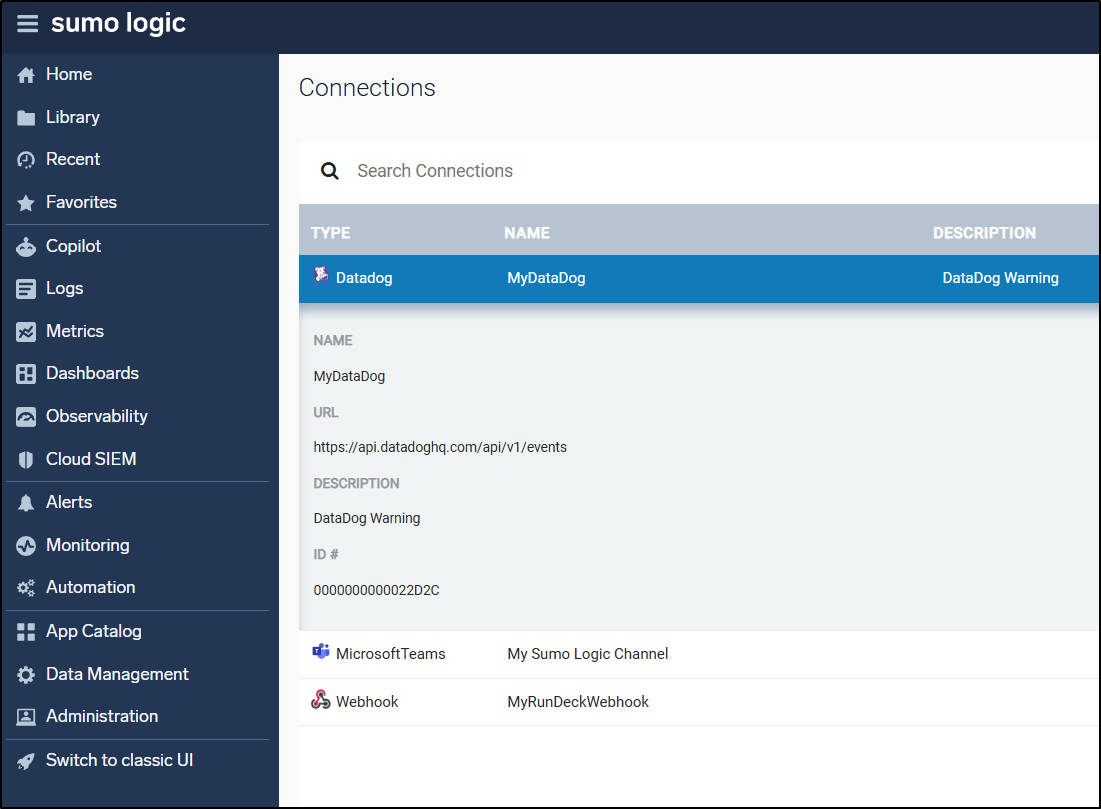
The full set of connections includes OpsGenie and New Relic (using the old logo) which makes me wonder how often this section is updated
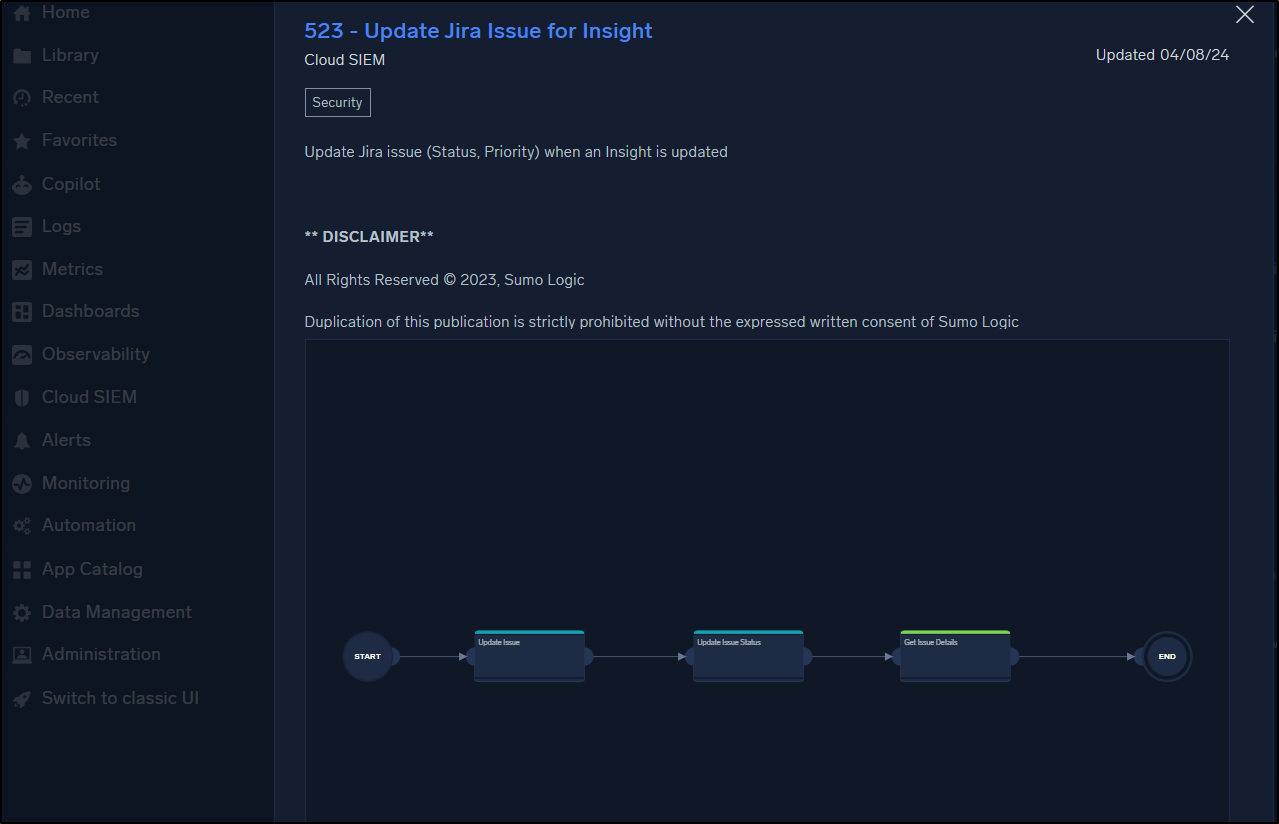
Automations
There is an entire Automations section that is wild. We can update JIRA issues with insight updates
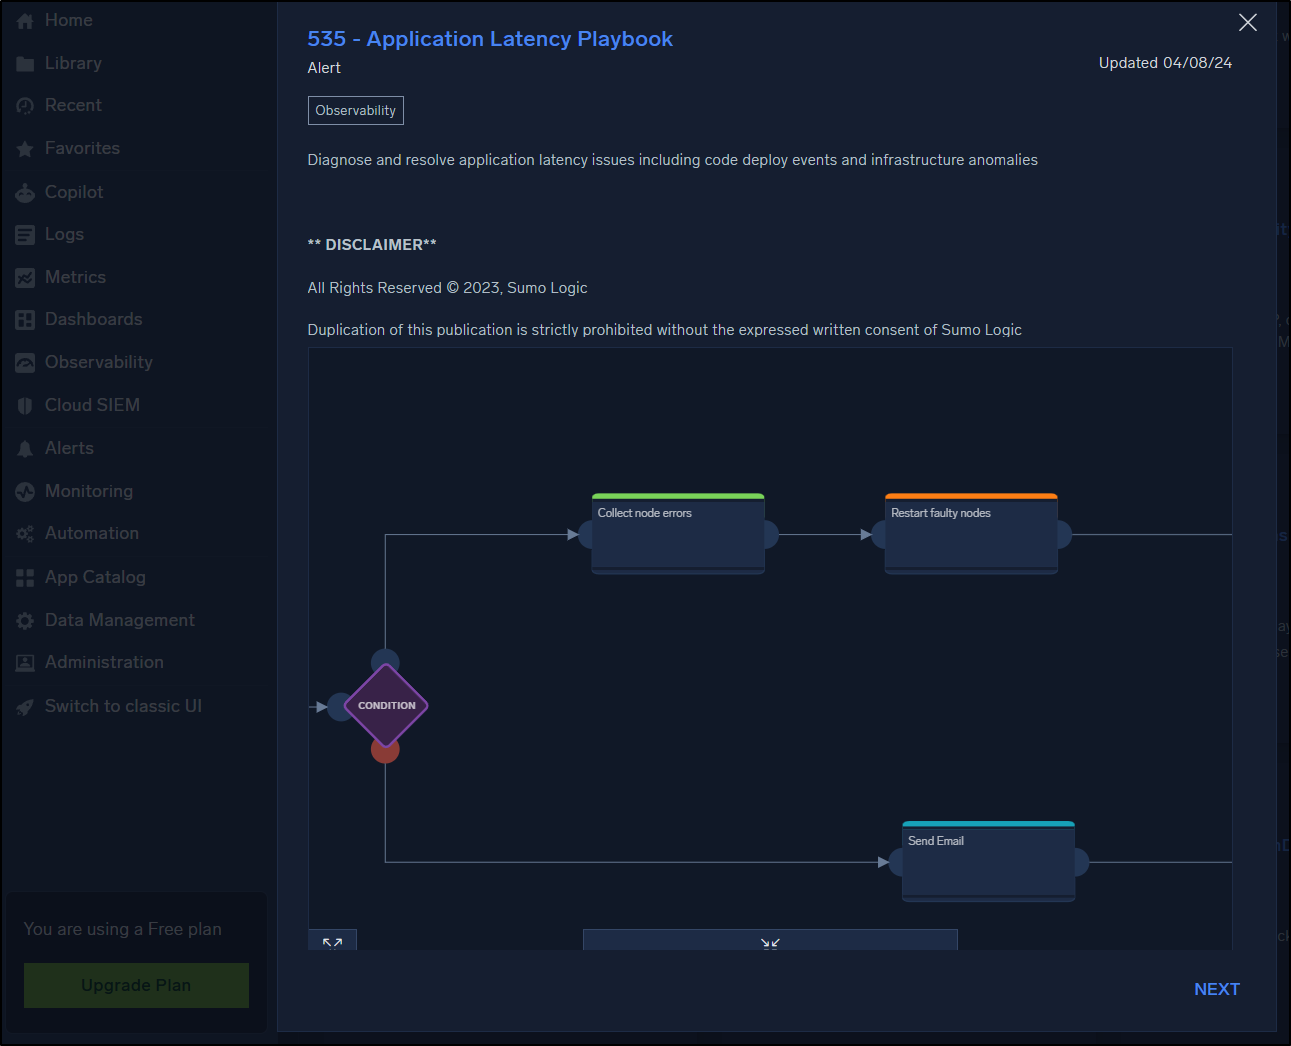
We could detect and restart faulty nodes
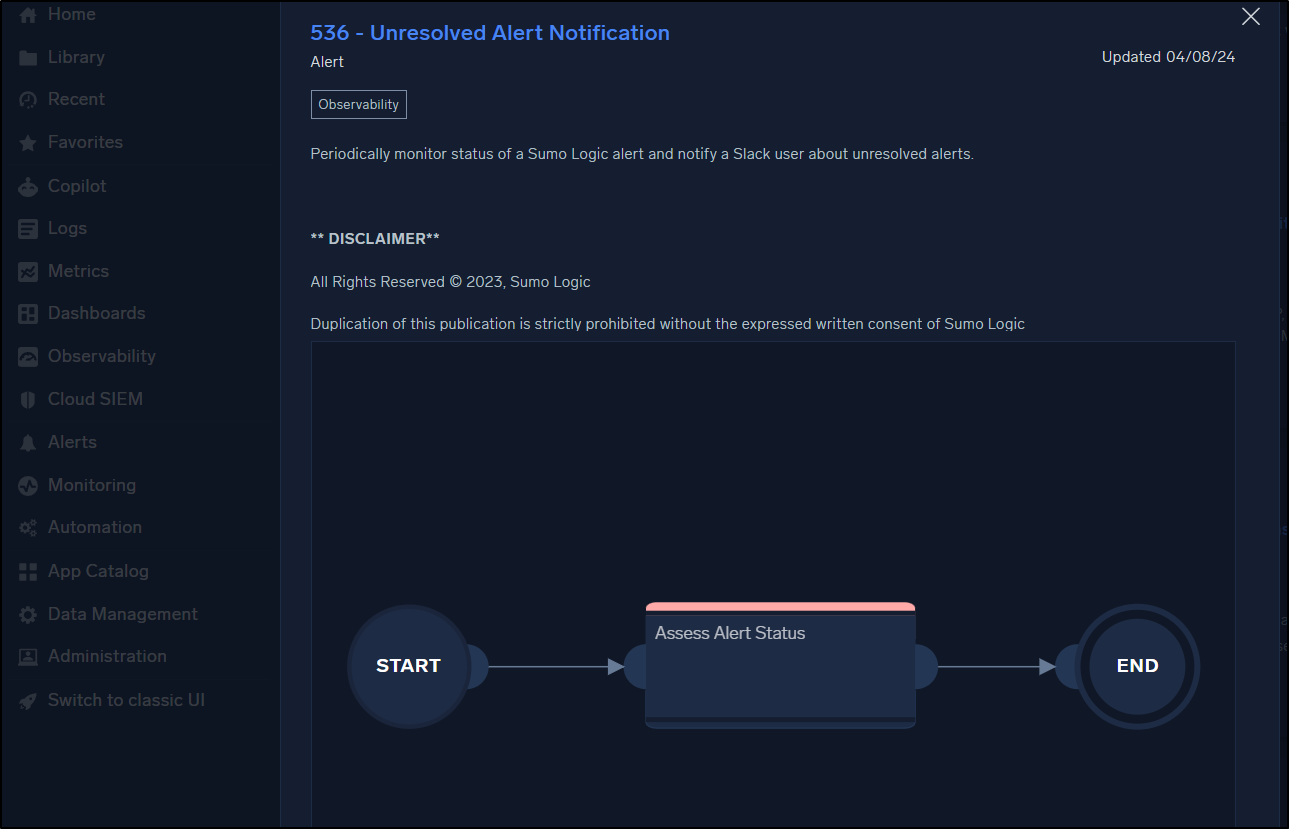
Or perhaps update our on-call Slack channel with the status of tickets
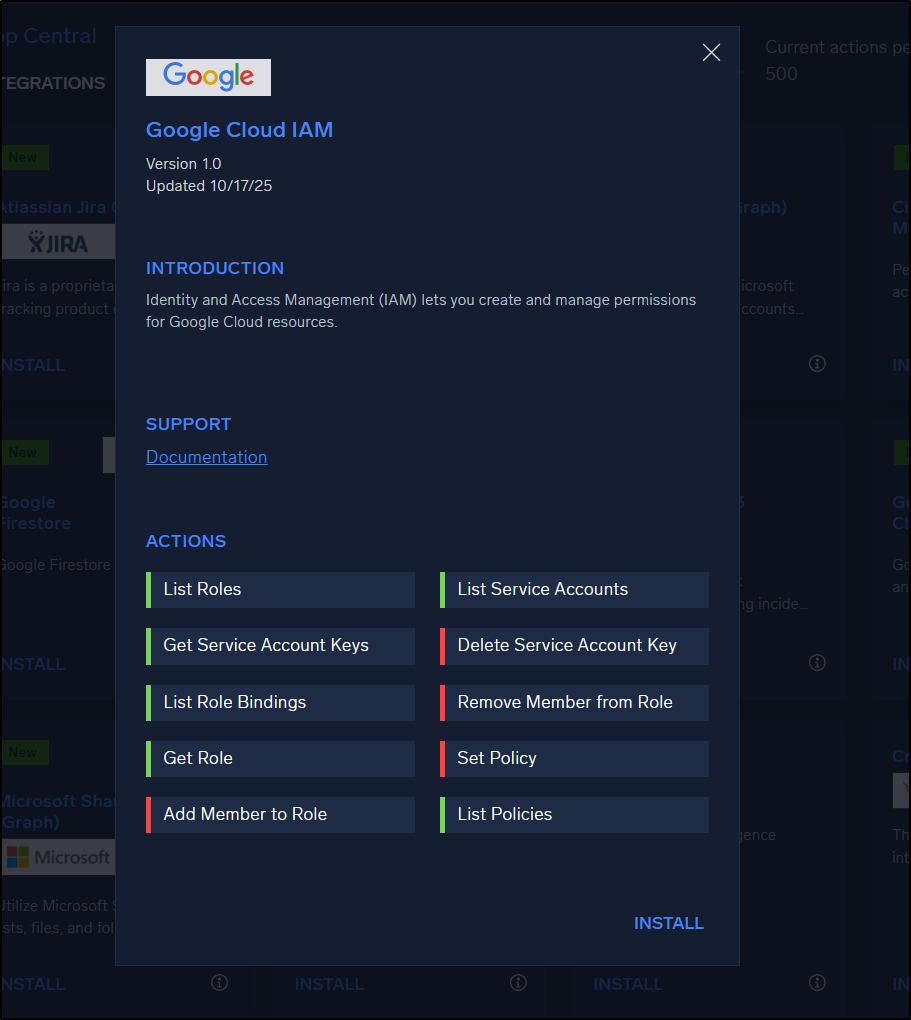
Integrations
There are well over 300 integrations we can add in as well
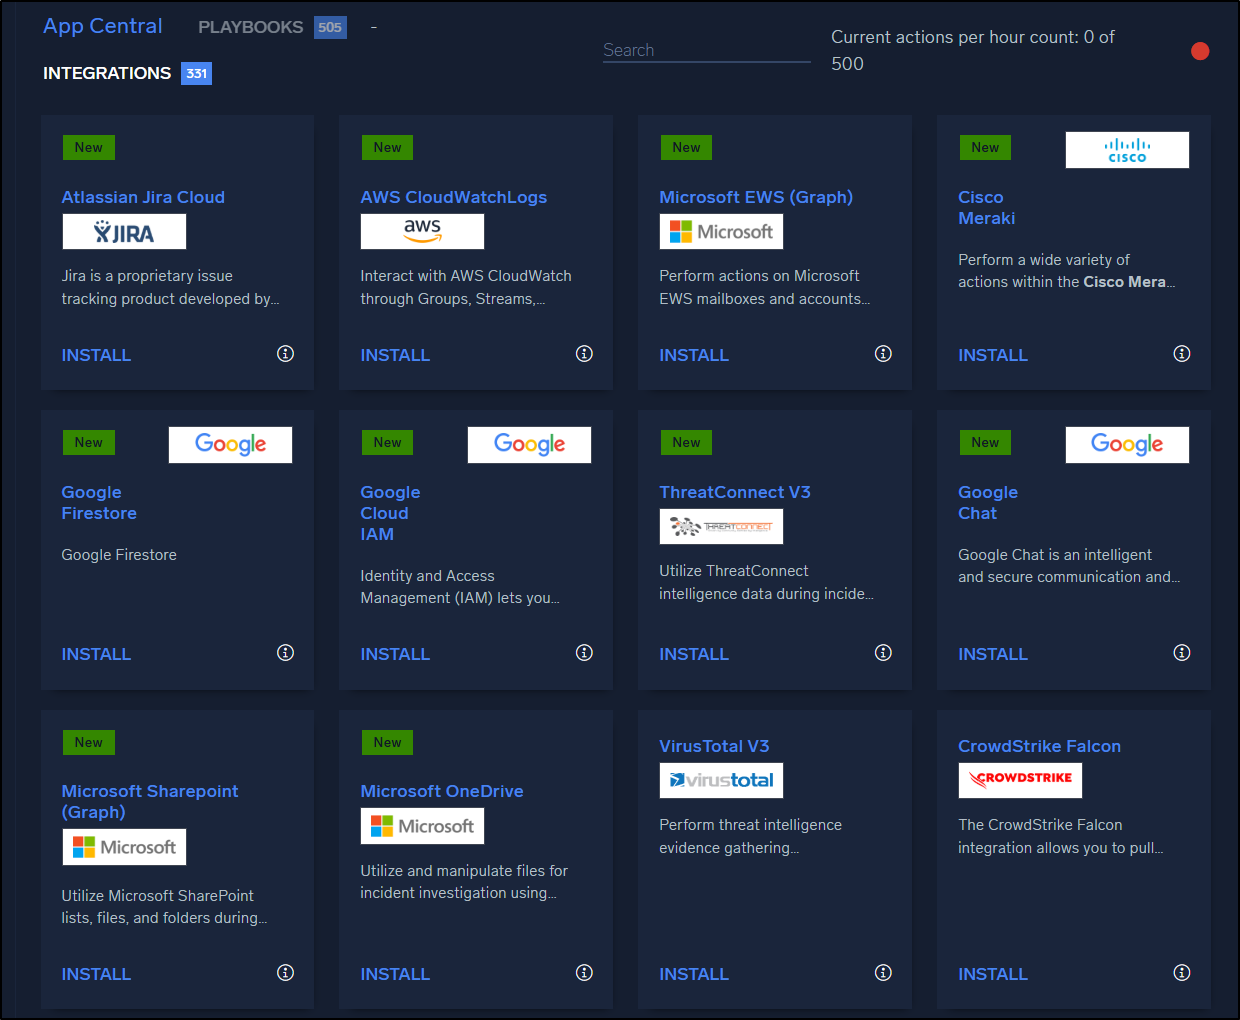
It almost feels like an MCP server in that we see the Integration then the specific actions it wants to be able to take:
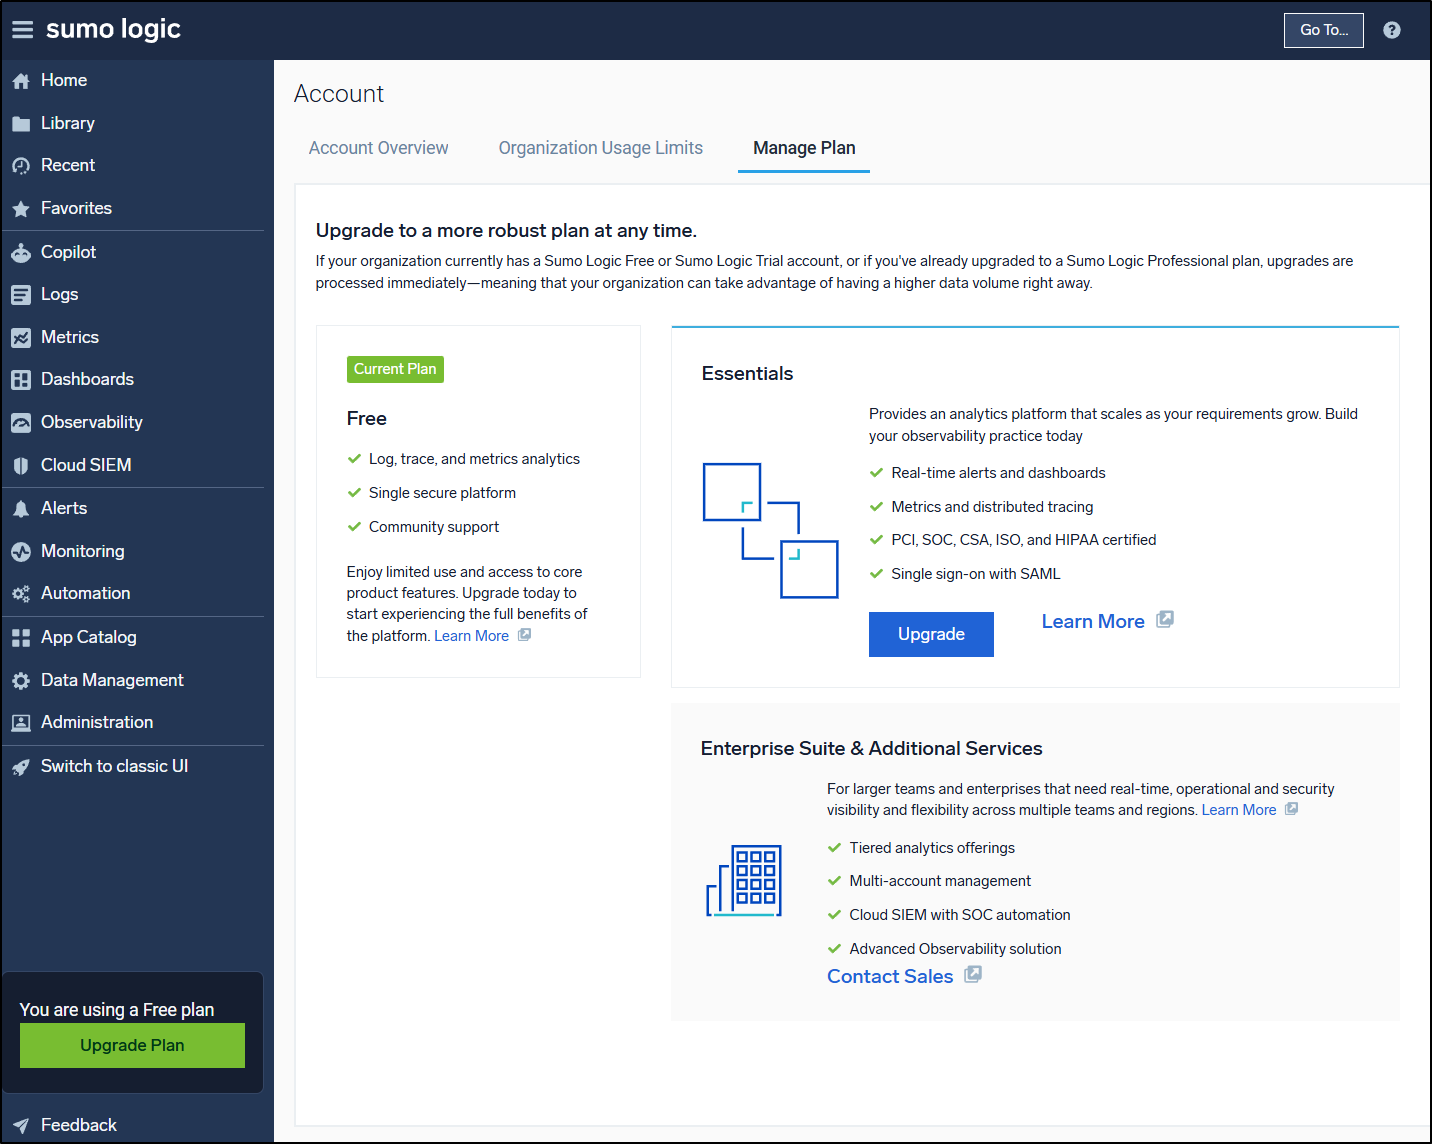
Free plan
Presently, I’m in the free plan
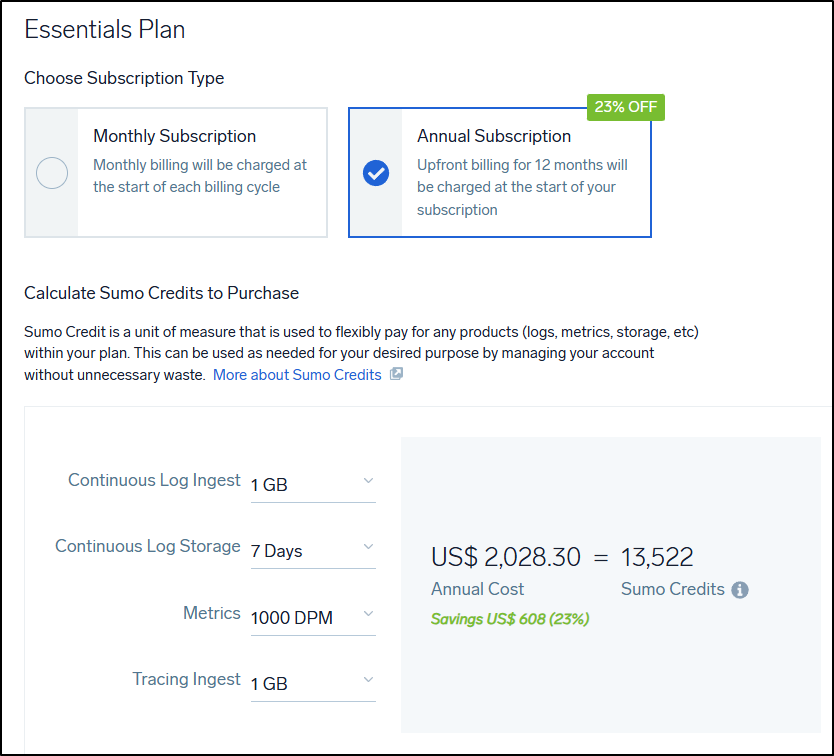
My challenge is that the next level up, if I turn all the settings to their lowest - 1Gb of Logs, 7 days of storage, 1000 DPM metrics and 1Gb of trace data, I’m looking at US$219 a month
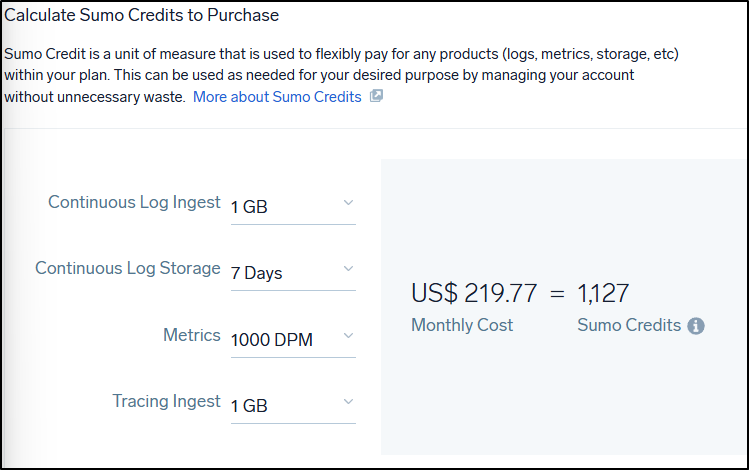
or $2028/year
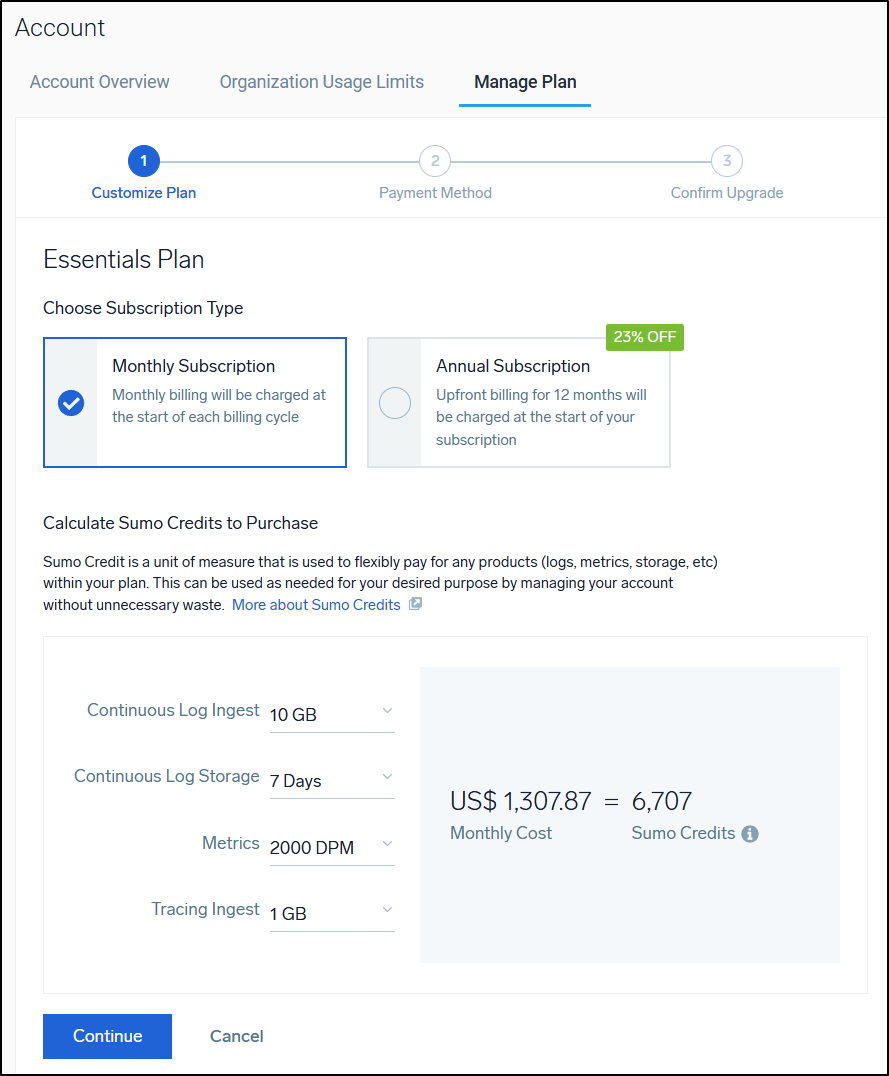
If I set more reasonable values of 10Gb of Logs and 2000 DPM metrics, I would be at $1300/mo.
For me, that’s a hard swing to make.
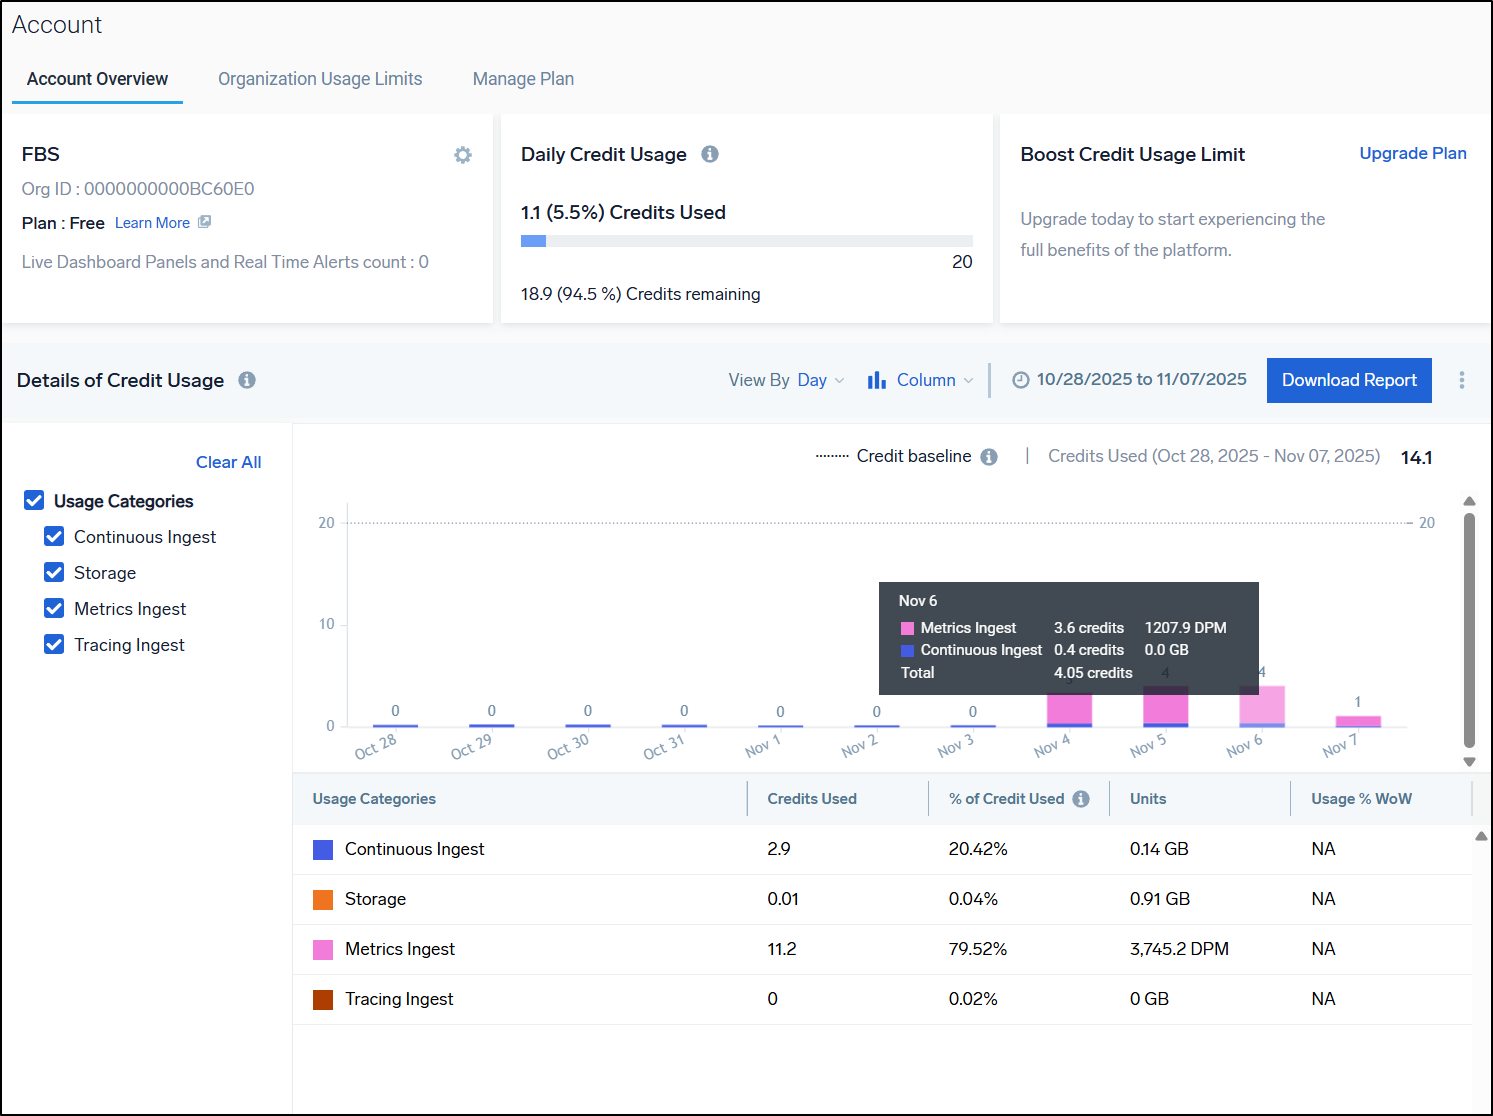
As it stands, I’m pulling 1200 DPM a day - in the free tier
Summary
This was a quick covering of using Sumo Logic with Open Telemetry with a focus on traces. I know the scope was narrow - but from my last series in Jan of 2022 there has been A LOT of changes. I was just reviewing my summary from that 3 part series and noted the need for RunDeck for automation, a cluster agent that fell over and generally requiring lots and lots of scripting to get things to work.
I do think I want to do a part 2 and really dig into the automations. I’m worried about costs as they need something between “free” which is very generous and “essentials” which is not. I often like providers that have a “Hobbyist option that limits users and systems, but lets me really explore the tool.