

Published: Aug 5, 2025 by Isaac Johnson
I saw this article on Marius about FastTrack which can track weight loss and intermittent fasting. Another on my list from his blog is Gancio which is like an Open-Source meetup.com site. We’ll setup both in Kubernetes and see how well they work.
Lastly, from a post a while ago by Marius in April comes CoreControl. I’m going to set this up locally in Docker and then Kubernetes and really give it a go. CoreControl is similar to Beszel in that it’s for tracking servers, up-time and usage but also adds Application monitoring on top of it.
Fastapp
The Github page has a simple docker run
docker run -d \
  --name fasttrack \
  -p 3004:80 \
  -v fasttrack-data:/data \
  --restart unless-stopped \
  proteinman81/fasttrack:latest
Let’s convert that to a Kubernetes Manifest
---
apiVersion: v1
kind: PersistentVolumeClaim
metadata:
  name: fasttrack-data-pvc
spec:
  accessModes:
    - ReadWriteOnce
  storageClassName: local-path
  resources:
    requests:
      storage: 1Gi
---
apiVersion: apps/v1
kind: Deployment
metadata:
  name: fasttrack
spec:
  replicas: 1
  selector:
    matchLabels:
      app: fasttrack
  template:
    metadata:
      labels:
        app: fasttrack
    spec:
      containers:
        - name: fasttrack
          image: proteinman81/fasttrack:latest
          ports:
            - containerPort: 80
          volumeMounts:
            - name: data
              mountPath: /data
      volumes:
        - name: data
          persistentVolumeClaim:
            claimName: fasttrack-data-pvc
---
apiVersion: v1
kind: Service
metadata:
  name: fasttrack
spec:
  type: ClusterIP
  selector:
    app: fasttrack
  ports:
    - protocol: TCP
      port: 80
      targetPort: 80
---
apiVersion: networking.k8s.io/v1
kind: Ingress
metadata:
  name: fasttrack
spec:
  rules:
    - host: fasttrack.local  # Change this to your desired domain
      http:
        paths:
          - path: /
            pathType: Prefix
            backend:
              service:
                name: fasttrack
                port:
                  number: 80
I’ll also need an A Record
$ az account set --subscription "Pay-As-You-Go" && az network dns record-set a add-record -g idjdnsrg -z tpk.pw -a 75.73.224.240 -n fasttrack
{
  "ARecords": [
    {
      "ipv4Address": "75.73.224.240"
    }
  ],
  "TTL": 3600,
  "etag": "46e71383-ab60-40cb-856c-987e57b7523e",
  "fqdn": "fasttrack.tpk.pw.",
  "id": "/subscriptions/d955c0ba-13dc-44cf-a29a-8fed74cbb22d/resourceGroups/idjdnsrg/providers/Microsoft.Network/dnszones/tpk.pw/A/fasttrack",
  "name": "fasttrack",
  "provisioningState": "Succeeded",
  "resourceGroup": "idjdnsrg",
  "targetResource": {},
  "trafficManagementProfile": {},
  "type": "Microsoft.Network/dnszones/A"
}
I can then use that instead of the “.local” ingress
---
apiVersion: networking.k8s.io/v1
kind: Ingress
metadata:
  annotations:
    cert-manager.io/cluster-issuer: azuredns-tpkpw
    ingress.kubernetes.io/ssl-redirect: "true"
    kubernetes.io/ingress.class: nginx
    kubernetes.io/tls-acme: "true"
    nginx.ingress.kubernetes.io/proxy-body-size: "0"
    nginx.ingress.kubernetes.io/proxy-read-timeout: "3600"
    nginx.ingress.kubernetes.io/proxy-send-timeout: "3600"
    nginx.ingress.kubernetes.io/ssl-redirect: "true"
    nginx.org/client-max-body-size: "0"
    nginx.org/proxy-connect-timeout: "3600"
    nginx.org/proxy-read-timeout: "3600"
    nginx.org/websocket-services: fasttrack
  name: fasttrack-ingress
spec:
  rules:
  - host: fasttrack.tpk.pw
    http:
      paths:
      - backend:
          service:
            name: fasttrack
            port:
              number: 80
        path: /
        pathType: Prefix
  tls:
  - hosts:
    - fasttrack.tpk.pw
    secretName: fasttrack-tls
Then apply
$ kubectl apply -f ./fasttrack.yaml
persistentvolumeclaim/fasttrack-data-pvc created
deployment.apps/fasttrack created
service/fasttrack created
Warning: annotation "kubernetes.io/ingress.class" is deprecated, please use 'spec.ingressClassName' instead
ingress.networking.k8s.io/fasttrack-ingress created
When I see the cert is satisfied
$ kubectl get cert fasttrack-tls
NAME            READY   SECRET          AGE
fasttrack-tls   False   fasttrack-tls   53s
$ kubectl get cert fasttrack-tls
NAME            READY   SECRET          AGE
fasttrack-tls   True    fasttrack-tls   3m5s
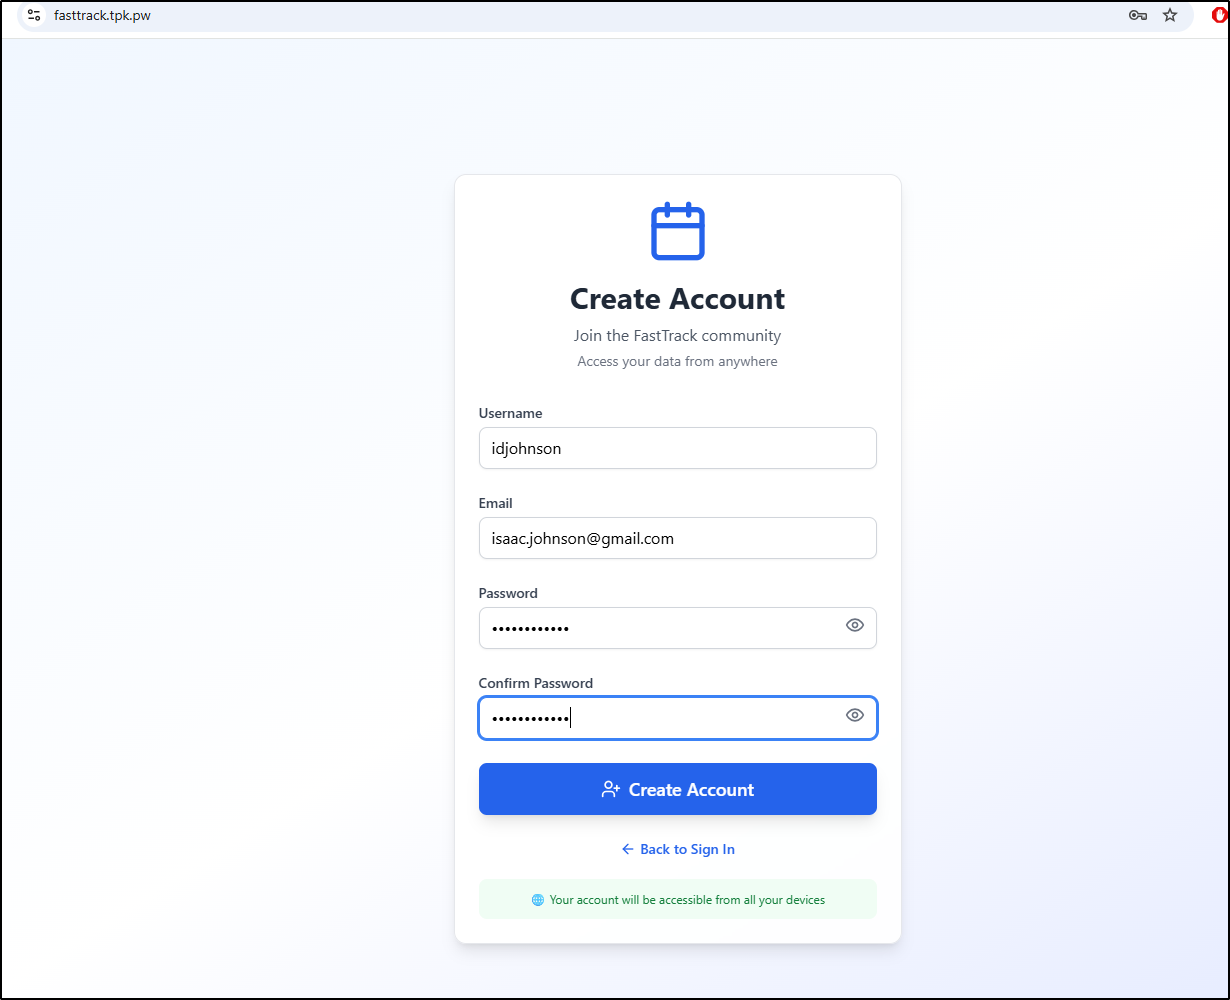
The first time in we can create an account
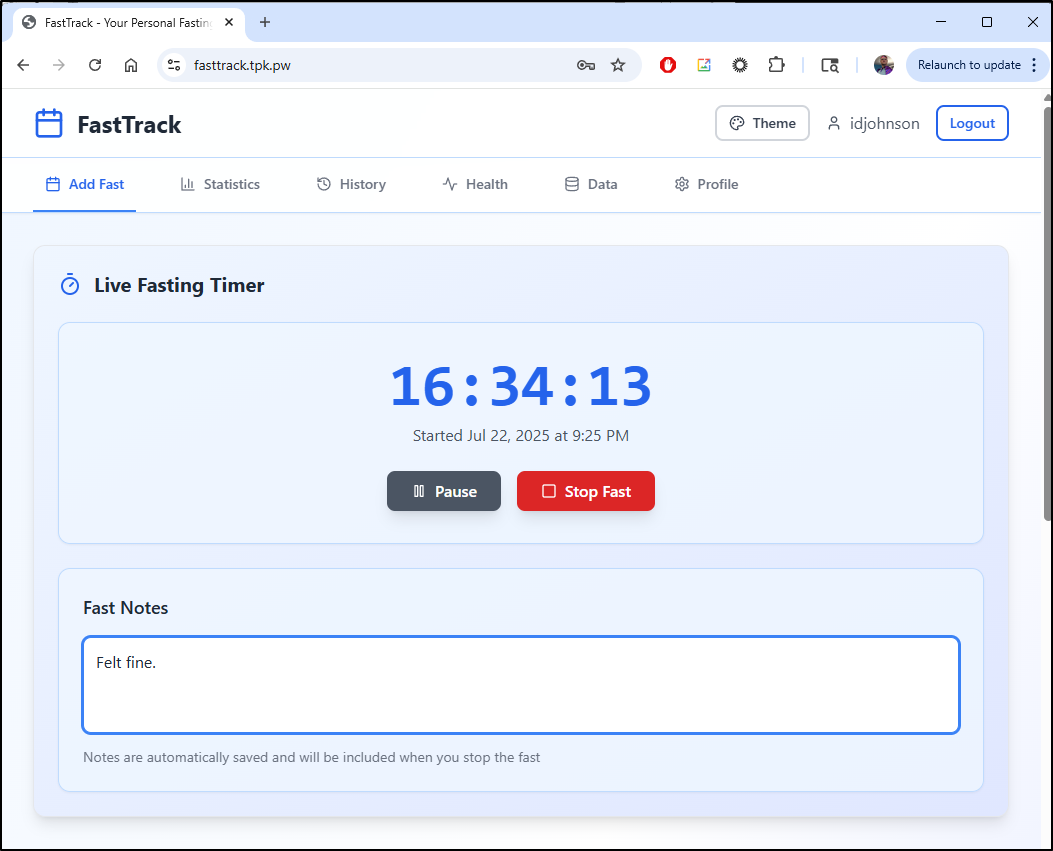
I can then track fasts in the app
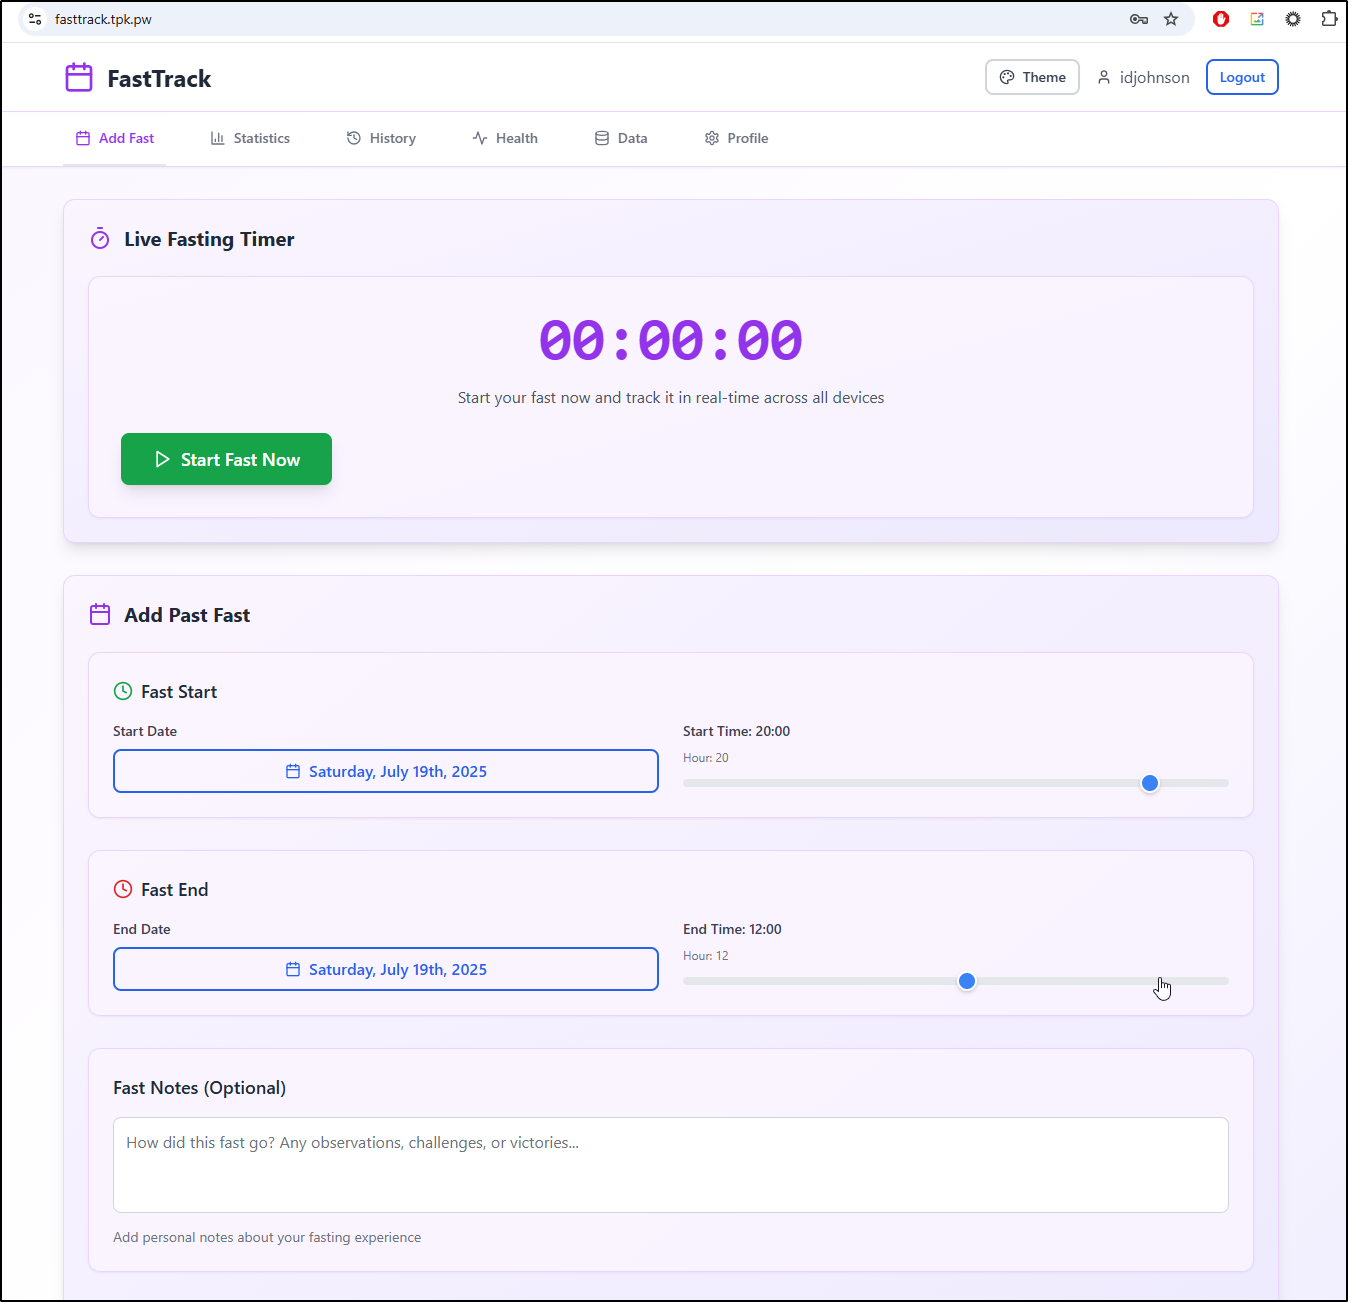
I can also just use the webapp to stop a fast and make notes
I haven’t done any multi-day fasts in a few weeks. I might do it again soon but I question the championing of self-starvation as a goal.
Part of my challenge with fasts is over-eating when I’m done. I feel there is a diet component missing here.
That said, it’s a good app for tracking this kind of thing and as long as you know what you’re doing, it can help keep track of fast durations.
Gancio
I saw a while back a A Mariushosting post about Gancio, a shared agenda/meetup dashboard for communities.
We can see the docker steps on their Install page but I almost made the mistake of using Github (which was 6 years old in some cases).
This project uses a framagit.org repo instead which is a Gitlab community edition hosted by Framasoft
The docker-compose for sqlite can be found at https://gancio.org/docker/sqlite/docker-compose.yml
version: '3'

services:
  gancio:
    restart: always
    image: cisti/gancio
    container_name: gancio
    environment:
      - PATH=$PATH:/home/node/.yarn/bin
      - GANCIO_DATA=/home/node/data
      - NODE_ENV=production
      - GANCIO_DB_DIALECT=sqlite
      - GANCIO_DB_STORAGE=./gancio.sqlite
    volumes:
      - ./data:/home/node/data
    ports:
      - "127.0.0.1:13120:13120"
I see the latest images are on dockerhub
Perhaps we can just launch this as a Kubernetes YAML manifest with a PVC:
---
apiVersion: v1
kind: PersistentVolumeClaim
metadata:
  name: gancio-data-pvc
spec:
  accessModes:
    - ReadWriteOnce
  storageClassName: local-path
  resources:
    requests:
      storage: 1Gi
---
apiVersion: apps/v1
kind: Deployment
metadata:
  name: gancio
spec:
  replicas: 1
  selector:
    matchLabels:
      app: gancio
  template:
    metadata:
      labels:
        app: gancio
    spec:
      containers:
        - name: gancio
          image: cisti/gancio:1.27.0
          ports:
            - containerPort: 13120
          env:
            - name: PATH
              value: "/usr/local/sbin:/usr/local/bin:/usr/sbin:/usr/bin:/sbin:/bin:/home/node/.yarn/bin"
            - name: GANCIO_DATA
              value: "/home/node/data"
            - name: NODE_ENV
              value: "production"
            - name: GANCIO_DB_DIALECT
              value: "sqlite"
            - name: GANCIO_DB_STORAGE
              value: "./gancio.sqlite"
            - name: GANCIO_PORT
              value: "13120"
            - name: GANCIO_HOST
              value: "0.0.0.0"
          volumeMounts:
            - name: data
              mountPath: /home/node/data
      volumes:
        - name: data
          persistentVolumeClaim:
            claimName: gancio-data-pvc
---
apiVersion: v1
kind: Service
metadata:
  name: gancio
spec:
  type: ClusterIP
  selector:
    app: gancio
  ports:
    - protocol: TCP
      port: 80
      targetPort: 13120
---
apiVersion: networking.k8s.io/v1
kind: Ingress
metadata:
  name: gancio
  annotations:
    cert-manager.io/cluster-issuer: azuredns-tpkpw
    nginx.ingress.kubernetes.io/proxy-body-size: "0"
    nginx.ingress.kubernetes.io/proxy-read-timeout: "3600"
    nginx.ingress.kubernetes.io/proxy-send-timeout: "3600"
    nginx.ingress.kubernetes.io/ssl-redirect: "true"
    ingress.kubernetes.io/ssl-redirect: "true"
    kubernetes.io/ingress.class: nginx
    kubernetes.io/tls-acme: "true"
    nginx.org/client-max-body-size: "0"
    nginx.org/proxy-connect-timeout: "3600"
    nginx.org/proxy-read-timeout: "3600"
    nginx.org/websocket-services: gancio
spec:
  rules:
    - host: gancio.tpk.pw
      http:
        paths:
          - path: /
            pathType: Prefix
            backend:
              service:
                name: gancio
                port:
                  number: 80
  tls:
    - hosts:
        - gancio.tpk.pw
      secretName: gancio-tls
I just need to make the A Record
$ az account set --subscription "Pay-As-You-Go" && az network dns record-set a add-record -g idjdnsrg -z tpk.pw -a 75.73.224.240 -n gancio
{
  "ARecords": [
    {
      "ipv4Address": "75.73.224.240"
    }
  ],
  "TTL": 3600,
  "etag": "a49b9dd1-bb8f-467c-b1cd-0735907cd863",
  "fqdn": "gancio.tpk.pw.",
  "id": "/subscriptions/d955c0ba-13dc-44cf-a29a-8fed74cbb22d/resourceGroups/idjdnsrg/providers/Microsoft.Network/dnszones/tpk.pw/A/gancio",
  "name": "gancio",
  "provisioningState": "Succeeded",
  "resourceGroup": "idjdnsrg",
  "targetResource": {},
  "trafficManagementProfile": {},
  "type": "Microsoft.Network/dnszones/A"
}
Then apply
$ kubectl apply -f ./gancio.yml
persistentvolumeclaim/gancio-data-pvc created
deployment.apps/gancio created
service/gancio created
Warning: annotation "kubernetes.io/ingress.class" is deprecated, please use 'spec.ingressClassName' instead
ingress.networking.k8s.io/gancio created
When I see the cert is ready
$ kubectl get cert gancio-tls
NAME         READY   SECRET       AGE
gancio-tls   False   gancio-tls   27s
$ kubectl get cert gancio-tls
NAME         READY   SECRET       AGE
gancio-tls   True    gancio-tls   52s
I noticed the pod was in a crashloop
$ kubectl get po | grep gancio
gancio-b647fdf94-8w48g                               0/1     CrashLoopBackOff   6 (2m54s ago)     11m
Seems it doesn’t like the port selection
$ kubectl logs gancio-b647fdf94-8w48g
📅 gancio - v1.27.0 - A shared agenda for local communities (nodejs: v20.19.2)
ℹ > Reading configuration from: /home/node/data/config.json
ℹ > Configuration file does not exists...
ℹ Modern bundles are detected. Modern mode (server) is enabled now.
2025-07-23T21:10:07.144Z info: Logging to /home/node/data/logs/gancio.log (level: debug)
2025-07-23T21:10:11.368Z debug: Connecting to DB: {"dialect":"sqlite","storage":"/home/node/data/gancio.sqlite","logging":false,"dialectOptions":{"autoJsonMap":true}}

 ERROR  options.port should be >= 0 and < 65536. Received type string ('tcp://10.43.151.120:80').

    at Server.listen (node:net:2059:5)
    at server (node_modules/@nuxt/server-edge/dist/server.js:349:22)
    at new Promise (<anonymous>)
    at Listener.listen (node_modules/@nuxt/server-edge/dist/server.js:347:27)
    at Server.listen (node_modules/@nuxt/server-edge/dist/server.js:672:20)
    at async Object.run (node_modules/@nuxt/cli-edge/dist/cli-start.js:105:5)
    at async NuxtCommand.run (node_modules/@nuxt/cli-edge/dist/cli-index.js:356:7)
I can now see the setup screen
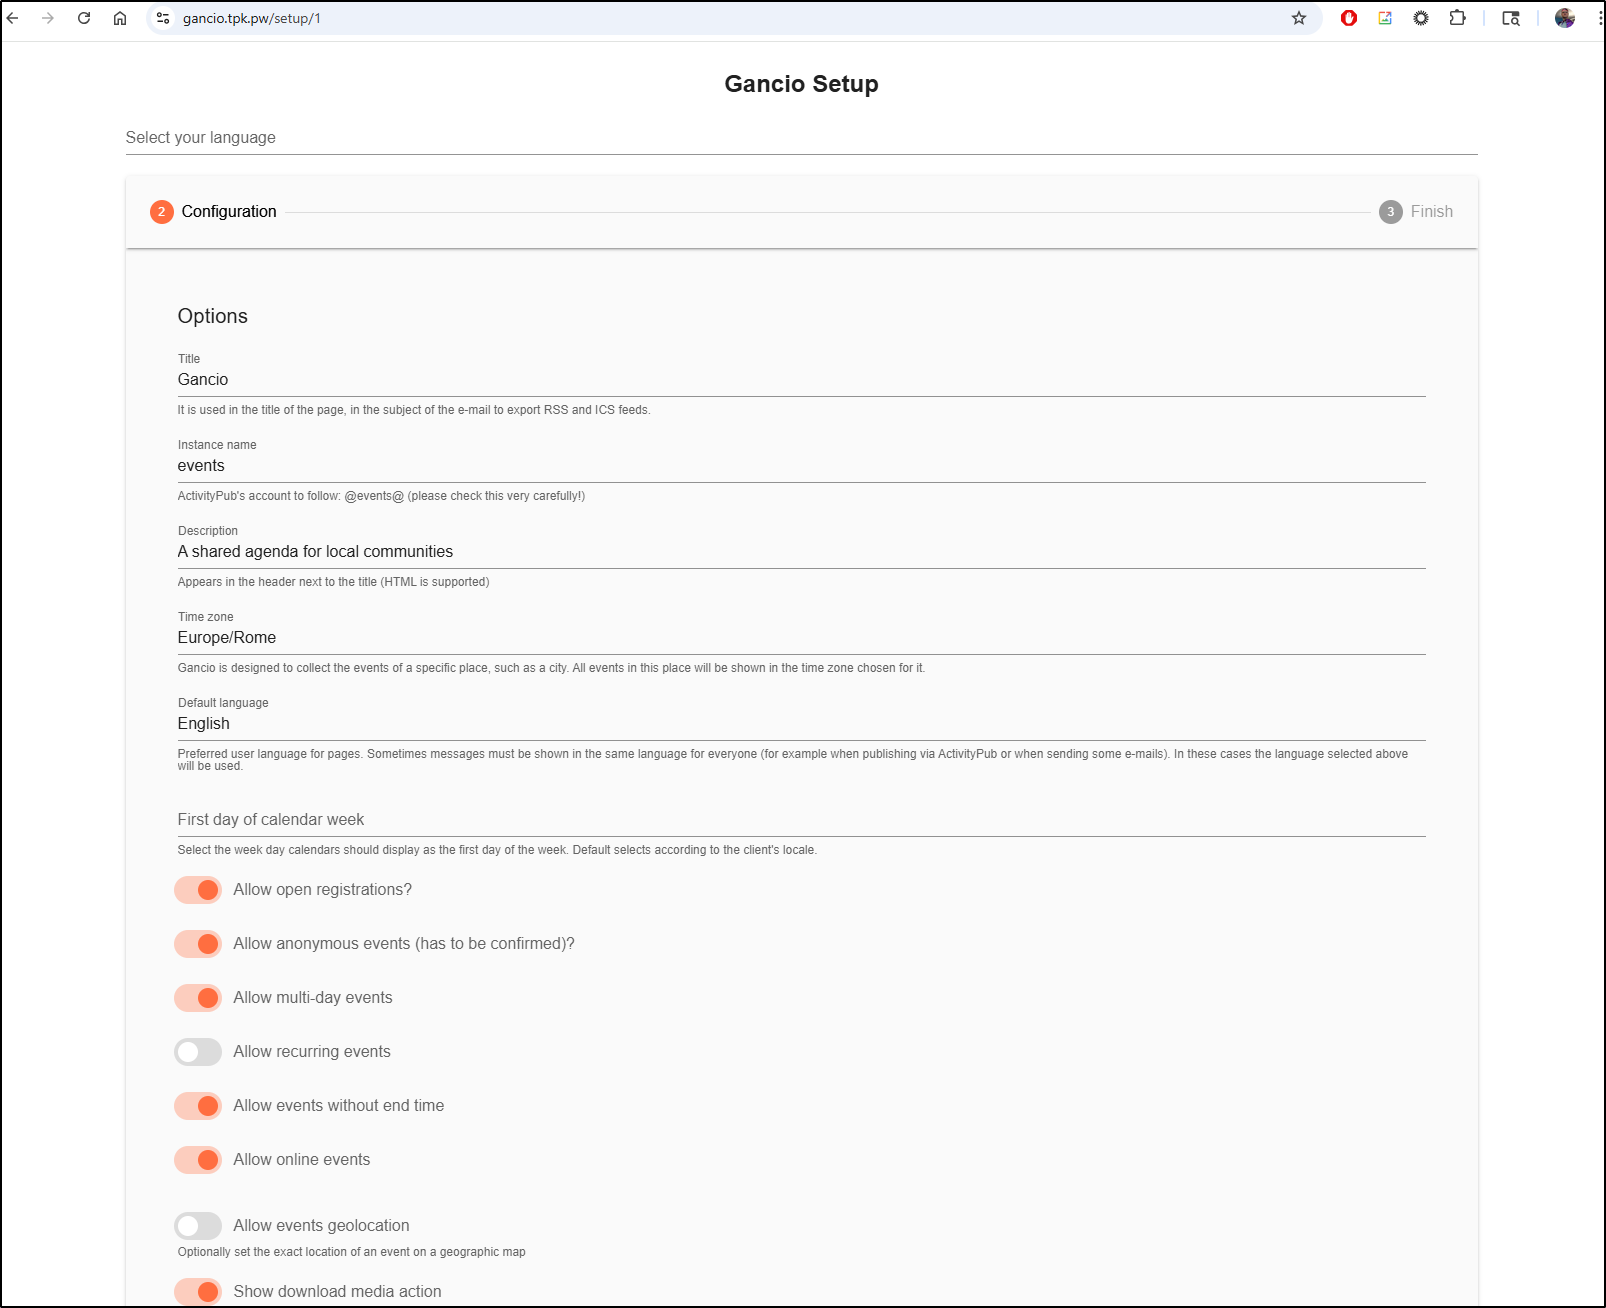
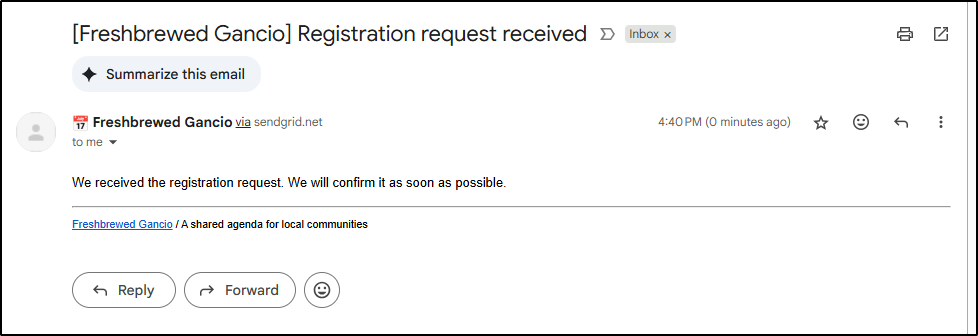
I set up Sendgrid email settings for SMTP. The test email didn’t work, however, later when I went to add a user it did work
I can use my admin login to enable the user (and optionally make them an Admin)
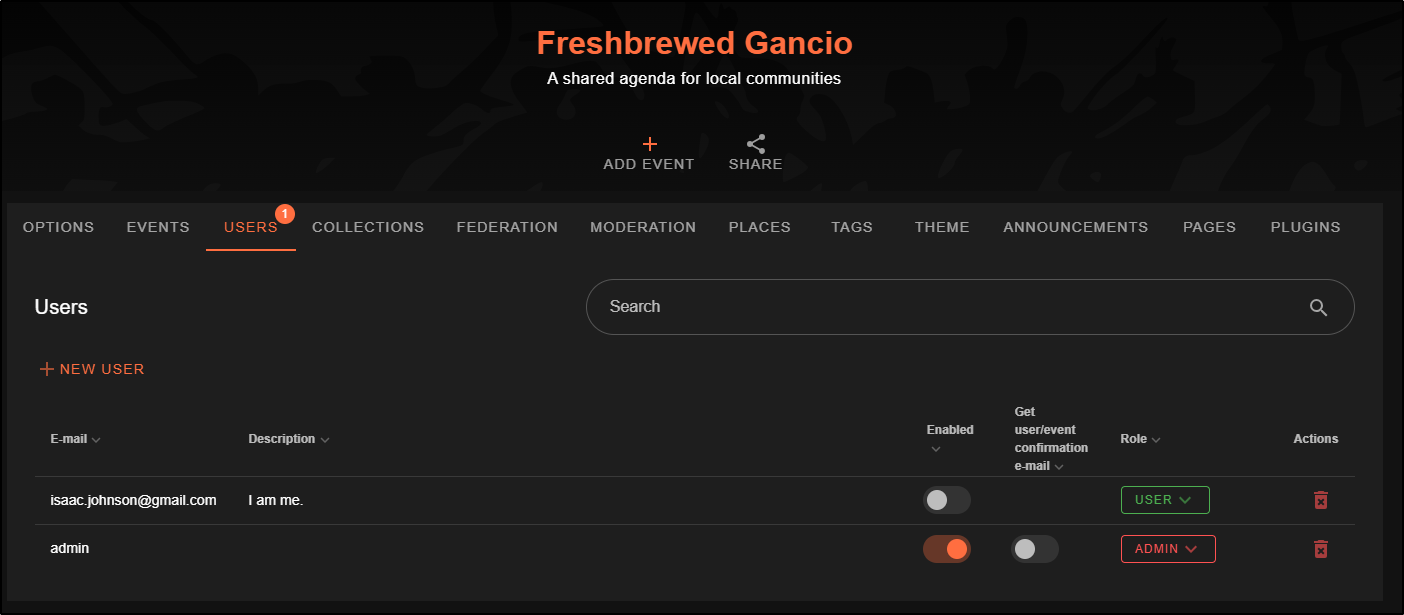
viewing the page anonymously just shows existing events (none), but if we are logged in as an enabled user, we can add events
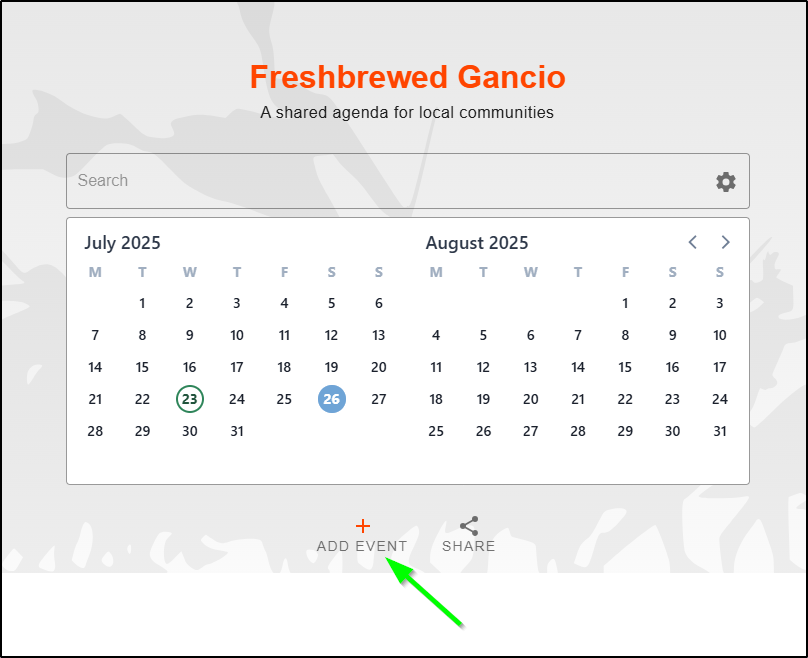
I can add an event
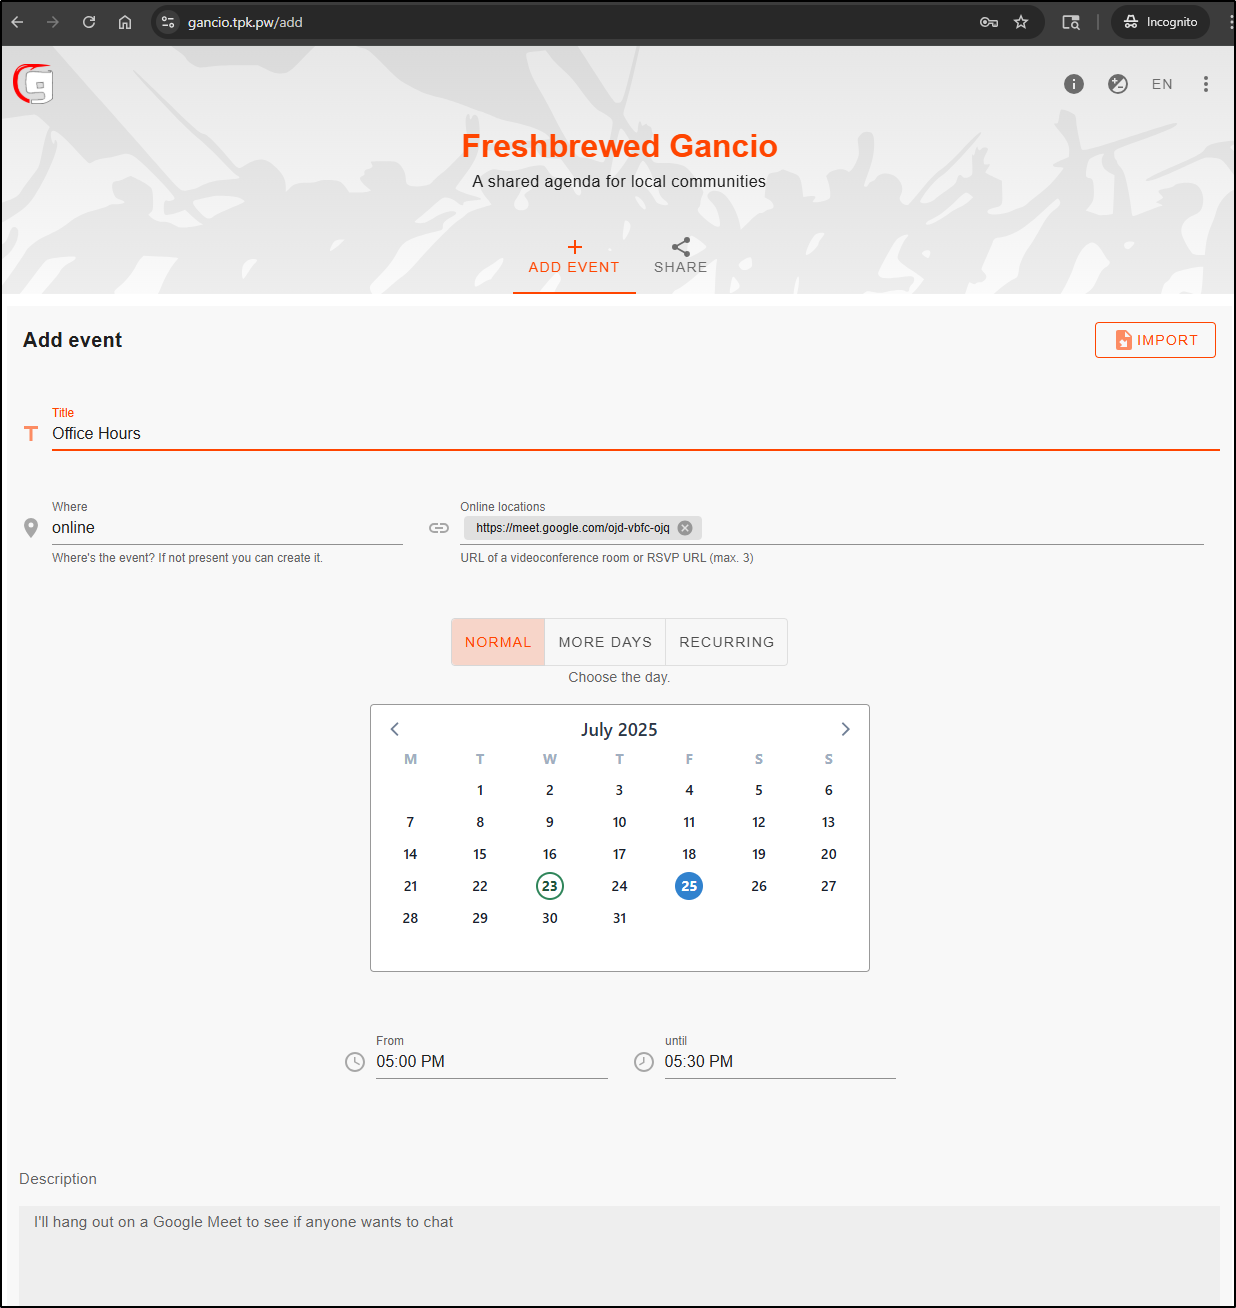
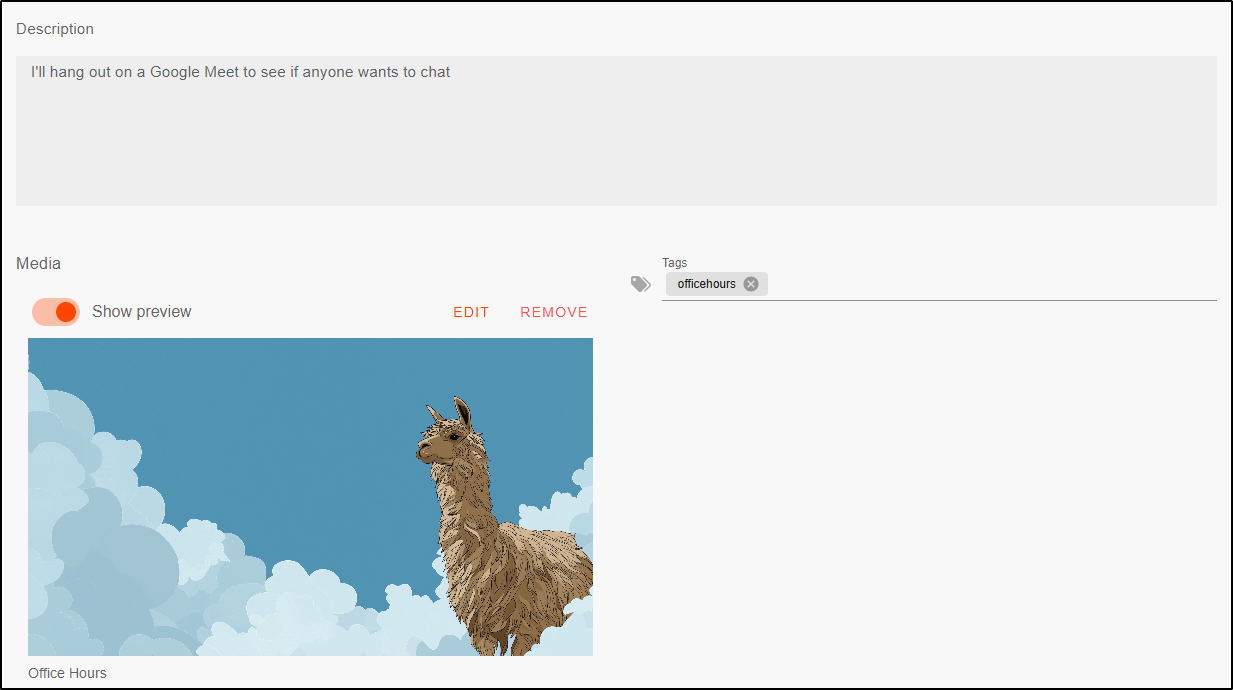
and give it a description and media image as well.
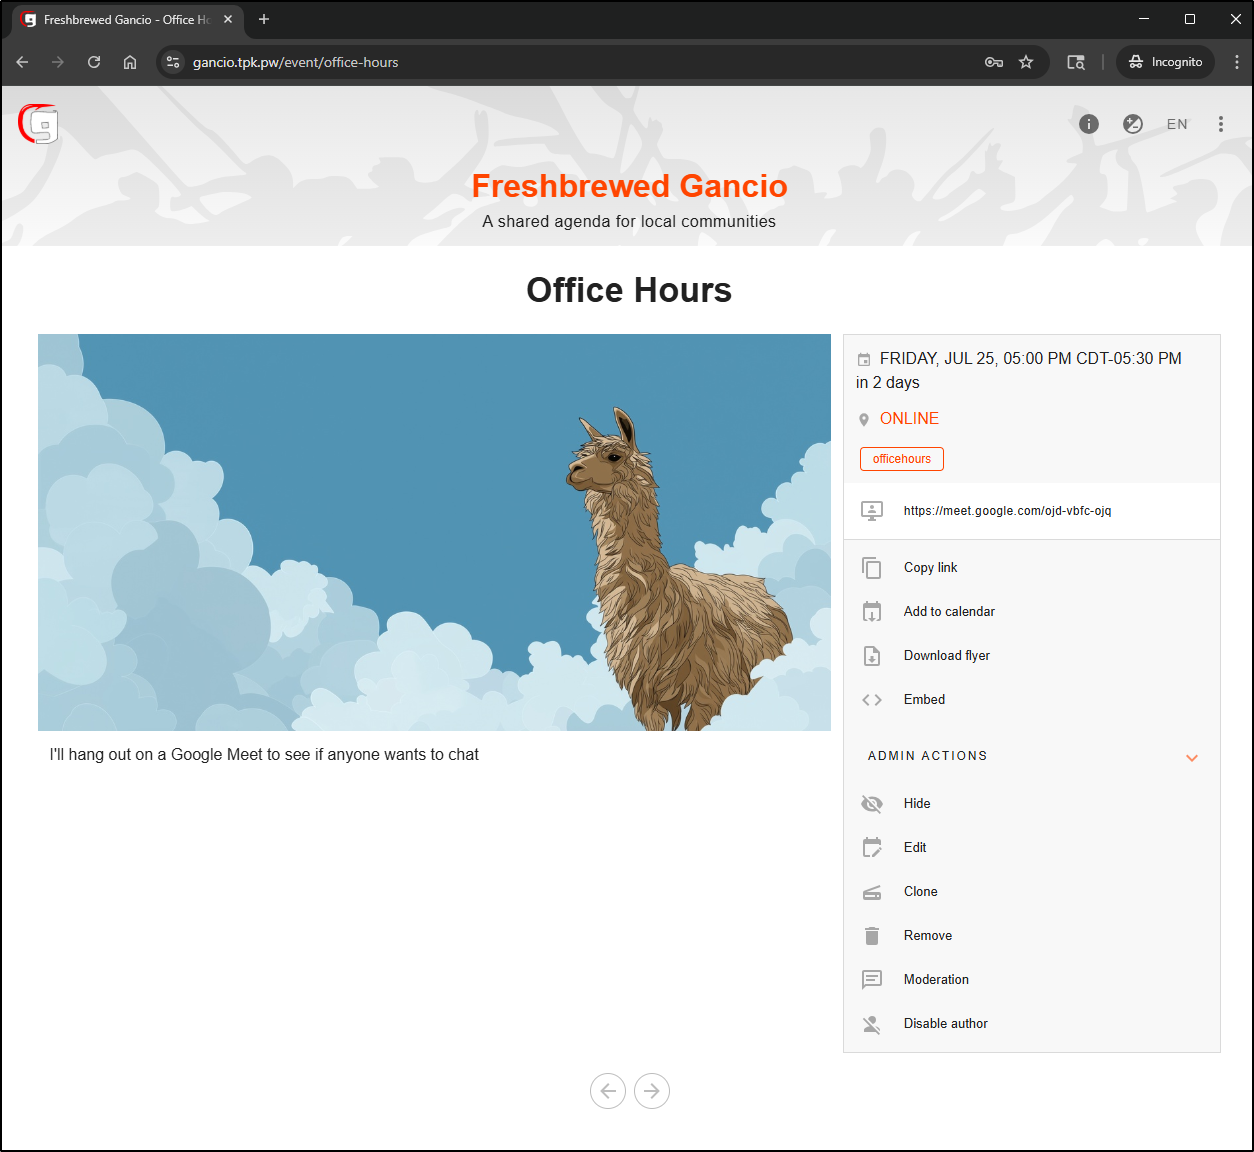
I can now see the event details listed
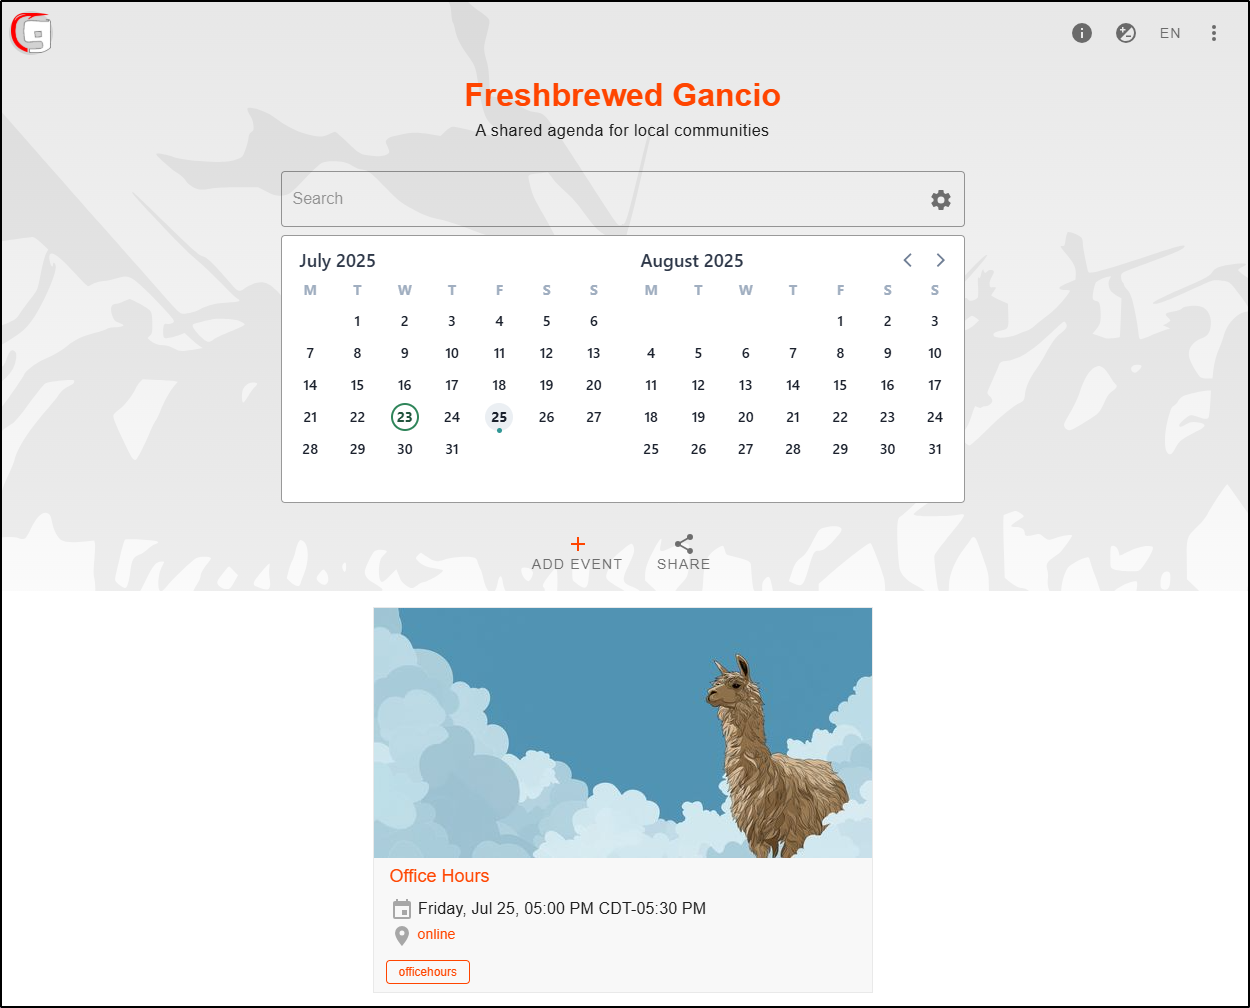
And I can see it in the overview page as well
Because Gancio includes ActivityPub, we can use Mastodon (Fediverse) to follow this.
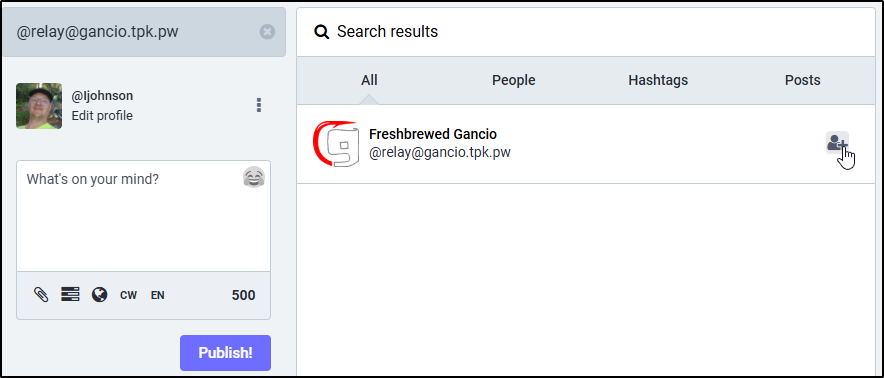
For instance, I can go to my Mastodon instance and search up @relay of my my Gancio instance
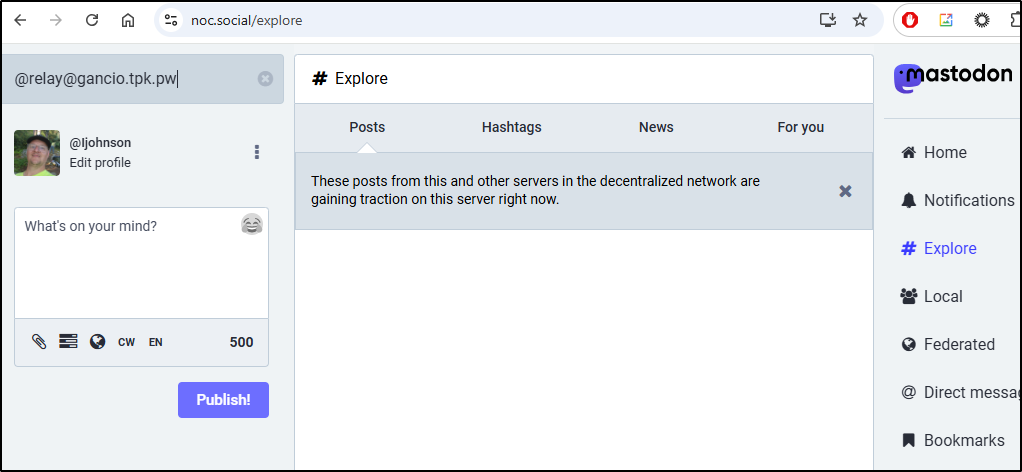
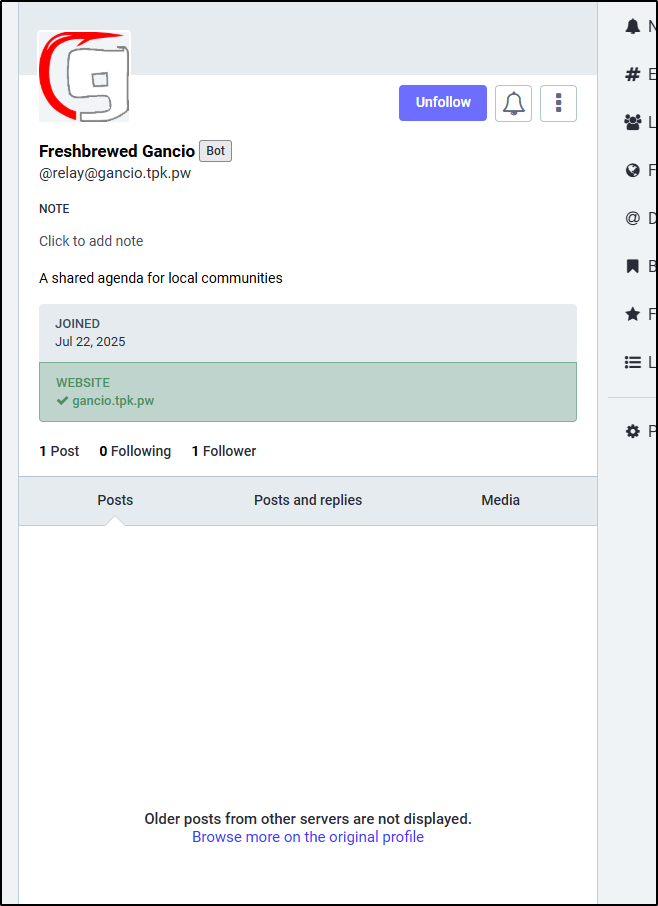
Then follow
Future events will then show up in my Mastodon feed
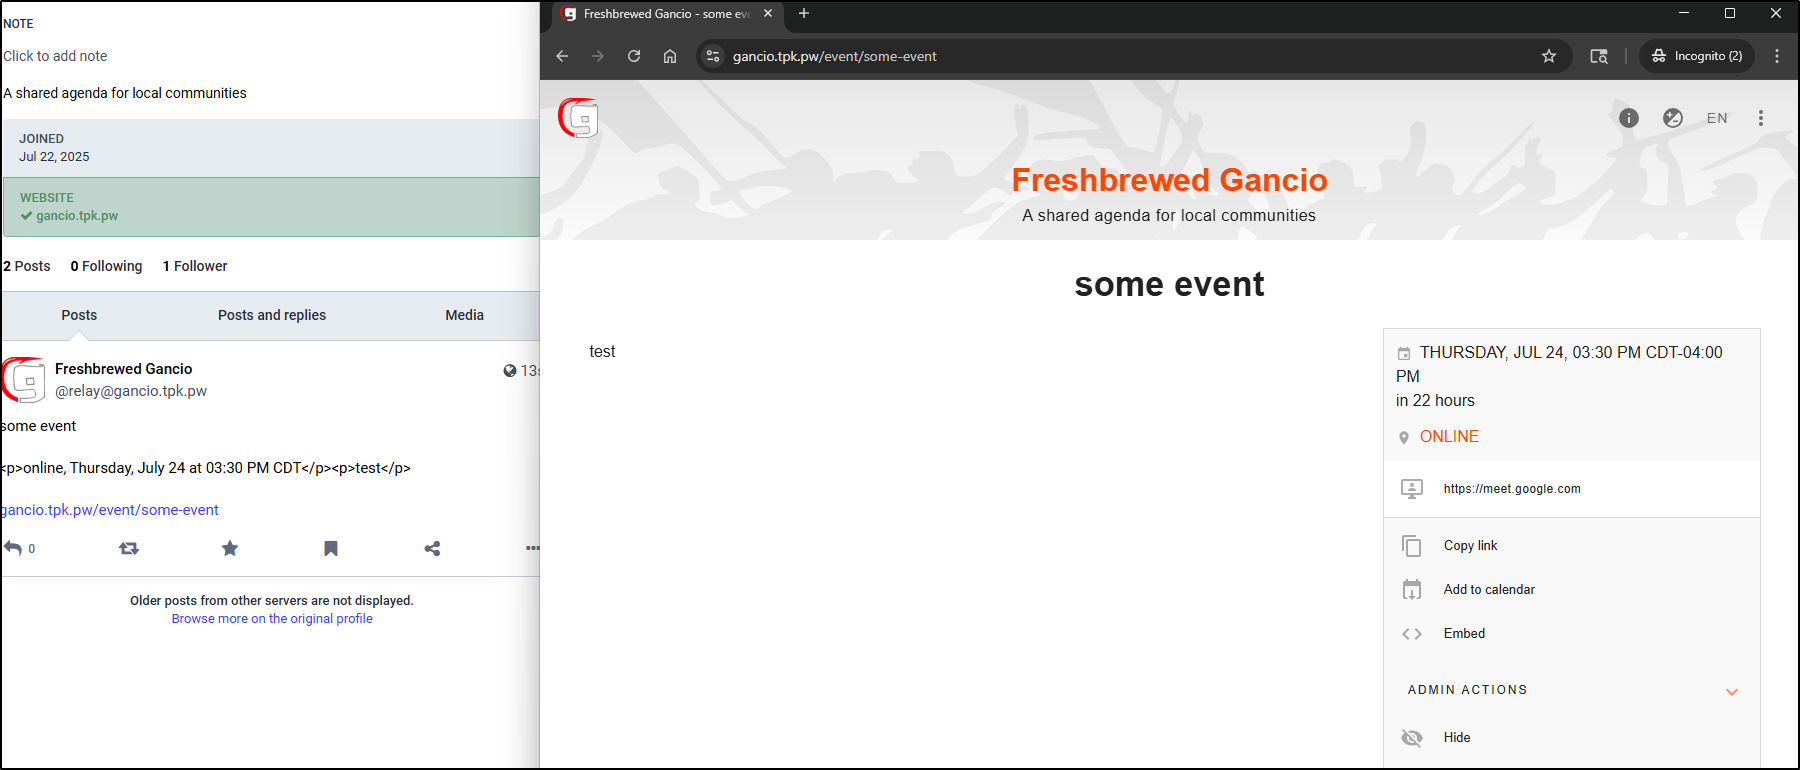
Interestingly, when I removed that test event from Gancio, it also disappeared from my feed
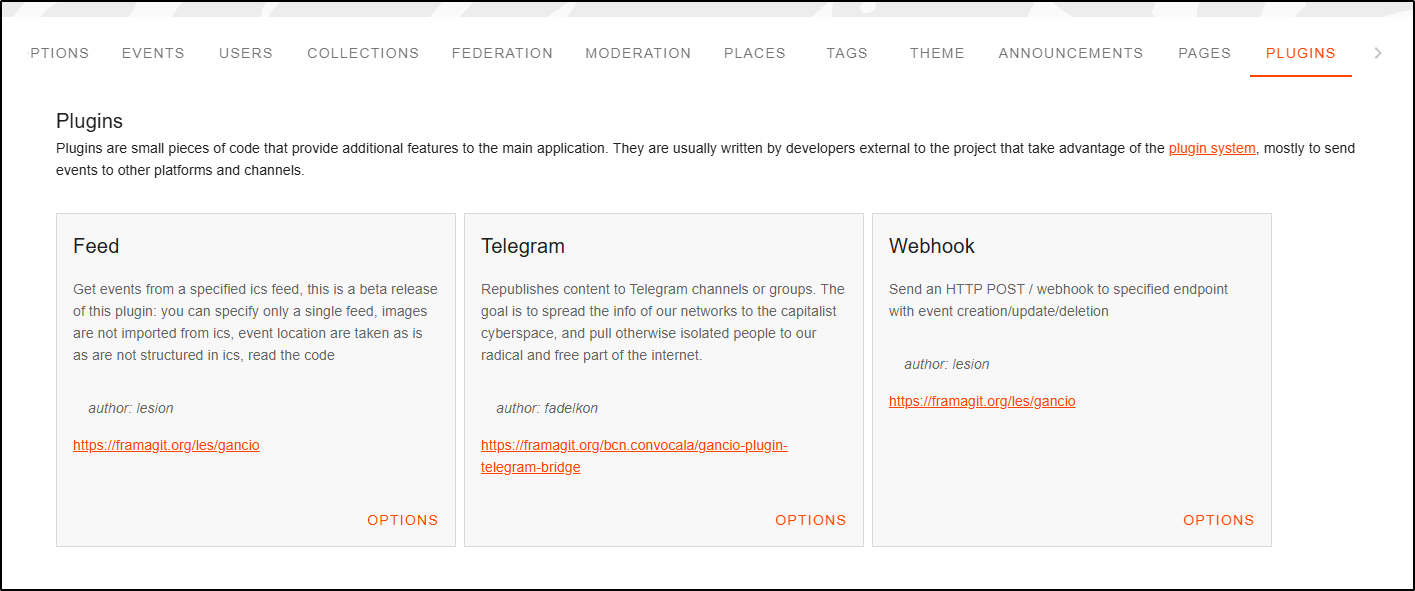
Some of the options we have are to add Webhooks or Telegram posts from plugins
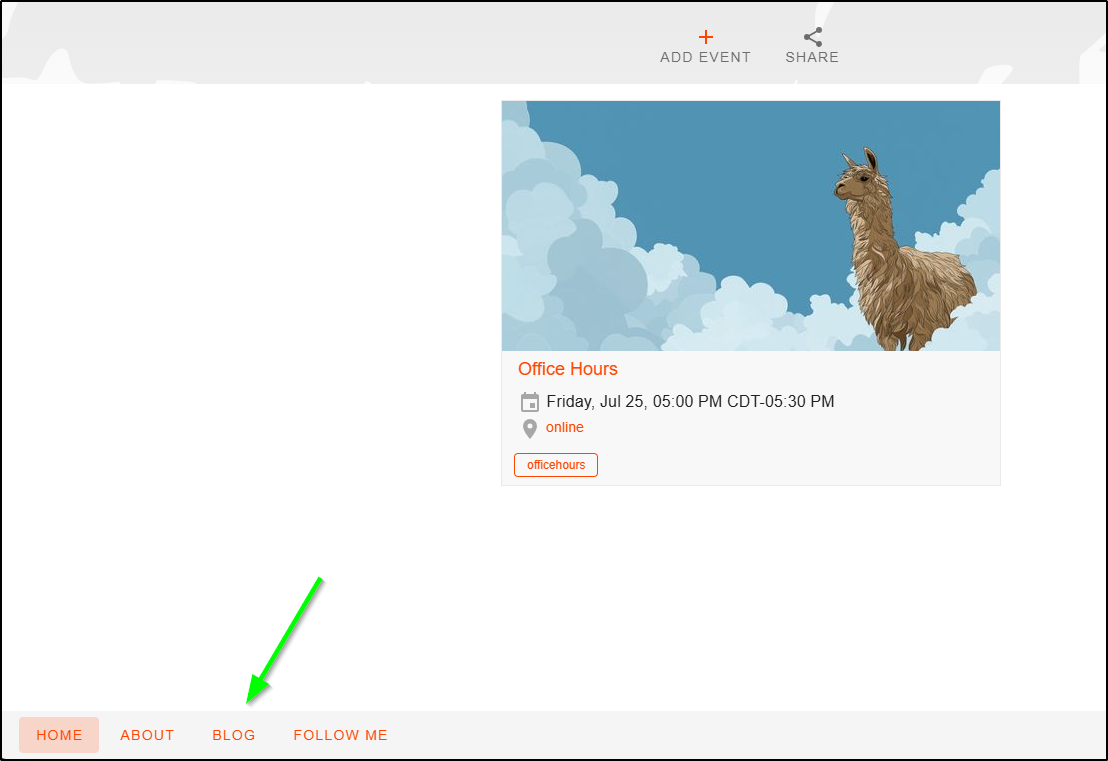
I can also add links to the footer like one to the blog. This is in Settings/Theme
Core Control
Another OS App I saw from Marius a while back is CoreControl
The suggest using a Docker Compose YAML
services:
  web:
    image: haedlessdev/corecontrol:latest
    ports:
      - "3000:3000"
    environment:
      JWT_SECRET: RANDOM_SECRET # Replace with a secure random string
      DATABASE_URL: "postgresql://postgres:postgres@db:5432/postgres"

  agent:
    image: haedlessdev/corecontrol-agent:latest
    environment:
      DATABASE_URL: "postgresql://postgres:postgres@db:5432/postgres"
    depends_on:
      db:
        condition: service_healthy

  db:
    image: postgres:17
    restart: always
    environment:
      POSTGRES_USER: postgres
      POSTGRES_PASSWORD: postgres
      POSTGRES_DB: postgres
    volumes:
      - postgres_data:/var/lib/postgresql/data
    healthcheck:
      test: ["CMD-SHELL", "pg_isready -U postgres"]
      interval: 2s
      timeout: 2s
      retries: 10

volumes:
  postgres_data:
We can start by testing that locally
builder@LuiGi:~/Workspaces$ git clone https://github.com/crocofied/CoreControl.git
Cloning into 'CoreControl'...
remote: Enumerating objects: 4294, done.
remote: Counting objects: 100% (946/946), done.
remote: Compressing objects: 100% (437/437), done.
remote: Total 4294 (delta 599), reused 626 (delta 472), pack-reused 3348 (from 2)
Receiving objects: 100% (4294/4294), 28.71 MiB | 7.34 MiB/s, done.
Resolving deltas: 100% (2472/2472), done.
Updating files: 100% (318/318), done.
builder@LuiGi:~/Workspaces$ cd CoreControl/
builder@LuiGi:~/Workspaces/CoreControl$ docker compose up
[+] Running 16/16
 ✔ web Pulled                                                                                                     34.5s
   ✔ f18232174bc9 Already exists                                                                                   0.0s
   ✔ a54ab62fca2d Already exists                                                                                   0.0s
   ✔ 6bf3eed75316 Already exists                                                                                   0.0s
   ✔ efb51bda5e87 Already exists                                                                                   0.0s
   ✔ ed239c380e77 Pull complete                                                                                    1.4s
   ✔ 966bc3f155f4 Pull complete                                                                                   27.6s
   ✔ fd4718bd8eb5 Pull complete                                                                                   28.2s
   ✔ d96861871029 Pull complete                                                                                   31.9s
   ✔ f919fbc2c5d0 Pull complete                                                                                   32.0s
   ✔ c2fab495b845 Pull complete                                                                                   32.0s
   ✔ 59e8ddc2bfb8 Pull complete                                                                                   32.2s
 ✔ agent Pulled                                                                                                    5.0s
   ✔ ceda16c5871d Already exists                                                                                   0.0s
   ✔ 4f4fb700ef54 Pull complete                                                                                   32.2s
   ✔ 5e9582031def Pull complete                                                                                    2.7s
[+] Running 5/5
 ✔ Network corecontrol_default         Created                                                                     0.1s
 ✔ Volume "corecontrol_postgres_data"  Created                                                                     0.0s
 ✔ Container corecontrol-web-1         Created                                                                     0.4s
 ✔ Container corecontrol-db-1          Created                                                                     0.4s
 ✔ Container corecontrol-agent-1       Created                                                                     0.1s
Attaching to agent-1, db-1, web-1
db-1     | The files belonging to this database system will be owned by user "postgres".
db-1     | This user must also own the server process.
db-1     |
db-1     | The database cluster will be initialized with locale "en_US.utf8".
db-1     | The default database encoding has accordingly been set to "UTF8".
db-1     | The default text search configuration will be set to "english".
db-1     |
db-1     | Data page checksums are disabled.
db-1     |
db-1     | fixing permissions on existing directory /var/lib/postgresql/data ... ok
db-1     | creating subdirectories ... ok
db-1     | selecting dynamic shared memory implementation ... posix
db-1     | selecting default "max_connections" ... 100
db-1     | selecting default "shared_buffers" ... 128MB
db-1     | selecting default time zone ... Etc/UTC
db-1     | creating configuration files ... ok
db-1     | running bootstrap script ... ok
db-1     | performing post-bootstrap initialization ... ok
db-1     | syncing data to disk ... ok
db-1     |
db-1     |
db-1     | Success. You can now start the database server using:
db-1     |
db-1     |     pg_ctl -D /var/lib/postgresql/data -l logfile start
db-1     |
db-1     | initdb: warning: enabling "trust" authentication for local connections
db-1     | initdb: hint: You can change this by editing pg_hba.conf or using the option -A, or --auth-local and --auth-host, the next time you run initdb.
db-1     | waiting for server to start....2025-07-29 12:49:22.286 UTC [48] LOG:  starting PostgreSQL 17.5 (Debian 17.5-1.pgdg120+1) on x86_64-pc-linux-gnu, compiled by gcc (Debian 12.2.0-14) 12.2.0, 64-bit
db-1     | 2025-07-29 12:49:22.293 UTC [48] LOG:  listening on Unix socket "/var/run/postgresql/.s.PGSQL.5432"
db-1     | 2025-07-29 12:49:22.317 UTC [51] LOG:  database system was shut down at 2025-07-29 12:49:21 UTC
db-1     | 2025-07-29 12:49:22.329 UTC [48] LOG:  database system is ready to accept connections
db-1     |  done
db-1     | server started
db-1     |
db-1     | /usr/local/bin/docker-entrypoint.sh: ignoring /docker-entrypoint-initdb.d/*
db-1     |
db-1     | waiting for server to shut down...2025-07-29 12:49:22.486 UTC [48] LOG:  received fast shutdown request
db-1     | .2025-07-29 12:49:22.493 UTC [48] LOG:  aborting any active transactions
db-1     | 2025-07-29 12:49:22.497 UTC [48] LOG:  background worker "logical replication launcher" (PID 54) exited with exit code 1
db-1     | 2025-07-29 12:49:22.497 UTC [49] LOG:  shutting down
db-1     | 2025-07-29 12:49:22.504 UTC [49] LOG:  checkpoint starting: shutdown immediate
db-1     | 2025-07-29 12:49:22.549 UTC [49] LOG:  checkpoint complete: wrote 3 buffers (0.0%); 0 WAL file(s) added, 0 removed, 0 recycled; write=0.013 s, sync=0.006 s, total=0.052 s; sync files=2, longest=0.004 s, average=0.003 s; distance=0 kB, estimate=0 kB; lsn=0/14E4FA0, redo lsn=0/14E4FA0
db-1     | 2025-07-29 12:49:22.555 UTC [48] LOG:  database system is shut down
db-1     |  done
db-1     | server stopped
db-1     |
db-1     | PostgreSQL init process complete; ready for start up.
db-1     |
db-1     | 2025-07-29 12:49:22.632 UTC [1] LOG:  starting PostgreSQL 17.5 (Debian 17.5-1.pgdg120+1) on x86_64-pc-linux-gnu, compiled by gcc (Debian 12.2.0-14) 12.2.0, 64-bit
db-1     | 2025-07-29 12:49:22.634 UTC [1] LOG:  listening on IPv4 address "0.0.0.0", port 5432
db-1     | 2025-07-29 12:49:22.634 UTC [1] LOG:  listening on IPv6 address "::", port 5432
db-1     | 2025-07-29 12:49:22.647 UTC [1] LOG:  listening on Unix socket "/var/run/postgresql/.s.PGSQL.5432"
db-1     | 2025-07-29 12:49:22.662 UTC [69] LOG:  database system was shut down at 2025-07-29 12:49:22 UTC
db-1     | 2025-07-29 12:49:22.673 UTC [1] LOG:  database system is ready to accept connections
web-1    | Prisma schema loaded from prisma/schema.prisma
web-1    | Datasource "db": PostgreSQL database "postgres", schema "public" at "db:5432"
web-1    |
web-1    | 4 migrations found in prisma/migrations
web-1    |
web-1    | Applying migration `20250427135601_init`
web-1    | Applying migration `20250428174802_temp_and_gpu_monitoring`
web-1    | Applying migration `20250429202004_echobell`
web-1    | Applying migration `20250429204709_echobell_fix`
web-1    |
web-1    | The following migration(s) have been applied:
web-1    |
web-1    | migrations/
web-1    |   └─ 20250427135601_init/
web-1    |     └─ migration.sql
web-1    |   └─ 20250428174802_temp_and_gpu_monitoring/
web-1    |     └─ migration.sql
web-1    |   └─ 20250429202004_echobell/
web-1    |     └─ migration.sql
web-1    |   └─ 20250429204709_echobell_fix/
web-1    |     └─ migration.sql
web-1    |
web-1    | All migrations have been successfully applied.
web-1    | npm notice
web-1    | npm notice New major version of npm available! 10.8.2 -> 11.5.1
web-1    | npm notice Changelog: https://github.com/npm/cli/releases/tag/v11.5.1
web-1    | npm notice To update run: npm install -g npm@11.5.1
web-1    | npm notice
web-1    |
web-1    | > corecontrol@1.0.1 start
web-1    | > next start
web-1    |
web-1    |    ▲ Next.js 15.3.0
web-1    |    - Local:        http://localhost:3000
web-1    |    - Network:      http://172.27.0.3:3000
web-1    |
web-1    |  ✓ Starting...
web-1    |  ✓ Ready in 593ms
agent-1  | No env vars found


v View in Docker Desktop   o View Config   w Enable Watch
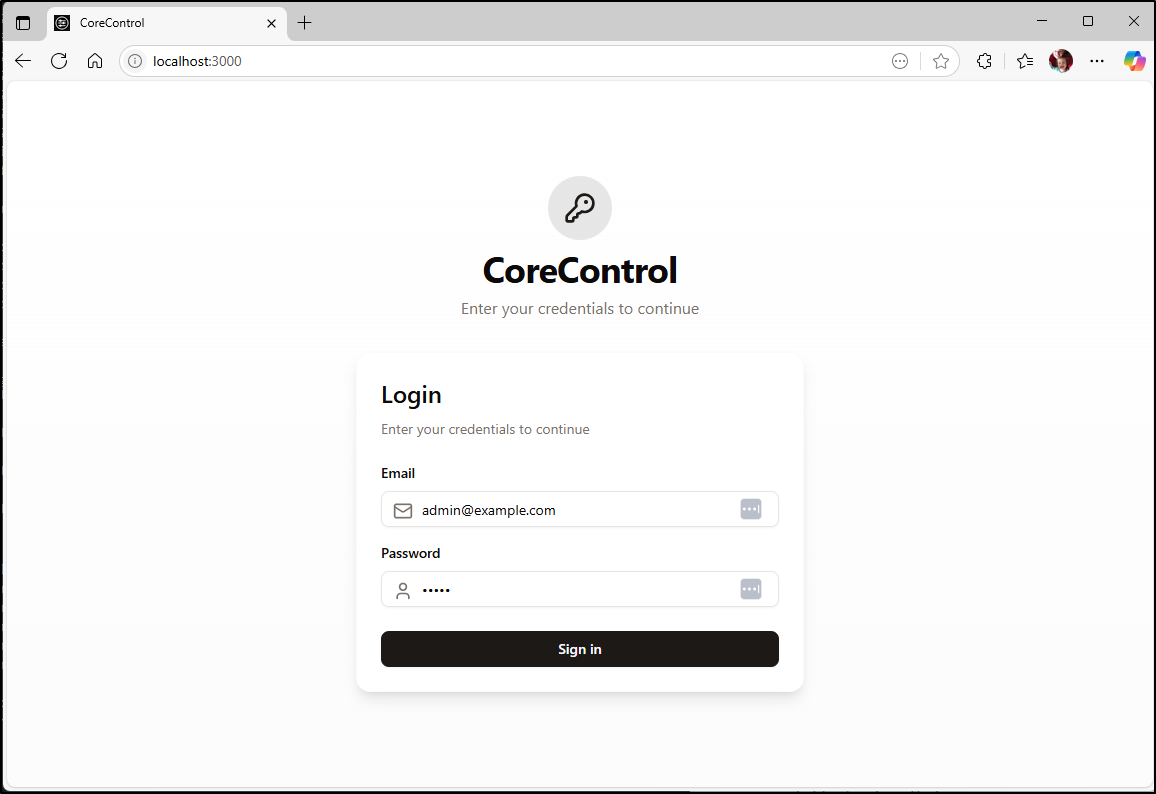
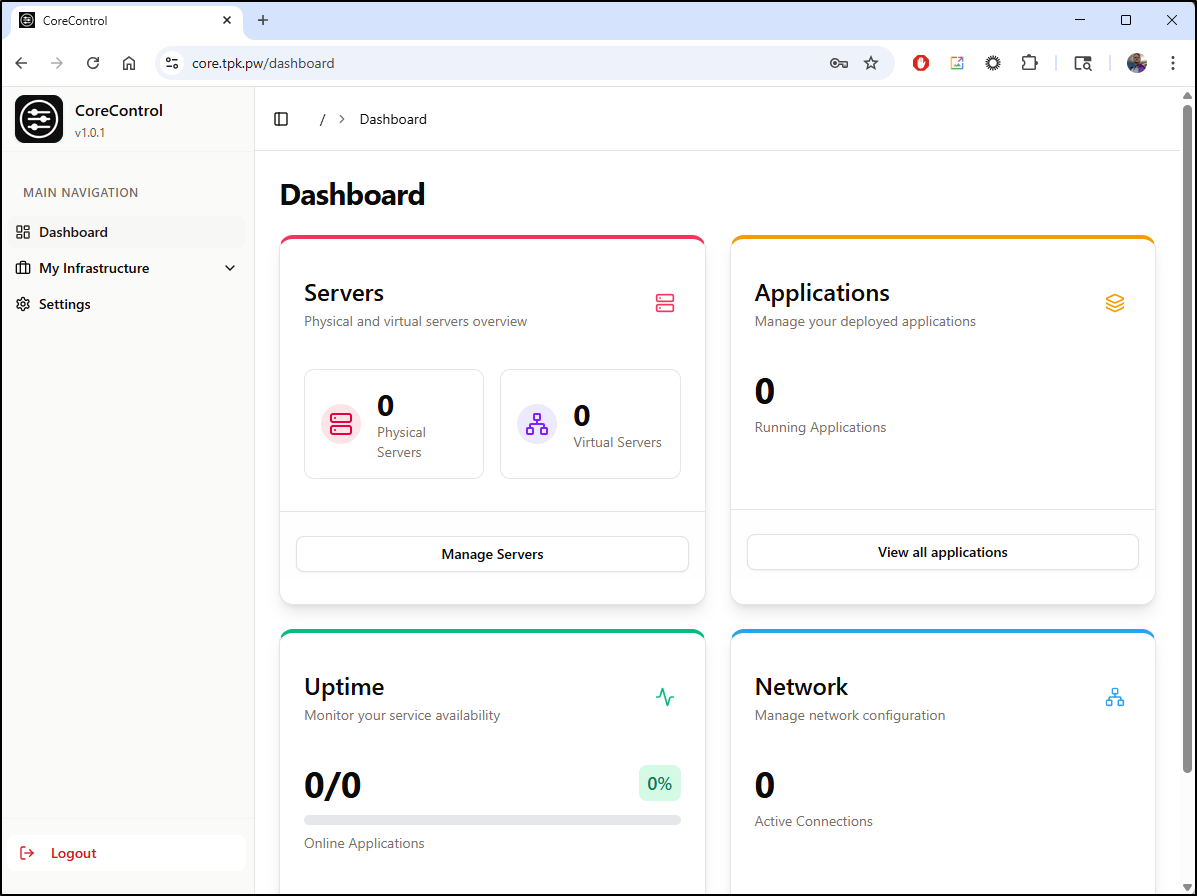
We can now sign in with default admin@example.com and admin password
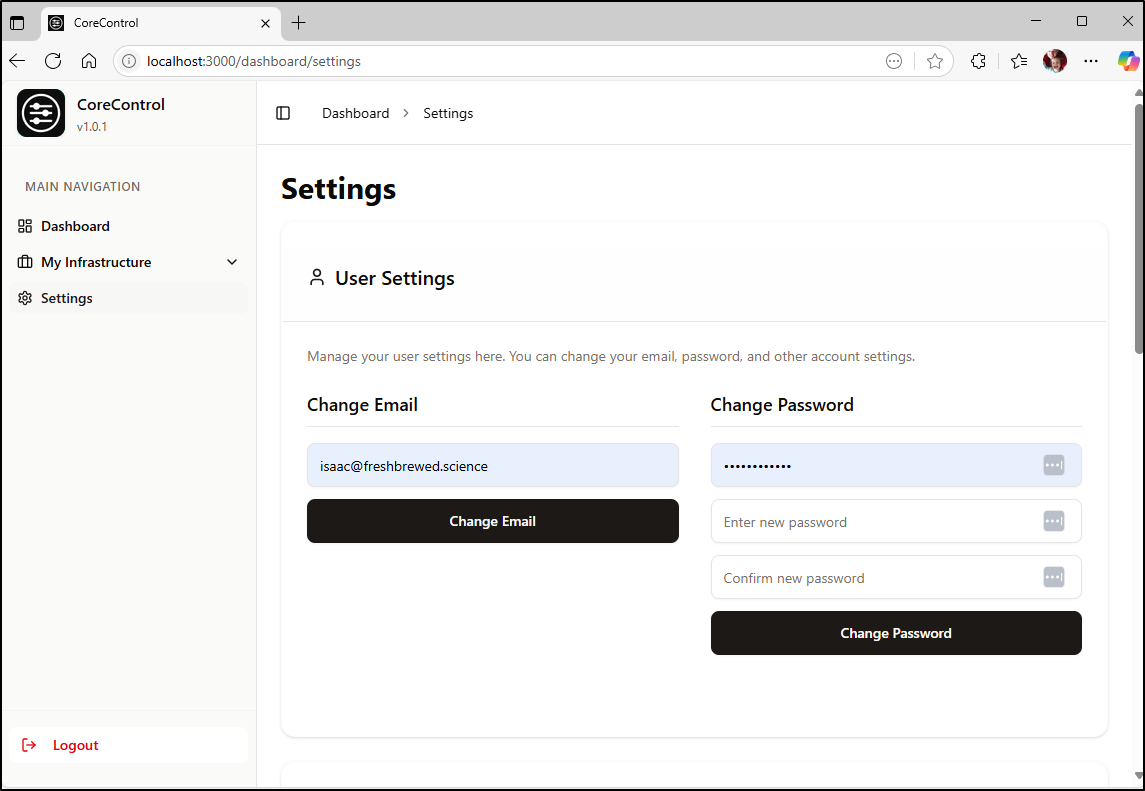
We can go to settings to change that admin email and password
I did that then logged out and back in again and saw my initial dashboard
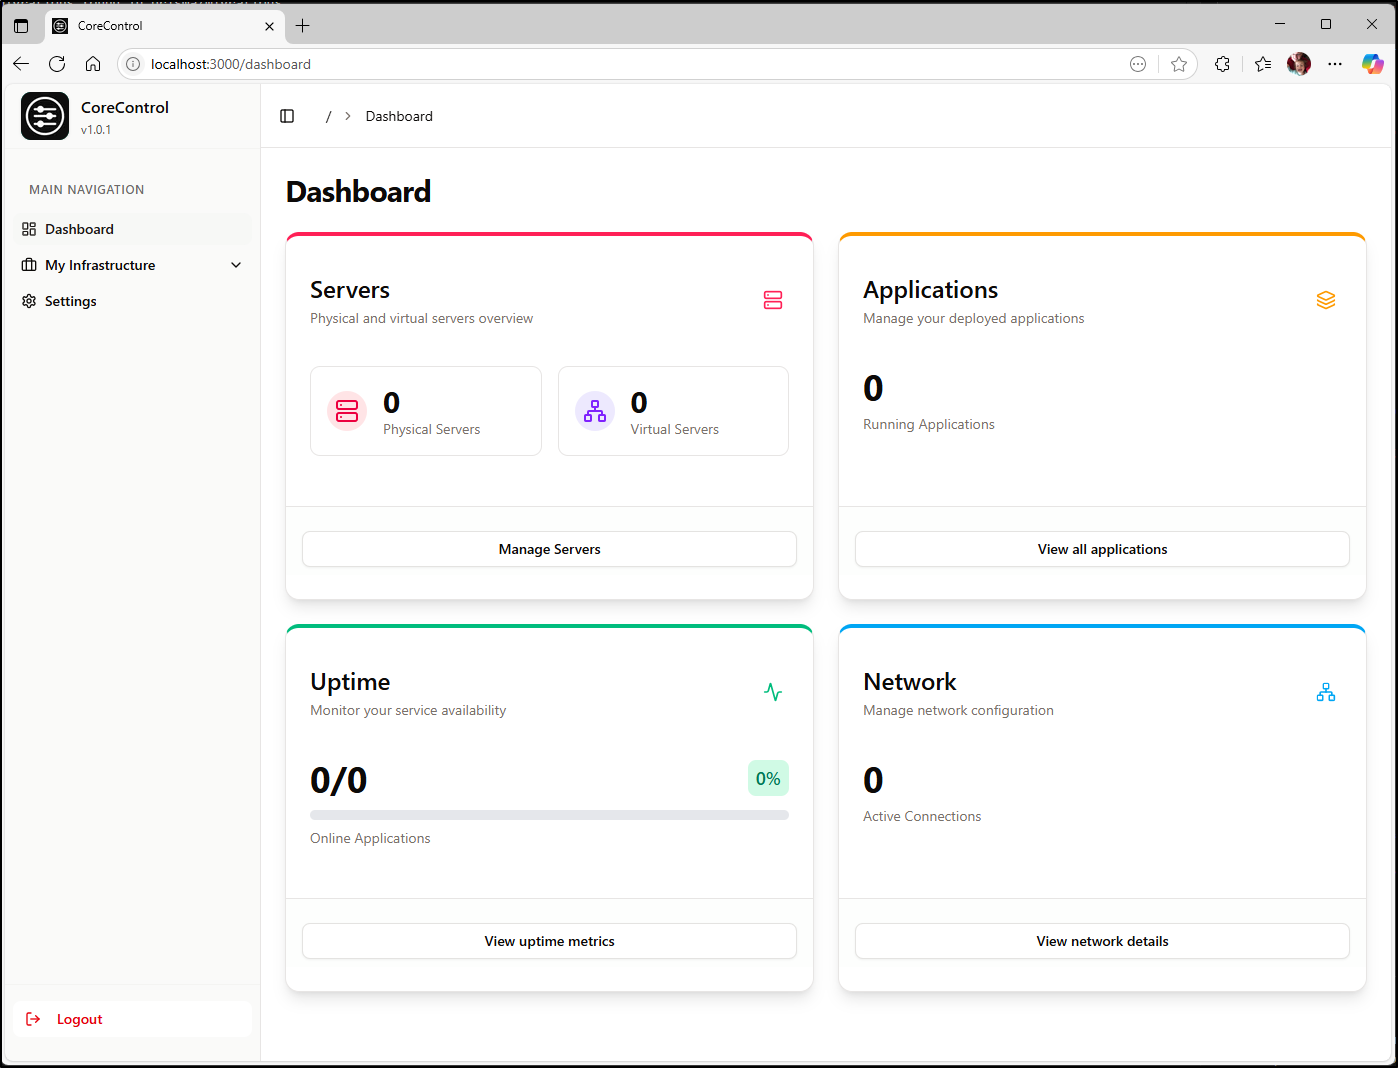
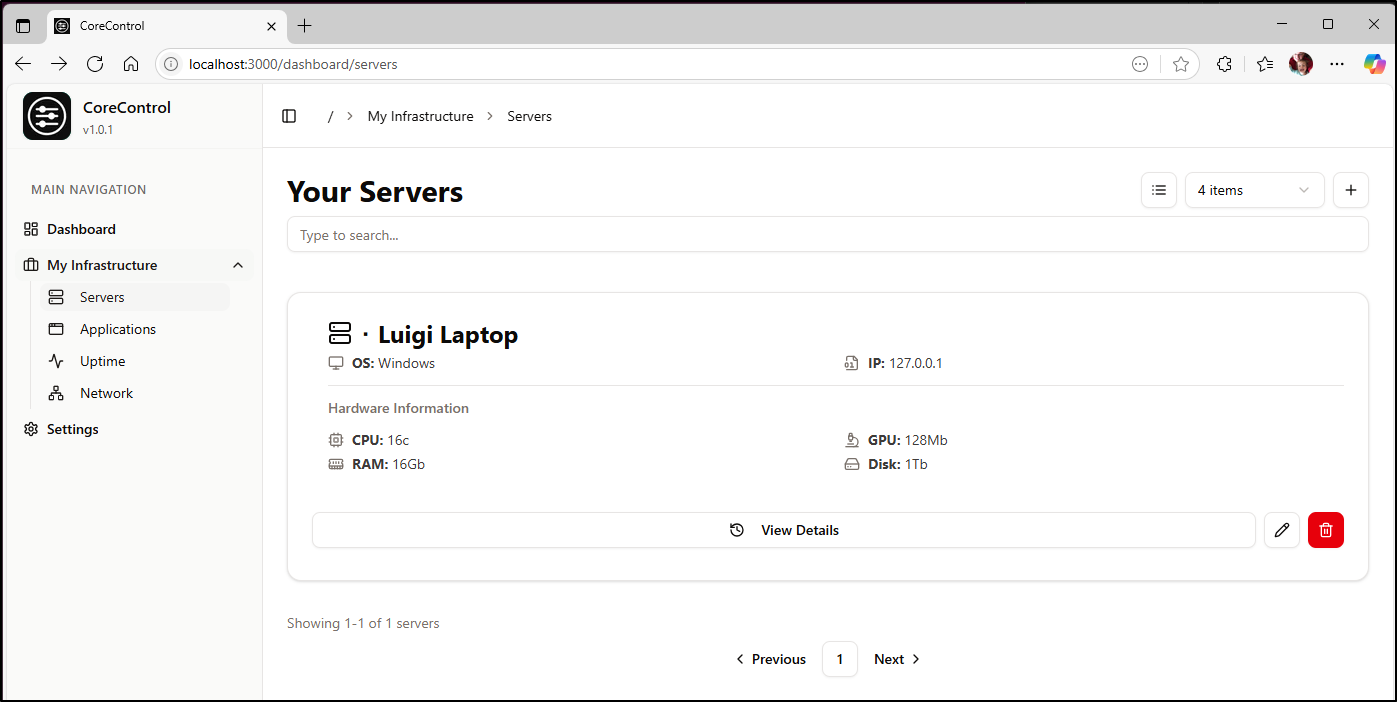
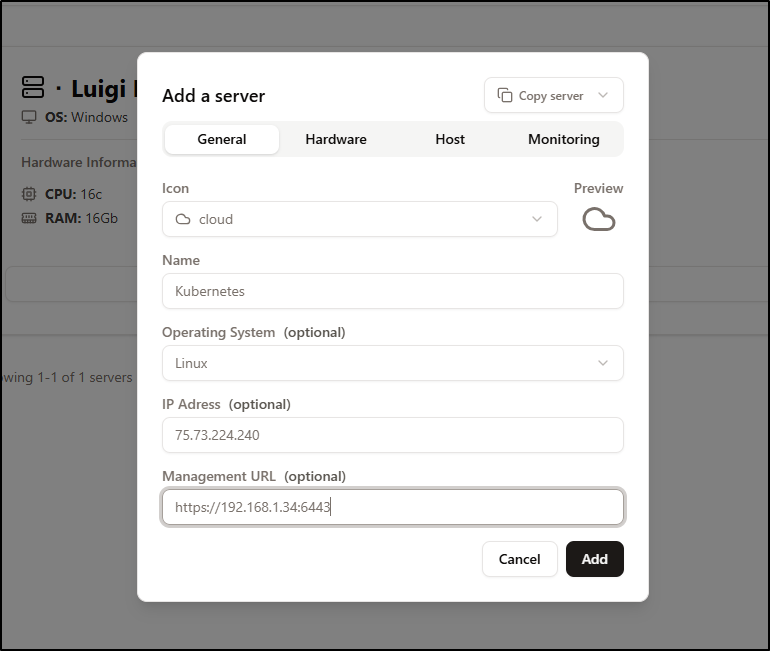
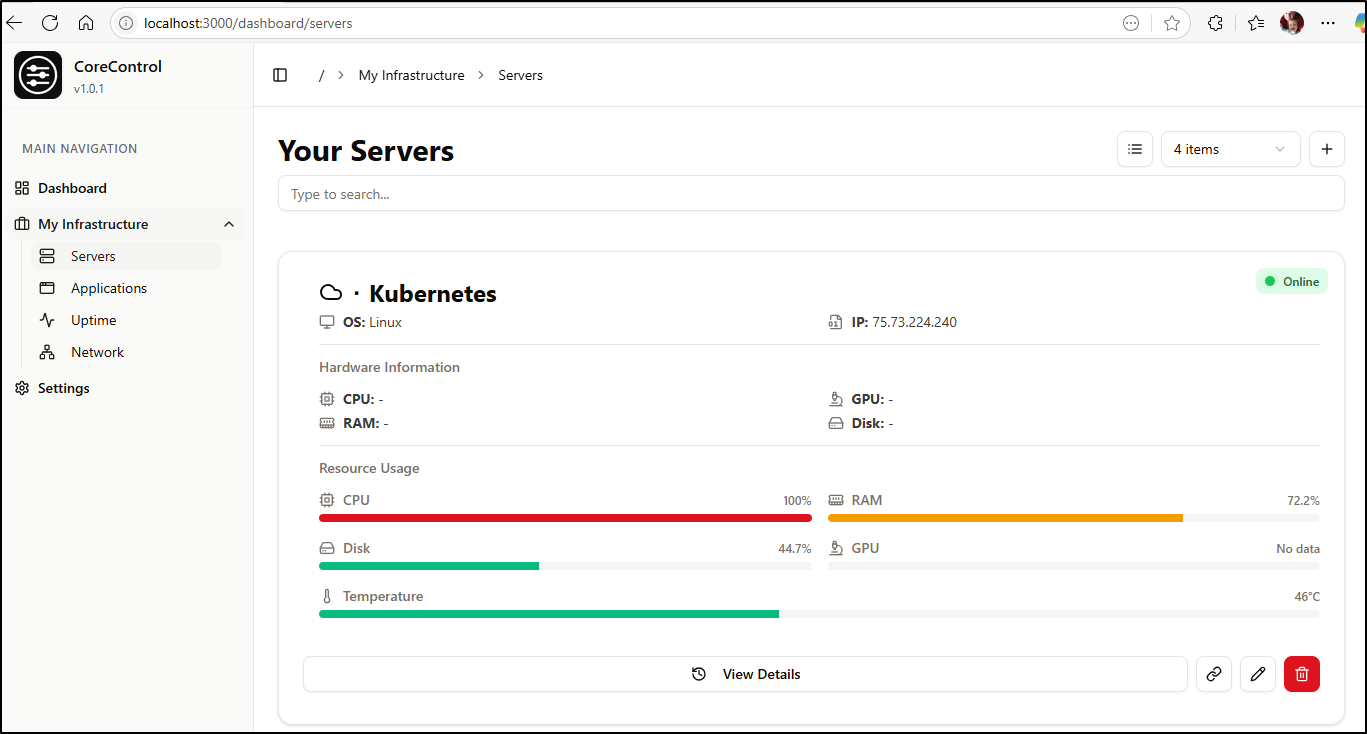
I can add servers to the list for tracking, but it is just form data I hand enter
I wasn’t sure how best to monitor a cluster, like Kubernetes, so I picked a Cloud icon for that
Monitoring is done by way of a docker container on the server that is reachable by the app.
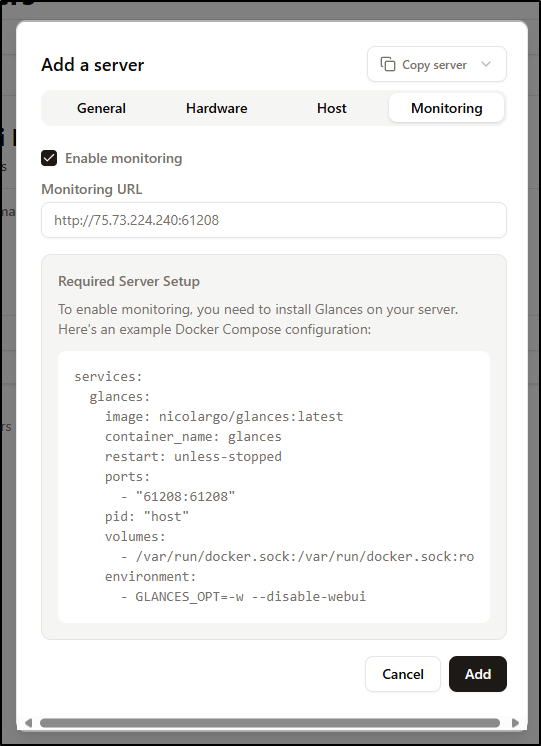
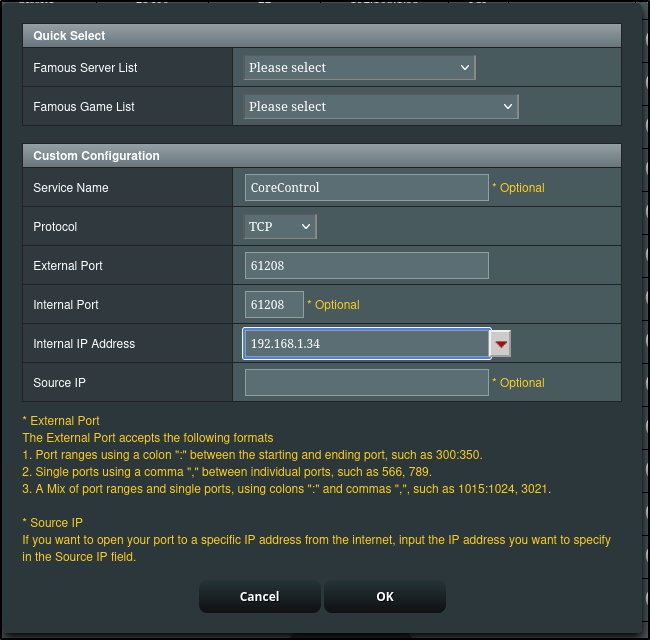
Considering this is a remote how through a firewall, I would likely need to run this docker compose on the the master node (192.168.1.34)
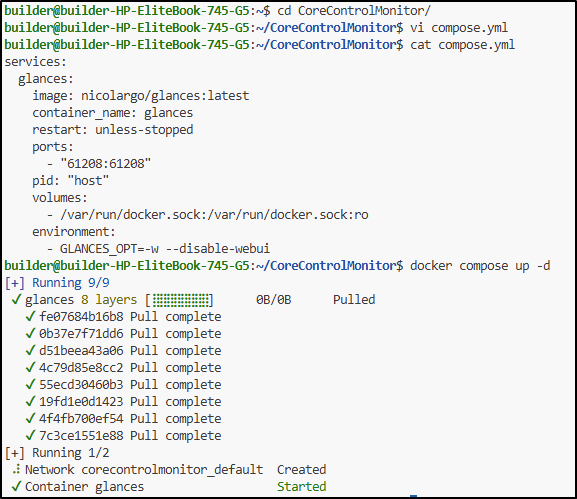
and then create a firewall forwarding rule to reach 61208
This took a moment to get data, but worked
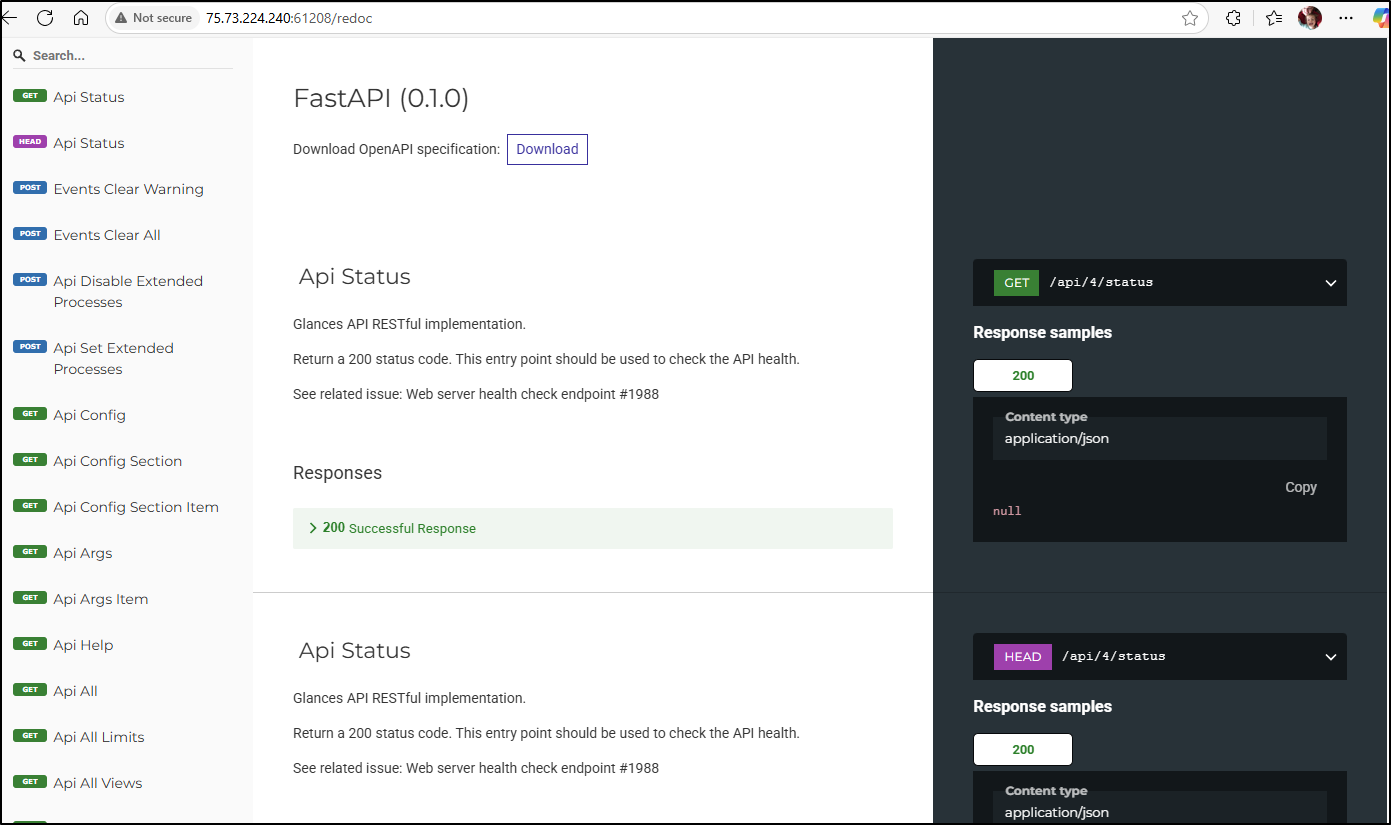
What is interesting is this is using another Open-Source tool, Glances which, because it uses FastAPI, has a full Swagger/OpenAI docs at /docs
He has the launch in docker compose disable the WebUI, but that doesn’t disable OpenAPI:
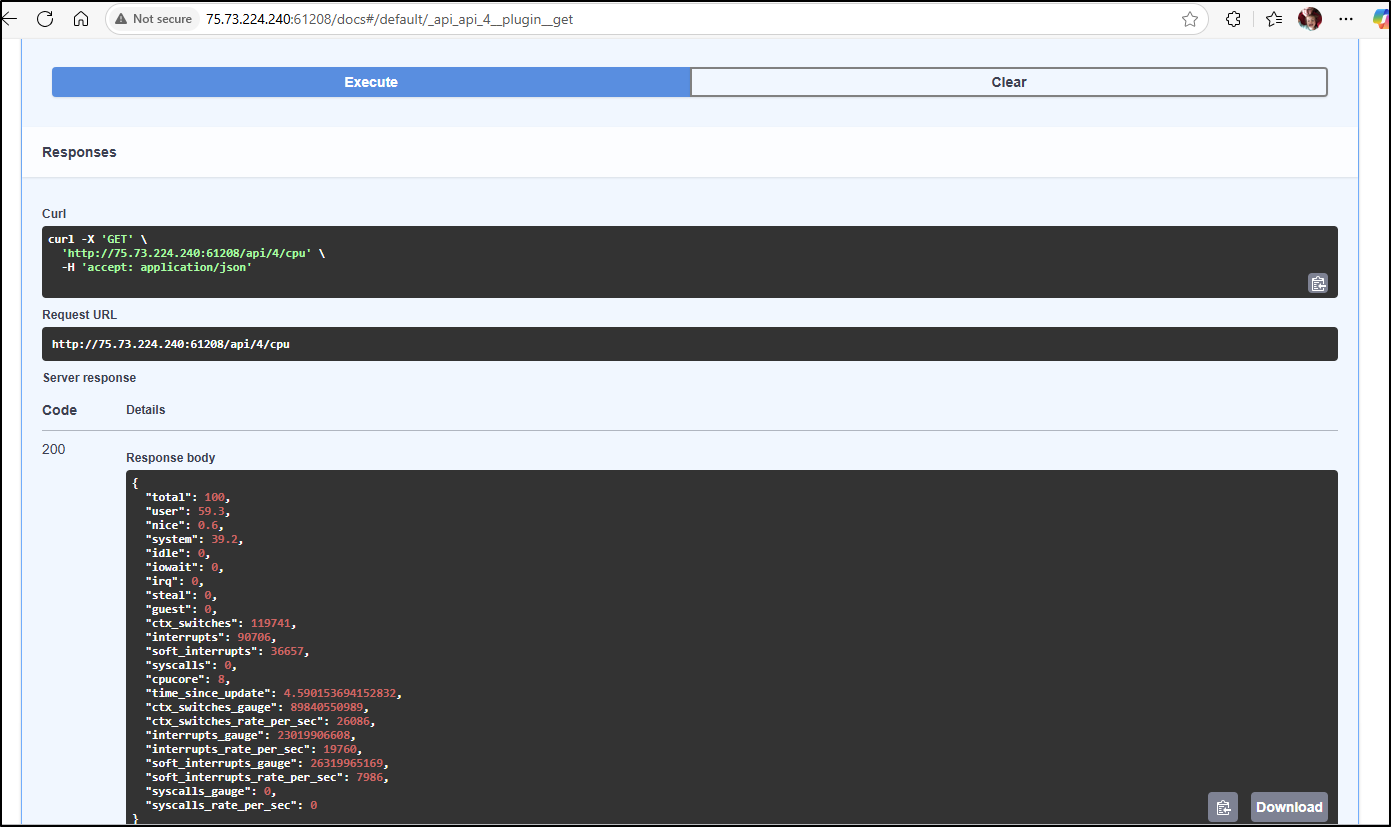
nor redocs
Applications
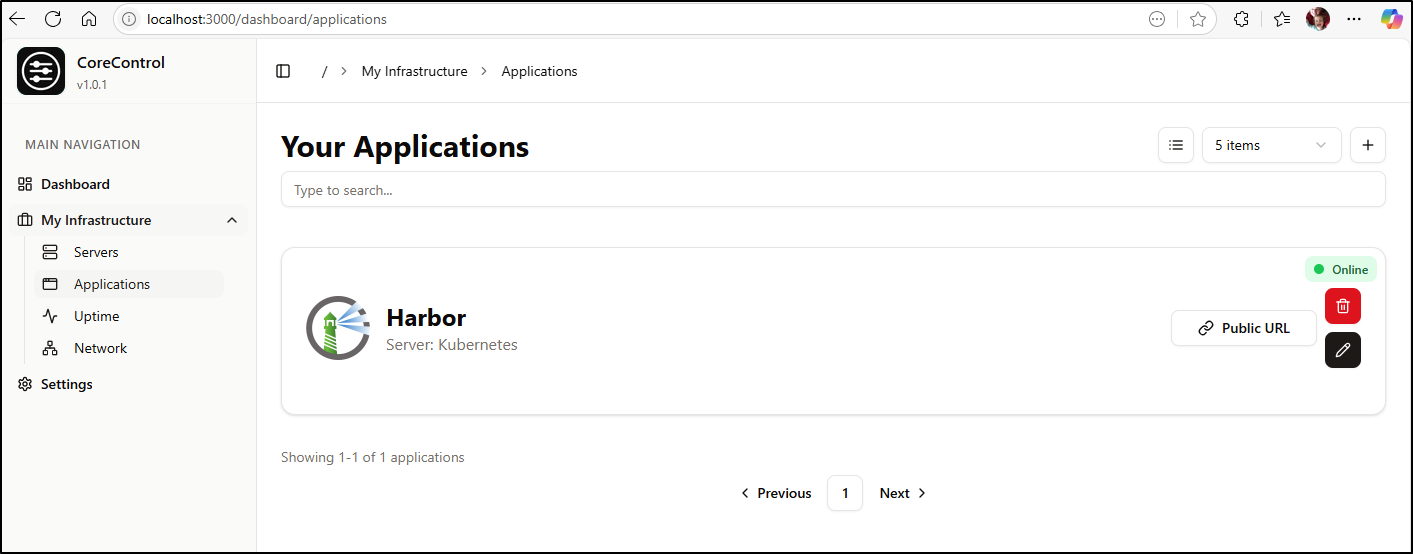
Our next step is to add applications. We can add Harbor, for instance
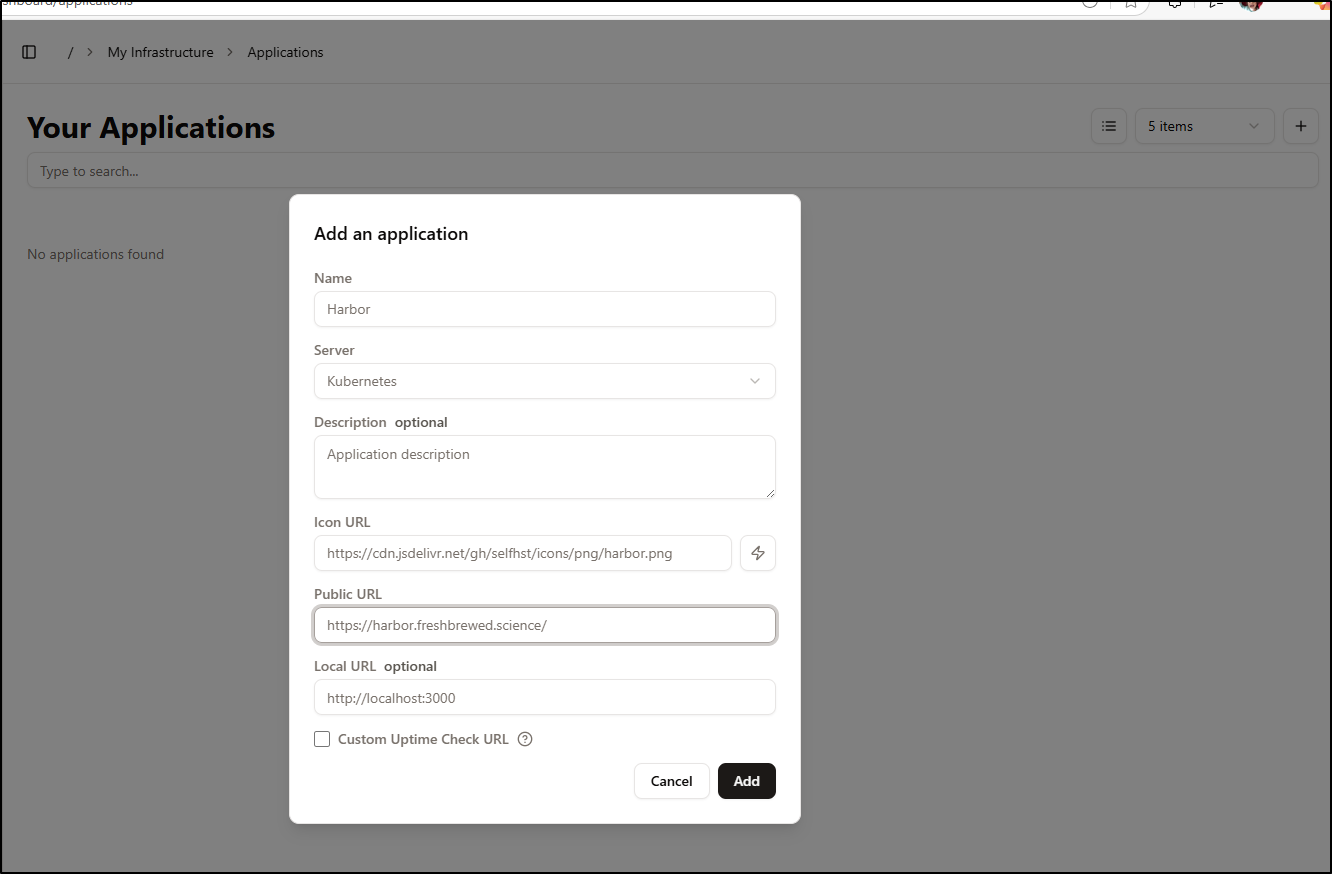
And see it now in my Applications (the wizard lightning bolt button fetched the icon)
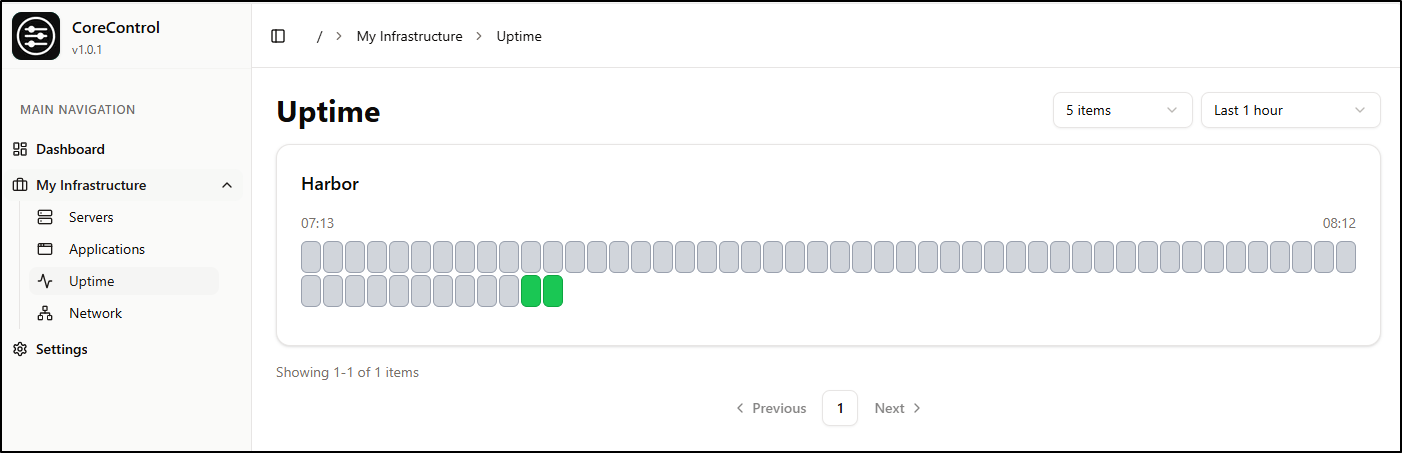
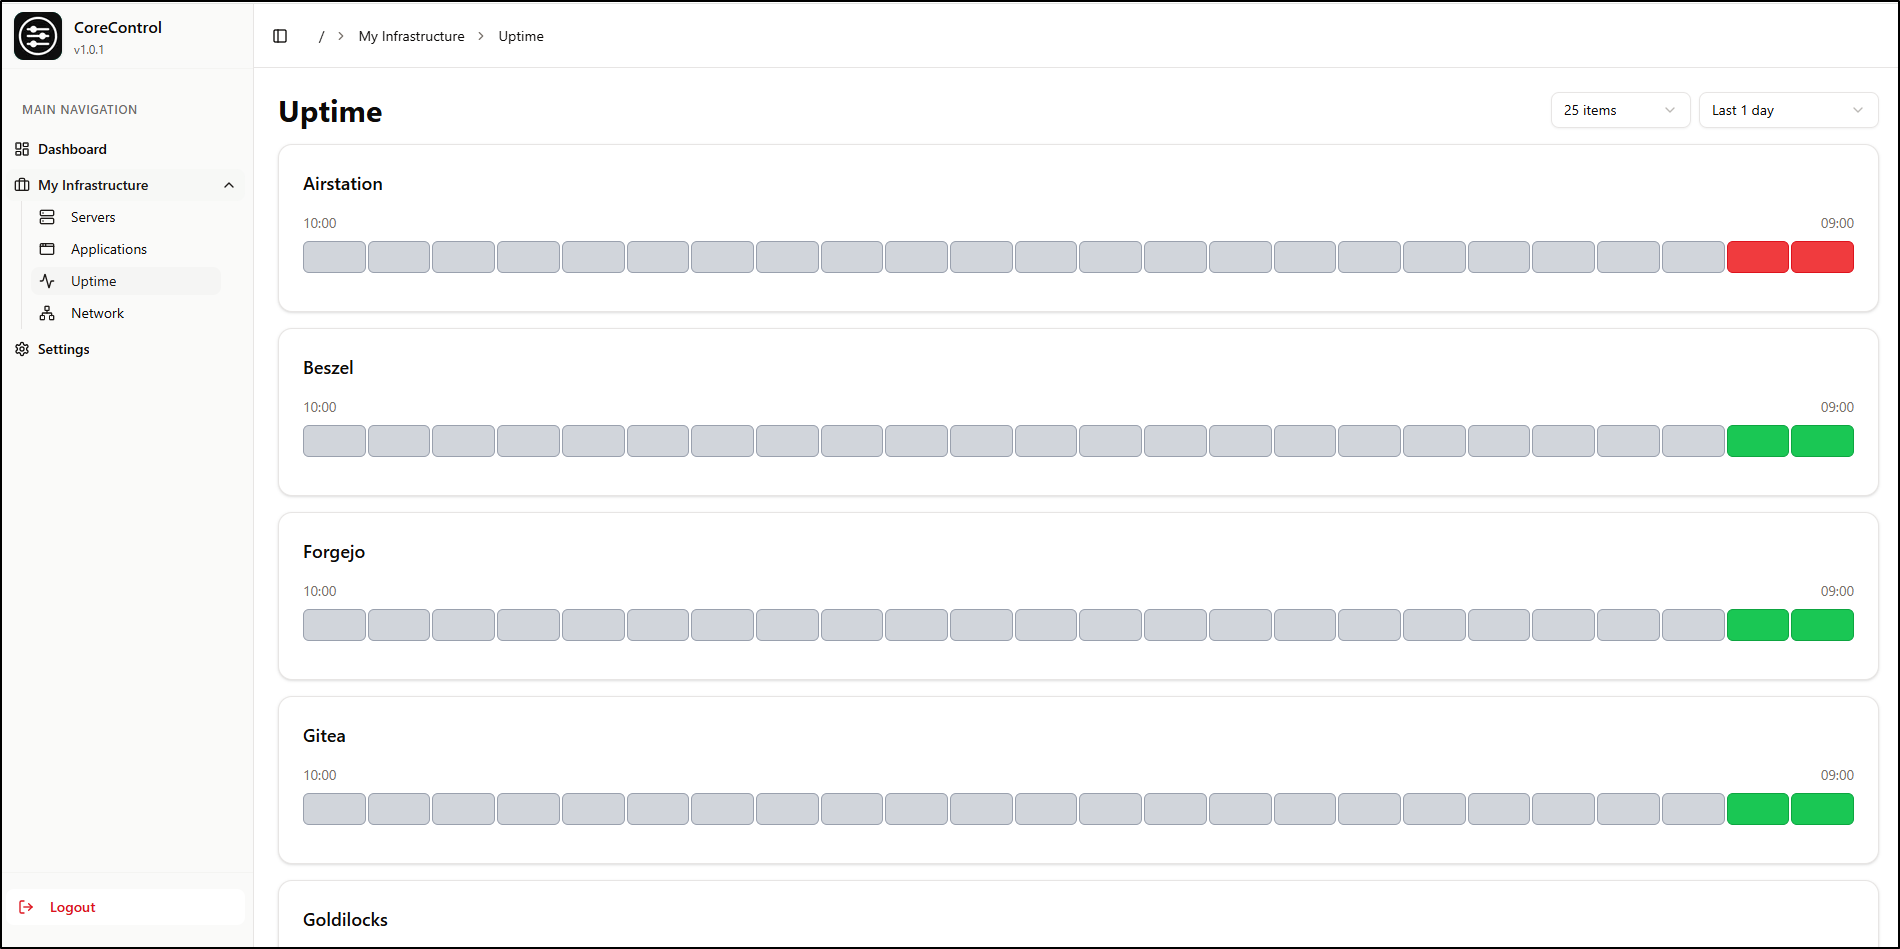
This also shows up in the Uptime dashboard
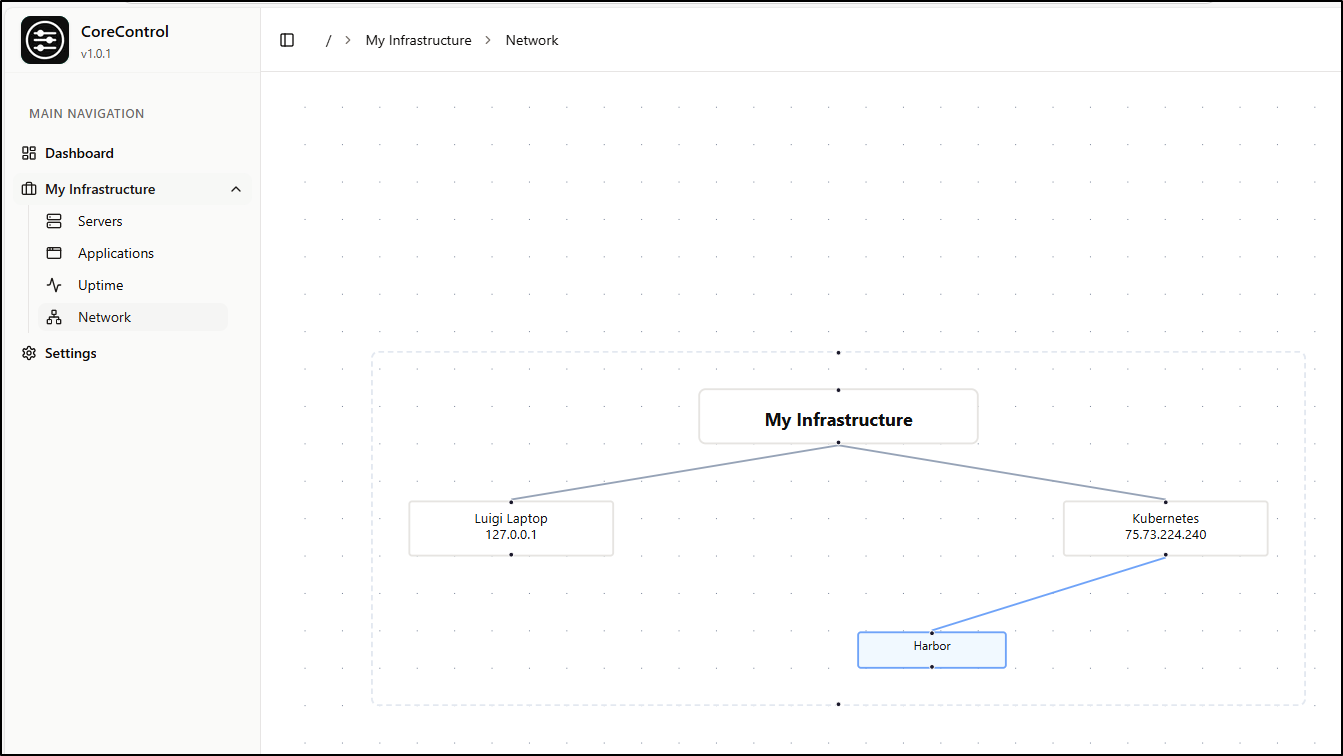
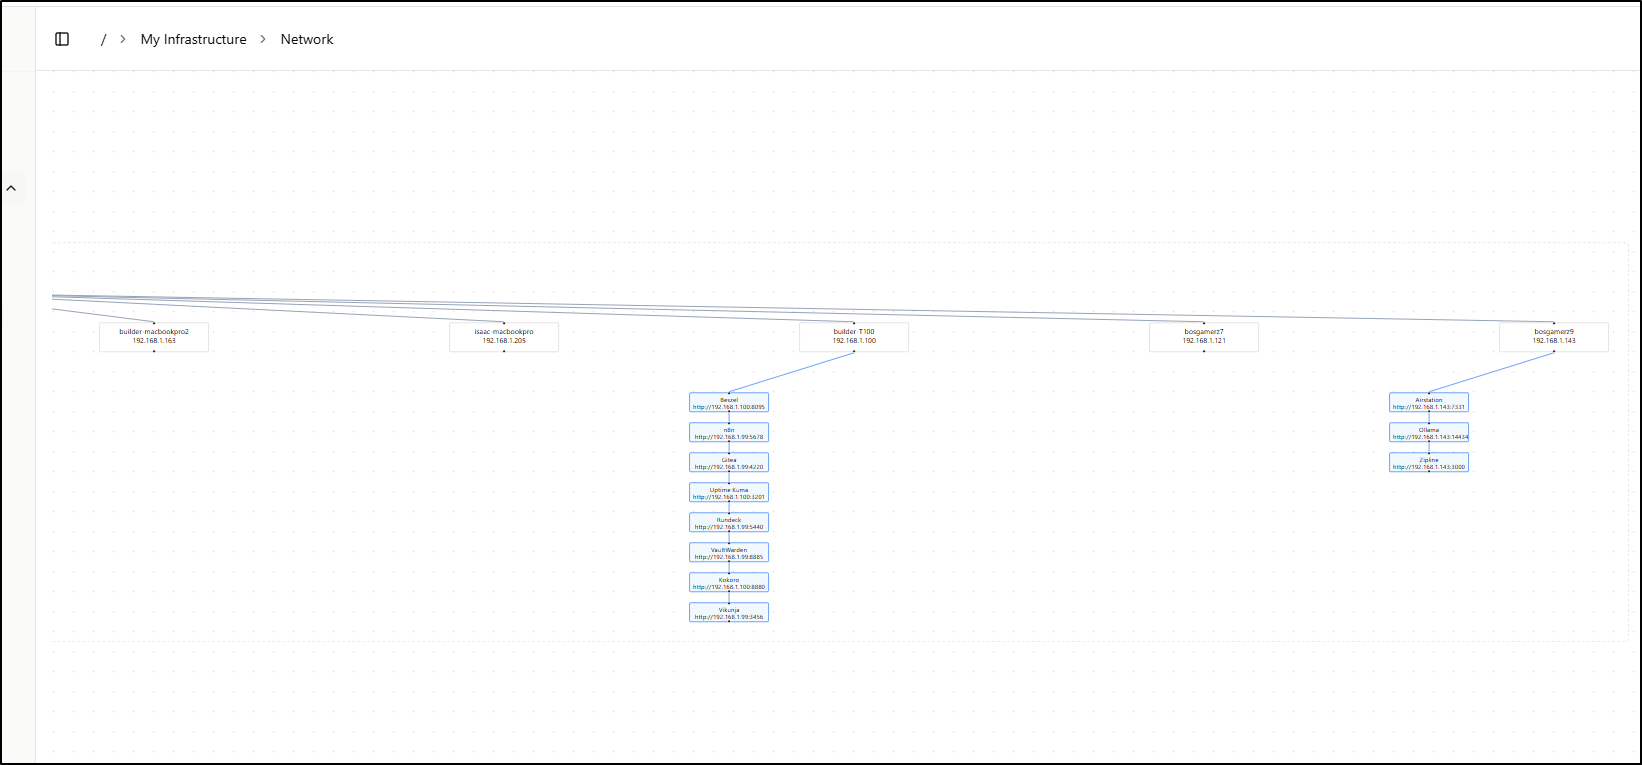
Network
As we map out Applications and servers, we can start to see some connections between hosts and applications. The “Network” section is for just that - to see a layout of what is running where
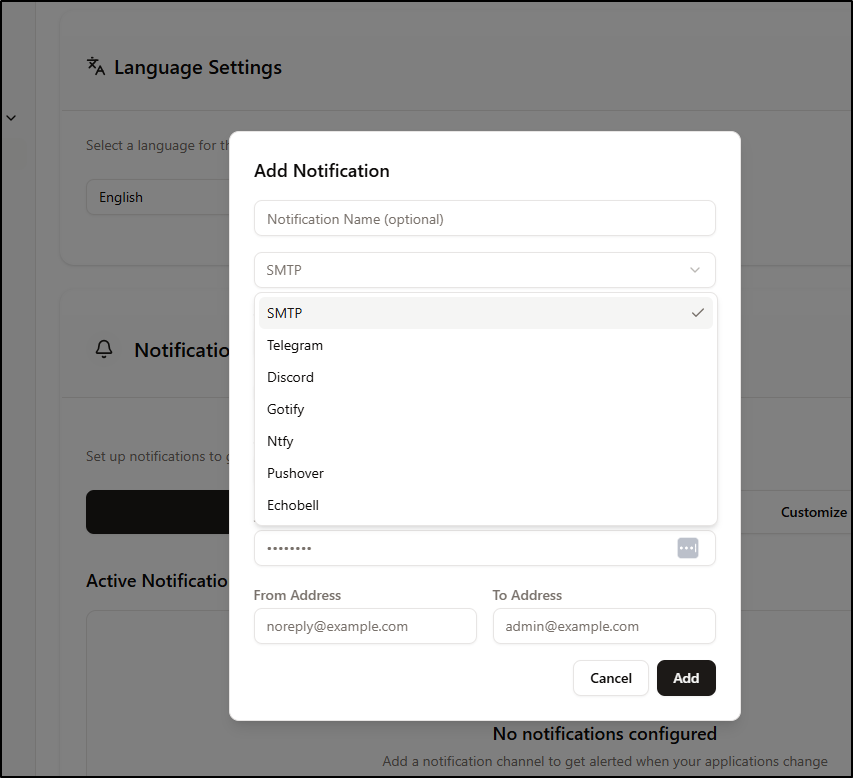
Notifications
We can add notifications to our app if we wish to, for instance, email ourselves if a server or application is unreachable
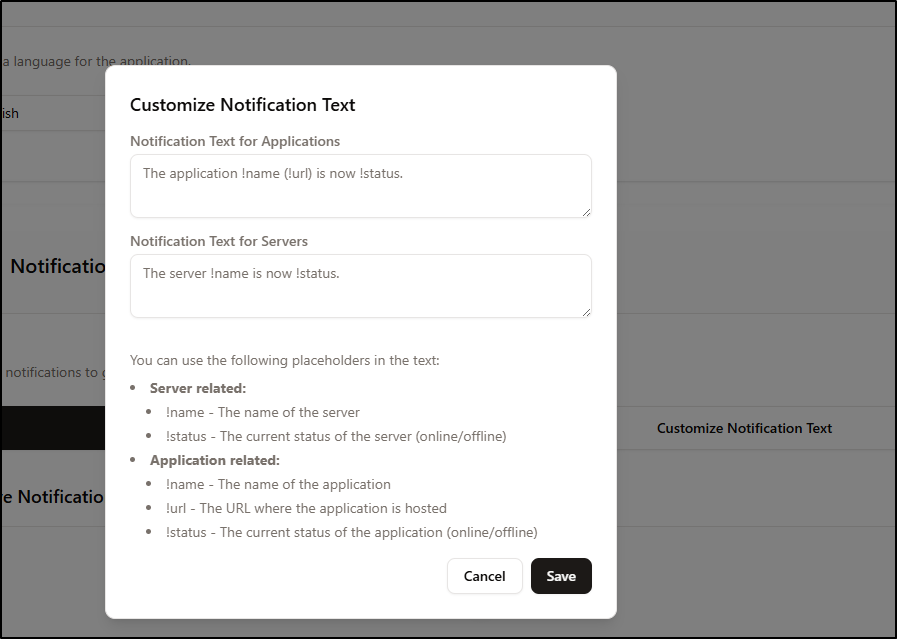
And the customize Notification Text lets us tweak what gets sent
TLS
I like short domains, so let’s start with a simple A record
$ az account set --subscription "Pay-As-You-Go" && az network dns record-set a add-record -g idjdnsrg -z tpk.pw -a 75.73.224.240 -n core
{
  "ARecords": [
    {
      "ipv4Address": "75.73.224.240"
    }
  ],
  "TTL": 3600,
  "etag": "3a101c14-f39e-46b8-aa43-9880481c44f2",
  "fqdn": "core.tpk.pw.",
  "id": "/subscriptions/d955c0ba-13dc-44cf-a29a-8fed74cbb22d/resourceGroups/idjdnsrg/providers/Microsoft.Network/dnszones/tpk.pw/A/core",
  "name": "core",
  "provisioningState": "Succeeded",
  "resourceGroup": "idjdnsrg",
  "targetResource": {},
  "trafficManagementProfile": {},
  "type": "Microsoft.Network/dnszones/A"
}
Next, I need to decide if this lives in kubernetes or outside. It would seem a good fit for the dockerhost which has a nice battery backup. I’ll use a unique port like 3422
builder@builder-T100:~/CoreControl$ cat compose.yml
services:
web:
image: haedlessdev/corecontrol:latest
ports:
- "3422:3000"
environment:
JWT_SECRET: RANDOM_SECRET # Replace with a secure random string
DATABASE_URL: "postgresql://postgres:postgres@db:5432/postgres"
agent:
image: haedlessdev/corecontrol-agent:latest
environment:
DATABASE_URL: "postgresql://postgres:postgres@db:5432/postgres"
depends_on:
db:
condition: service_healthy
db:
image: postgres:17
restart: always
environment:
POSTGRES_USER: postgres
POSTGRES_PASSWORD: postgres
POSTGRES_DB: postgres
volumes:
- postgres_datacore:/var/lib/postgresql/data
healthcheck:
test: ["CMD-SHELL", "pg_isready -U postgres"]
interval: 2s
timeout: 2s
retries: 10
volumes:
postgres_datacore:
builder@builder-T100:~/CoreControl$ docker compose up -d
[+] Running 29/31
✔ agent 2 layers [⣿⣿] 0B/0B Pulled 9.7s
✔ ceda16c5871d Pull complete 8.0s
✔ 5e9582031def Pull complete 8.5s
✔ db 14 layers [⣿⣿⣿⣿⣿⣿⣿⣿⣿⣿⣿⣿⣿⣿] 0B/0B Pulled 8.9s
✔ 59e22667830b Pull complete 2.3s
✔ c2922dd5c76b Pull complete 2.3s
✔ 28b0f0abf5b3 Pull complete 2.4s
✔ a623957f847d Pull complete 2.5s
✔ bfabbcdba989 Pull complete 2.7s
✔ 0e5bba37029a Pull complete 2.8s
✔ 1ed9ff0b5160 Pull complete 2.9s
✔ 06b2fd76987c Pull complete 2.9s
✔ 9e482b60495e Pull complete 7.6s
✔ 4a43c57a903d Pull complete 7.6s
✔ dcce1c0b58a8 Pull complete 7.6s
✔ 38072b29d55e Pull complete 7.7s
✔ d98e5494f240 Pull complete 7.7s
✔ 017403a0b5e1 Pull complete 7.7s
⠏ web 12 layers [⣿⣿⣿⣿⣿⣿⣿⣿⣿⣿⣿⣿] 69.28kB/69.28kB Pulling 33.0s
✔ f18232174bc9 Already exists 0.0s
✔ a54ab62fca2d Pull complete 4.7s
✔ 6bf3eed75316 Pull complete 4.9s
✔ efb51bda5e87 Pull complete 22.4s
✔ ed239c380e77 Pull complete 22.5s
✔ 966bc3f155f4 Pull complete 29.6s
✔ fd4718bd8eb5 Pull complete 30.0s
✔ d96861871029 Pull complete 31.7s
✔ f919fbc2c5d0 Pull complete 31.8s
✔ c2fab495b845 Pull complete 31.8s
✔ 4f4fb700ef54 Pull complete 31.8s
⠿ 59e8ddc2bfb8 Extracting [==================================================>] 69.28kB/69.28kB 31.8s
[+] Running 5/5
✔ Network corecontrol_default Created 0.1s
✔ Volume "corecontrol_postgres_datacore" Created 0.0s
✔ Container corecontrol-db-1 Healthy 3.7s
✔ Container corecontrol-web-1 Started 1.2s
✔ Container corecontrol-agent-1 Started
Then we can make an ingress to reach it
$ cat core.ingress.yaml
---
apiVersion: v1
kind: Endpoints
metadata:
  name: core-external-ip
subsets:
- addresses:
  - ip: 192.168.1.100
  ports:
  - name: core
    port: 3422
    protocol: TCP
---
apiVersion: v1
kind: Service
metadata:
  name: core-external-ip
spec:
  clusterIP: None
  clusterIPs:
  - None
  internalTrafficPolicy: Cluster
  ipFamilies:
  - IPv4
  - IPv6
  ipFamilyPolicy: RequireDualStack
  ports:
  - name: core
    port: 80
    protocol: TCP
    targetPort: 3422
  sessionAffinity: None
  type: ClusterIP
---
apiVersion: networking.k8s.io/v1
kind: Ingress
metadata:
  annotations:
    cert-manager.io/cluster-issuer: azuredns-tpkpw
    ingress.kubernetes.io/ssl-redirect: "true"
    kubernetes.io/ingress.class: nginx
    kubernetes.io/tls-acme: "true"
    nginx.ingress.kubernetes.io/ssl-redirect: "true"
    nginx.ingress.kubernetes.io/proxy-body-size: "0"
    nginx.ingress.kubernetes.io/proxy-read-timeout: "3600"
    nginx.ingress.kubernetes.io/proxy-send-timeout: "3600"
    nginx.org/client-max-body-size: "0"
    nginx.org/proxy-connect-timeout: "3600"
    nginx.org/proxy-read-timeout: "3600"
    nginx.org/websocket-services: core-external-ip
  name: core-ingress
spec:
  rules:
  - host: core.tpk.pw
    http:
      paths:
      - backend:
          service:
            name: core-external-ip
            port:
              number: 80
        path: /
        pathType: Prefix
  tls:
  - hosts:
    - core.tpk.pw
    secretName: core-tls


$ kubectl apply -f ./core.ingress.yaml
endpoints/core-external-ip created
service/core-external-ip created
Warning: annotation "kubernetes.io/ingress.class" is deprecated, please use 'spec.ingressClassName' instead
ingress.networking.k8s.io/core-ingress created
Once the cert is satisfied
$ kubectl get cert core-tls
NAME       READY   SECRET     AGE
core-tls   True    core-tls   2m56s
Once I logged in, I changed the email and password of the admin user and logged out and back in again
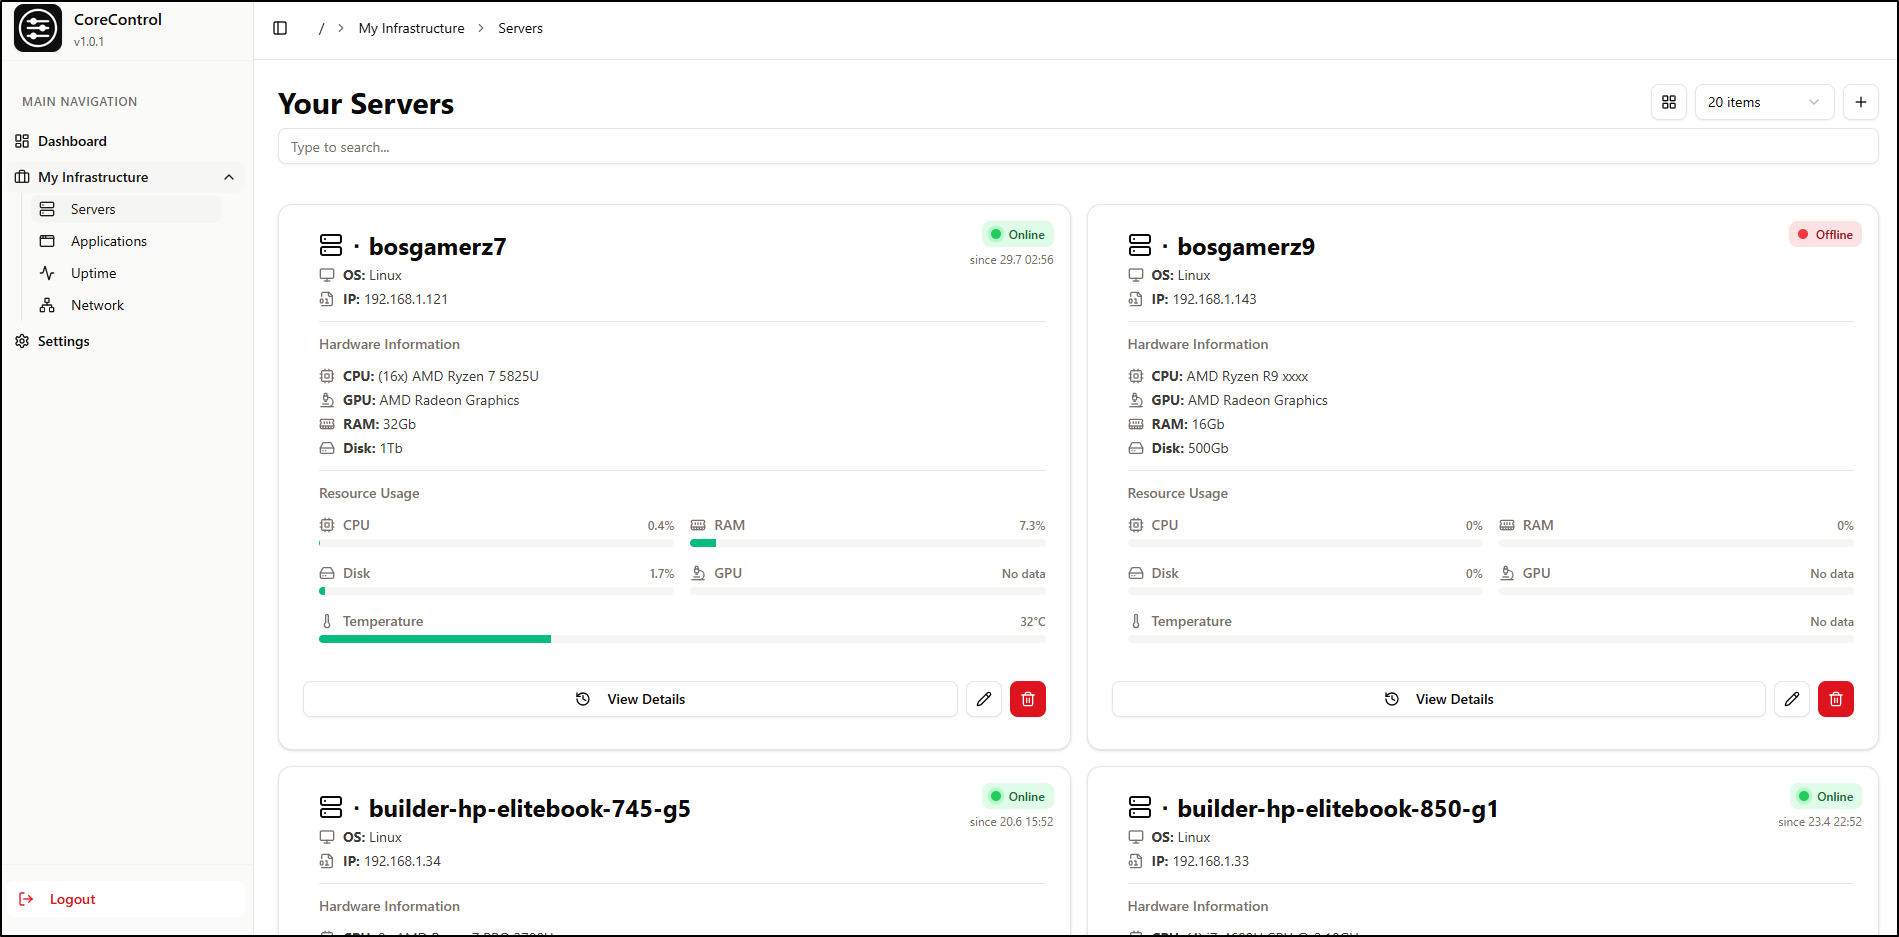
As I populated all of the servers, I came to the conclusion that the UI is a bit too large. I need something more minimalistic/terse
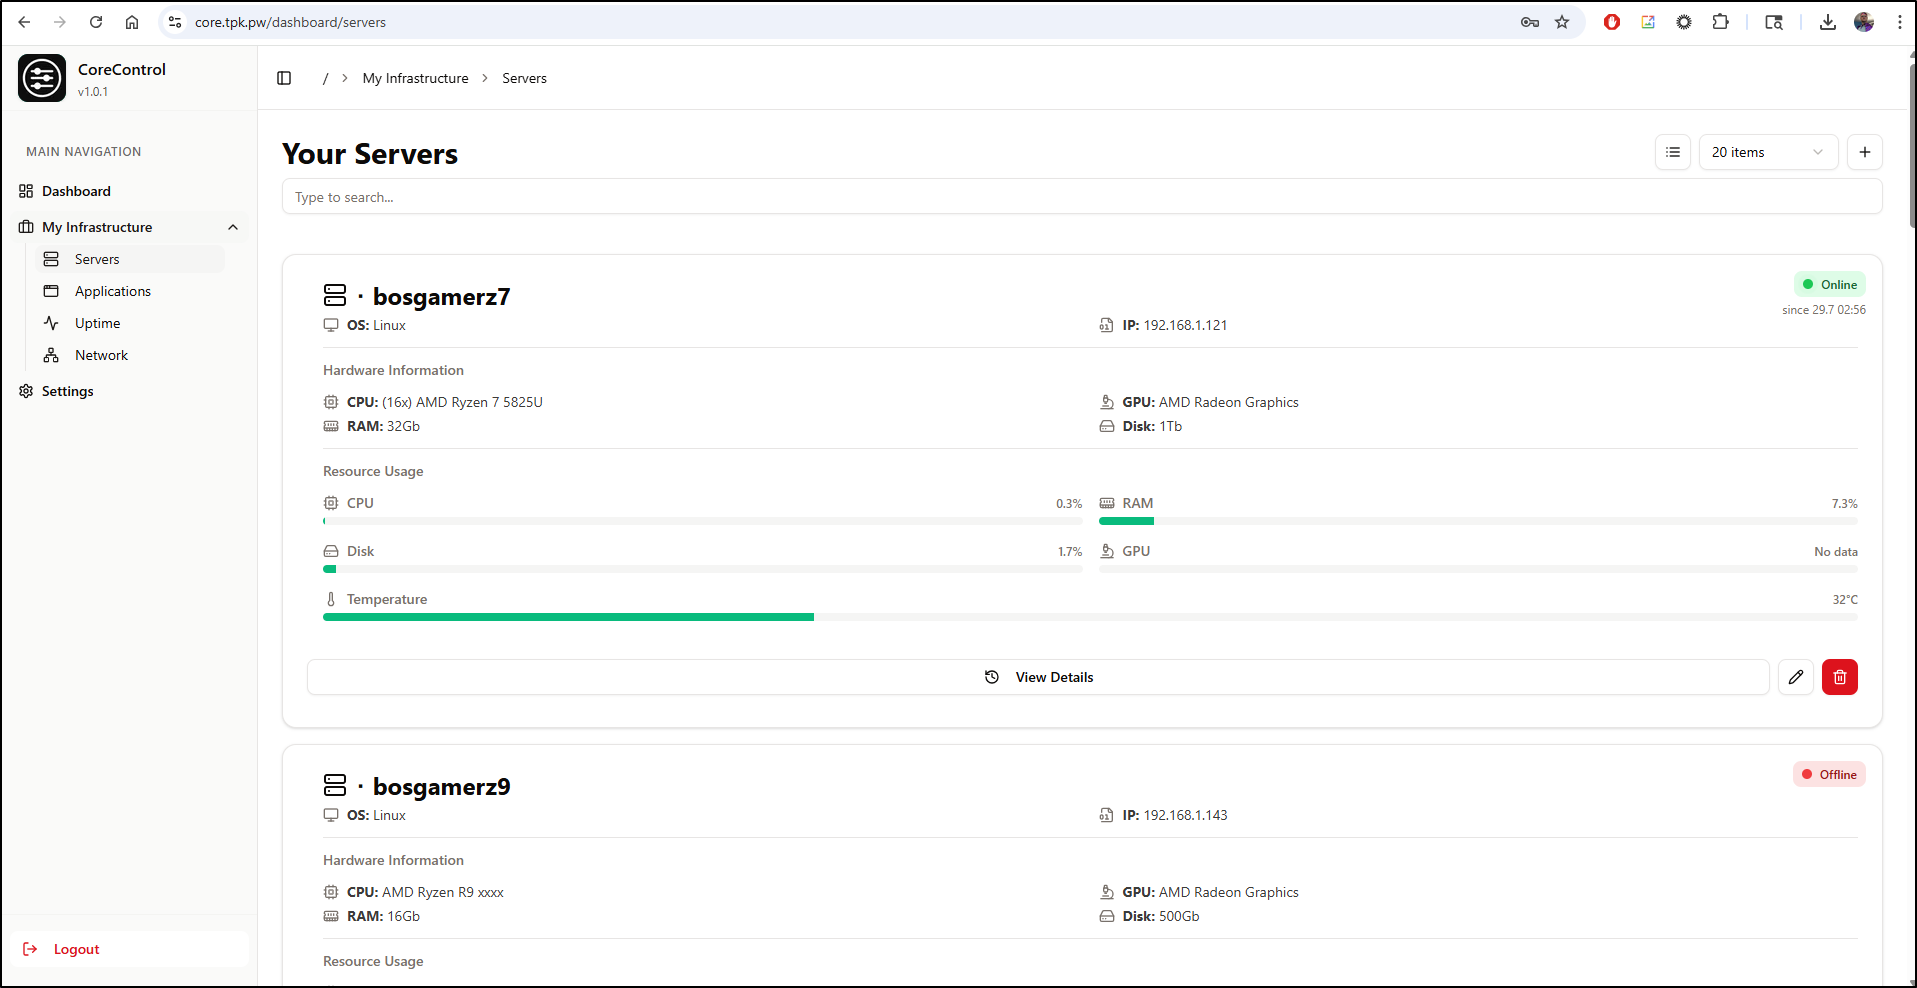
Even Grid view doesn’t cut it for me
We can compare to Beszel which can monitor hosts, but not applications
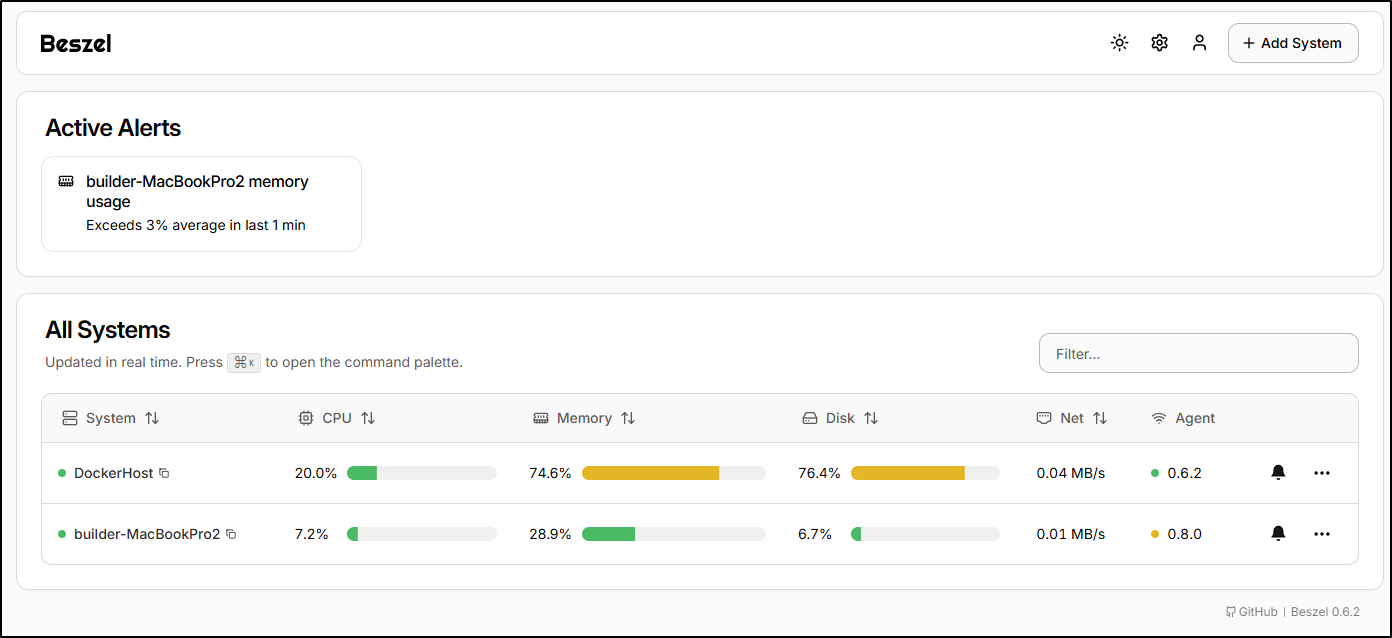
What I do like, however, with Beszel is I see Temperatures in the report
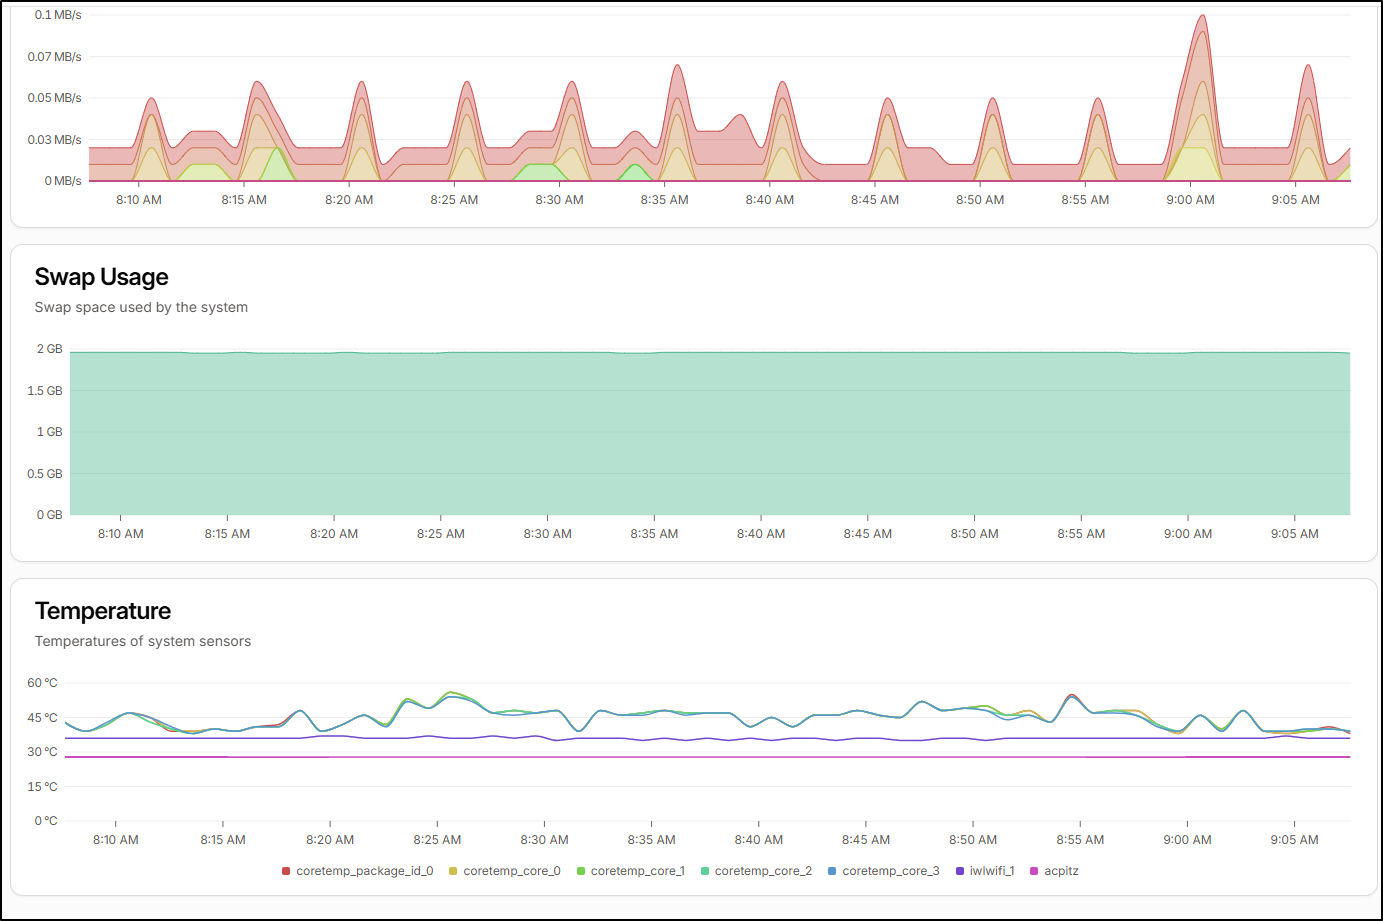
And details on Docker usage
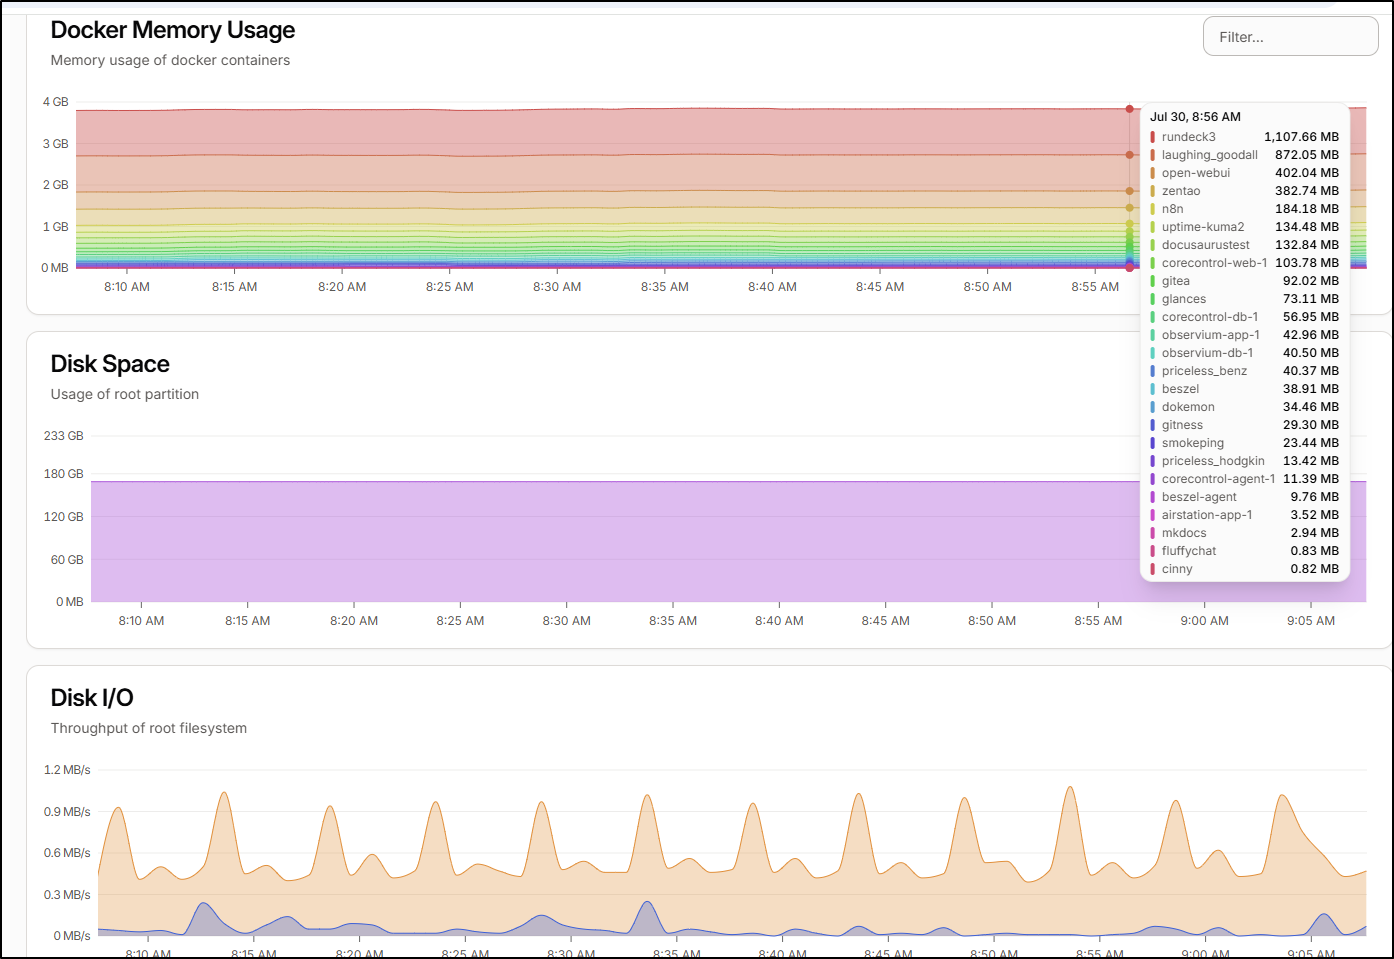
Looking at that report, we see the Beszel agent uses about 9.8Mb of memory and glances (used for Core) takes about 72Mb.
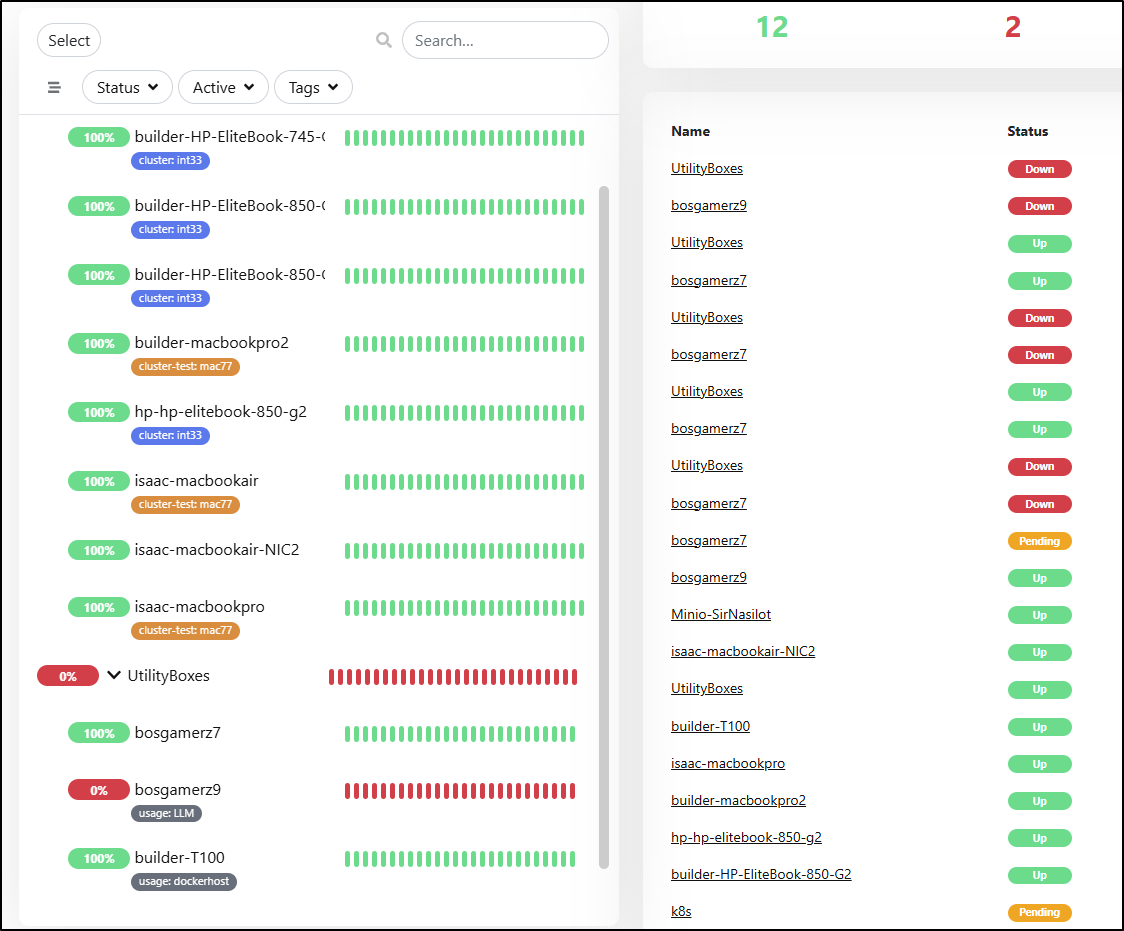
I also have to consider the server monitoring we get in Uptime Kuma
Another issue I have with CoreControl is that once I added most of my servers, the width of the Network graph became rather unusable. Even at it’s most zoomed out, I can just see 5 servers at a time
Similarly with “Uptime”, the UI needs a more minimal view option as I can just see 4 apps at a time
Summary
Fasttrack, a simple app for tracking fasts worked fine. The UI was easy enough to use on my phone and it did the trick. I’m not obsessed with fasting though so it seems like a fine app that I’ll use infrequently.
Gancio, a shared agenda/meetup dashboard for communities seems really quite interesting. I likely have some speaking engagements coming up soon and when details are locked in, I’ll update the board at https://gancio.tpk.pw/. I’m debating renaming it to “Calendar” or “Meetup” or something that would be clearer to an English speaking audience. The word means “hook” in Italian, hence the icon. And I do like to fish…
Lastly, CoreControl is really interesting. It combines some of the dashboard type of apps we’ve covered with some of the monitoring ones, like Beszel. I populated my servers and a bunch (but not all) of my applications. I like the ideas CoreControl has - mapping apps to servers and using an existing OS container ( Glances ) to handle the REST backend as an agent. What I don’t like, however, is the chunky UI. things doesn’t have a high level overview and I hate to scroll to see data. I’m going to give it a bit to see if I keep it or I go back to Beszel.