

Published: Jul 31, 2025 by Isaac Johnson
Today we’re going to cover backing up very large GIT repos to a local fileserver, specifically an NFS mount on a NAS. I’ll then look at upgrading our Uptime Kuma to a much improved 2.0 beta3 contrasting some of the new features we can see in the 2.x line. I’ll cover cutover and usage including setting up Grafana Cloud and using Grafana IRM (formerly OnCall).
I’ll show how to fix (for good) the feedback form which uses a Github Repository dispatch with a new non-expiring narrow Github narrowly defined token. Lastly, we’ll touch on using Datadog to help find and fix some containers really slowing down our primary production kubernetes cluster.
But first, let’s show how to use a Synology NAS for a GIT server (for backups).
GIT Repos on a NAS
One of the first things I wanted to tackle was backing up my very large Git repo to a locally controlled NAS. I’m always worried what might happen if something errantly deleted it or made a force push modification.
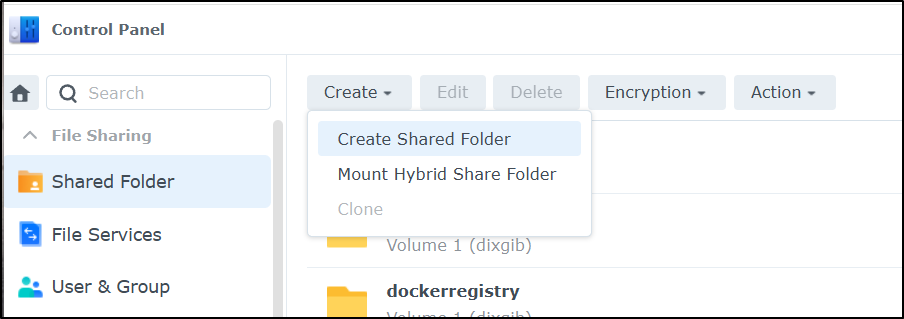
First, in the Synology NAS, in “Control Panel” and “Shared Folder”, create a home for GIT repos
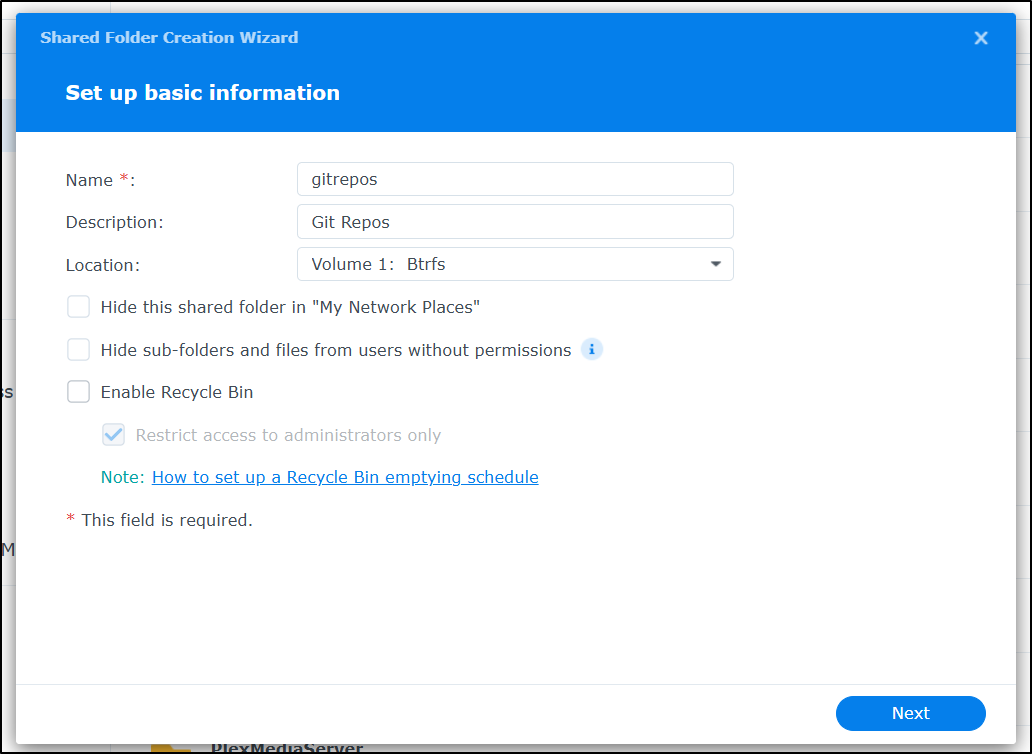
I’ll give it a name and disable the recycle bin
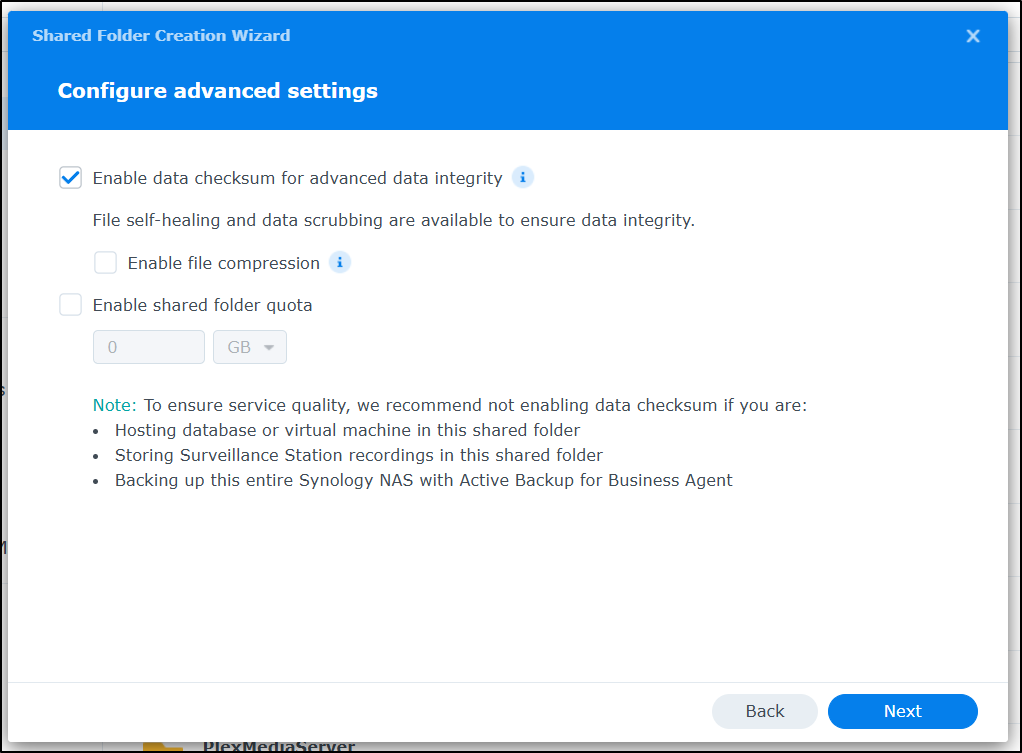
I’m going to add data integrity checking
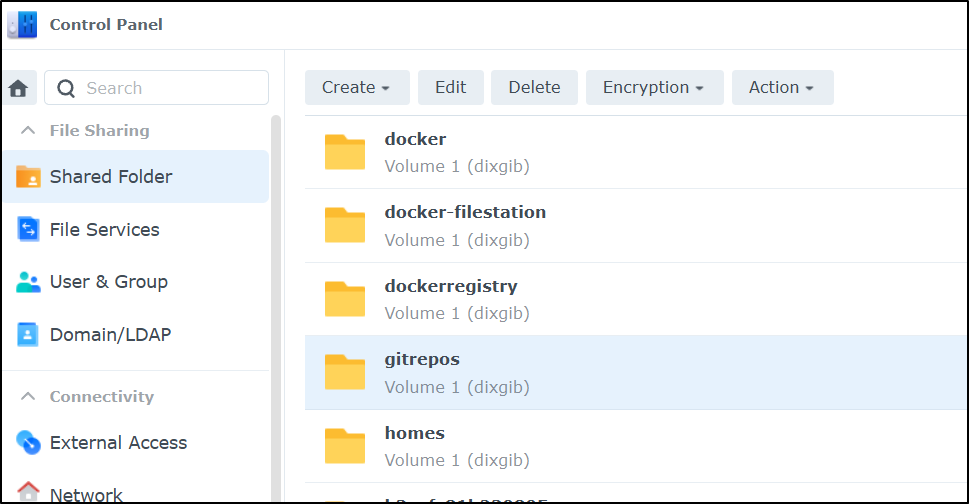
I’ll share it with my ijohnson user as well, then create. Now that it’s created
Back on the NAS, I’ll SSH as ijohnson and create a folder for my destination repo.
ijohnson@sirnasilot:~$ cd /volume1/gitrepos/
ijohnson@sirnasilot:/volume1/gitrepos$ mkdir jekyll-blog
ijohnson@sirnasilot:/volume1/gitrepos$
We need to make it bare to work
ijohnson@sirnasilot:/volume1/gitrepos/jekyll-blog$ git init --bare
hint: Using 'master' as the name for the initial branch. This default branch name
hint: is subject to change. To configure the initial branch name to use in all
hint: of your new repositories, which will suppress this warning, call:
hint:
hint:   git config --global init.defaultBranch <name>
hint:
hint: Names commonly chosen instead of 'master' are 'main', 'trunk' and
hint: 'development'. The just-created branch can be renamed via this command:
hint:
hint:   git branch -m <name>
Initialized empty Git repository in /volume1/gitrepos/jekyll-blog/
Now, back on my PC, i can add a new origin and push the repo to the NAS for safe keeping
builder@DESKTOP-QADGF36:~/Workspaces/jekyll-blog$ git push originnas4 main
ijohnson@192.168.1.116's password:
fatal: '/volume1/gitrepos/jekyll-blog' does not appear to be a git repository
fatal: Could not read from remote repository.

Please make sure you have the correct access rights
and the repository exists.
builder@DESKTOP-QADGF36:~/Workspaces/jekyll-blog$ git push originnas4 main
ijohnson@192.168.1.116's password:
Enumerating objects: 20217, done.
Counting objects: 100% (20217/20217), done.
Delta compression using up to 16 threads
Compressing objects: 100% (17709/17709), done.
Writing objects: 100% (20217/20217), 5.05 GiB | 28.17 MiB/s, done.
Total 20217 (delta 2776), reused 16824 (delta 2325)
remote: Resolving deltas: 100% (2776/2776), done.
To ssh://192.168.1.116:/volume1/gitrepos/jekyll-blog
 * [new branch]        main -> main
I can see this (very large) repo is now safely stored
ijohnson@sirnasilot:/volume1/gitrepos$ du -chs ./jekyll-blog/
5.1G    ./jekyll-blog/
5.1G    total
Uptime Kuma
Our current Uptime Kuma
runs on a docker container on the Docker host
$ kubectl get endpoints | grep uptime
uptime-external-ip                                      192.168.1.99:3101                                                 505d
There I can see we are running version 1.23.3
CONTAINER ID   IMAGE                                                            COMMAND                  CREATED         STATUS                 PORTS                                                                              NAMES
1700cf832175   louislam/uptime-kuma:1.23.3                                      "/usr/bin/dumb-init …"   21 months ago   Up 3 weeks (healthy)   0.0.0.0:3101->3001/tcp, :::3101->3001/tcp                                          uptime-kuma-1233b
I can look at the listing in Dockerhub and see we have up to 2.0 beta3 available now
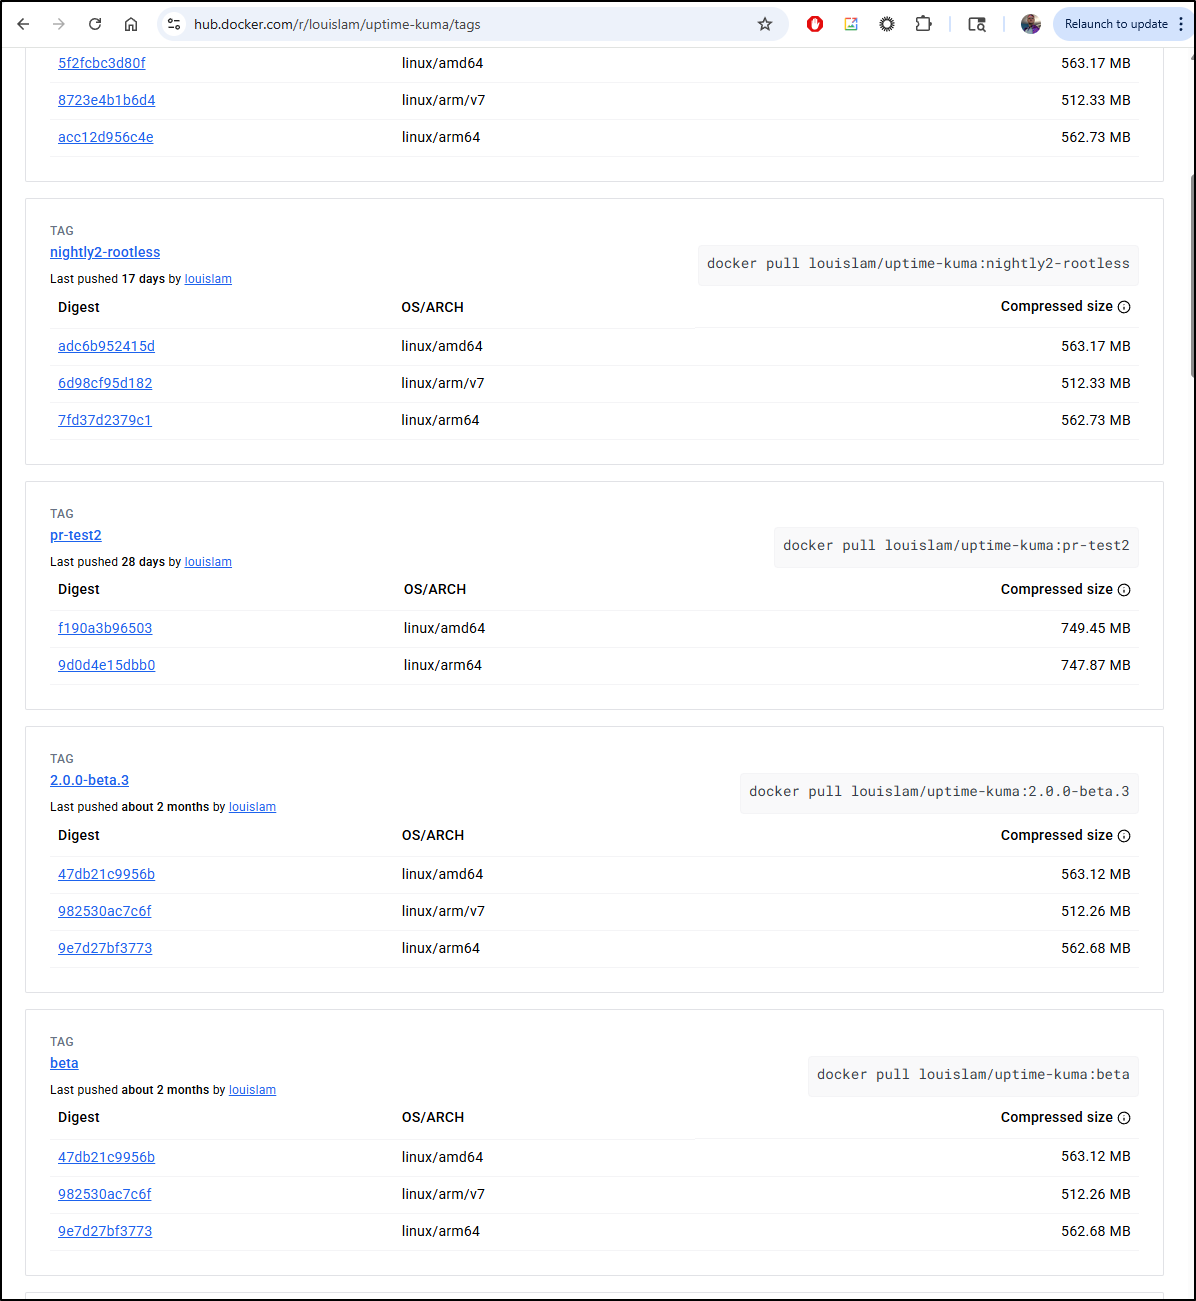
Let’s test that before we commit to using a beta version
I’ll pull it down
$ docker pull louislam/uptime-kuma:2.0.0-beta.3
2.0.0-beta.3: Pulling from louislam/uptime-kuma
61320b01ae5e: Already exists
057bf83be68a: Pull complete
d34dc2c1b56b: Pull complete
b12d1e6fd3ba: Pull complete
d9d139bf2ac2: Pull complete
dee3e095122f: Pull complete
b3bb6e0218a8: Pull complete
34358a26e336: Pull complete
e0ca47558051: Pull complete
8fcf95f1cbdd: Pull complete
92a41d2e8868: Pull complete
18df373464a0: Pull complete
6de0eb6f16fa: Pull complete
a3a168ba7927: Pull complete
Digest: sha256:0c699f39b1952652e809966618c731d7c37b11bcbd7bdc240f263e84f14e1786
Status: Downloaded newer image for louislam/uptime-kuma:2.0.0-beta.3
docker.io/louislam/uptime-kuma:2.0.0-beta.3
Then start with:
docker run -d –restart=unless-stopped -p 3001:3001 -v uptime-kuma:/app/data –name uptime-kuma louislam/uptime-kuma:2.0.0-beta.3
In my case I needed to stop and remove the old container
$ docker stop uptime-kuma
uptime-kuma
$ docker rm uptime-kuma
uptime-kuma
$ docker run -d --restart=unless-stopped -p 3001:3001 -v uptime-kuma:/app/data --name uptime-kuma louislam/uptime-kuma:2.0.0-beta.3
8d441bce2f0cefe2c26f4d40a99552c3e936b886d3307f9a8cb42dc73b012937
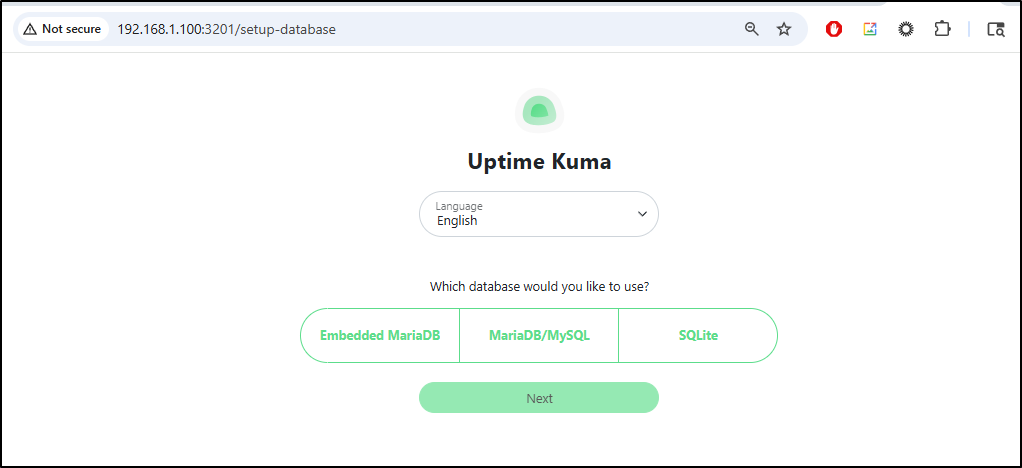
This is new… I have a database picker on first launch
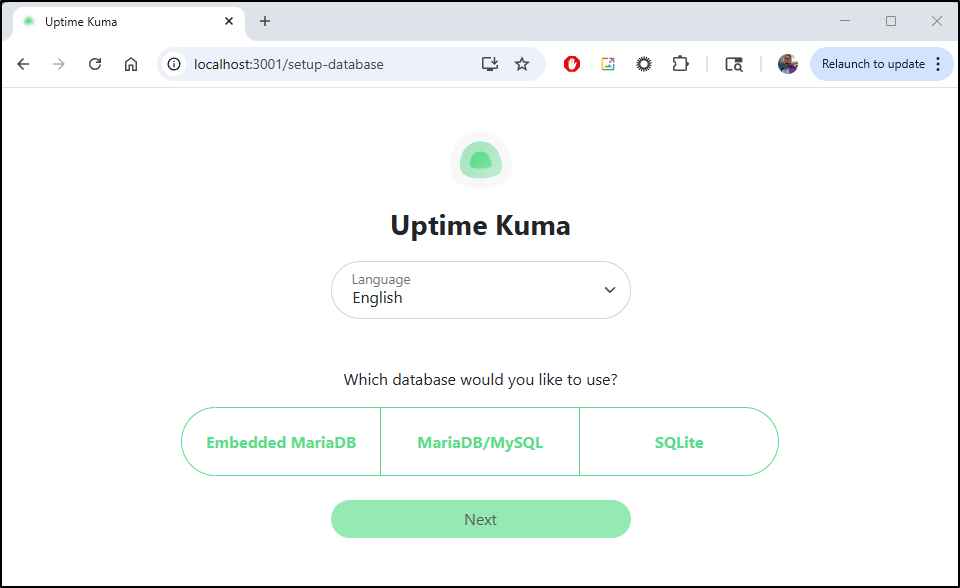
SQLite matches what has always been used, and the Embedded MariaDB is new. I found it interesting we can now use an external database as well
After I picked a database and it initialized, I was then prompted to create a user
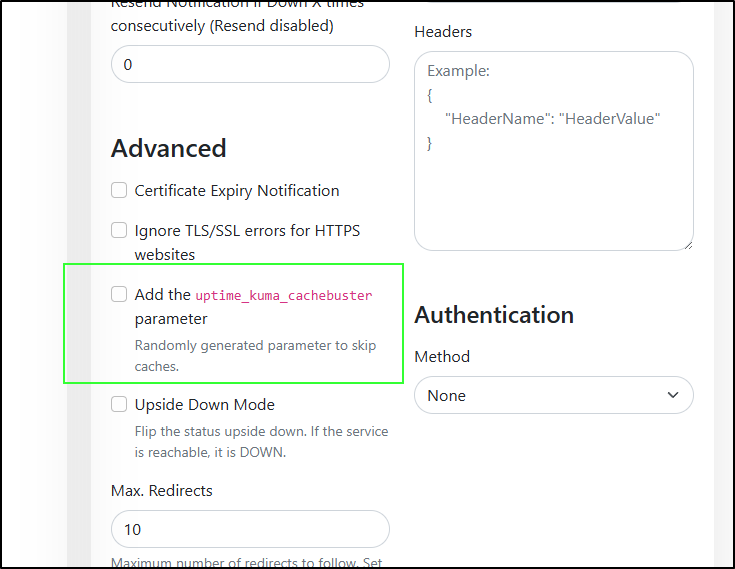
The first feature that I noticed was a new parameter we can use in our monitors “cachebuster”:
I was going to compare Notification Providers
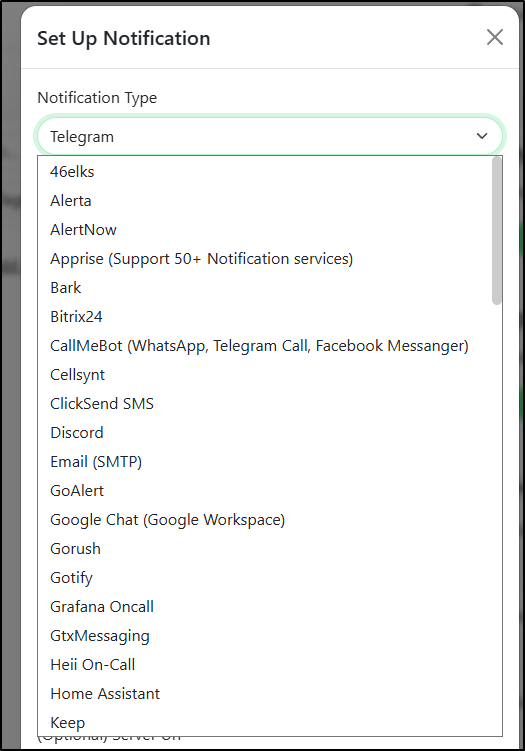
But there are too many new ones to list. You can view them all in server/notification-providers in Github or components/notifications
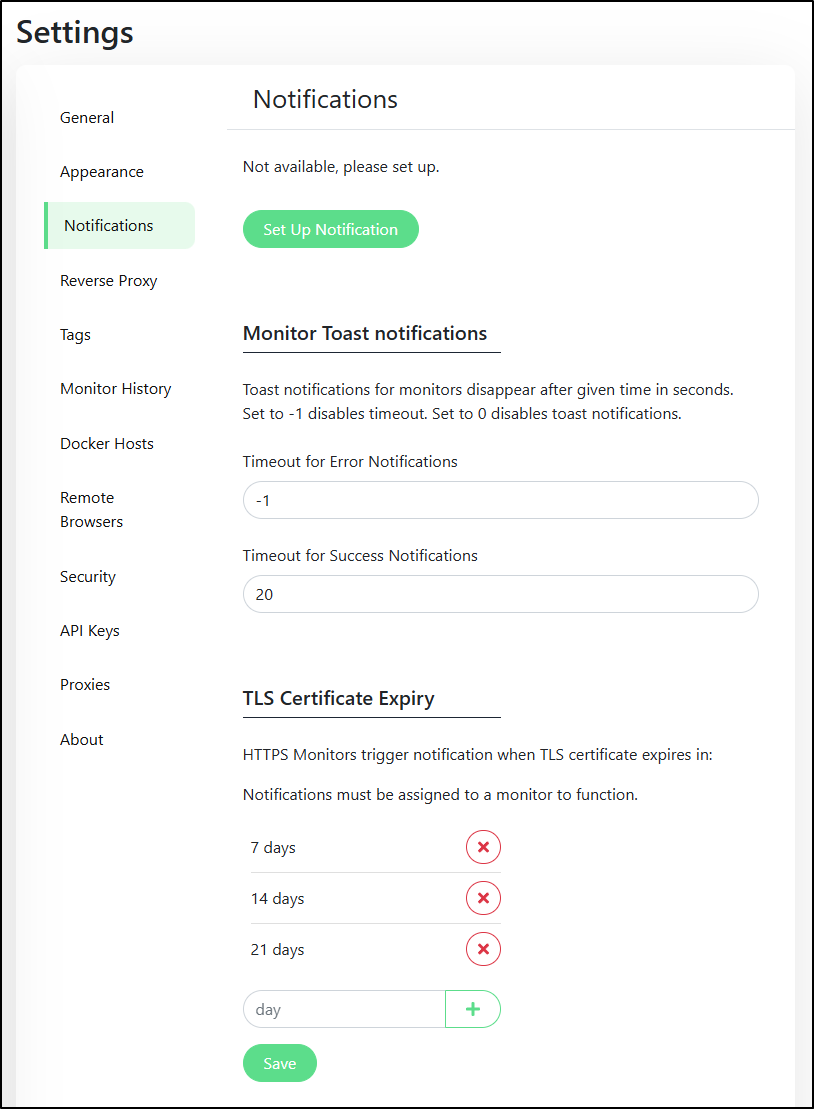
In settings, there is a new “Monitor Toast notifications” section
There is a new section altogether called “Remote Browsers”
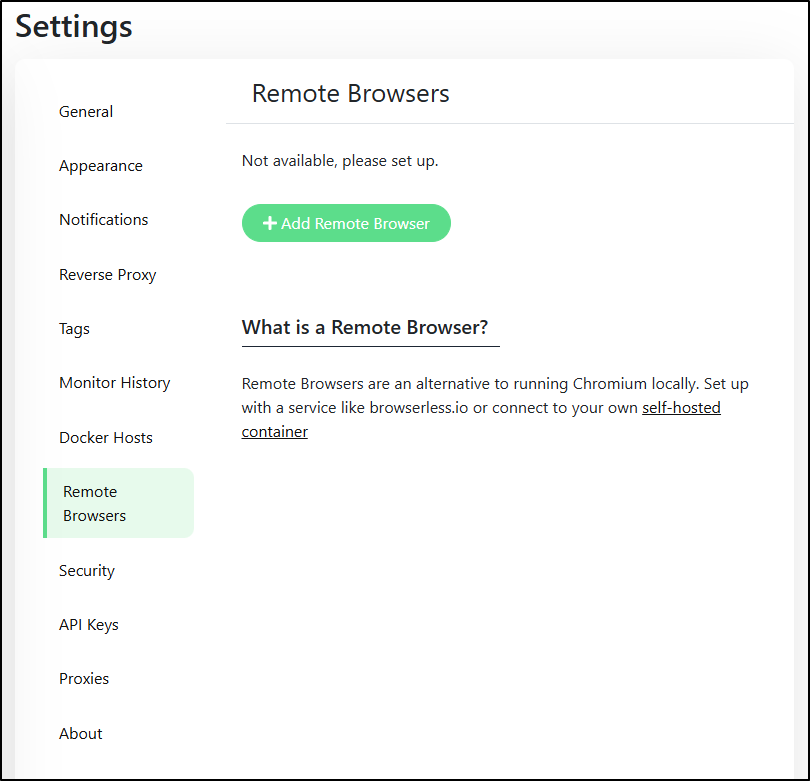
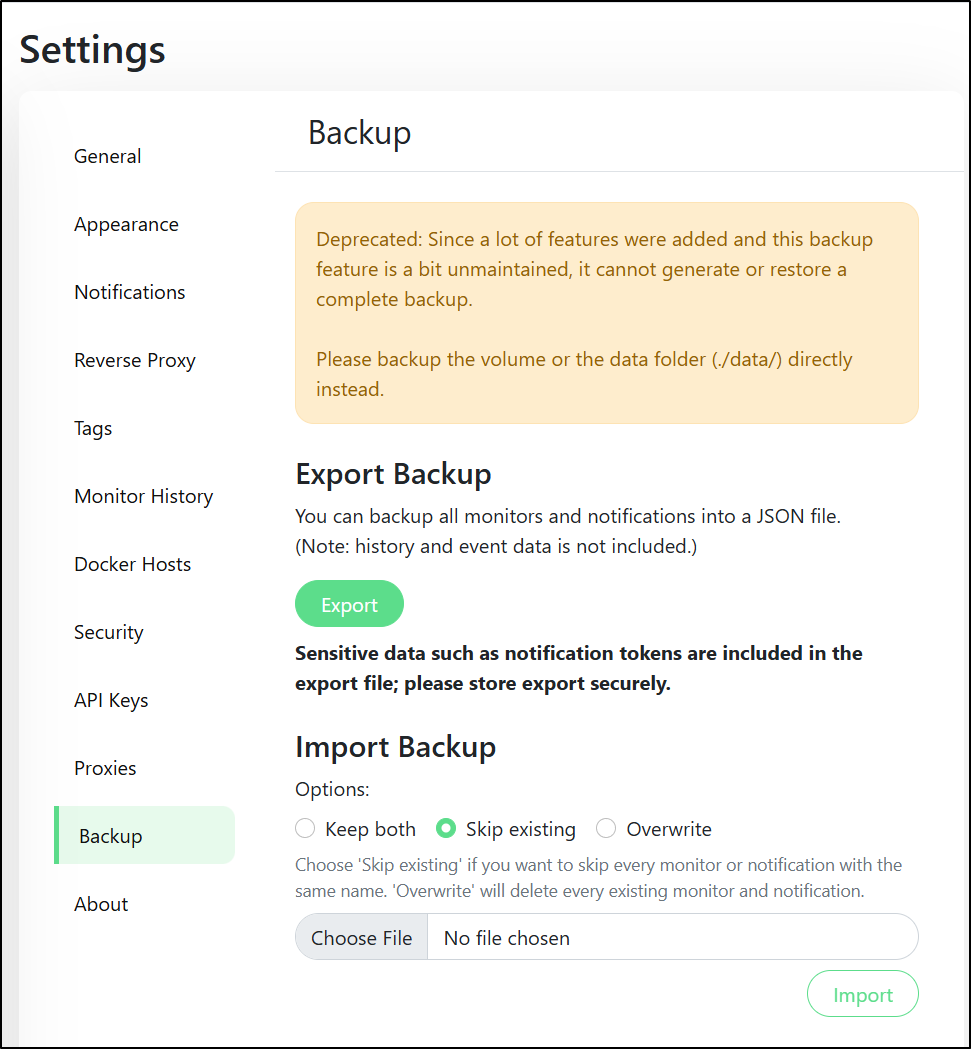
The only things really missing are those wonkier features that were already marked deprecated like backups
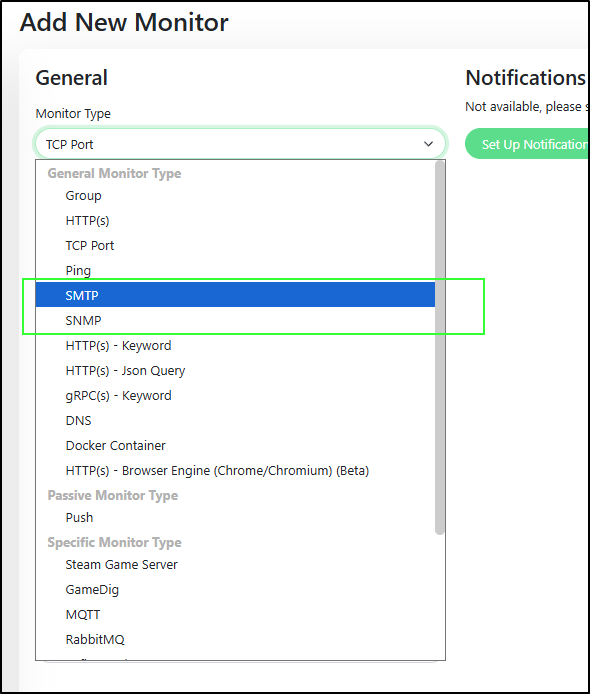
Lastly, I noticed there are some new Monitor types for SMTP and SNMP
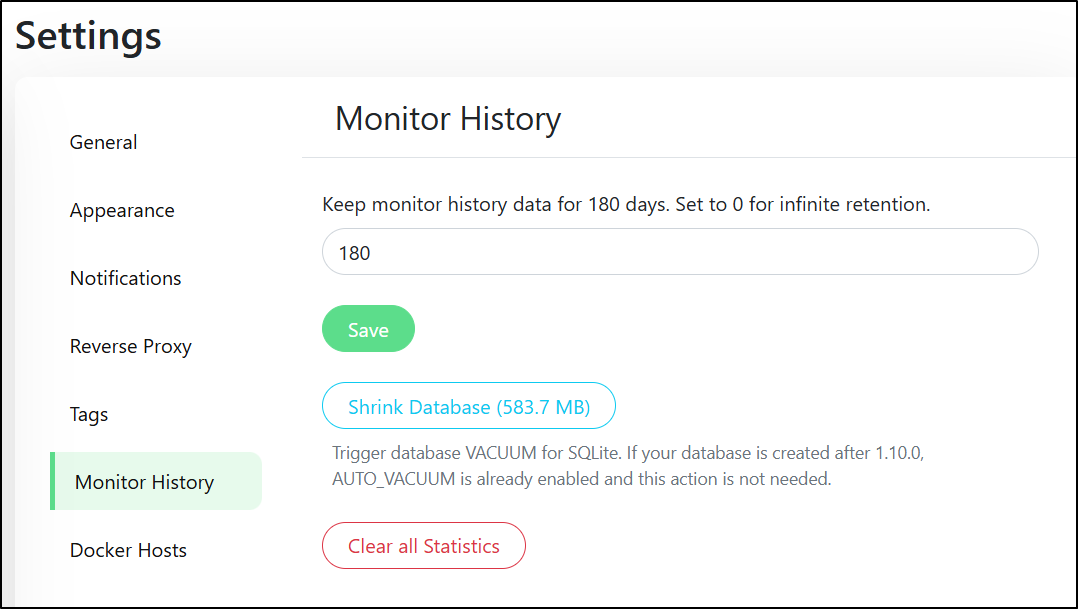
I’m tempted to start fresh as I have a few volumes so far
builder@builder-T100:~$ docker volume ls | grep uptime
local     uptime-kuma
local     uptime-kuma1233
local     uptime-kuma1233b
And the current volume is half a gig
Approach 1: Copy
I’m somewhat worried about an upgrade going wrong and losing my Uptime configuration. I would be a lot more comfortable creating a “new” instance and migrating over to it.
I’ll make a new volume just for this 2.0 instance then launch on a new port. I plan to keep an eye on tags in case a new 2.0 comes out
builder@builder-T100:~$ docker volume create uptimekuma2
uptimekuma2
builder@builder-T100:~$ docker run -d --restart=unless-stopped -p 3201:3001 -v uptime-kuma2:/app/data --name uptime-kuma2 louislam/uptime-kuma:2.0.0-beta.3
Unable to find image 'louislam/uptime-kuma:2.0.0-beta.3' locally
2.0.0-beta.3: Pulling from louislam/uptime-kuma
61320b01ae5e: Pull complete
057bf83be68a: Pull complete
d34dc2c1b56b: Pull complete
b12d1e6fd3ba: Pull complete
d9d139bf2ac2: Pull complete
dee3e095122f: Pull complete
b3bb6e0218a8: Pull complete
34358a26e336: Pull complete
e0ca47558051: Pull complete
8fcf95f1cbdd: Pull complete
92a41d2e8868: Pull complete
18df373464a0: Pull complete
6de0eb6f16fa: Pull complete
a3a168ba7927: Pull complete
Digest: sha256:0c699f39b1952652e809966618c731d7c37b11bcbd7bdc240f263e84f14e1786
Status: Downloaded newer image for louislam/uptime-kuma:2.0.0-beta.3
7667c491a40531e6fc9909f9b7d6fdaf30c4bb3fe2bbccf10fa37efb7da72385
I can now do the setup steps again
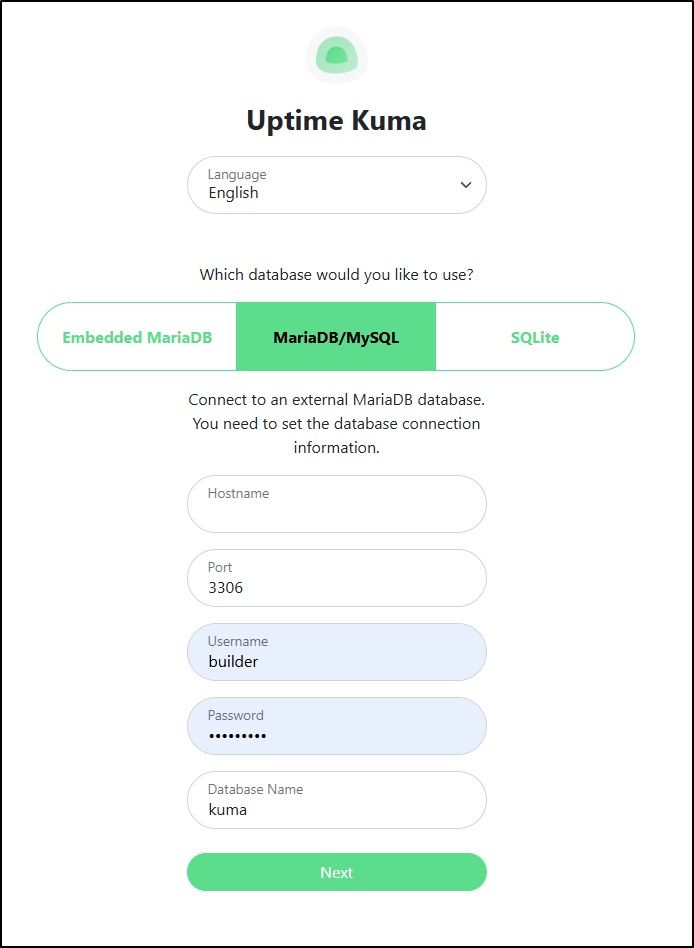
I think I will use an external MariaDB (MySQL) database this time.
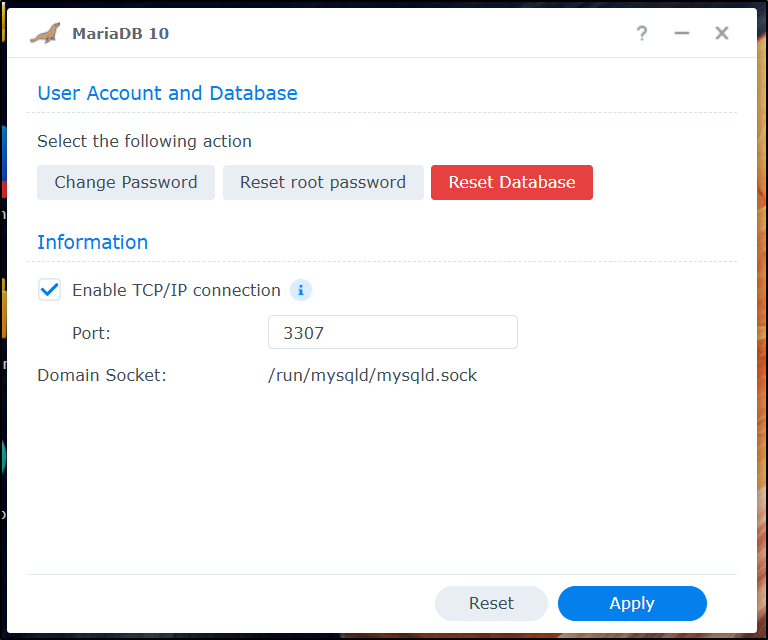
I went to my NAS and logged into MariaDB 10
root@SassyNassy:~# /usr/local/mariadb10/bin/mysql -u root -p
Enter password:
Welcome to the MariaDB monitor.  Commands end with ; or \g.
Your MariaDB connection id is 851089
Server version: 10.3.32-MariaDB Source distribution

Copyright (c) 2000, 2018, Oracle, MariaDB Corporation Ab and others.

Type 'help;' or '\h' for help. Type '\c' to clear the current input statement.

MariaDB [(none)]> SELECT User, Host FROM mysql.user WHERE Host <> 'localhost';
+---------+-----------+
| User    | Host      |
+---------+-----------+
| forgejo | %         |
| phpiam  | %         |
| yourls  | %         |
| root    | 127.0.0.1 |
| root    | ::1       |
+---------+-----------+
5 rows in set (0.200 sec)

MariaDB [(none)]>
I can now create a new Database and User for Kuma then grant that user all privileges to the new database
MariaDB [(none)]> CREATE DATABASE kuma;
Query OK, 1 row affected (0.020 sec)

MariaDB [(none)]> CREATE USER 'kuma'@'%' IDENTIFIED BY 'NOTTHEPASSWORD';
Query OK, 0 rows affected (0.432 sec)

MariaDB [(none)]> GRANT ALL PRIVILEGES ON kuma.* TO 'kuma'@'%';
Query OK, 0 rows affected (0.001 sec)

MariaDB [(none)]> FLUSH PRIVILEGES;
Query OK, 0 rows affected (0.013 sec)

MariaDB [(none)]>
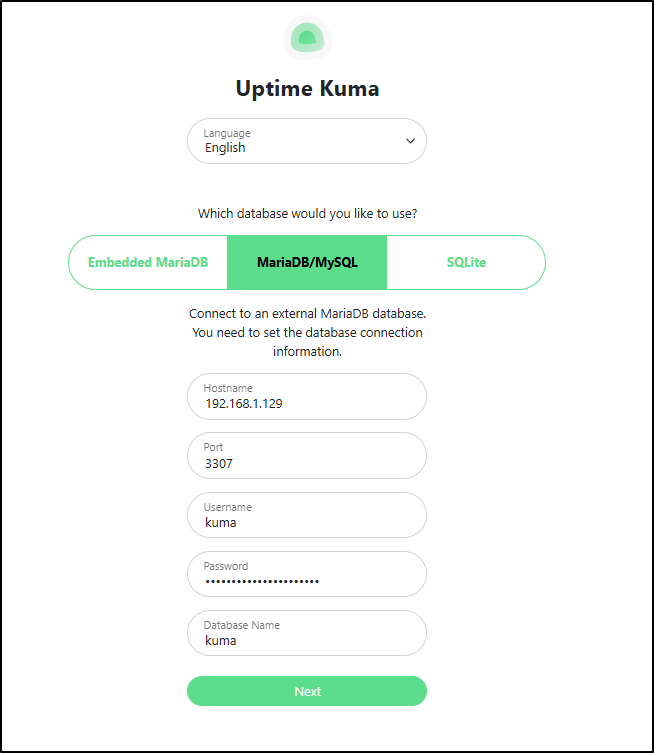
_(Note: the default port for MySQL/MariaDB is _3306, but my Synology serves it on 3307)
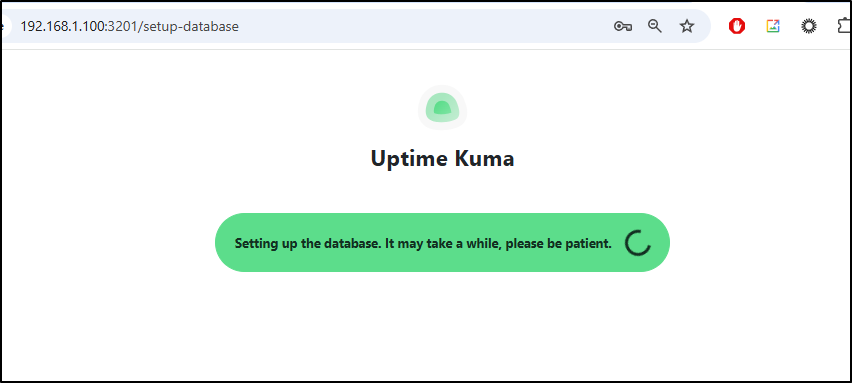
I can now see it is setting up the DB
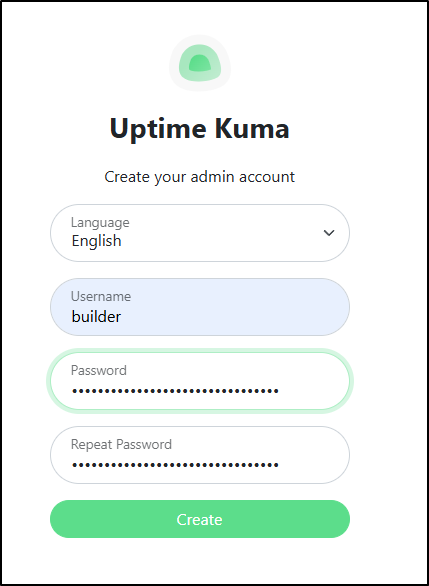
Lastly, I create my admin account
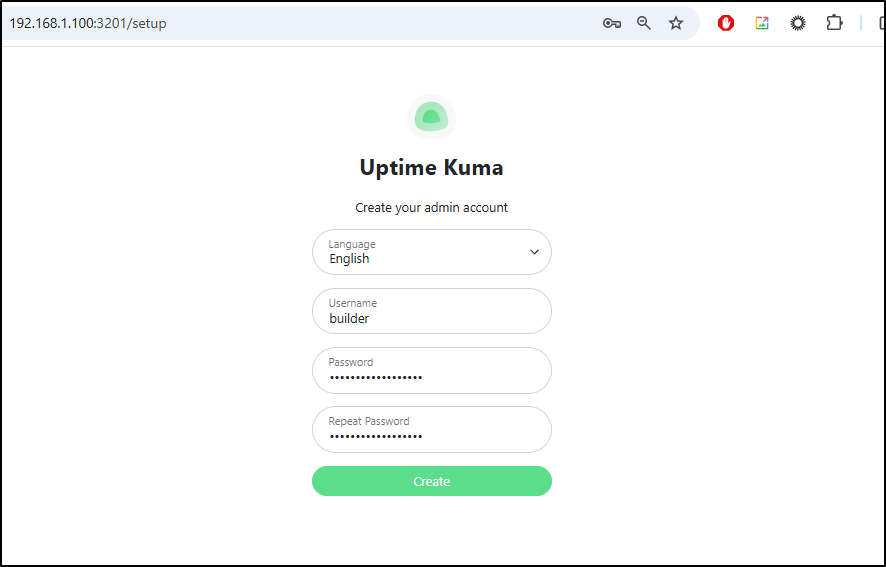
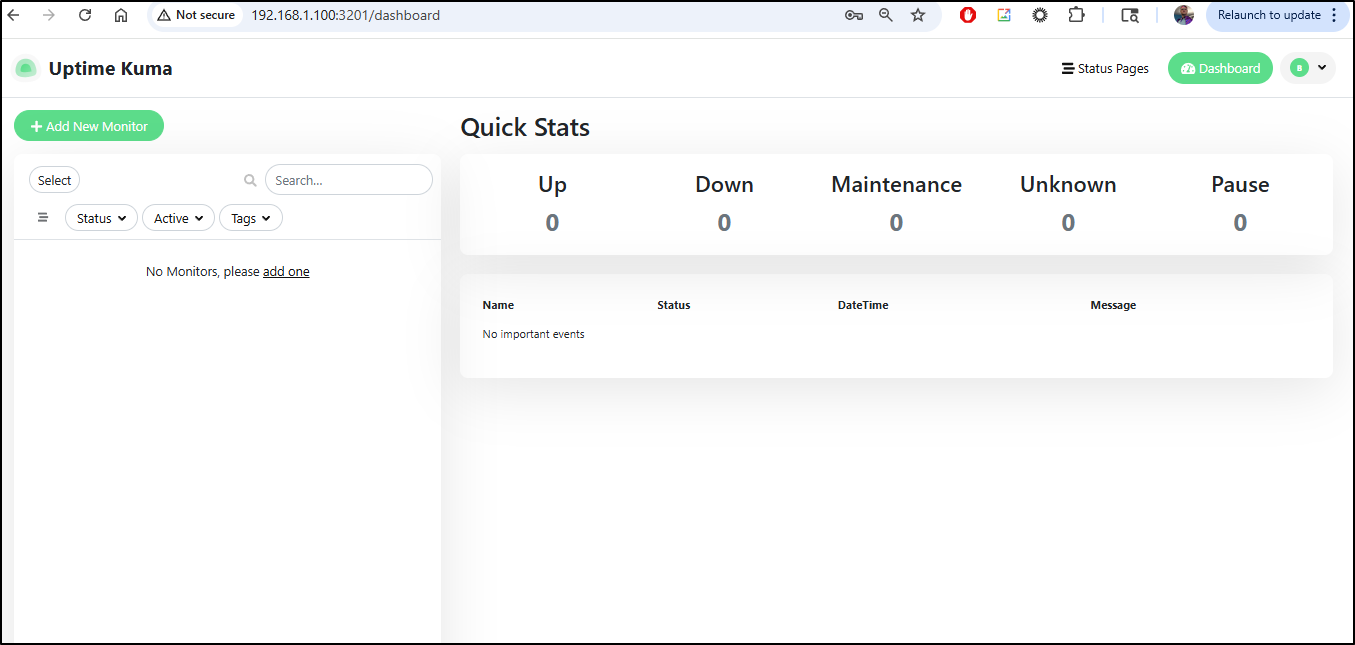
I now have a blank instance on the new port
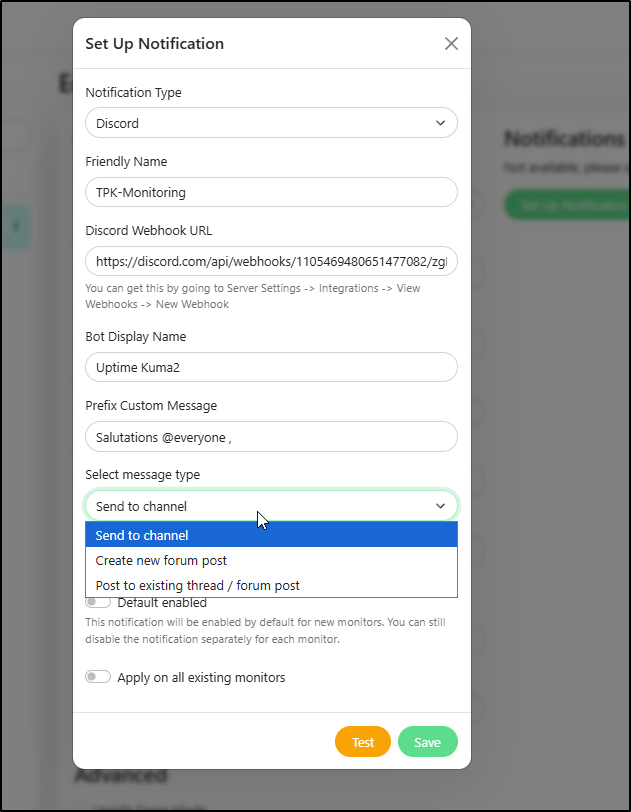
As I was replicating alerts, I kept finding new new things
For instance, Discord now has a “message type” option that didn’t exist before
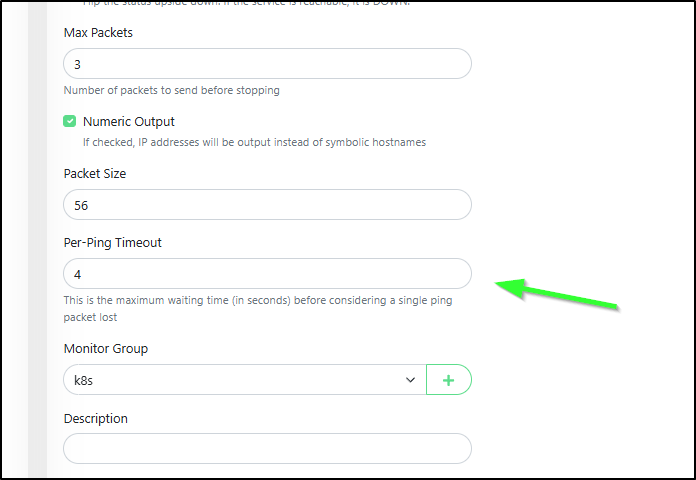
Or with Ping tests, there is now a Per-Ping timeout value (default 2)
As I added notification channels
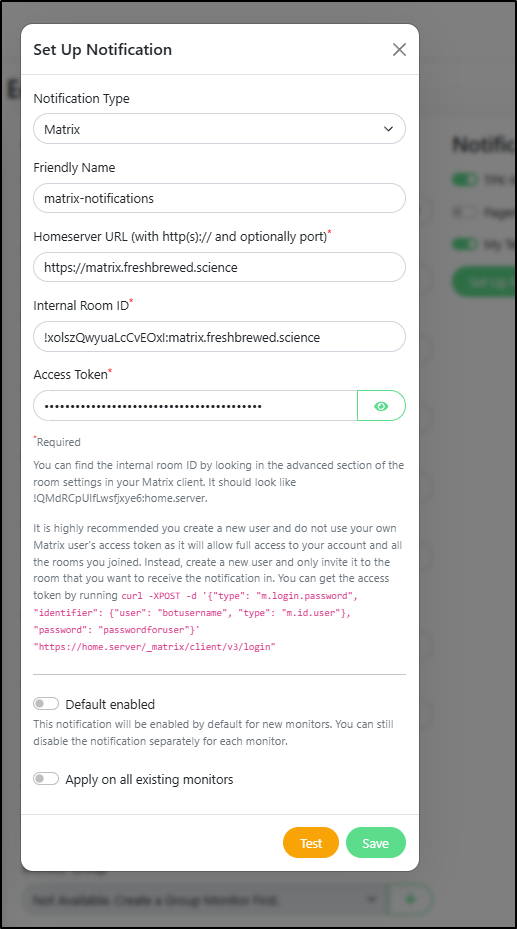
I made sure to test them
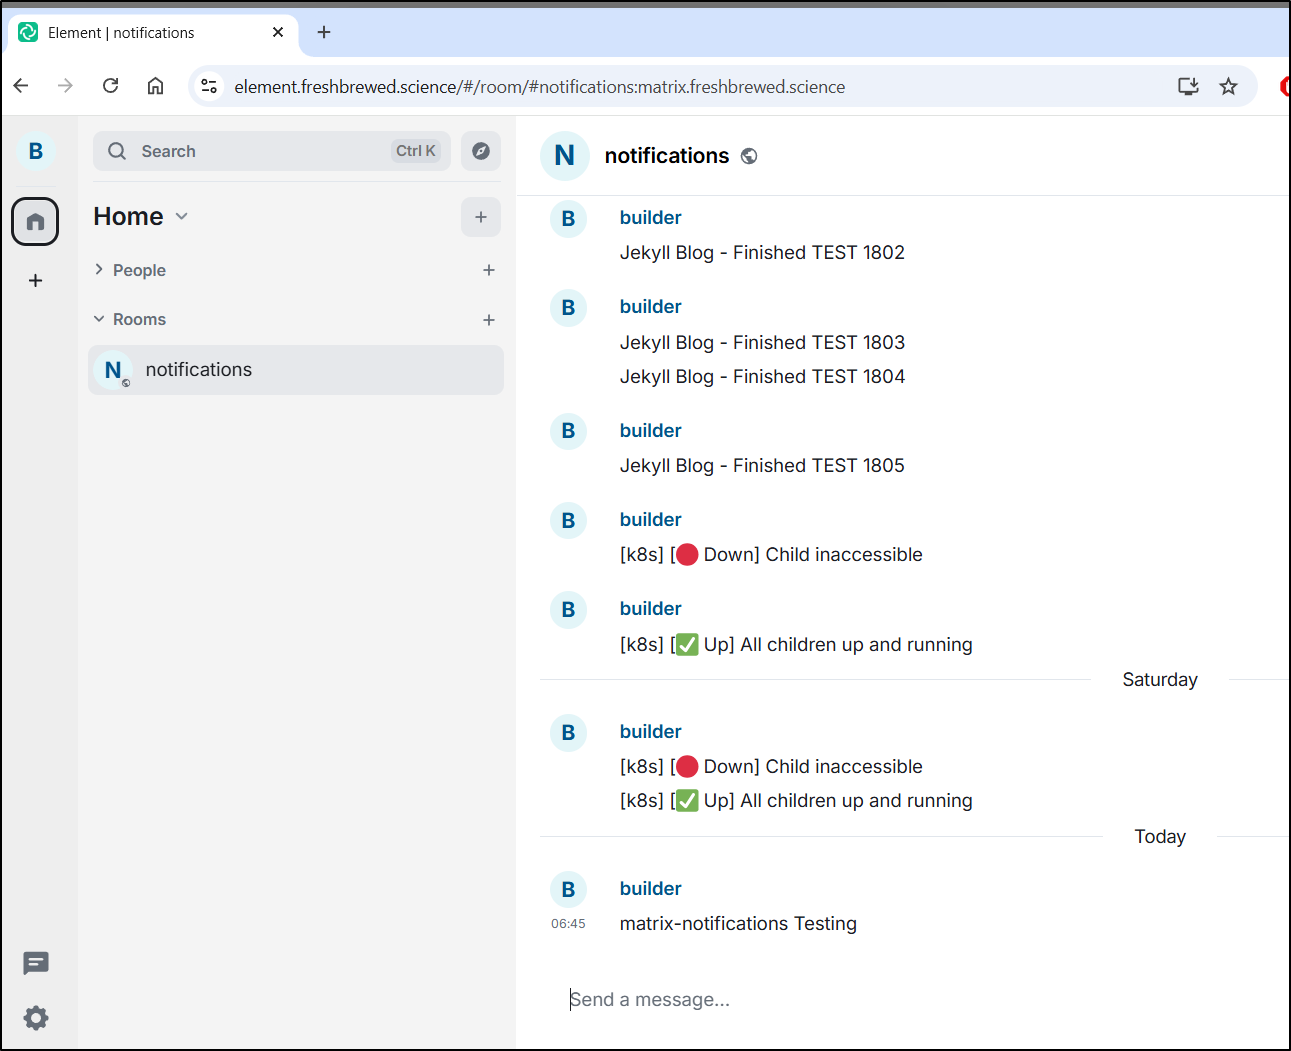
Eventually I got everything organized and updated in the new Uptime system
I should just be able to now switch the external IP for the endpoint in Kubernetes to redirect my existing Uptime ingress
$ kubectl get endpoints | grep uptime
uptime-external-ip                                      192.168.1.99:3101                                                 512d
$ kubectl get endpoints uptime-external-ip
NAME                 ENDPOINTS           AGE
uptime-external-ip   192.168.1.99:3101   512d
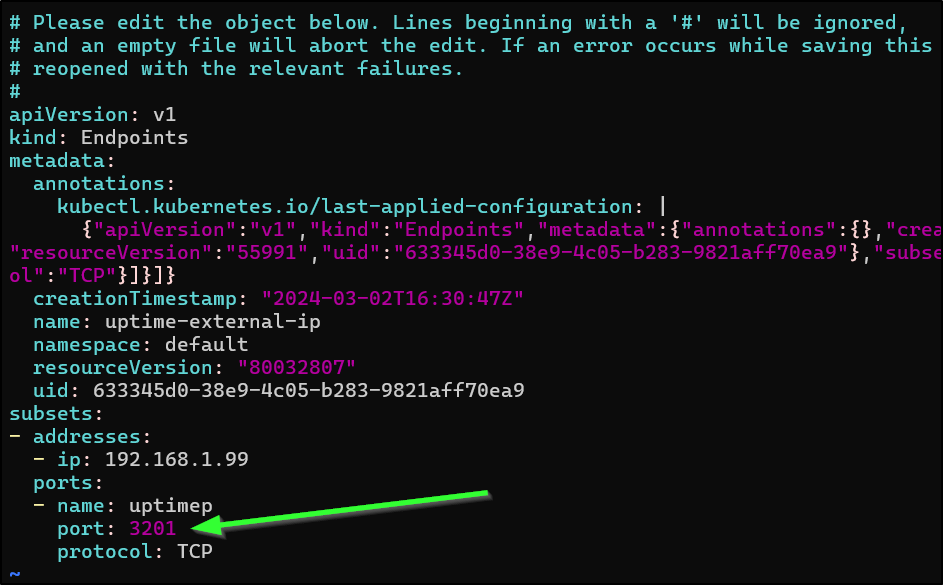
I can just edit it
$ kubectl edit endpoints uptime-external-ip
endpoints/uptime-external-ip edited
and change the value from the older 3101 to 3201
Yet, that did not work
I changed it back and it was happy. I might have to do this in a bigger way
I’ll grab the old service to a YAML file
$ kubectl get svc uptime-external-ip -o yaml > uptime.svc.yaml
$ kubectl get endpoints uptime-external-ip -o yaml >> uptime.svc.yaml
I then cleaned it up and made a “new” version
$ cat ./uptime.svc.yaml
apiVersion: v1
kind: Service
metadata:
  name: uptime-external-ip-new
spec:
  clusterIP: None
  clusterIPs:
  - None
  internalTrafficPolicy: Cluster
  ipFamilies:
  - IPv4
  - IPv6
  ipFamilyPolicy: RequireDualStack
  ports:
  - name: uptimepnew
    port: 80
    protocol: TCP
    targetPort: 3201
  sessionAffinity: None
  type: ClusterIP
---
apiVersion: v1
kind: Endpoints
metadata:
  name: uptime-external-ip-new
subsets:
- addresses:
  - ip: 192.168.1.100
  ports:
  - name: uptimepnew
    port: 3201
    protocol: TCP
This meant giving a new name to the Endpoint, Service and port name.
$ kubectl apply -f ./uptime.svc.yaml
service/uptime-external-ip-new created
endpoints/uptime-external-ip-new created
I then pulled the ingress and updated the service name (yes, I misspelled that, i know)
$ kubectl get ingress uptimeingress -o yaml > uptimeimgres.yaml.bak
$ kubectl get ingress uptimeingress -o yaml > uptimeimgres.yaml
$ vi uptimeimgres.yaml
$ diff uptimeimgres.yaml uptimeimgres.yaml.bak
12c12
<     nginx.org/websocket-services: uptime-external-ip-new
---
>     nginx.org/websocket-services: uptime-external-ip
28c28
<             name: uptime-external-ip-new
---
>             name: uptime-external-ip
$ kubectl apply -f ./uptimeimgres.yaml
ingress.networking.k8s.io/uptimeingress configured
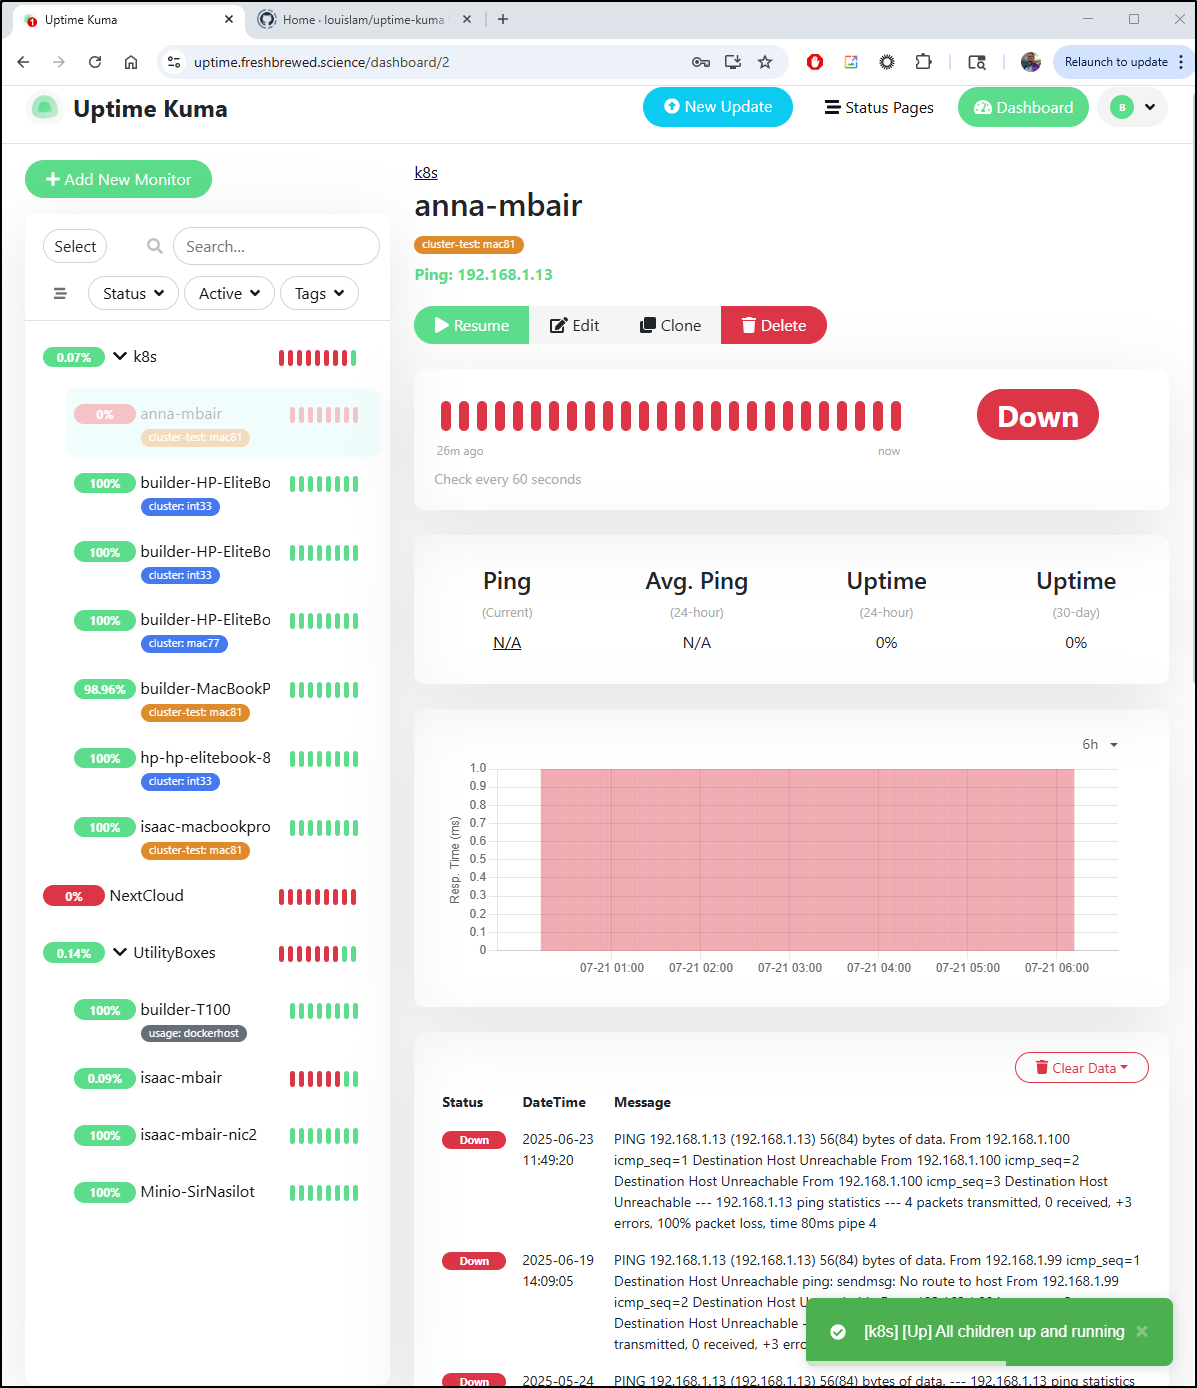
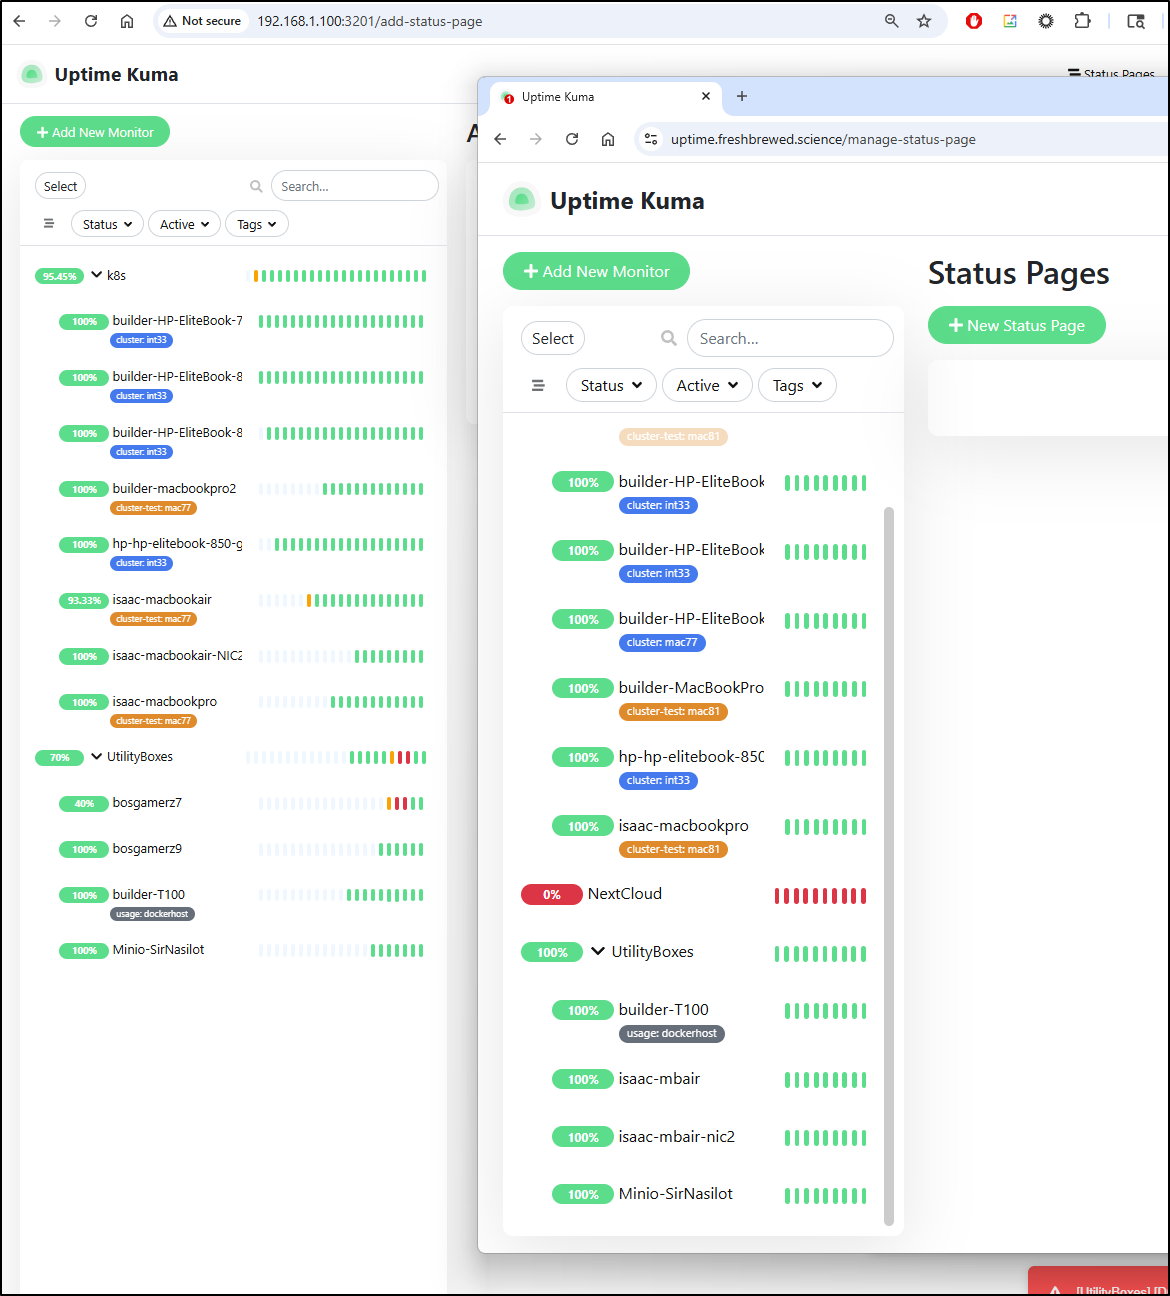
Now I can see the updated version
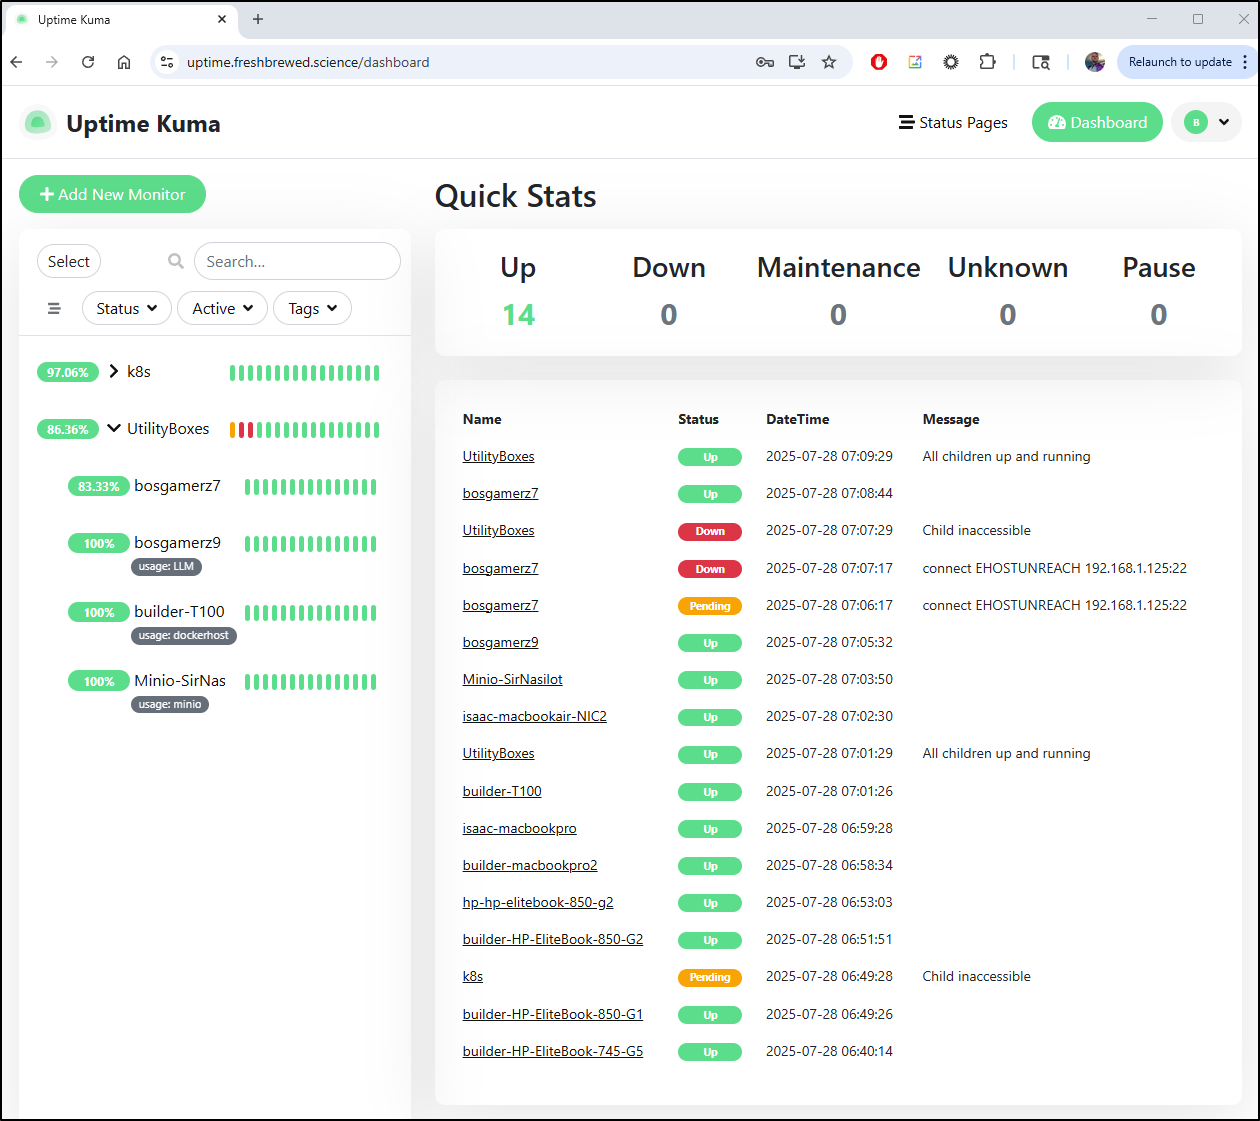
The last bit of cleanup is to power down the old so we don’t have two systems alerting us

Quick note, just so this does not errantly startup next time, let’s also set it to not restart
builder@builder-T100:~$ docker stop uptime-kuma-1233b
uptime-kuma-1233b
builder@builder-T100:~$ docker update --restart=no uptime-kuma-1233b
uptime-kuma-1233b
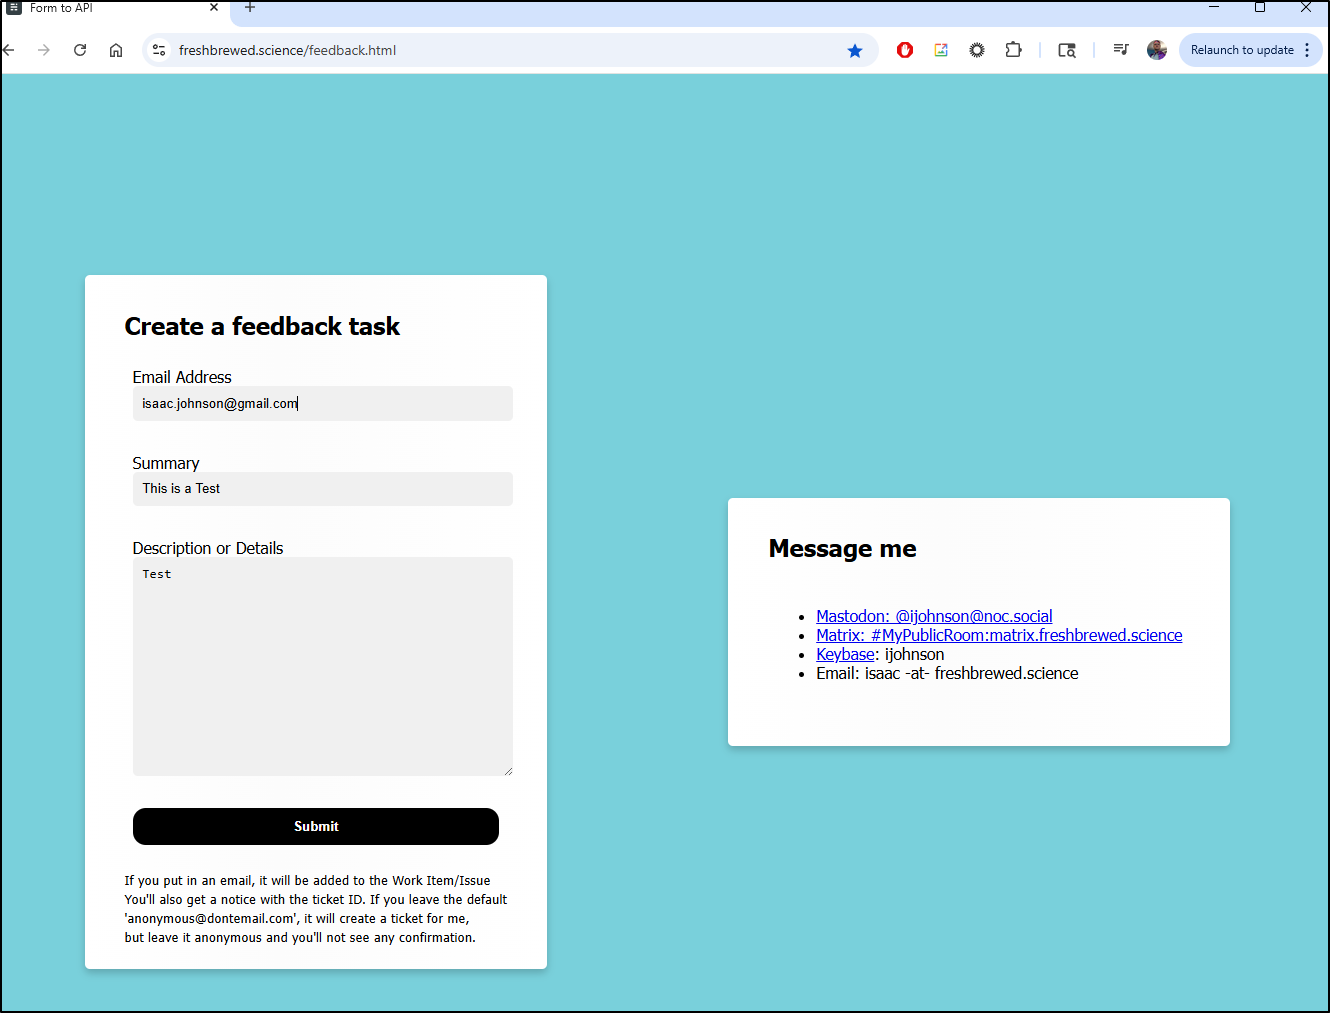
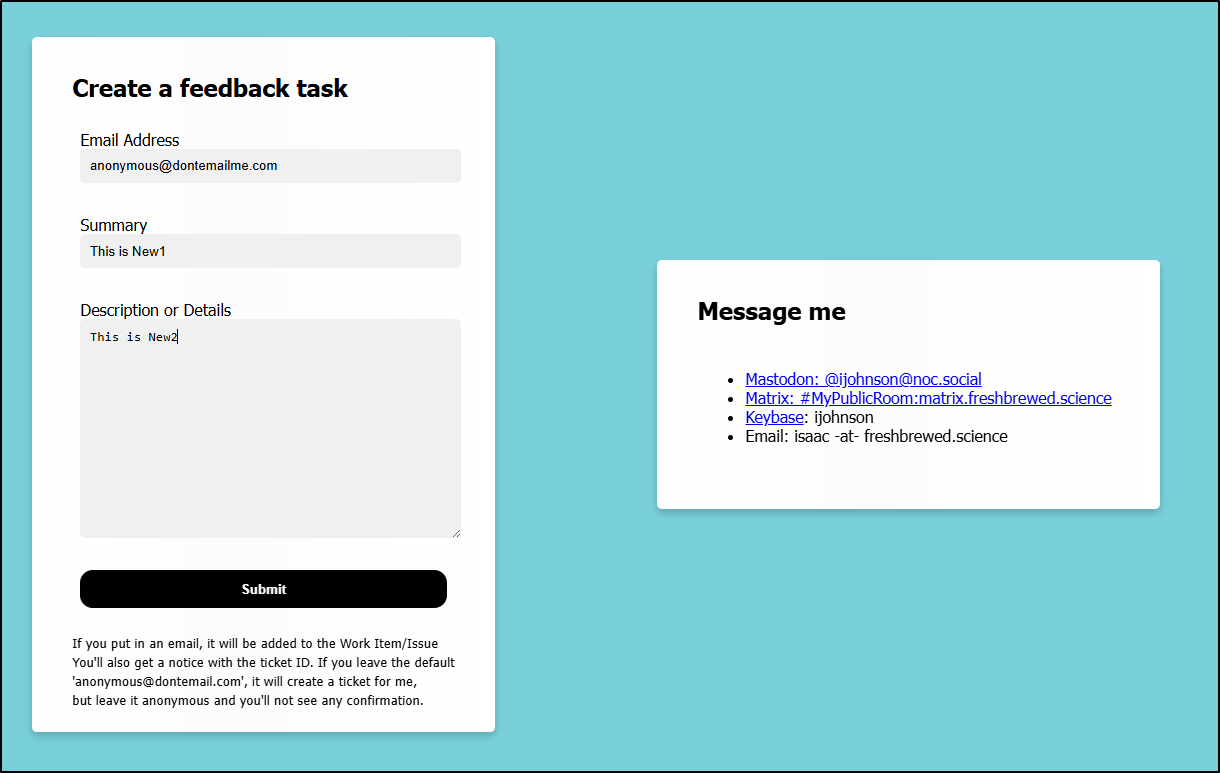
Feedback form
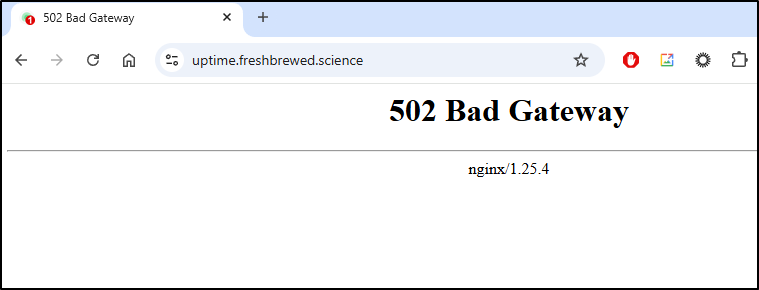
I worry about the feedback form dropping off from time to time.
I did a quick test
but didn’t see the action trigger.
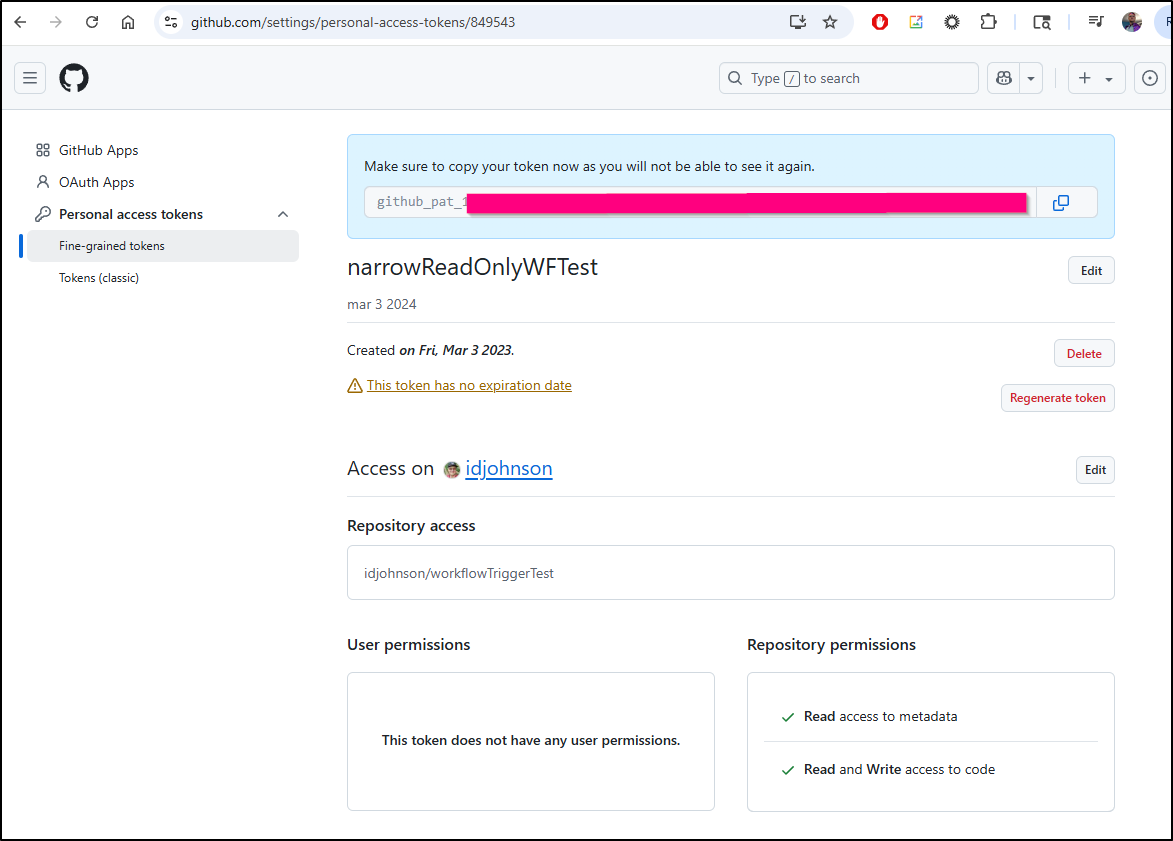
Digging into the bearer token, it had expired. I realize this is really best served by a narrow token (not classic).
I recreated it, this time without an expiration, but only focused on the one repo
I did a quick test:
$ curl -X POST -H "Accept: application/vnd.github+json" -H "Authorization: Bearer github_pat_xxxxxxxxxxxxxxxxxxxxxxxxxxxxxxxxxxxxxxxxxxxxxxxxxxx" -H "X-GitHub-Api-Version: 2022-11-28" https://api.github.com/re
pos/idjohnson/workflowTriggerTest/dispatches -d '{"event_type":"on-demand-payload","client_payload":{"summary":"this is the summary","descriptio
n":"this is the descriptionn","userid":"isaac@freshbrewed.science"}}'
Which triggered the flow.
This is bundled in app.c3f9f951.js and app.c3f9f951.js.map. I can add this to this blogs post update, but i might as well update this right now
$ aws s3 cp ./app.c3f9f951.js s3://freshbrewed.science/app.c3f9f951.js --acl public-read
upload: ./app.c3f9f951.js to s3://freshbrewed.science/app.c3f9f951.js
$ aws s3 cp ./app.c3f9f951.js.map s3://freshbrewed.science/app.c3f9f951.js.map --acl public-read
upload: ./app.c3f9f951.js.map to s3://freshbrewed.science/app.c3f9f951.js.map
And to make it live, we need to expire the old version in CloudFront (create an invalidation)
$ aws cloudfront create-invalidation --distribution-id E3U2HCN2ZRTBZN --paths "/app.c3f9f951.js"
{
    "Location": "https://cloudfront.amazonaws.com/2020-05-31/distribution/E3U2HCN2ZRTBZN/invalidation/I9H1WA1X1VEYPZZJEFE70TWGHC",
    "Invalidation": {
        "Id": "I9H1WA1X1VEYPZZJEFE70TWGHC",
        "Status": "InProgress",
        "CreateTime": "2025-07-28T17:08:23.655000+00:00",
        "InvalidationBatch": {
            "Paths": {
                "Quantity": 1,
                "Items": [
                    "/app.c3f9f951.js"
                ]
            },
            "CallerReference": "cli-1753722502-508817"
        }
    }
}
$ aws cloudfront create-invalidation --distribution-id E3U2HCN2ZRTBZN --paths "/app.c3f9f951.js.map"
{
    "Location": "https://cloudfront.amazonaws.com/2020-05-31/distribution/E3U2HCN2ZRTBZN/invalidation/I88YRKYP1WL9WYC88Q84VUII7N",
    "Invalidation": {
        "Id": "I88YRKYP1WL9WYC88Q84VUII7N",
        "Status": "InProgress",
        "CreateTime": "2025-07-28T17:08:33.171000+00:00",
        "InvalidationBatch": {
            "Paths": {
                "Quantity": 1,
                "Items": [
                    "/app.c3f9f951.js.map"
                ]
            },
            "CallerReference": "cli-1753722512-908545"
        }
    }
}
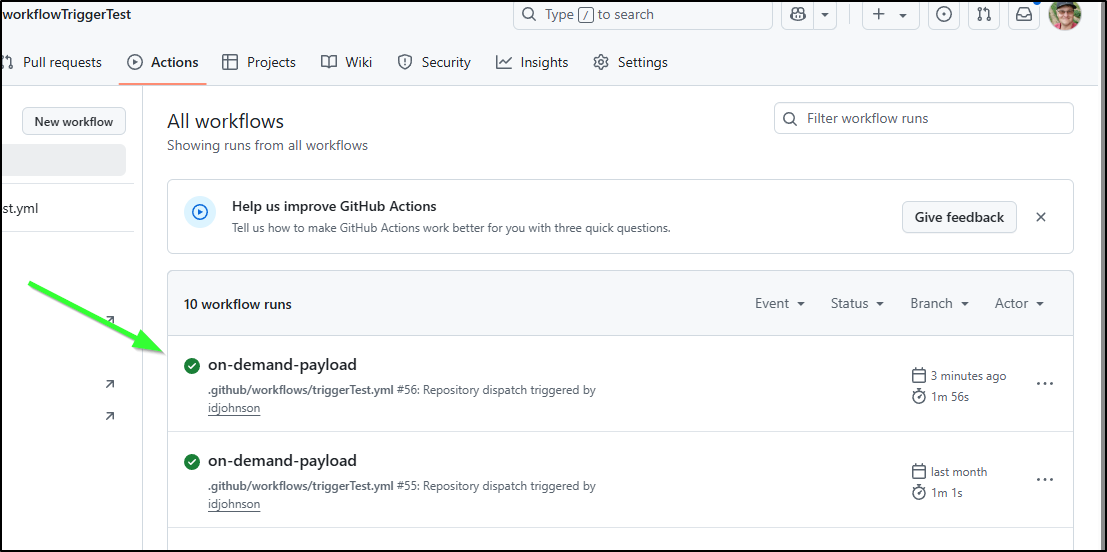
Now a quick test kicks the flow off
And I can see it created the issues
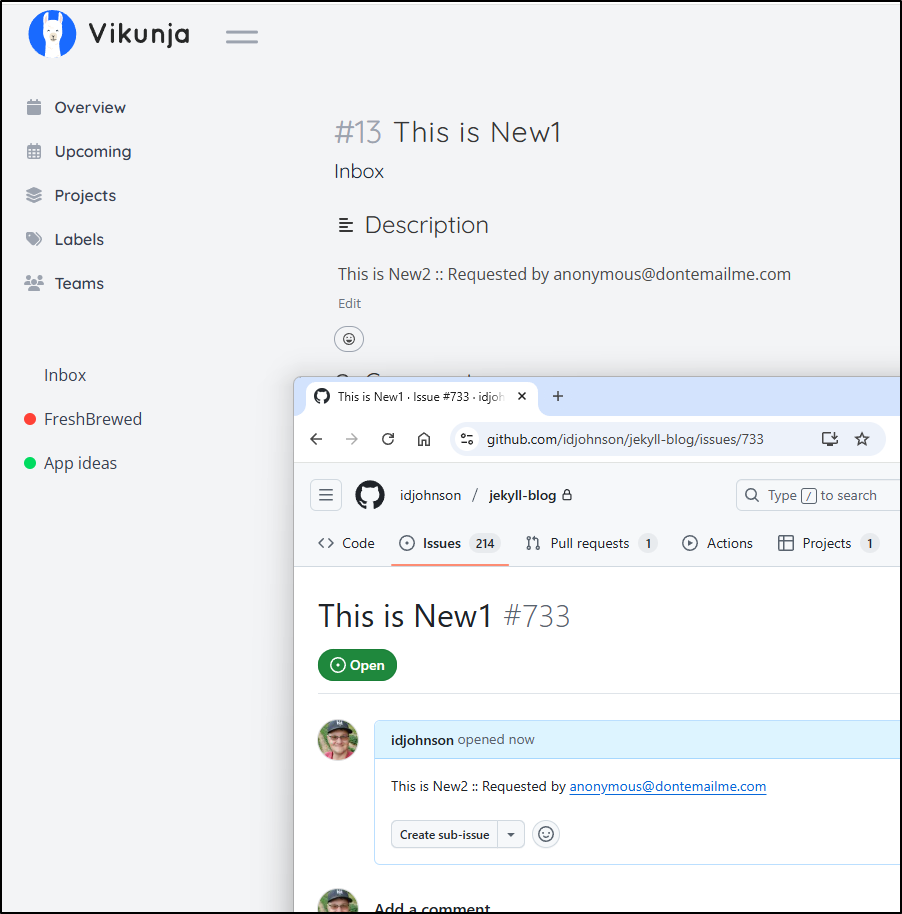
This should be good from now on (knock on wood) because its a narrow non-expiring token.
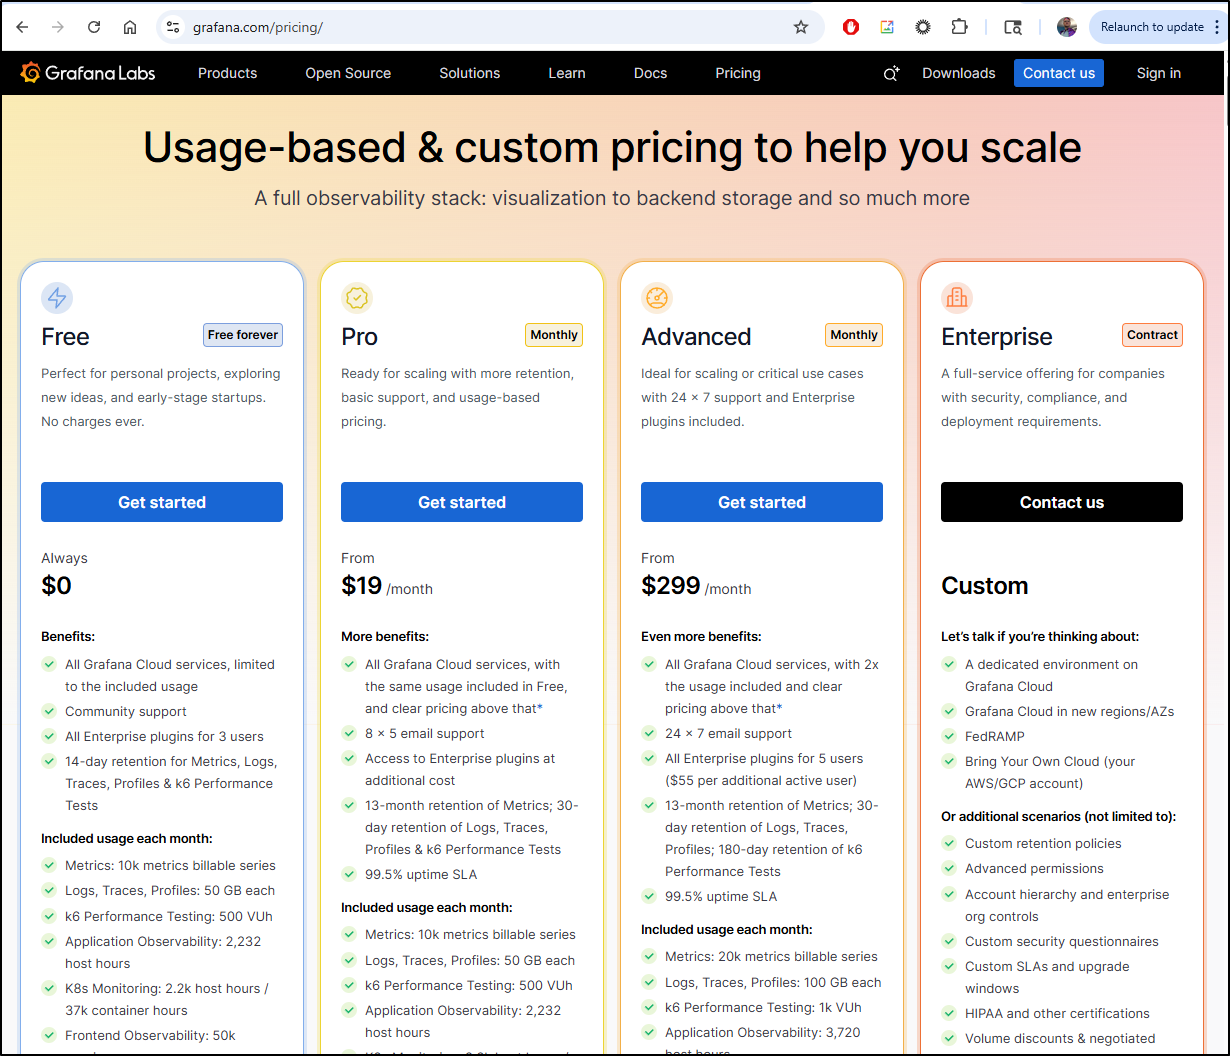
Grafana Cloud
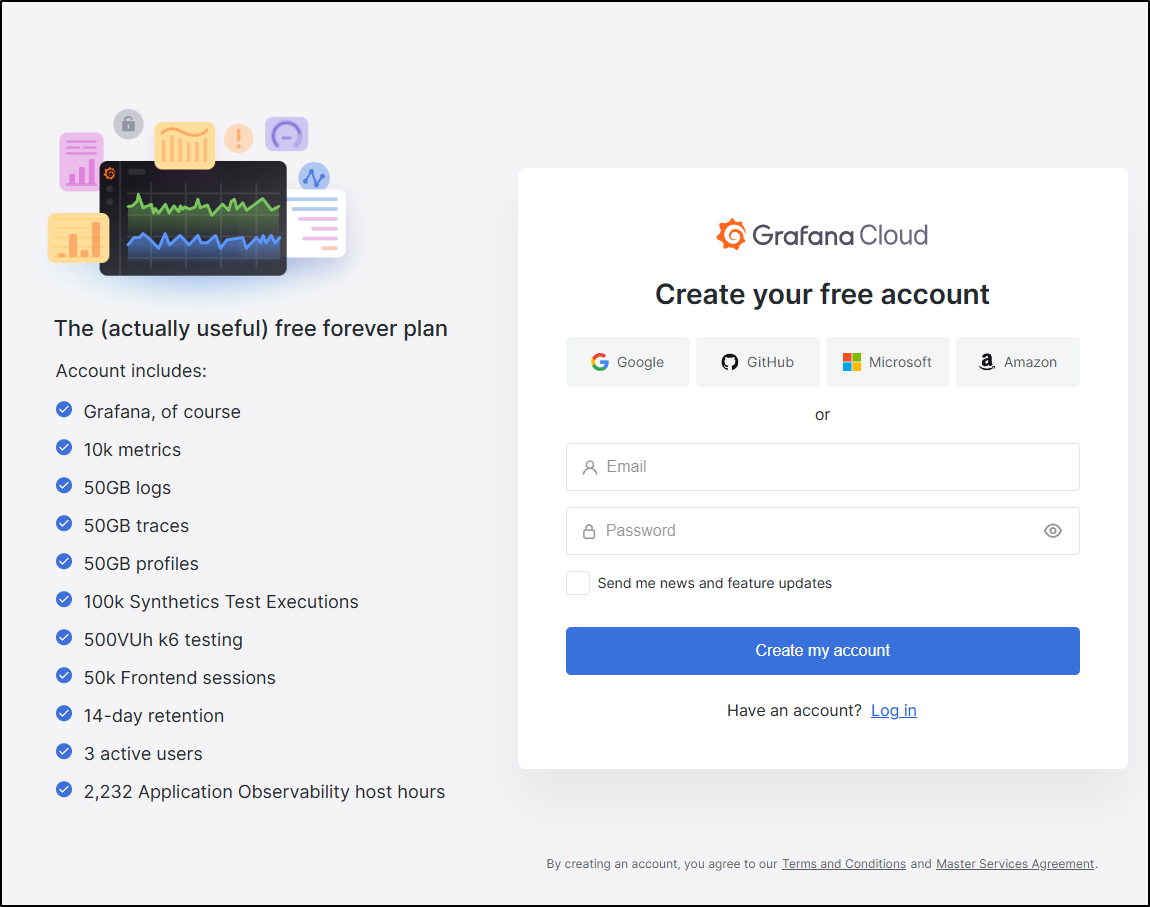
Looking at the Grafana SaaS options, there is a really nice free tier
We can use a new username/password or one of our existing IdPs
I then need to pick a name
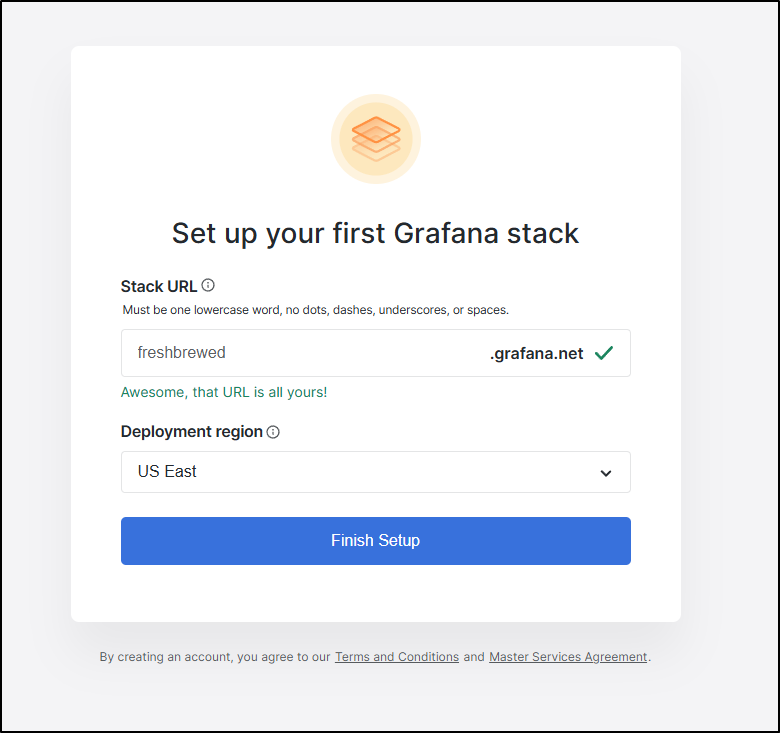
It will the create
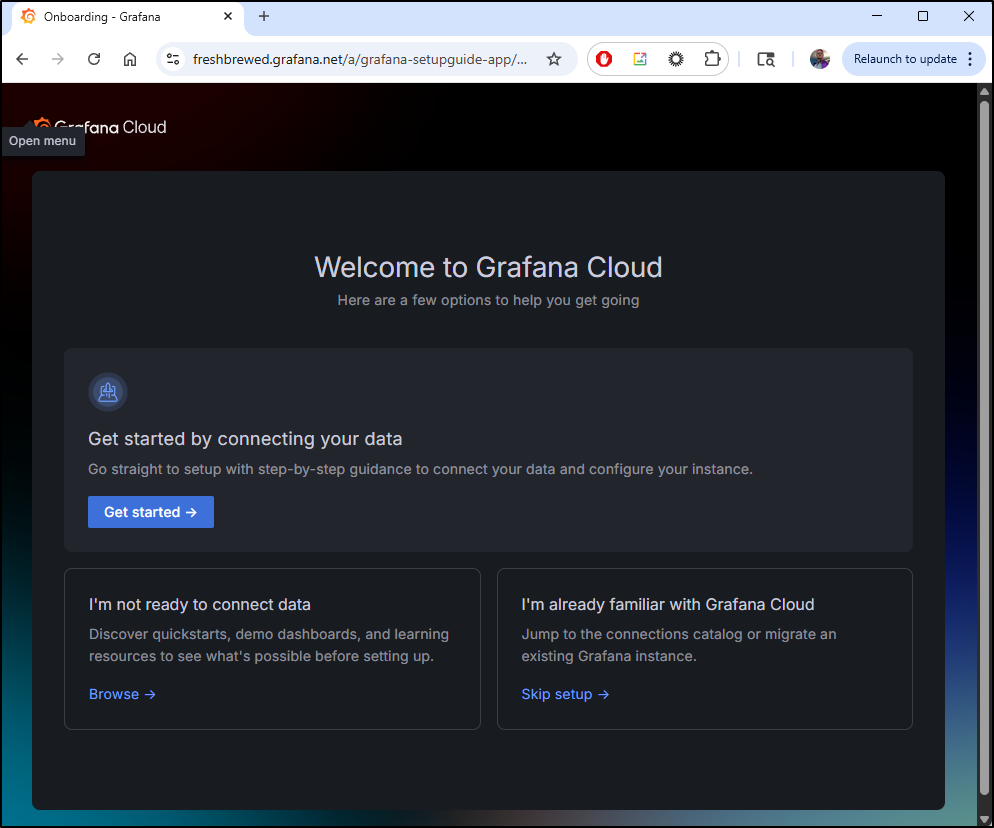
Once done, we will end up on a landing page
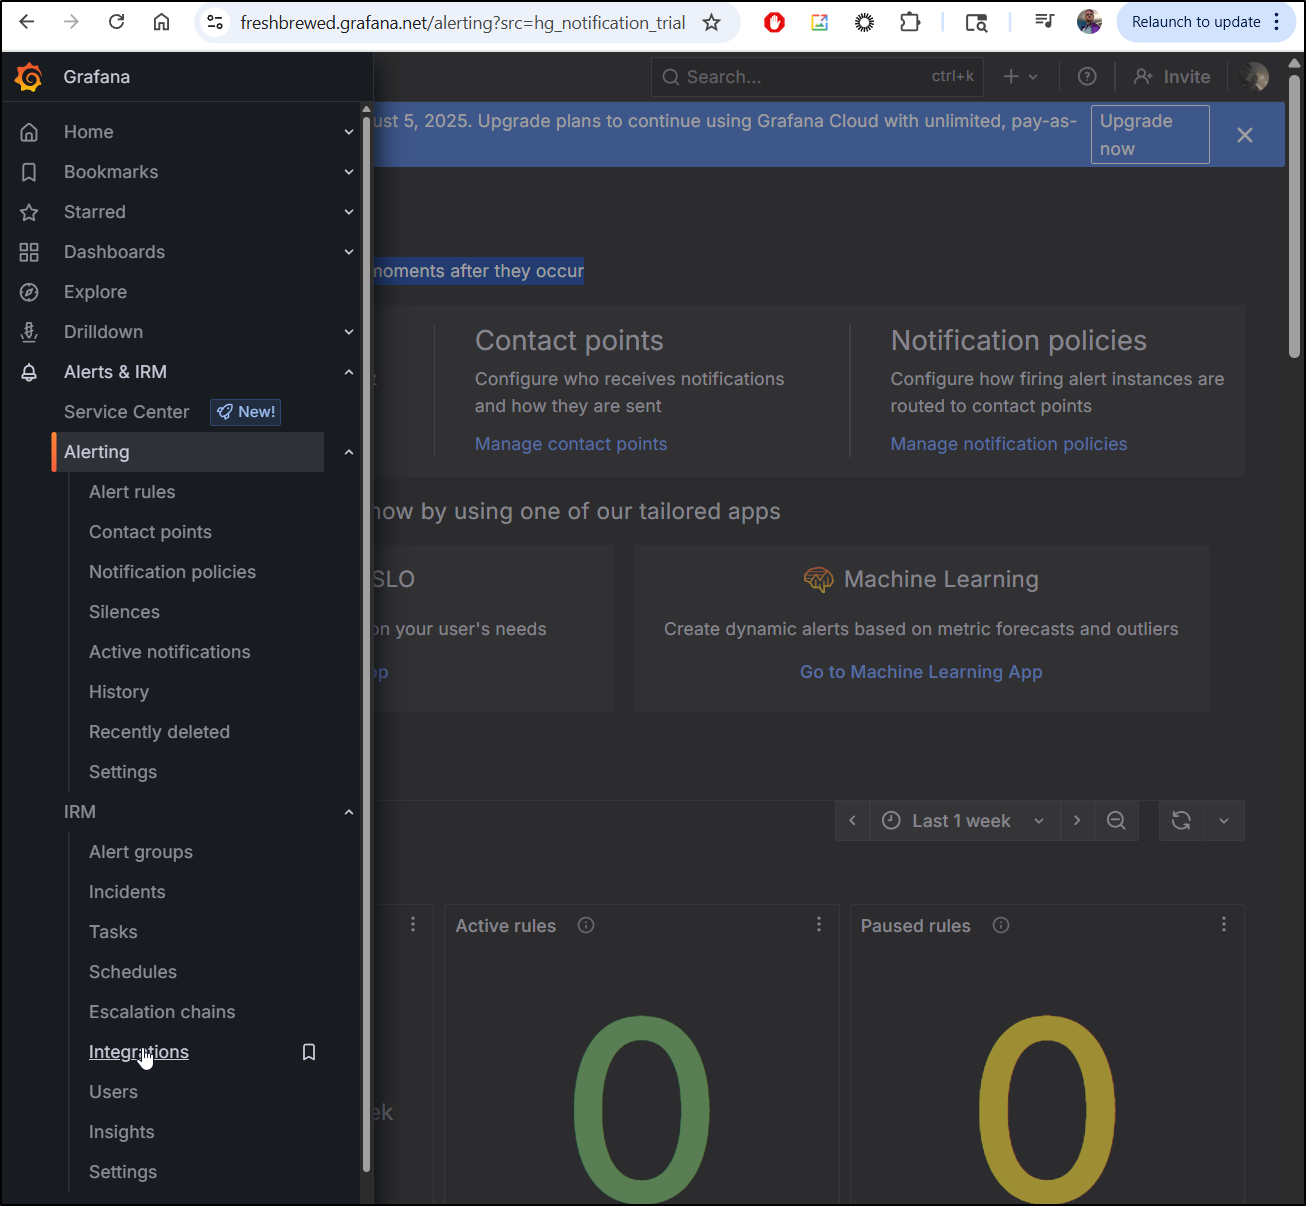
I want to use the Grafana Oncall Alerting which is now part of Grafana IRM
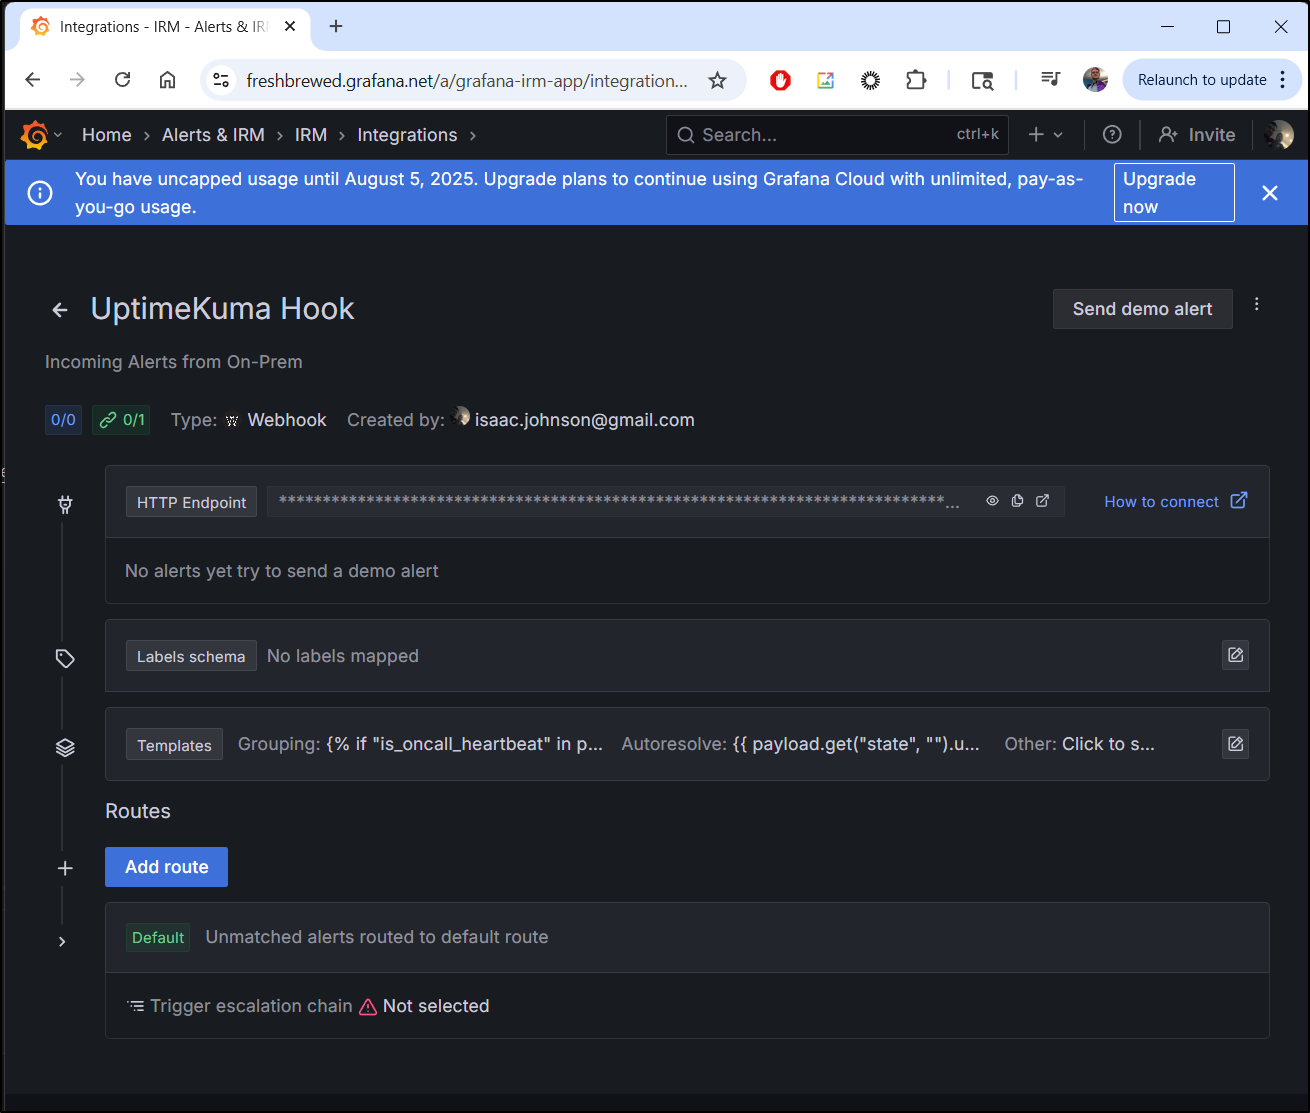
Let’s start by going to “Integrations”
From there, add an integration
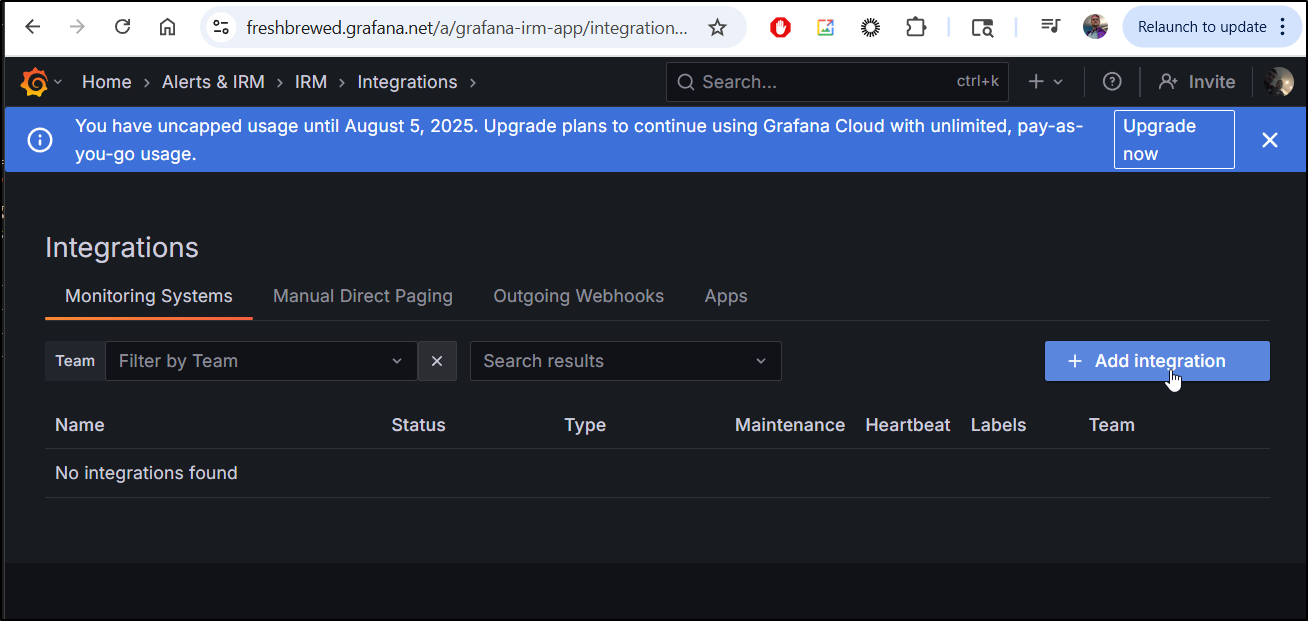
Select “Webhook”
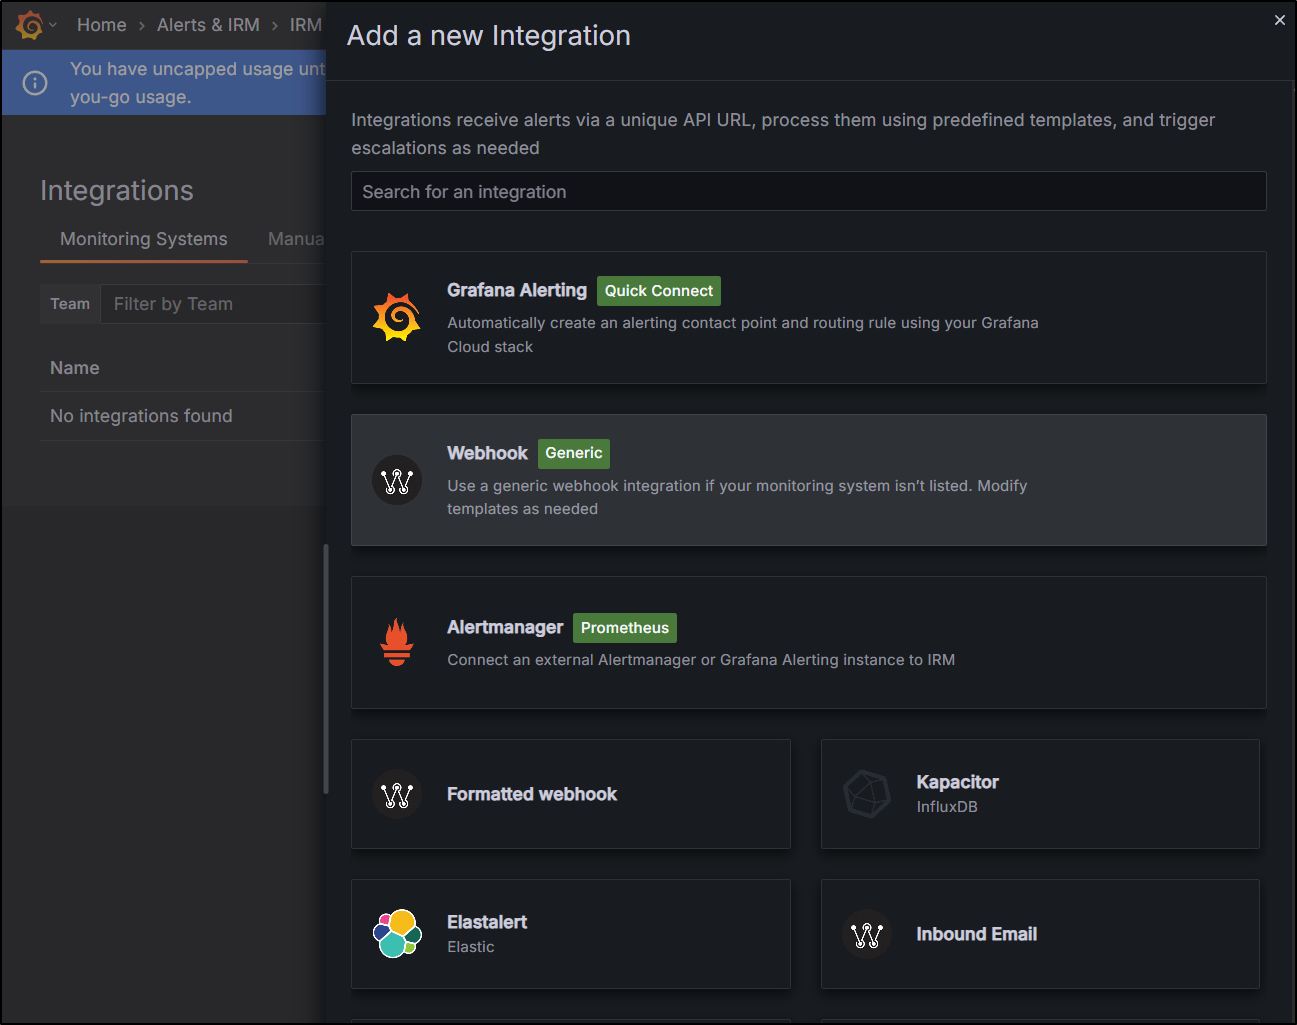
I can now give it a name and description to indicate this will be used by Uptime Kuma
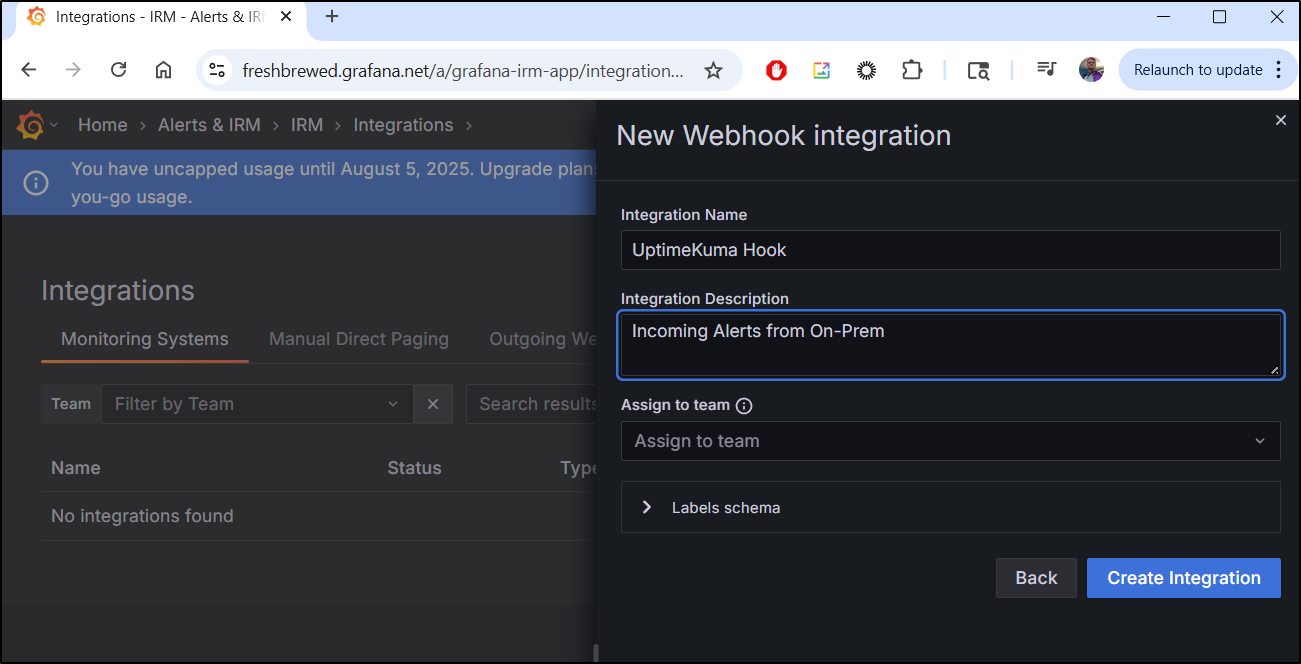
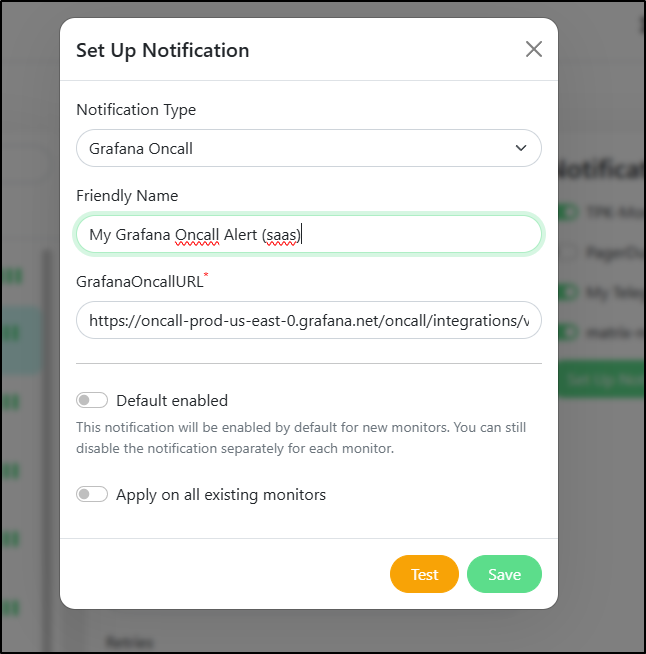
This creates the integration which has an HTTP endpoint we can use
I can add that to PagerDuty as a new “Grafana Oncall” notification endpoint
Now if I test it
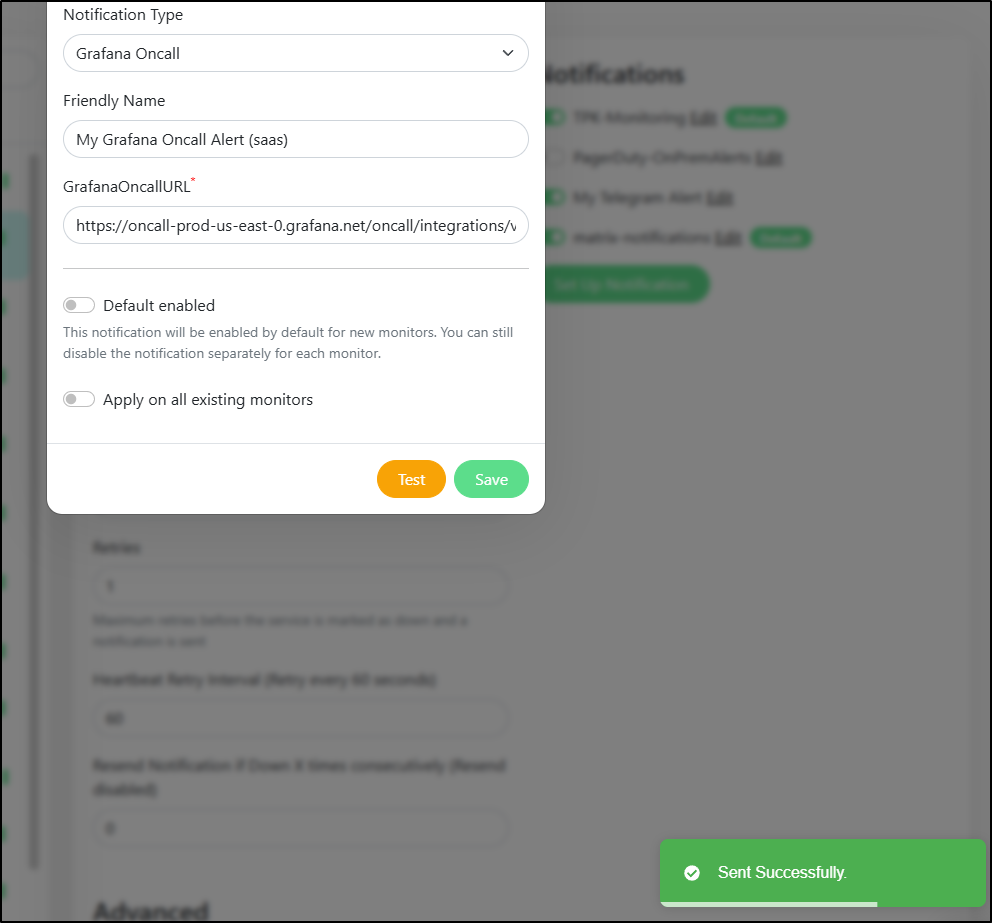
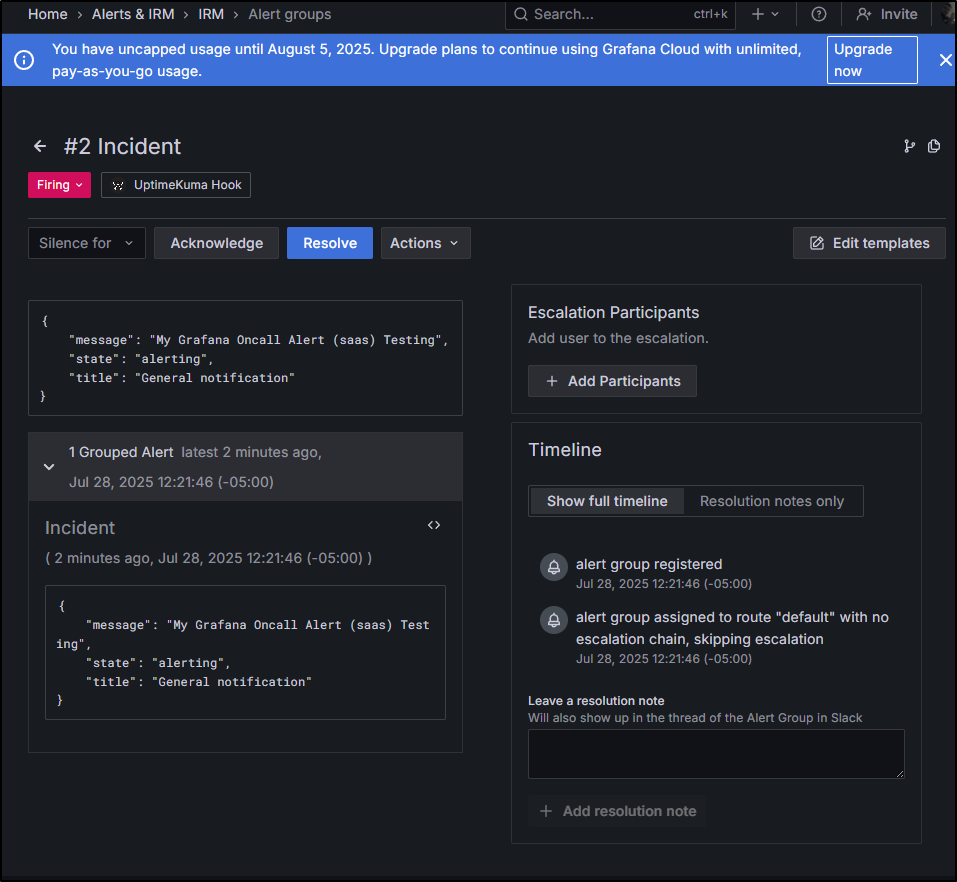
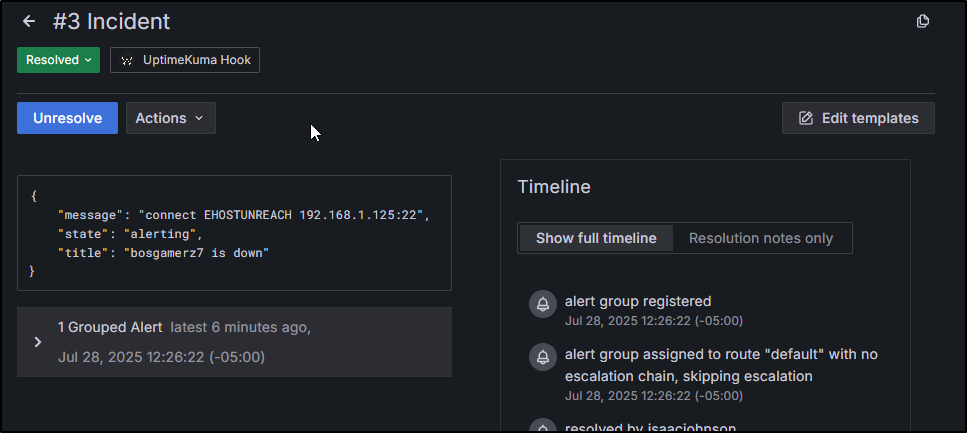
I can see it show up in Grafana IRM
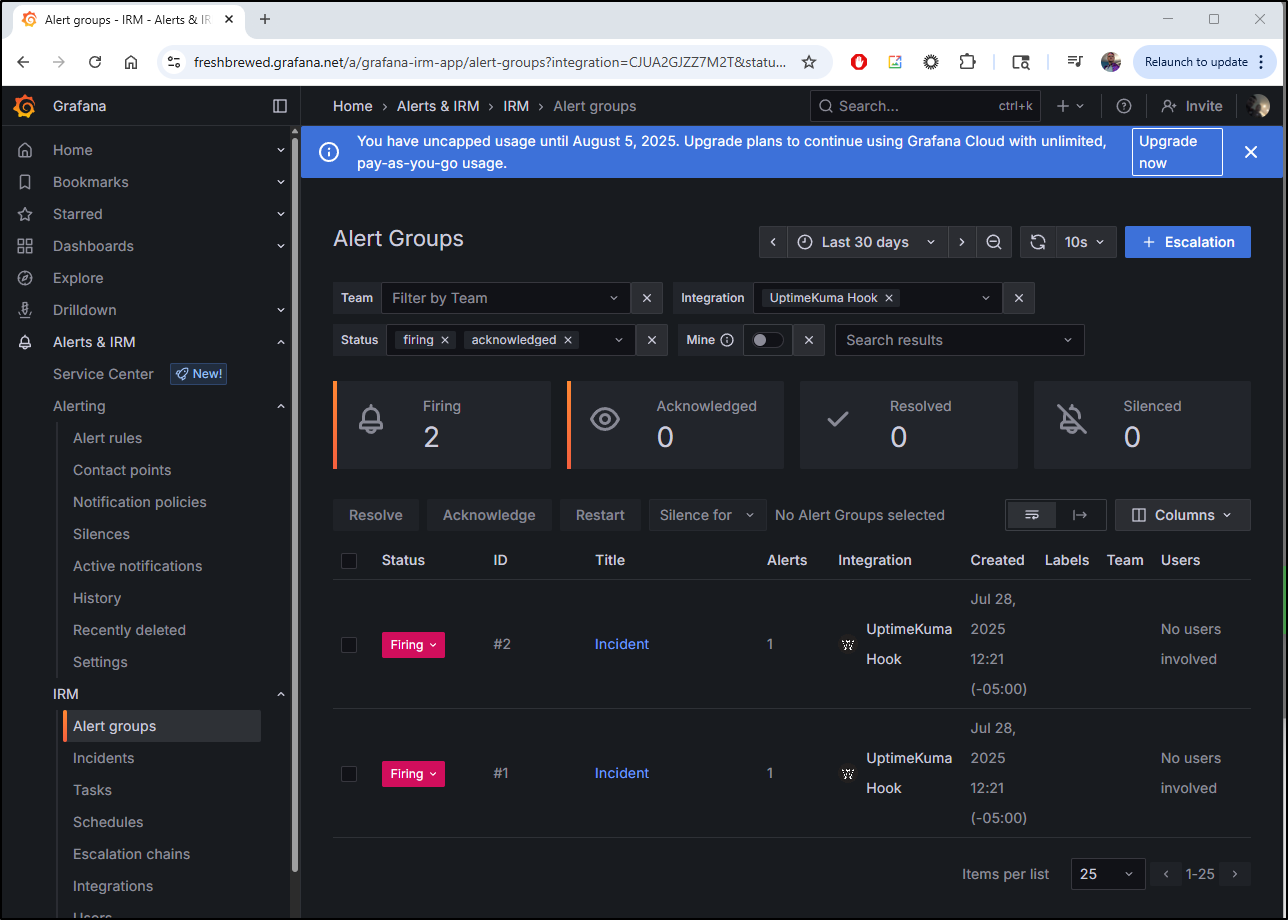
If I click that second one which came from Uptime Kuma, we can see the details
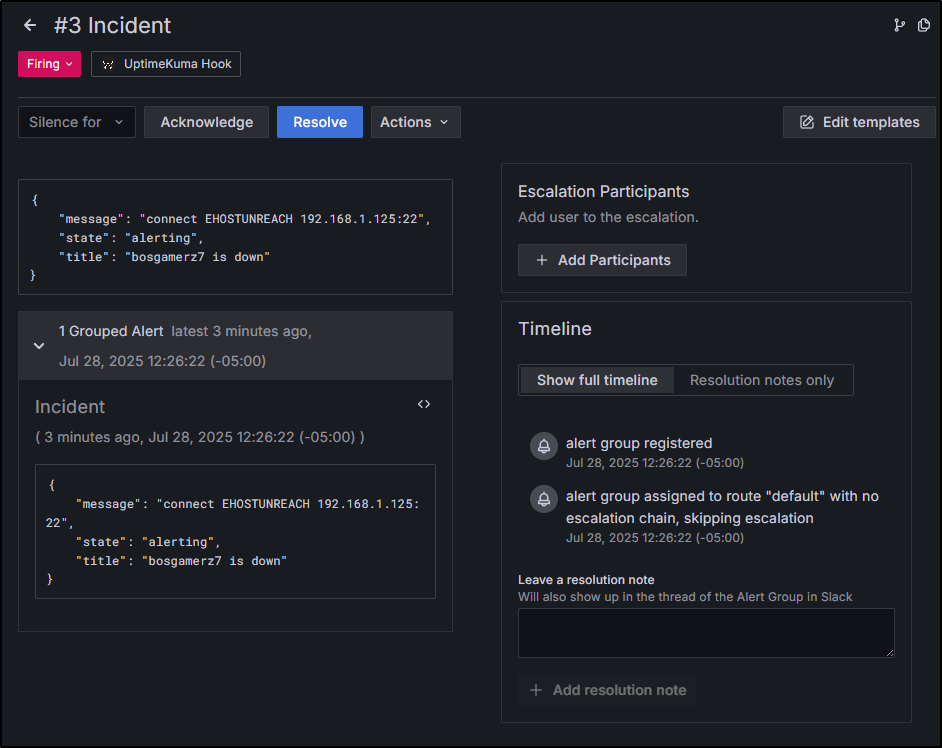
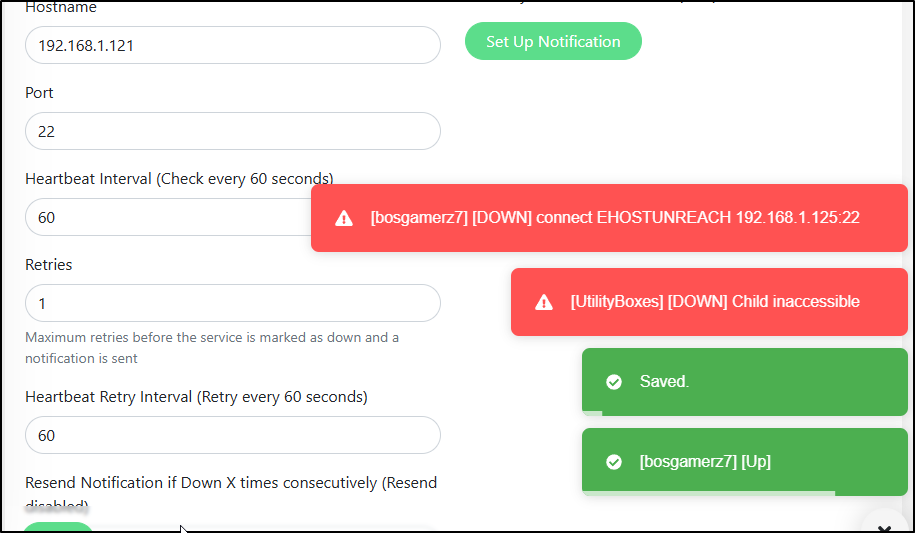
I can force a real alert by using a utility box and changing its IP or port.
I changed the IP back to simulate a “restored”
I see Pagerduty auto-resolved
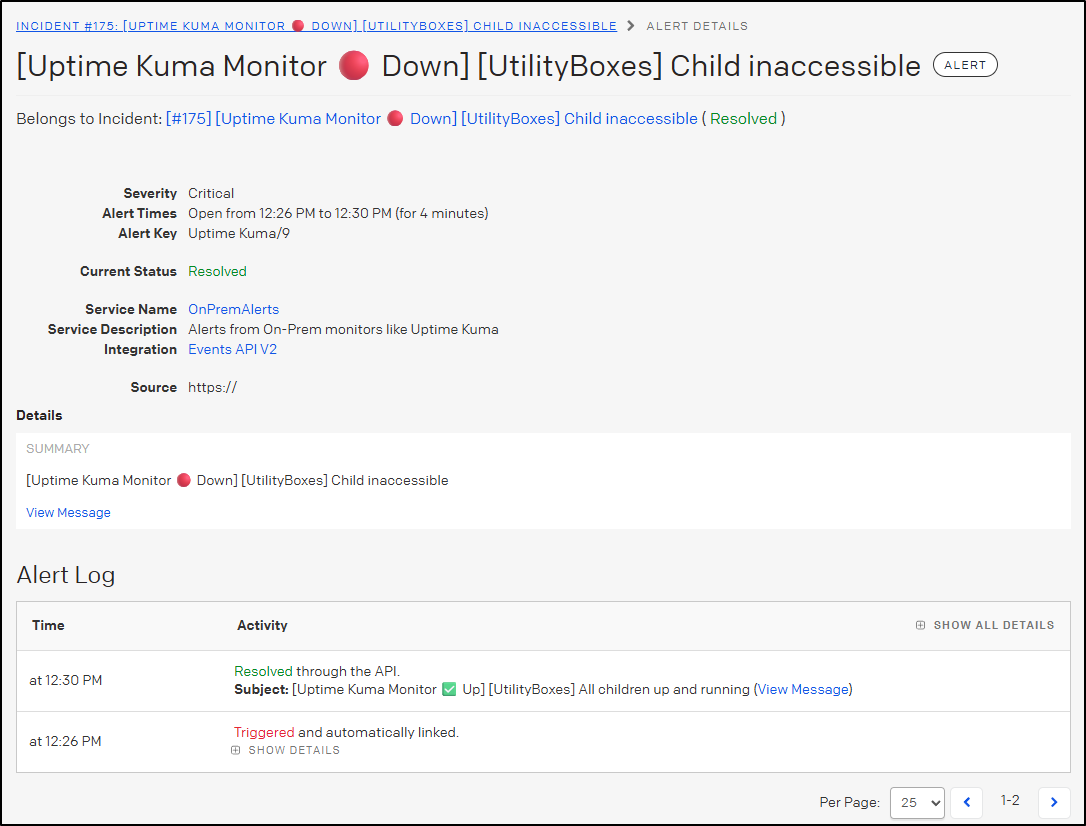
but I had to manually resolve it in Grafana IRM
Datadog
I noticed my cluster was responding quite slowly. Something seemed to really be weighing it down.
I went to my Datadog dashboard to see the “Kubernetes Pod Overview” hoping to identify the cause
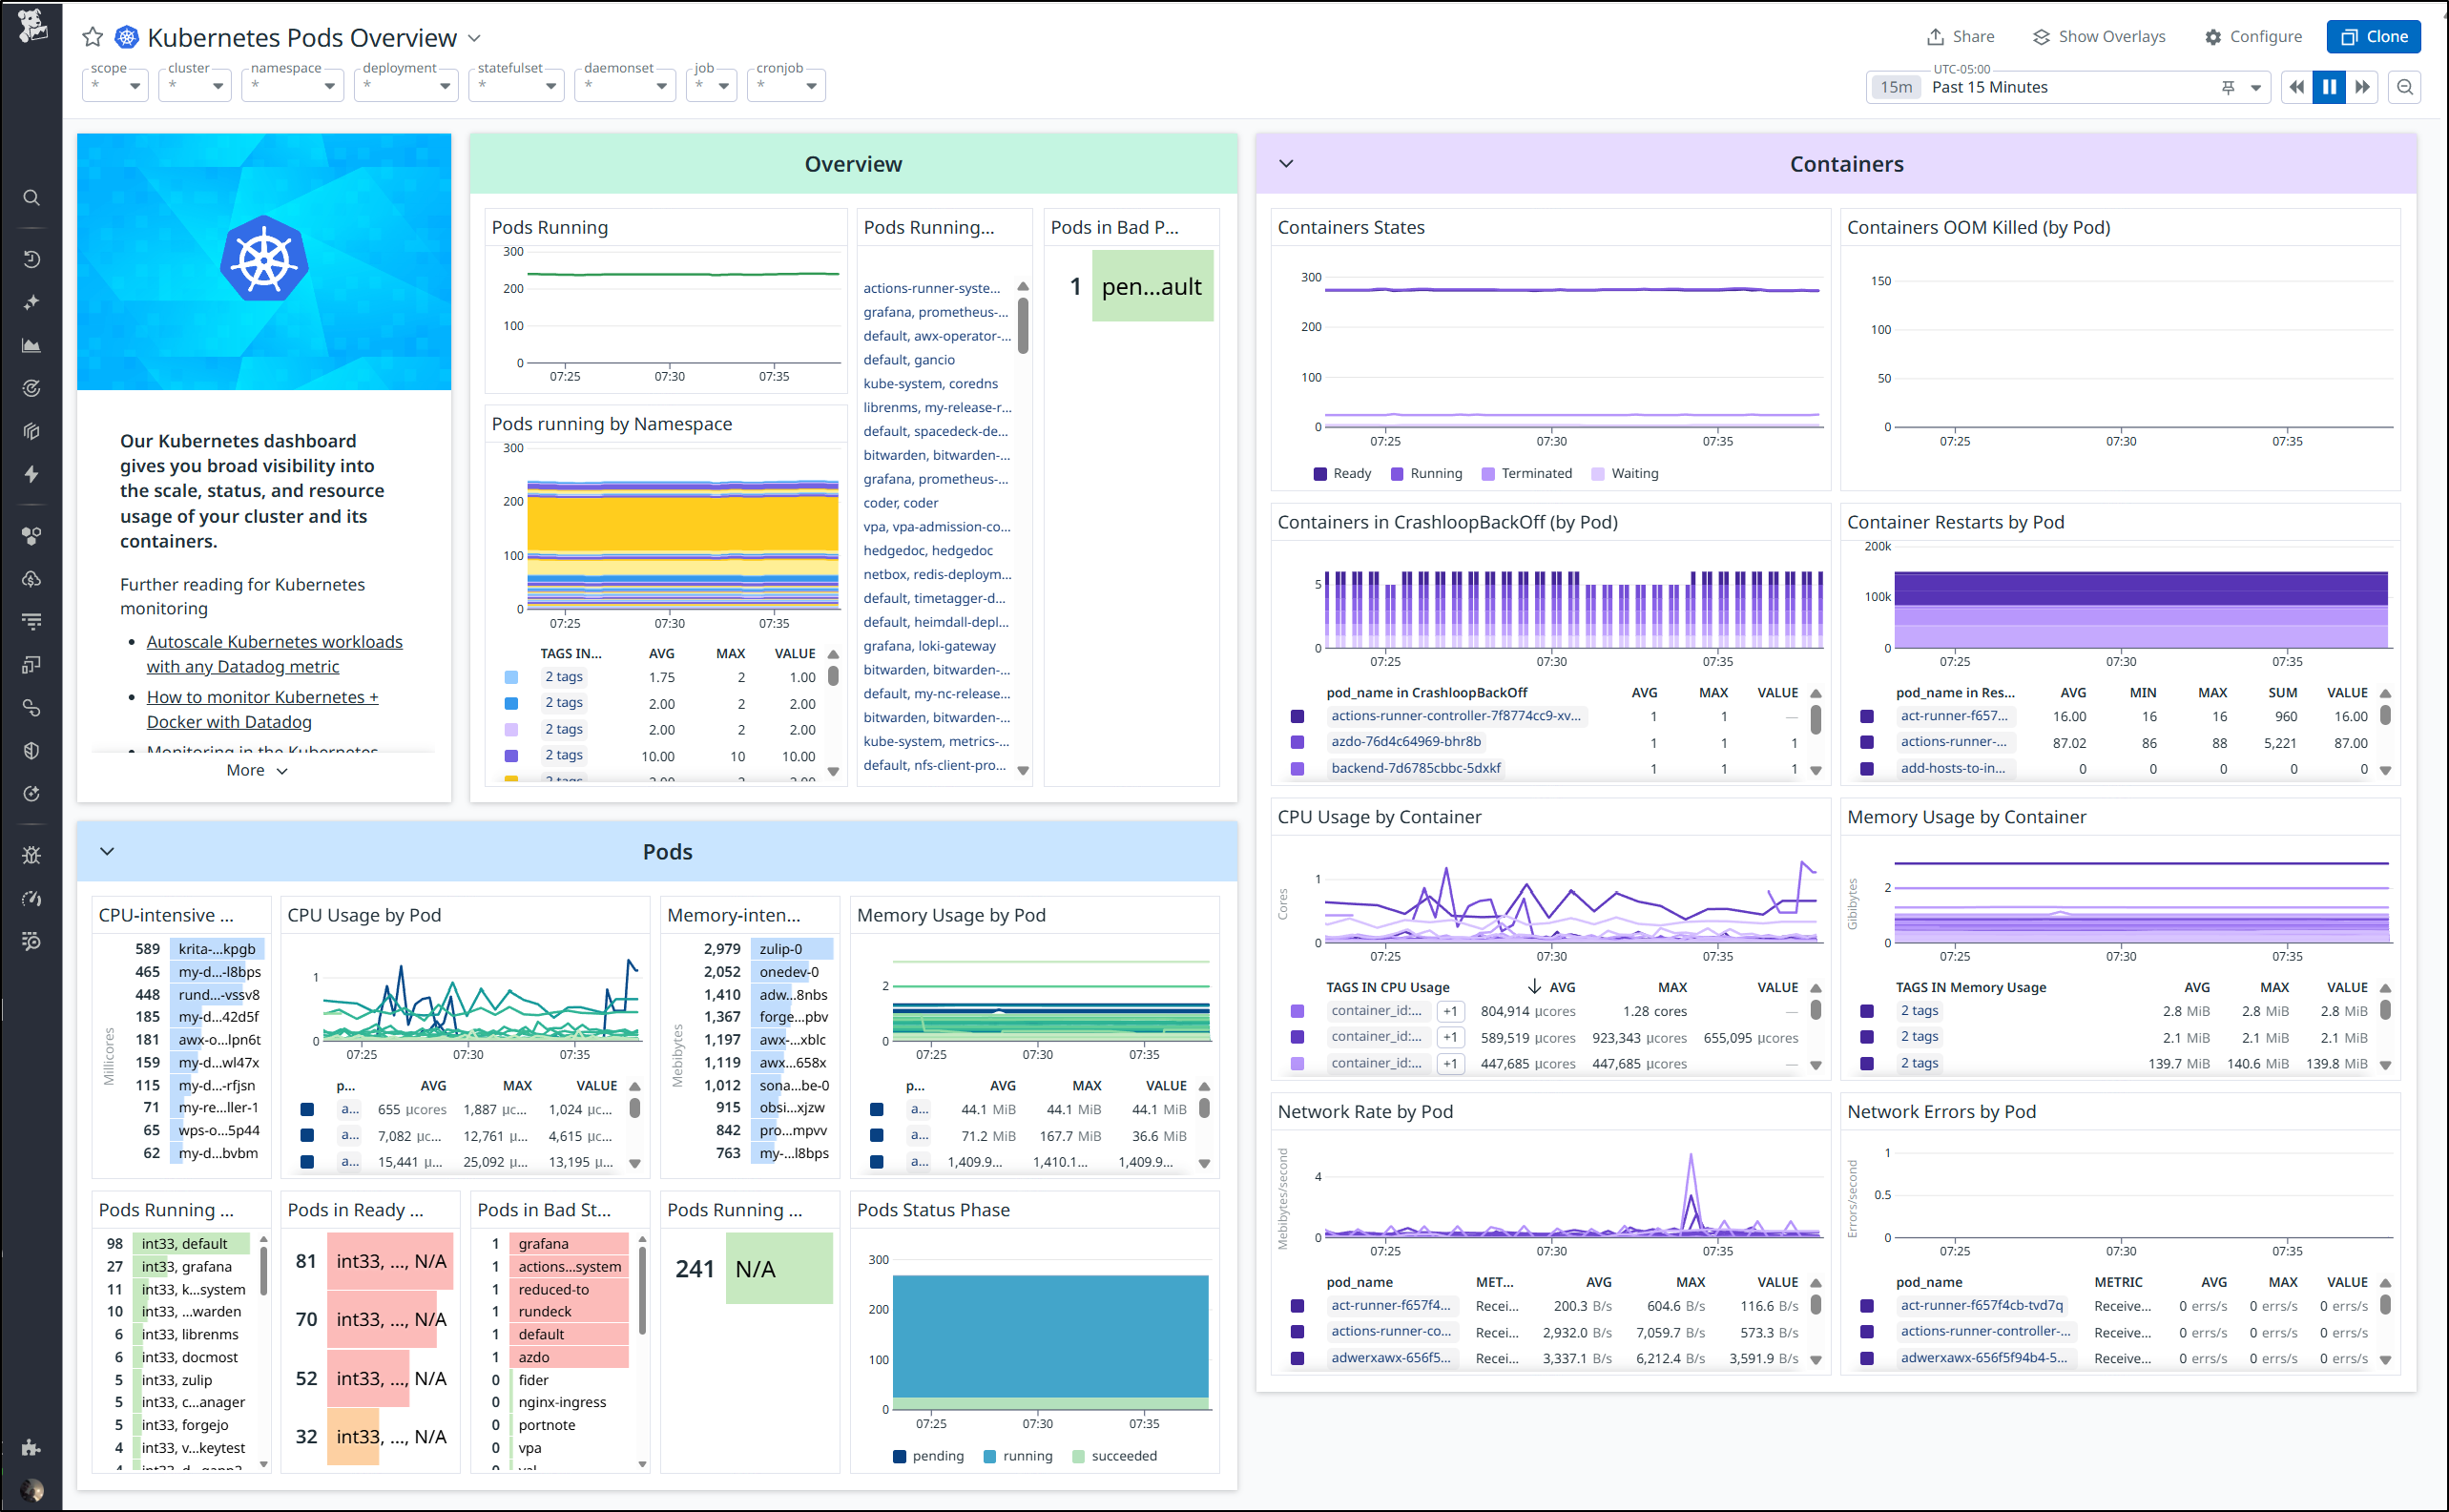
I had assumed it might be the full Grafana stack at fault since I know that can get pretty resource intensive.
However, I was surprised to find the biggest offender with the Krita app we launched last week.
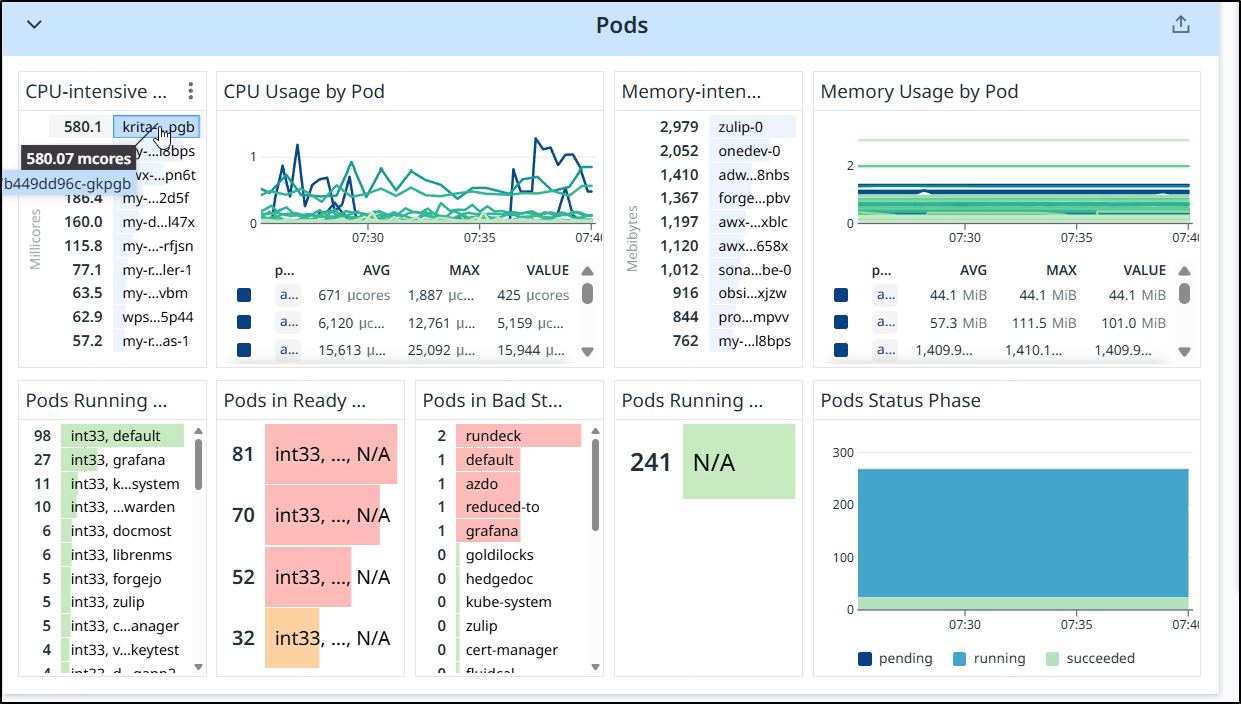
Since, in that blog post, I said it wasn’t performant enough and I just moved to local docker, let’s go ahead and kill that deployment now.
Besides CPU, we also should check memory intensive pods to ensure we are using them
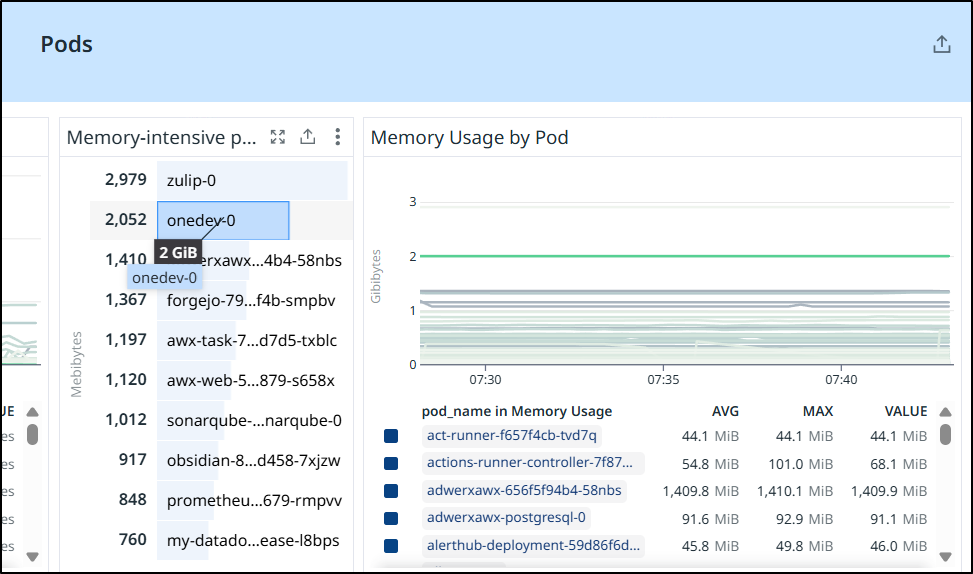
Zulip was something I wrote about a year ago.
While it is still up, I never really used it because I find my existing systems functional enough
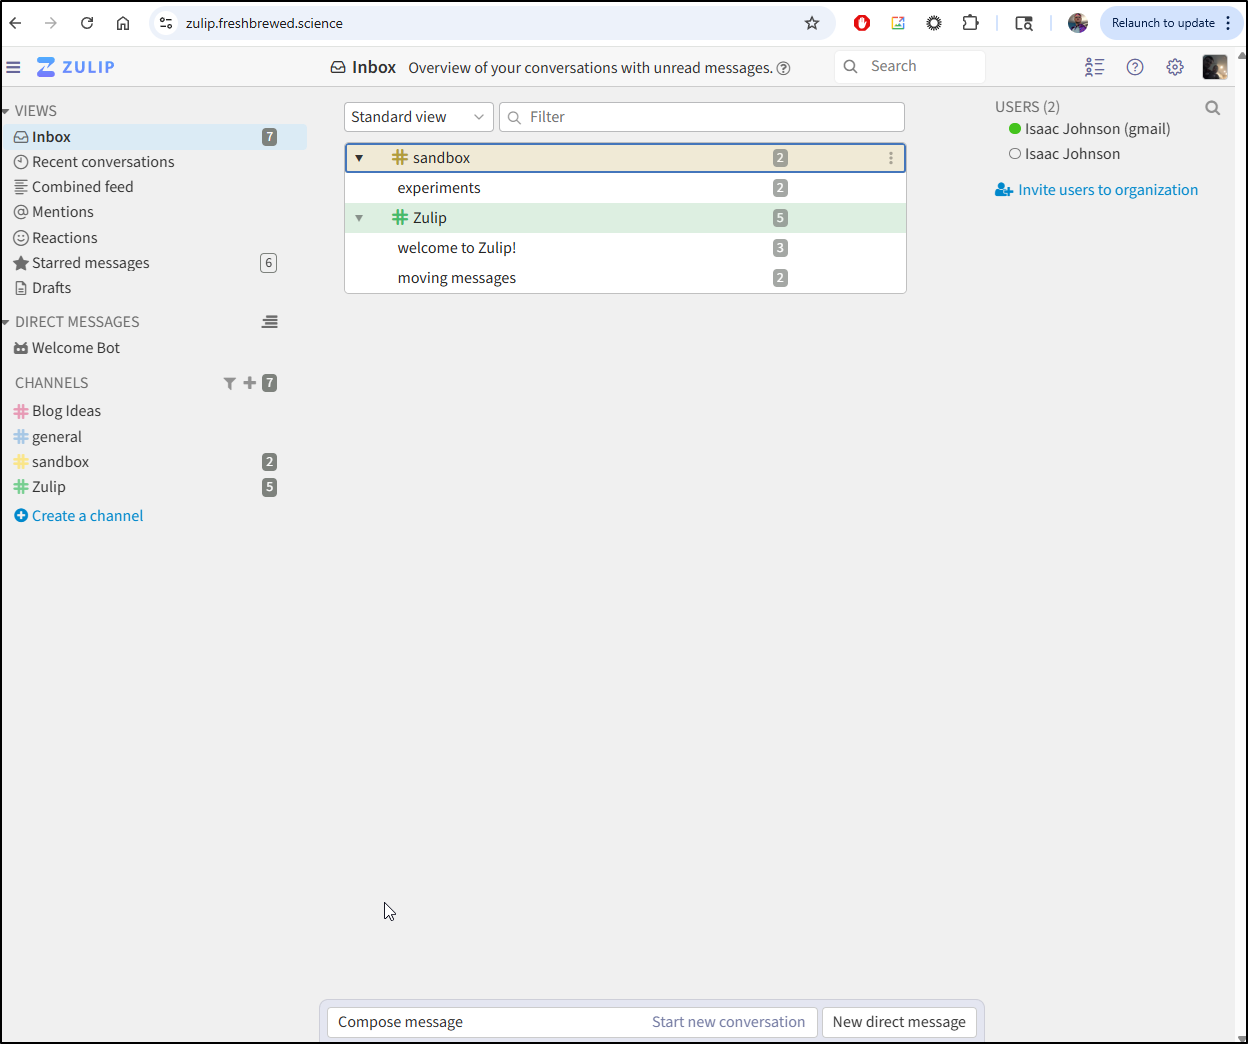
It’s a pretty heavy stack
$ kubectl get svc -n zulip
NAME                      TYPE        CLUSTER-IP      EXTERNAL-IP   PORT(S)                                 AGE
zulip                     ClusterIP   10.43.45.82     <none>        80/TCP                                  343d
zulip-memcached           ClusterIP   10.43.81.179    <none>        11211/TCP                               343d
zulip-postgresql          ClusterIP   10.43.175.252   <none>        5432/TCP                                343d
zulip-postgresql-hl       ClusterIP   None            <none>        5432/TCP                                343d
zulip-rabbitmq            ClusterIP   10.43.21.254    <none>        5672/TCP,4369/TCP,25672/TCP,15672/TCP   343d
zulip-rabbitmq-headless   ClusterIP   None            <none>        4369/TCP,5672/TCP,25672/TCP,15672/TCP   343d
zulip-redis-headless      ClusterIP   None            <none>        6379/TCP                                343d
zulip-redis-master        ClusterIP   10.43.150.84    <none>        6379/TCP                                343d

$ kubectl get po -n zulip
NAME                               READY   STATUS    RESTARTS      AGE
zulip-0                            1/1     Running   1 (37d ago)   343d
zulip-memcached-74f9bfc676-4v6rv   1/1     Running   1 (37d ago)   343d
zulip-postgresql-0                 1/1     Running   1 (37d ago)   343d
zulip-rabbitmq-0                   1/1     Running   1 (37d ago)   343d
zulip-redis-master-0               1/1     Running   1 (37d ago)   343d
I tried asking nicely at first
$ helm delete zulip -n zulip
Error: failed to delete release: zulip
I did see it clean things up, but I’ll delete the namespace to be sure
$ kubectl get po -n zulip
No resources found in zulip namespace.
$ kubectl get svc -n zulip
No resources found in zulip namespace.
$ kubectl delete ns zulip
namespace "zulip" deleted
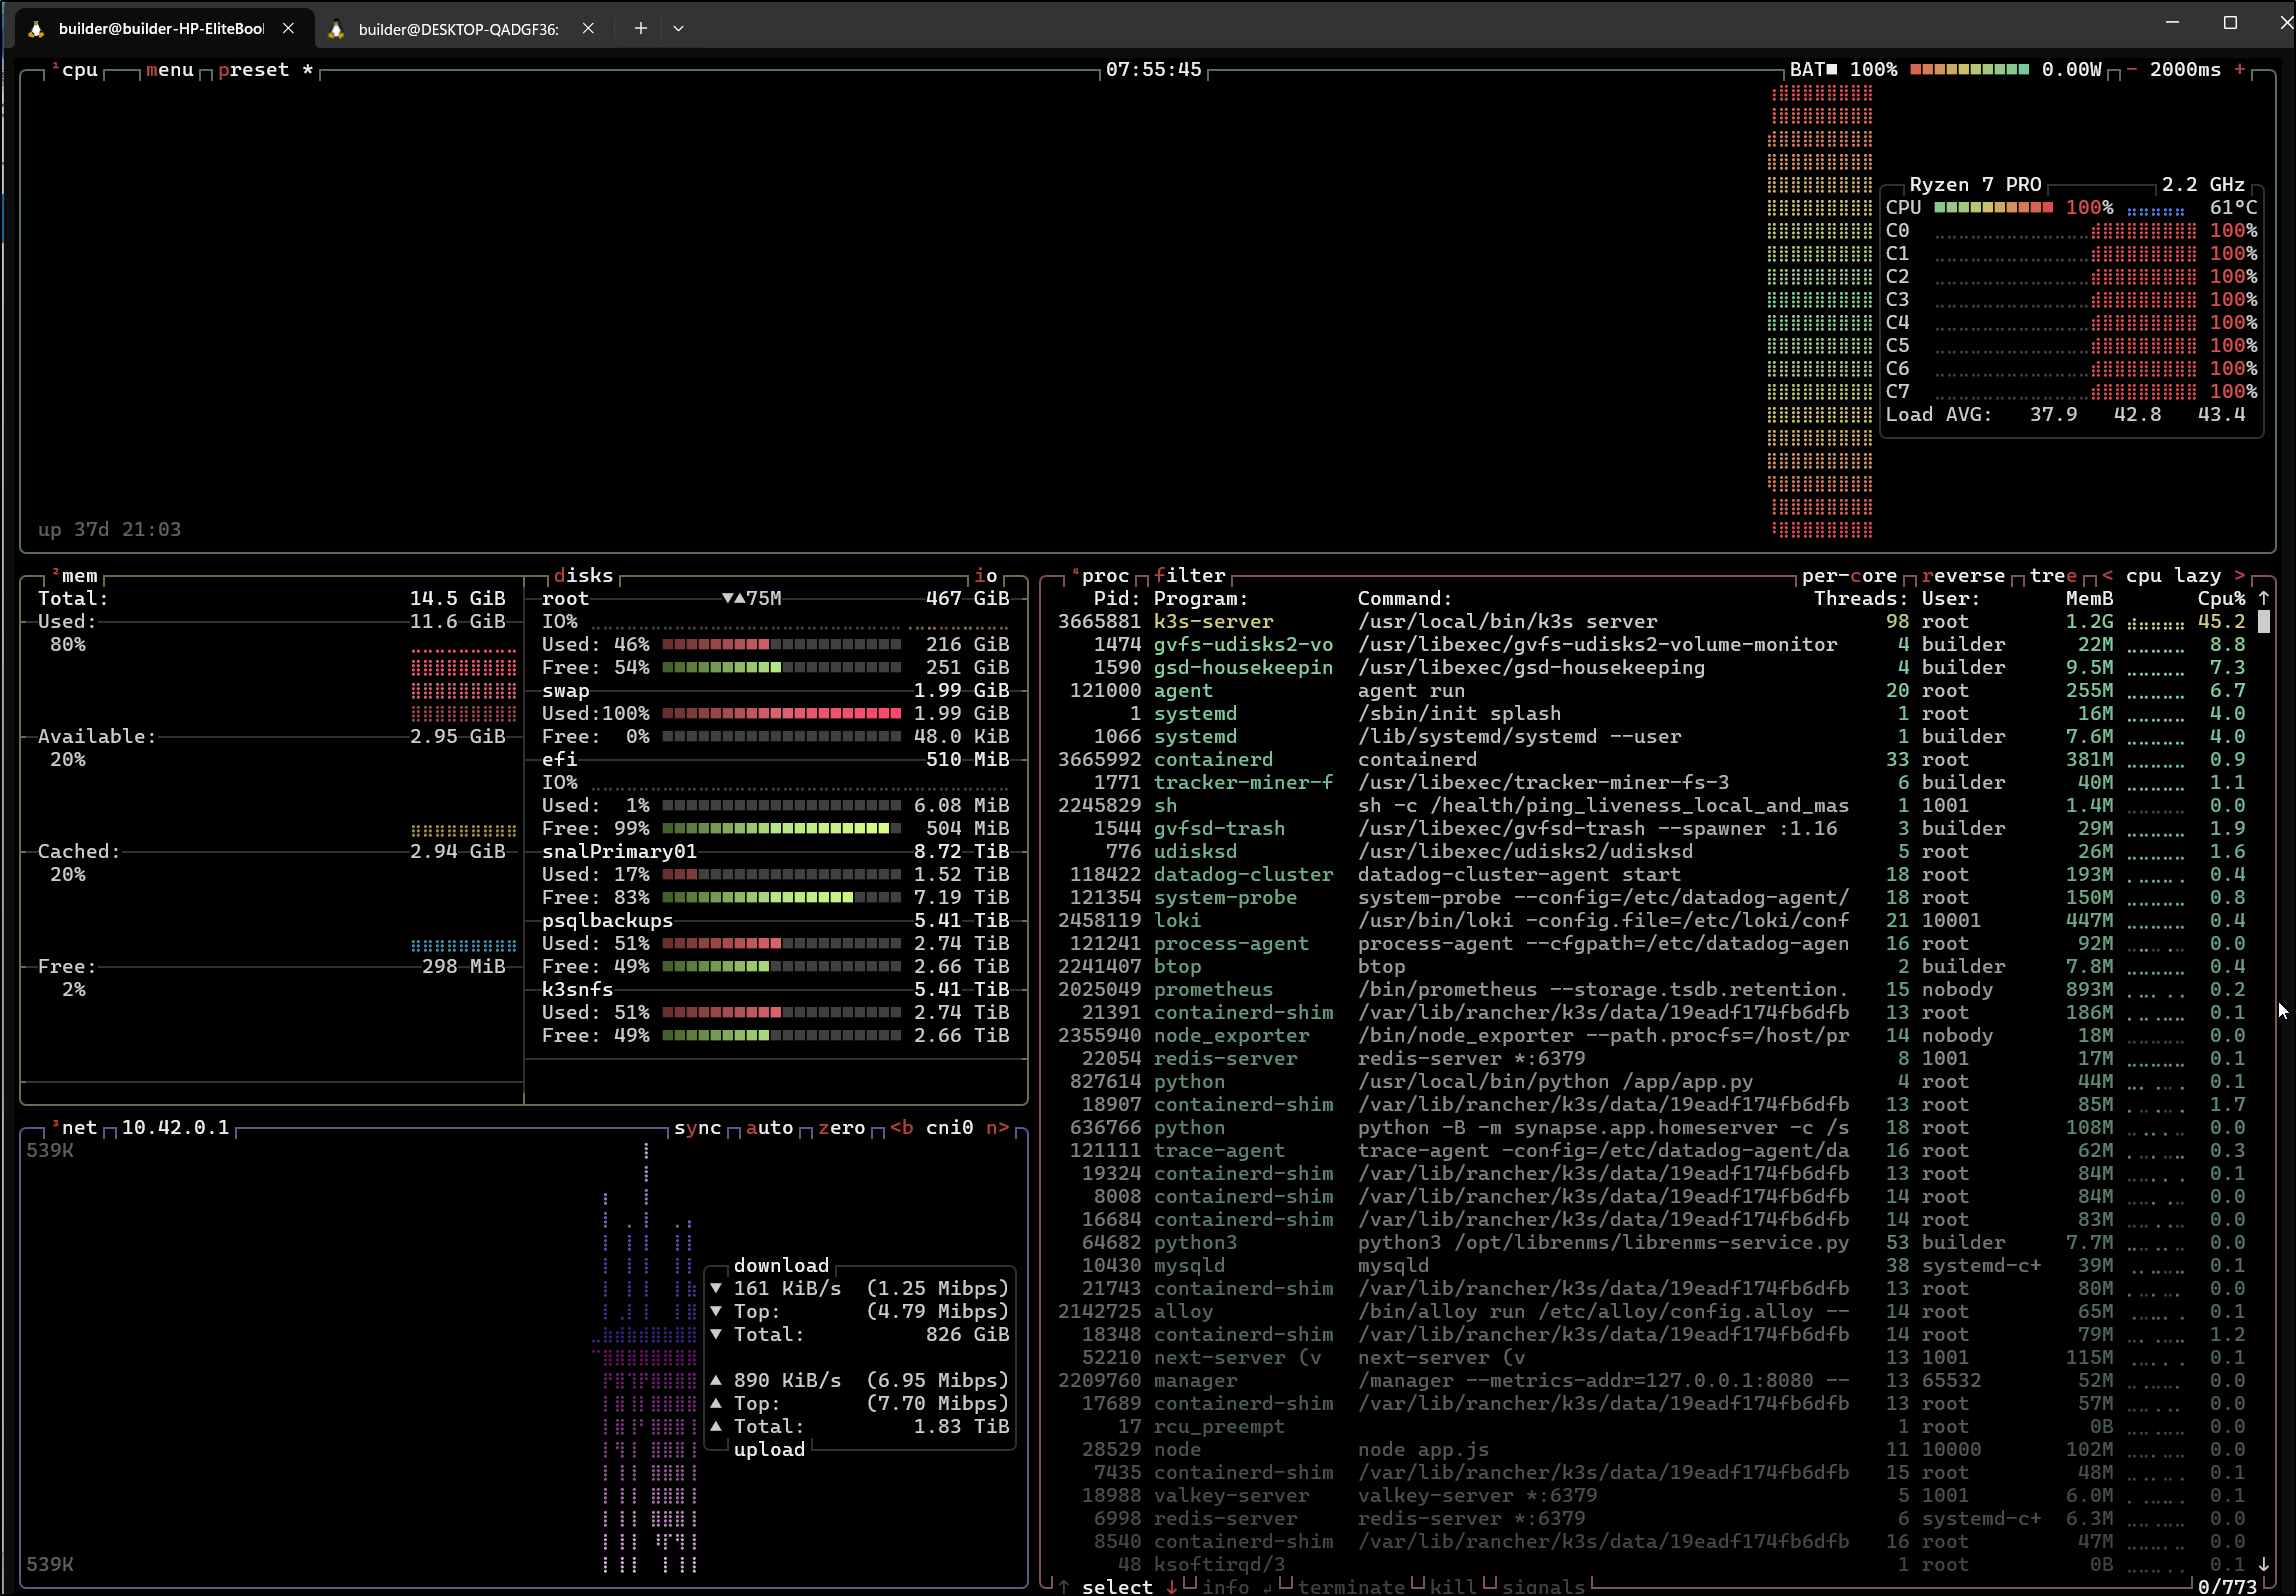
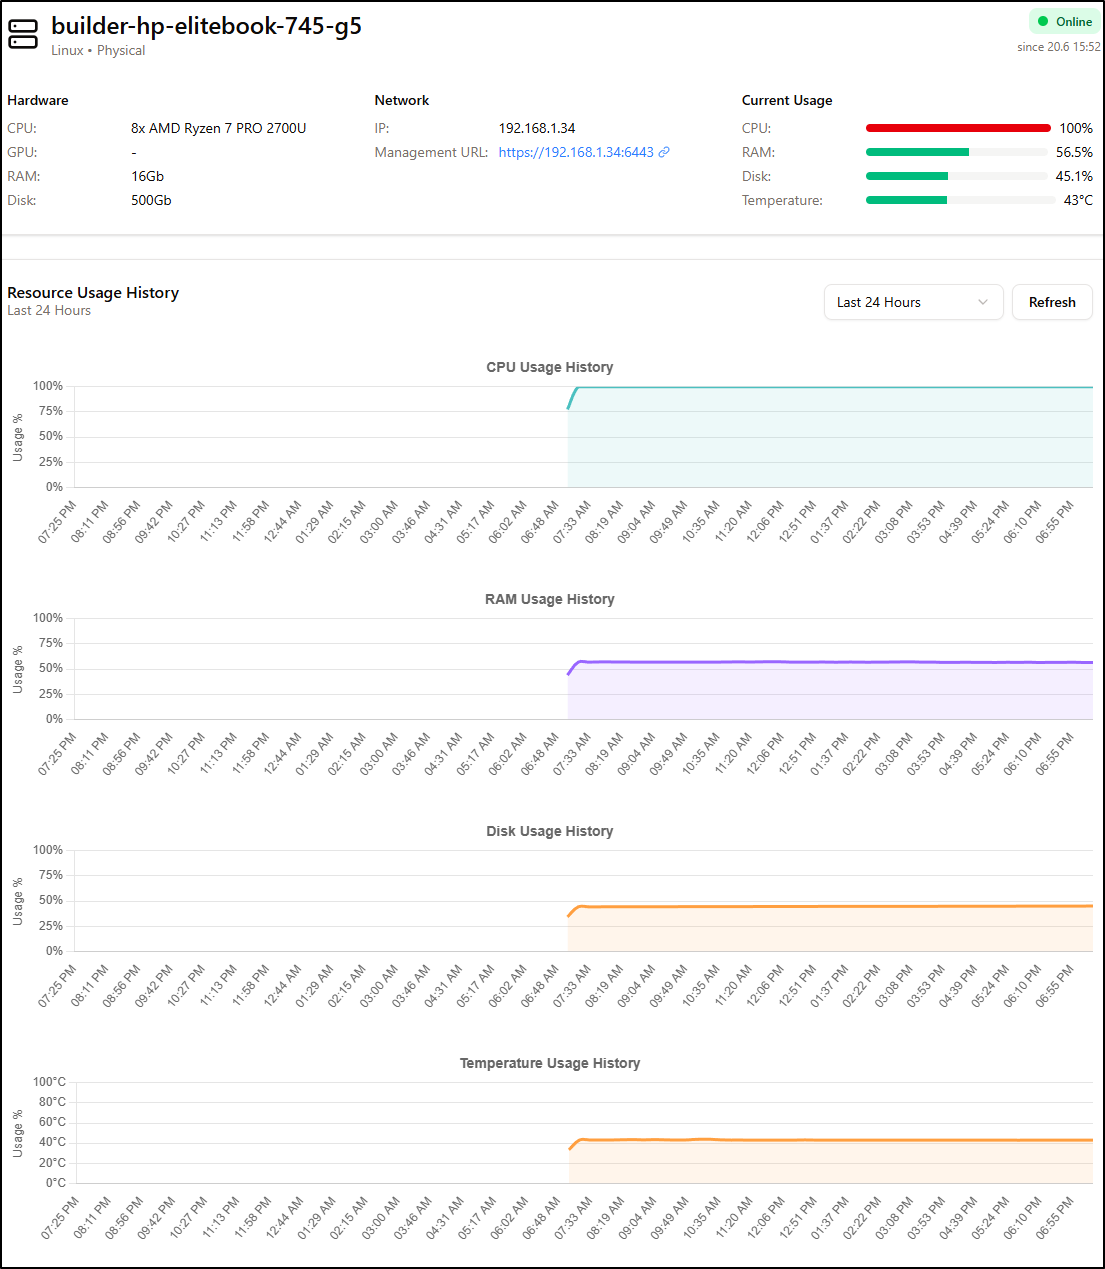
I’m still seeing my master node pegged and I’m a bit worried. I fired up btop which showed me what I already knew - its 100% pegged and the heat is at about 141d F.
I added a fan and didn’t really see the temp change
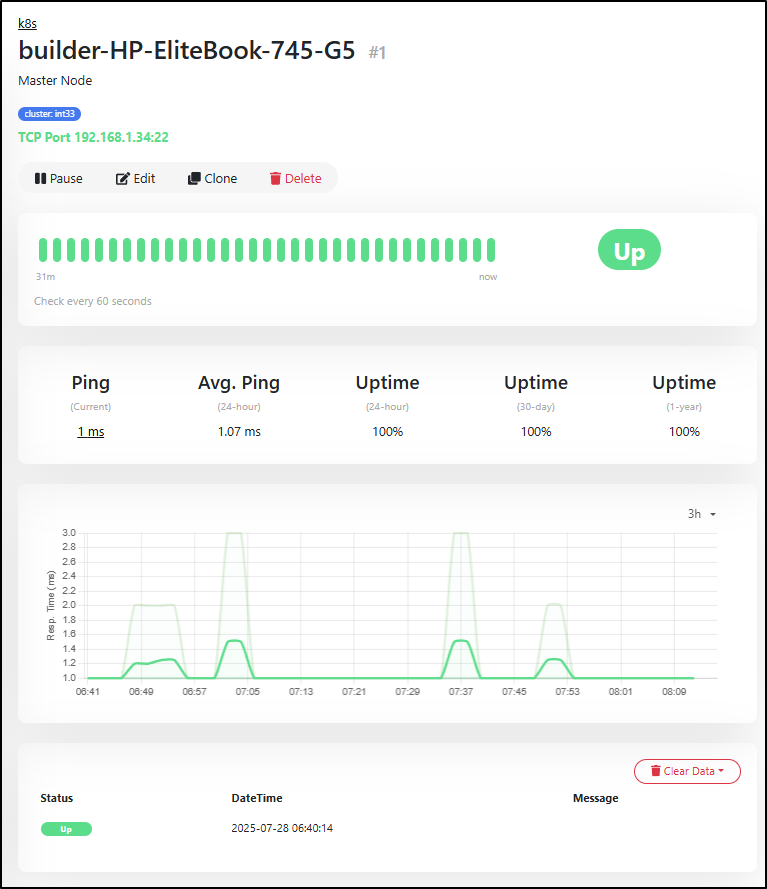
But I do see the ping time improving in Uptime Kuma so perhaps that is a good sign
Looking at the nodes, I can see most have been up a month but one hasn’t rebooted in 3
builder@DESKTOP-QADGF36:~/Workspaces/jekyll-blog$ ssh builder@192.168.1.33 uptime
builder@192.168.1.33's password:
 08:17:17 up 95 days, 14:24,  1 user,  load average: 1.62, 2.88, 4.87
builder@DESKTOP-QADGF36:~/Workspaces/jekyll-blog$ ssh builder@192.168.1.34 uptime
 08:17:41 up 37 days, 21:25,  1 user,  load average: 40.60, 39.92, 41.14
builder@DESKTOP-QADGF36:~/Workspaces/jekyll-blog$ ssh builder@192.168.1.215 uptime
builder@192.168.1.215's password:
 08:17:58 up 37 days, 21:20,  1 user,  load average: 2.42, 3.87, 4.84
builder@DESKTOP-QADGF36:~/Workspaces/jekyll-blog$ ssh hp@192.168.1.57 uptime
hp@192.168.1.57's password:
 08:18:28 up 37 days, 21:24,  1 user,  load average: 2.72, 4.50, 5.74
The load average on the master node (.34) show’s its very overburdened (all at or above 40 processes waiting for CPU for the 1, 5, and 15m intervals).
One of the biggest is Sonarqube. I spun this up to hopefully use but they so limited the community edition I don’t see the point

I can remove it
builder@DESKTOP-QADGF36:~$ helm list -n sonarqube
NAME            NAMESPACE       REVISION        UPDATED                                 STATUS          CHART                   APP VERSION
sonarqube       sonarqube       1               2024-04-16 06:38:12.595519 -0500 CDT    deployed        sonarqube-10.5.0+2748   10.5.0
builder@DESKTOP-QADGF36:~$ helm delete sonarqube -n sonarqube
release "sonarqube" uninstalled
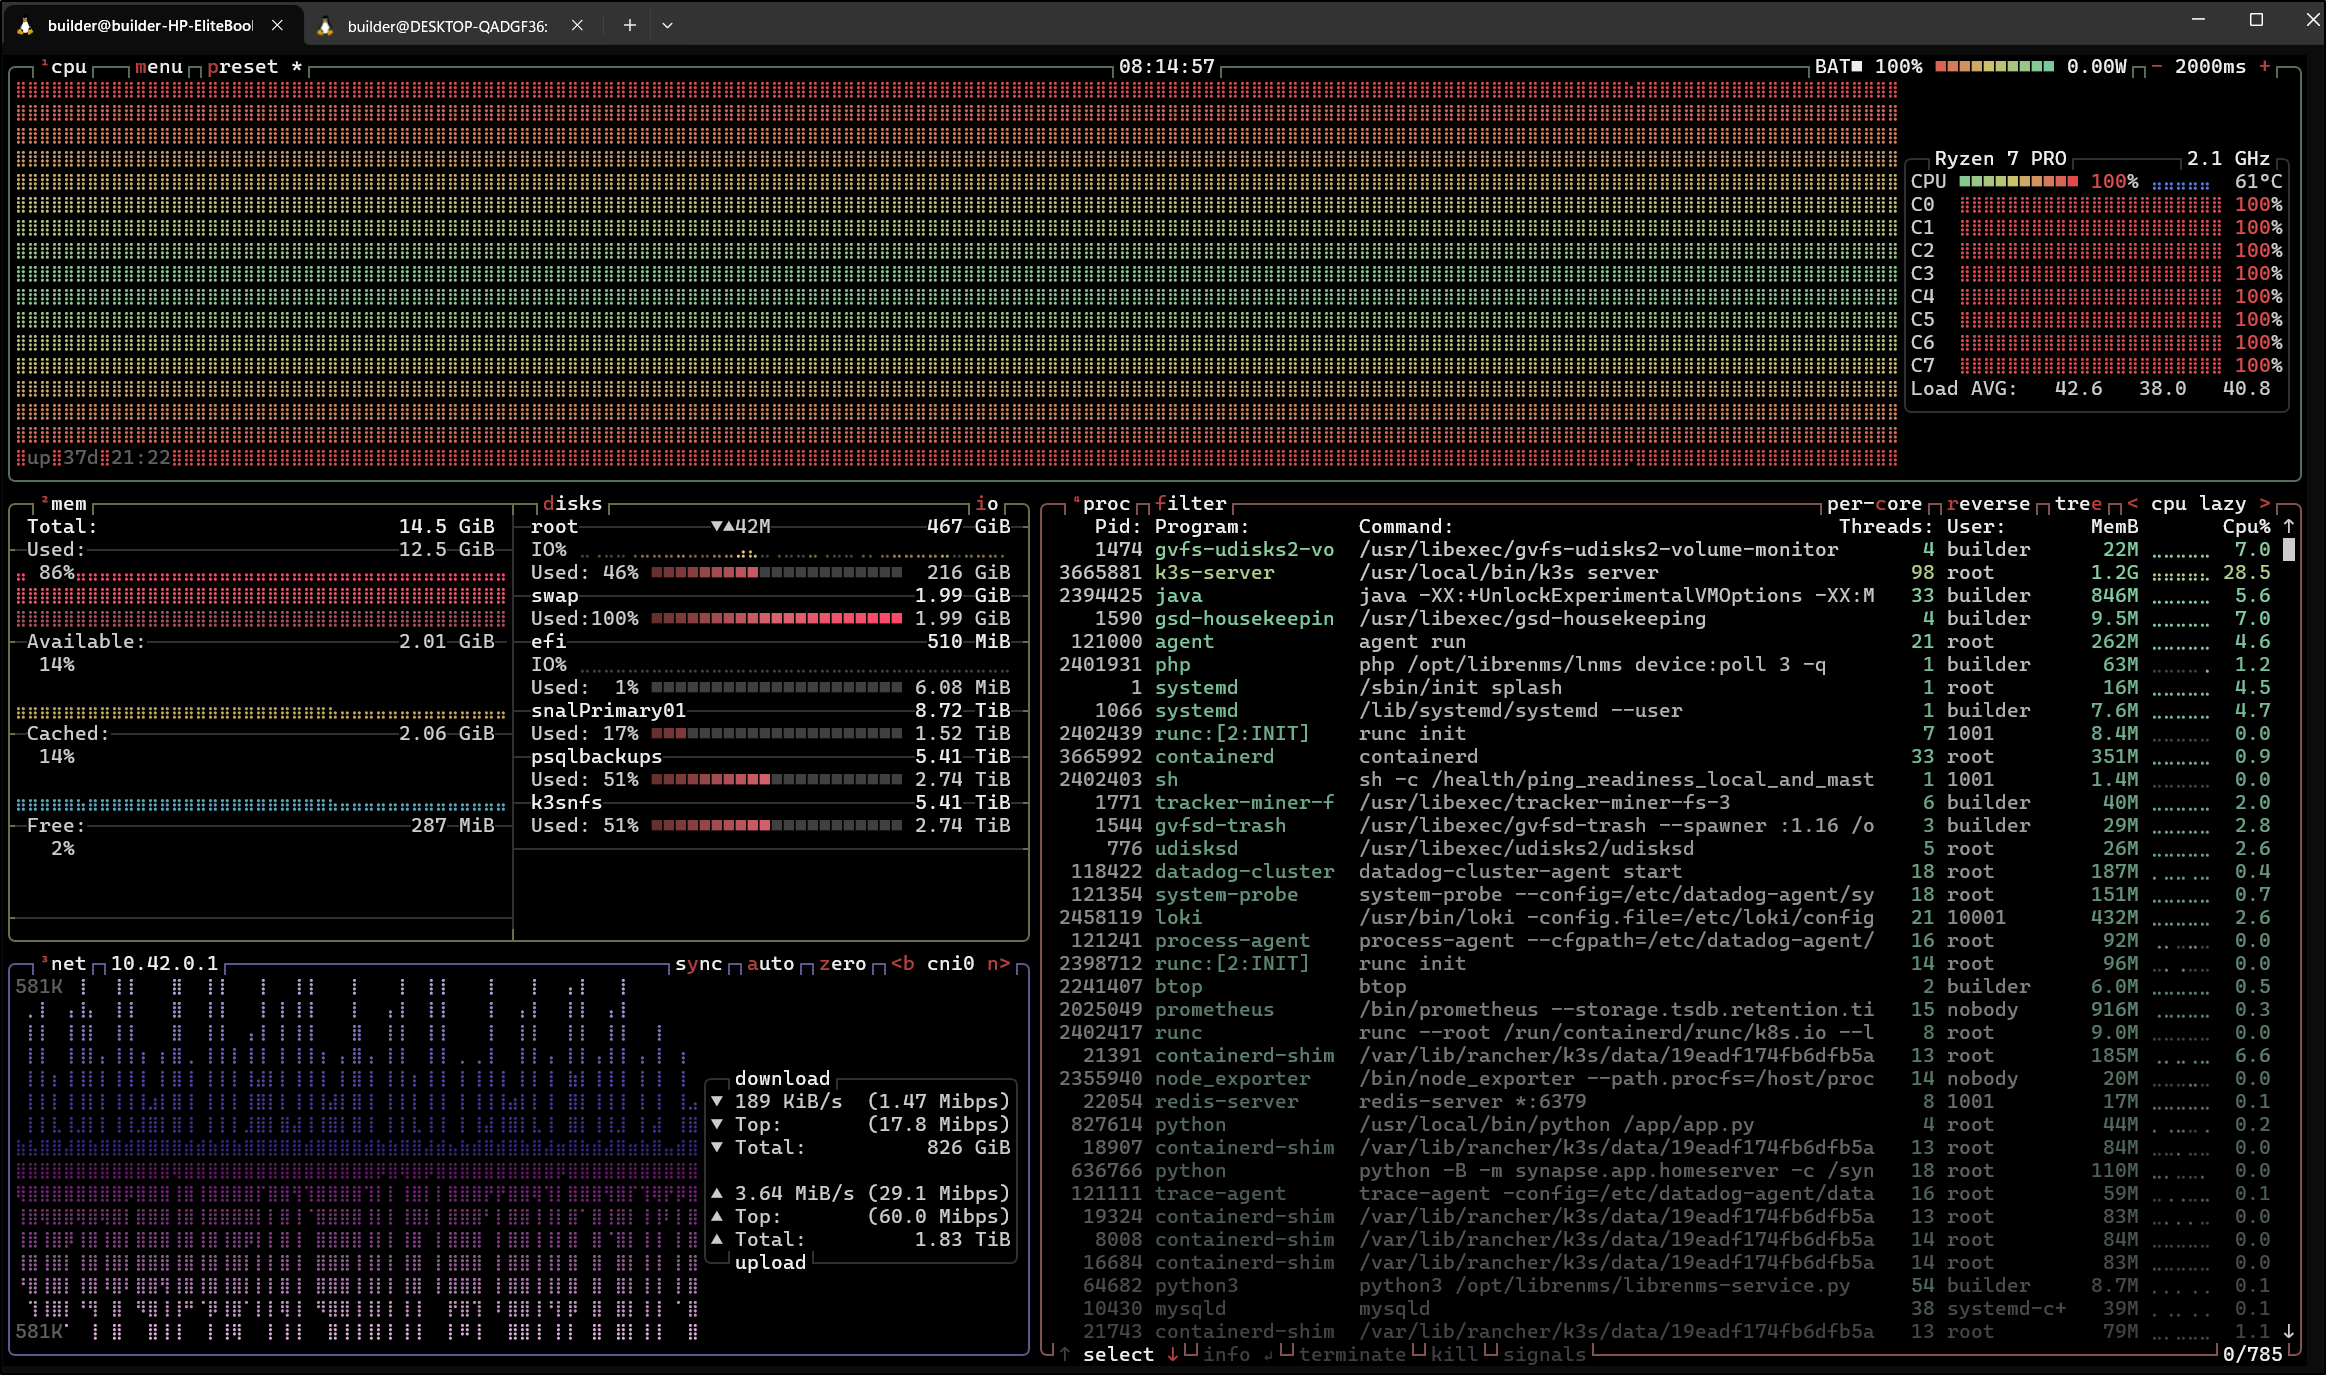
While the CPU still shows 100%, i do find the system perhaps getting better.
(flash to several days later).
It’s still bogged and not improving.
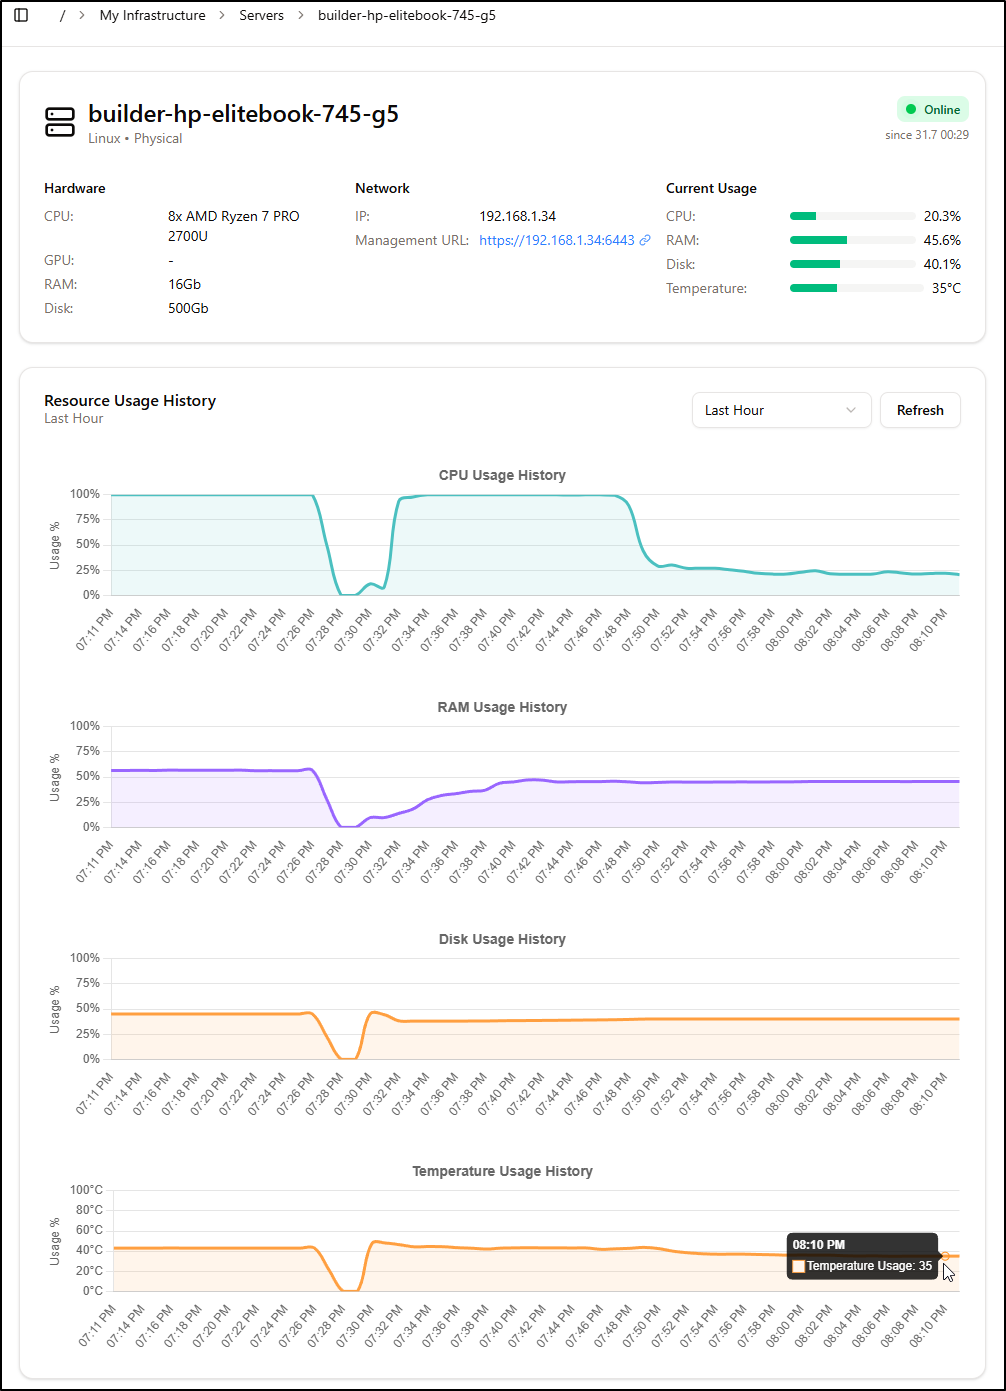
I finally took the plung and rebooted. A few pods needed a kick in the pants, but most came back up. Once everything was finally running, we can see the CPU dropped back down considerably
Summary
Today we tackled a few things including creating a GIT repo backup locally on our NAS. We looked at the differences of Uptime Kuma 2.x to the last release before migrating our monitoring and alerting to Uptime Kuma 2.0beta3.
We fixed a problematic Feedback form by using Github non-expiring narrowly focused tokens (so hopefully this will be the last time).
We setup Grafana Cloud and used Grafana IRM (formerly OnCall) with the new Uptime Kuma (and compared to Pagerduty). Lastly, we started to dig into performance issues with our primary Kubernetes cluster by looking at data in Datadog.