

Published: Jul 22, 2025 by Isaac Johnson
Last week, we showed hot to setup a full-stack Grafana with Alloy, Tempo, Loki, Prometheus and Grafana and then test using it with the telemetry data provided by the Gemini CLI.
Today we want to pivot on the OS stack and use New Relic to ingest our Gemini Telemetry data.
New Relic OTLP endpoint
New Relic makes it easier than just about anyone else in that they have publicly reachable OTLP endpoint that just needs a header.
I did look at the setup a year ago
My guess is that the config should work:
$ cat alloy.config
logging {
  level = "info"
  format = "logfmt"
}

// Send to New Relic
otelcol.exporter.otlphttp "newrelic" {
  client {
    endpoint = "https://otlp.nr-data.net"
    auth     = otelcol.auth.headers.nr.handler
  }
}

otelcol.auth.headers "nr" {
  header {
    key   = "api-key"
    value = "c87xxxxxxxxxxxxxxxxxxxxxxxxxxxxxxdNRAL"
  }
}

// Collect OTLP
otelcol.receiver.otlp "httpreceiver" {
  grpc {
    endpoint = "0.0.0.0:4317"
  }

  http {
    endpoint = "0.0.0.0:4318"
  }

  output {
    metrics = [otelcol.processor.batch.default.input]
    logs    = [otelcol.processor.batch.default.input]
    traces  = [otelcol.processor.batch.default.input]
  }
}

// Process and send
otelcol.processor.batch "default" {

  output {
    metrics = [otelcol.exporter.otlphttp.newrelic.input]
    logs    = [otelcol.exporter.otlphttp.newrelic.input]
    traces  = [otelcol.exporter.otlphttp.newrelic.input]
  }
}
discovery.kubernetes "podmetrics" {
  role = "pod"
}

discovery.kubernetes "nodes" {
  role = "node"
}

discovery.kubernetes "services" {
  role = "service"
}

discovery.kubernetes "endpoints" {
  role = "endpoints"
}
I can easily apply that and rotate the pods
$ kubectl get po -n grafana -l app.kubernetes.io/instance=alloy && ku
bectl delete cm alloy-config -n grafana && kubectl create configmap -n grafana alloy-config "--from-file=con
fig.alloy=./alloy.config" && kubectl get po -n grafana -l app.kubernetes.io/instance=alloy && kubectl delete
 po -n grafana -l app.kubernetes.io/instance=alloy && sleep 10 && kubectl get po -n grafana -l app.kubernete
s.io/instance=alloy
NAME          READY   STATUS    RESTARTS   AGE
alloy-6wknt   2/2     Running   0          20h
alloy-dpgx9   2/2     Running   0          20h
alloy-gsmng   2/2     Running   0          20h
alloy-sjz8b   2/2     Running   0          20h
configmap "alloy-config" deleted
configmap/alloy-config created
NAME          READY   STATUS    RESTARTS   AGE
alloy-6wknt   2/2     Running   0          20h
alloy-dpgx9   2/2     Running   0          20h
alloy-gsmng   2/2     Running   0          20h
alloy-sjz8b   2/2     Running   0          20h
pod "alloy-6wknt" deleted
pod "alloy-dpgx9" deleted
pod "alloy-gsmng" deleted
pod "alloy-sjz8b" deleted
NAME          READY   STATUS    RESTARTS   AGE
alloy-dbhrp   1/2     Running   0          13s
alloy-nb9p4   1/2     Running   0          13s
alloy-v4ghh   1/2     Running   0          12s
alloy-ww2dh   2/2     Running   0          14s
Now we have a challenge to test as today I’m at a Swim Meet over in River Falls, WI. That means without a VPN I wouldn’t be able to reach my Alloy based on the last settings file
{
  "theme": "Shades Of Purple",
  "selectedAuthType": "oauth-personal",
  "telemetry": {
    "enabled": true,
    "target": "local",
    "otlpEndpoint": "http://192.168.1.33:30921",
    "logPrompts": true
  }
}
I could either run an OTel Collector in docker locally, or just use my backdoor access to the home network and create a forwarding rule in my firewall
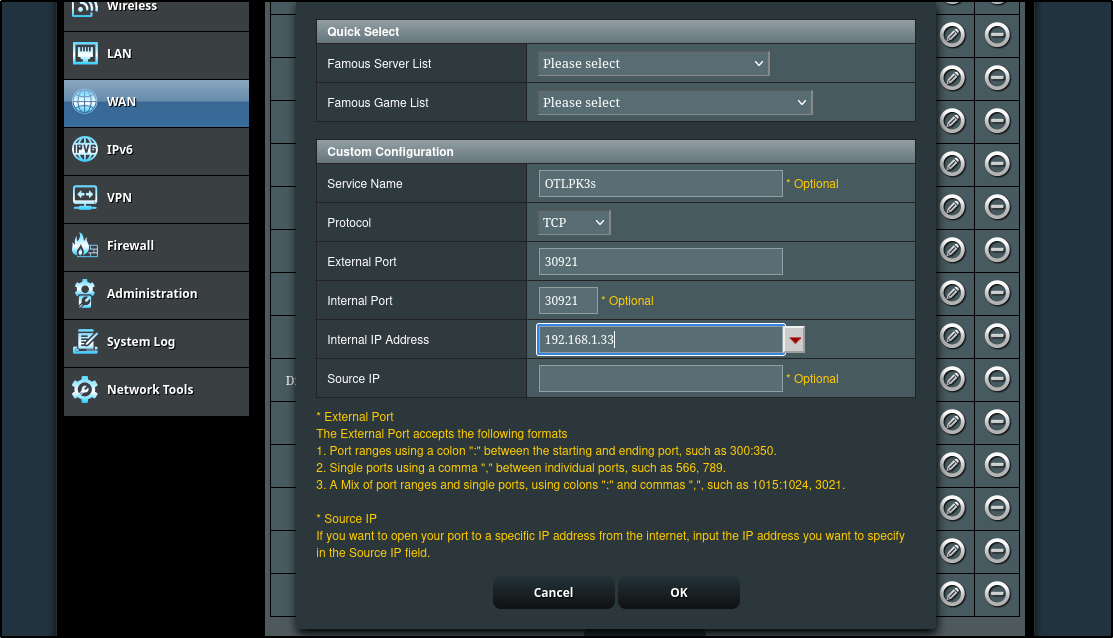
With the firewall open, I should be able to send my telemetry back over to Minnesota, into the Otel collector in K8s and back out again to New Relic with the following settings:
$ cat ~/.gemini/settings.json
{
  "theme": "Shades Of Purple",
  "selectedAuthType": "oauth-personal",
  "telemetry": {
    "enabled": true,
    "target": "local",
    "otlpEndpoint": "http://75.73.224.240:30921",
    "logPrompts": true
  }
}
Gemini CLI
This laptop hasn’t had Gemini CLI installed yet, so let’s sort that out
$ npm install -g @google/gemini-cli
npm WARN deprecated node-domexception@1.0.0: Use your platform's native DOMException instead

added 437 packages in 53s

128 packages are looking for funding
  run `npm fund` for details
npm notice
npm notice New major version of npm available! 10.5.0 -> 11.4.2
npm notice Changelog: https://github.com/npm/cli/releases/tag/v11.4.2
npm notice Run npm install -g npm@11.4.2 to update!
npm notice
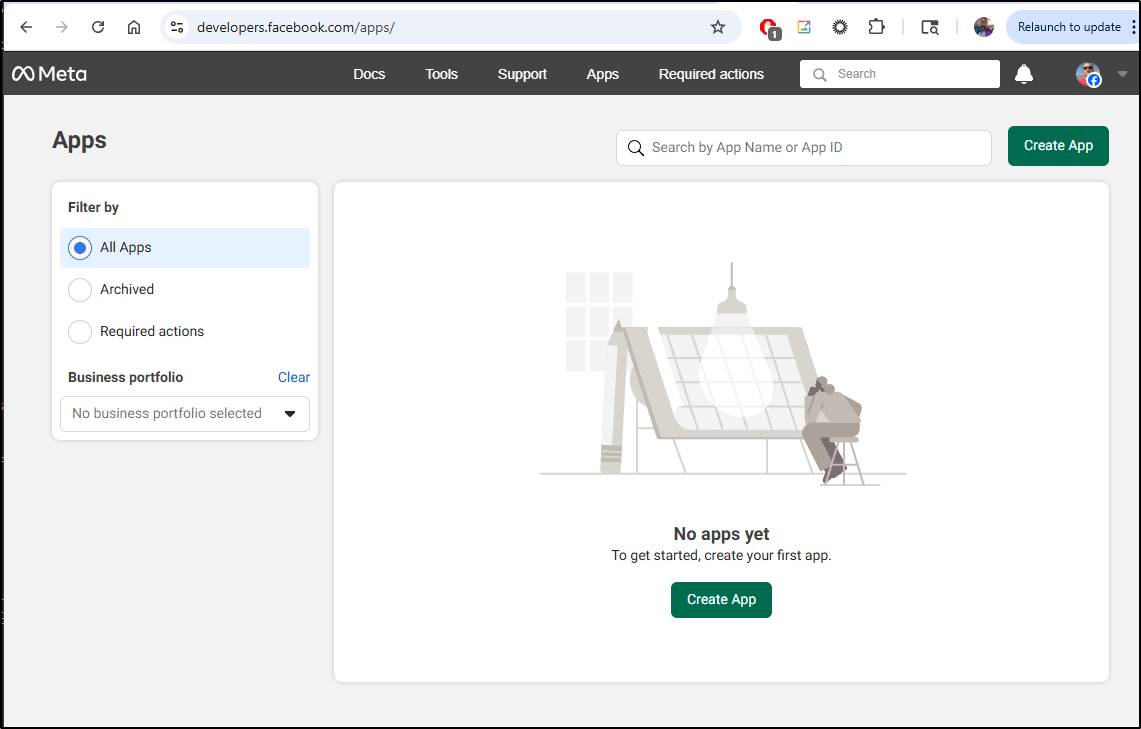
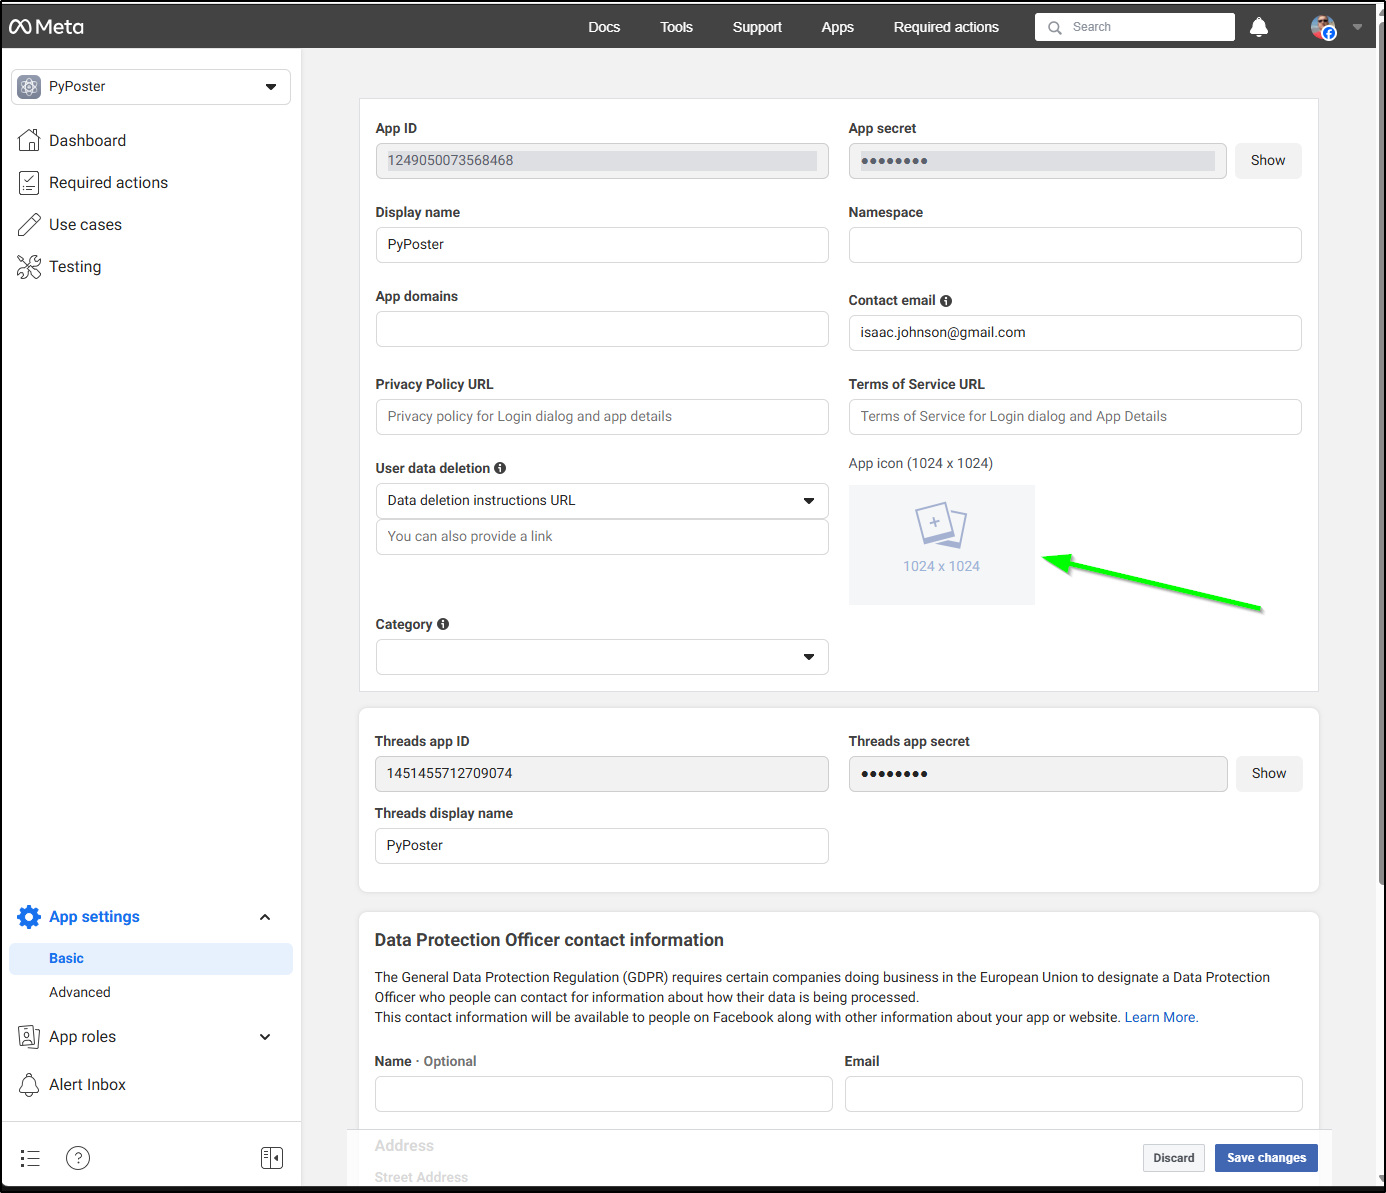
I think I want try and add Threads to my PyBSPoster app.
There is some prep-work first - I need to register as a developer with Meta and then click “Create App”
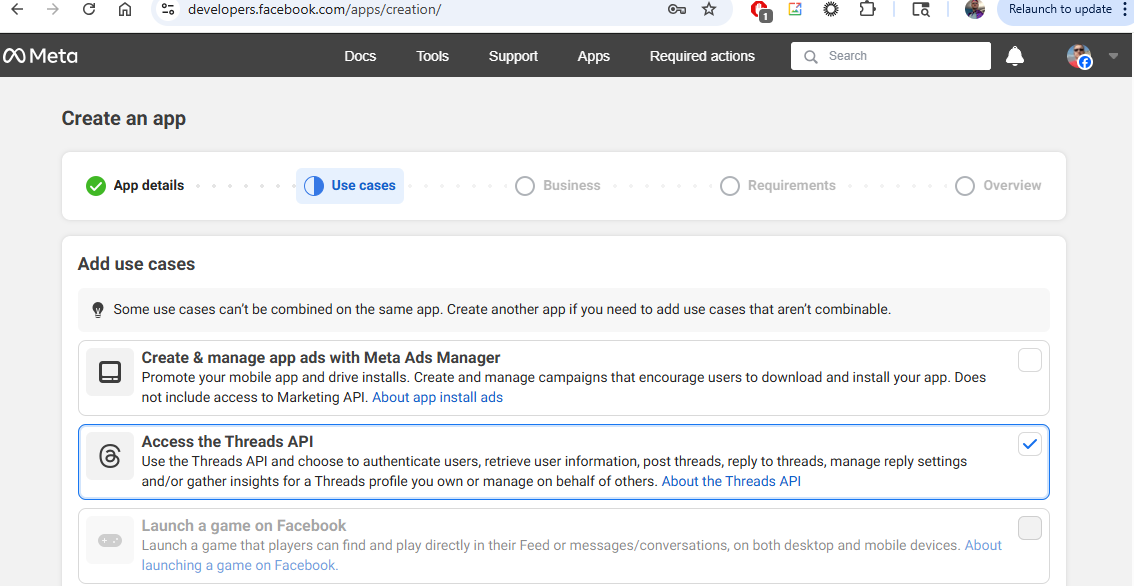
They now make permissions a bit easier so I’ll just pick the Threads API group
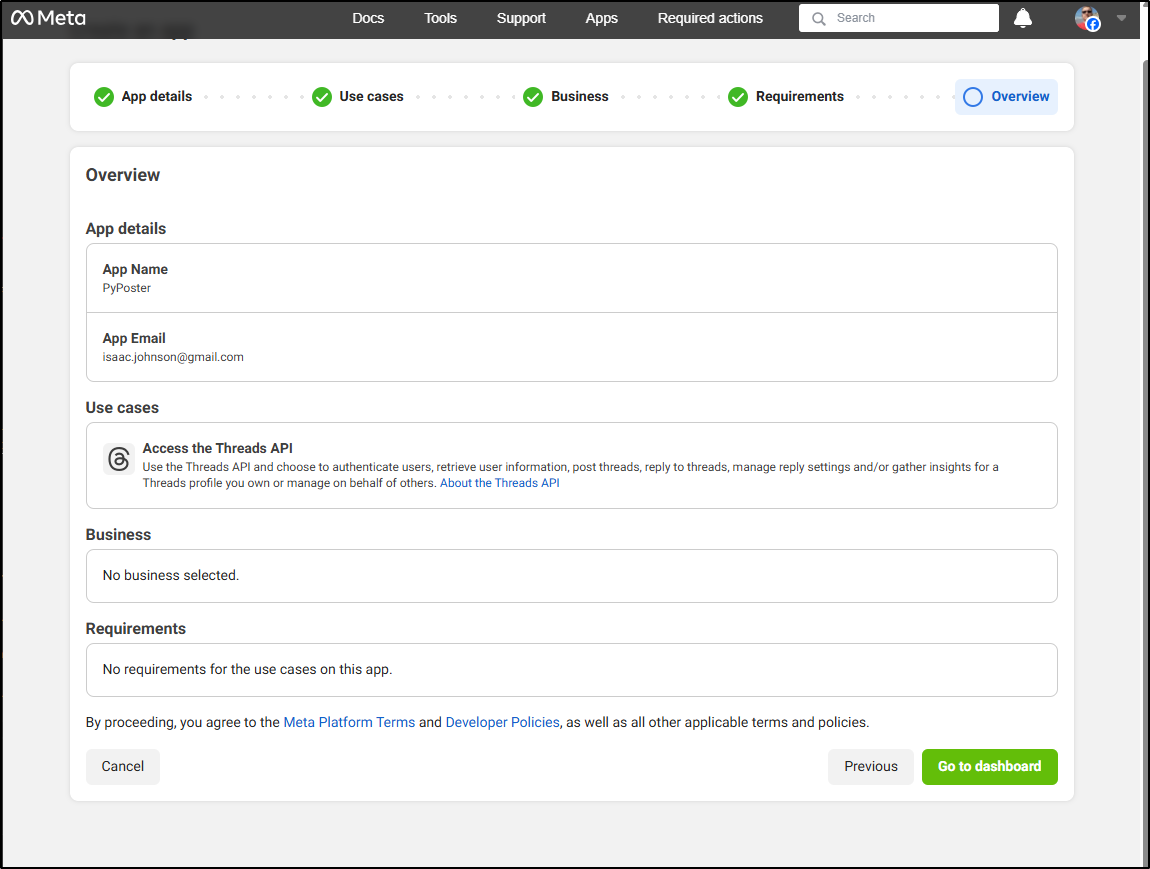
I have everything I need now to create the app
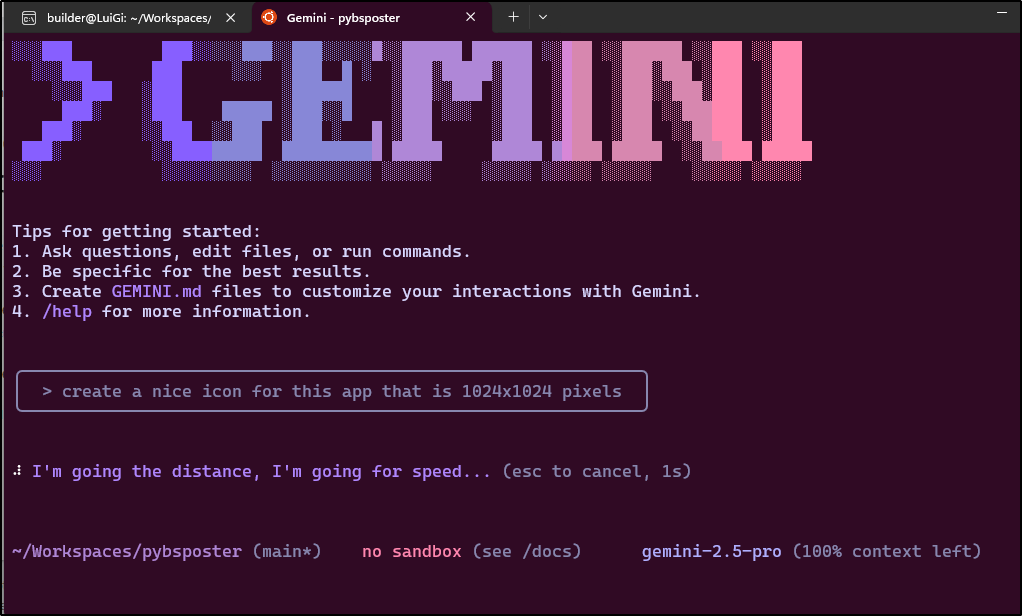
This might be our first use of Gemini - create a nice Icon for the app
I’ll ask Gemini CLI after logging in
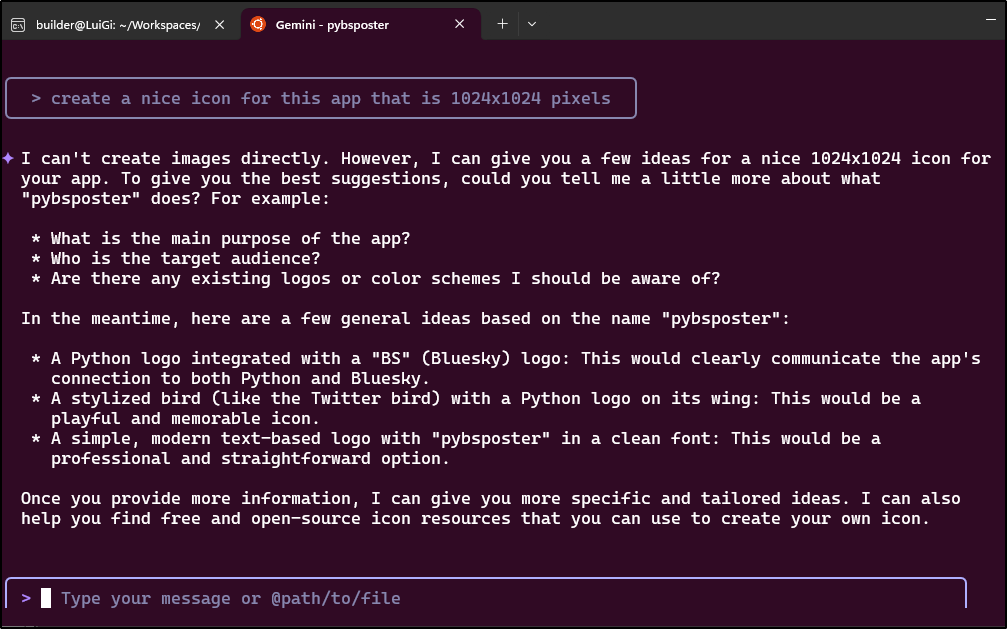
I thought it could do Imagen. Interestingly it gave up on creating an image and offered pointers instead
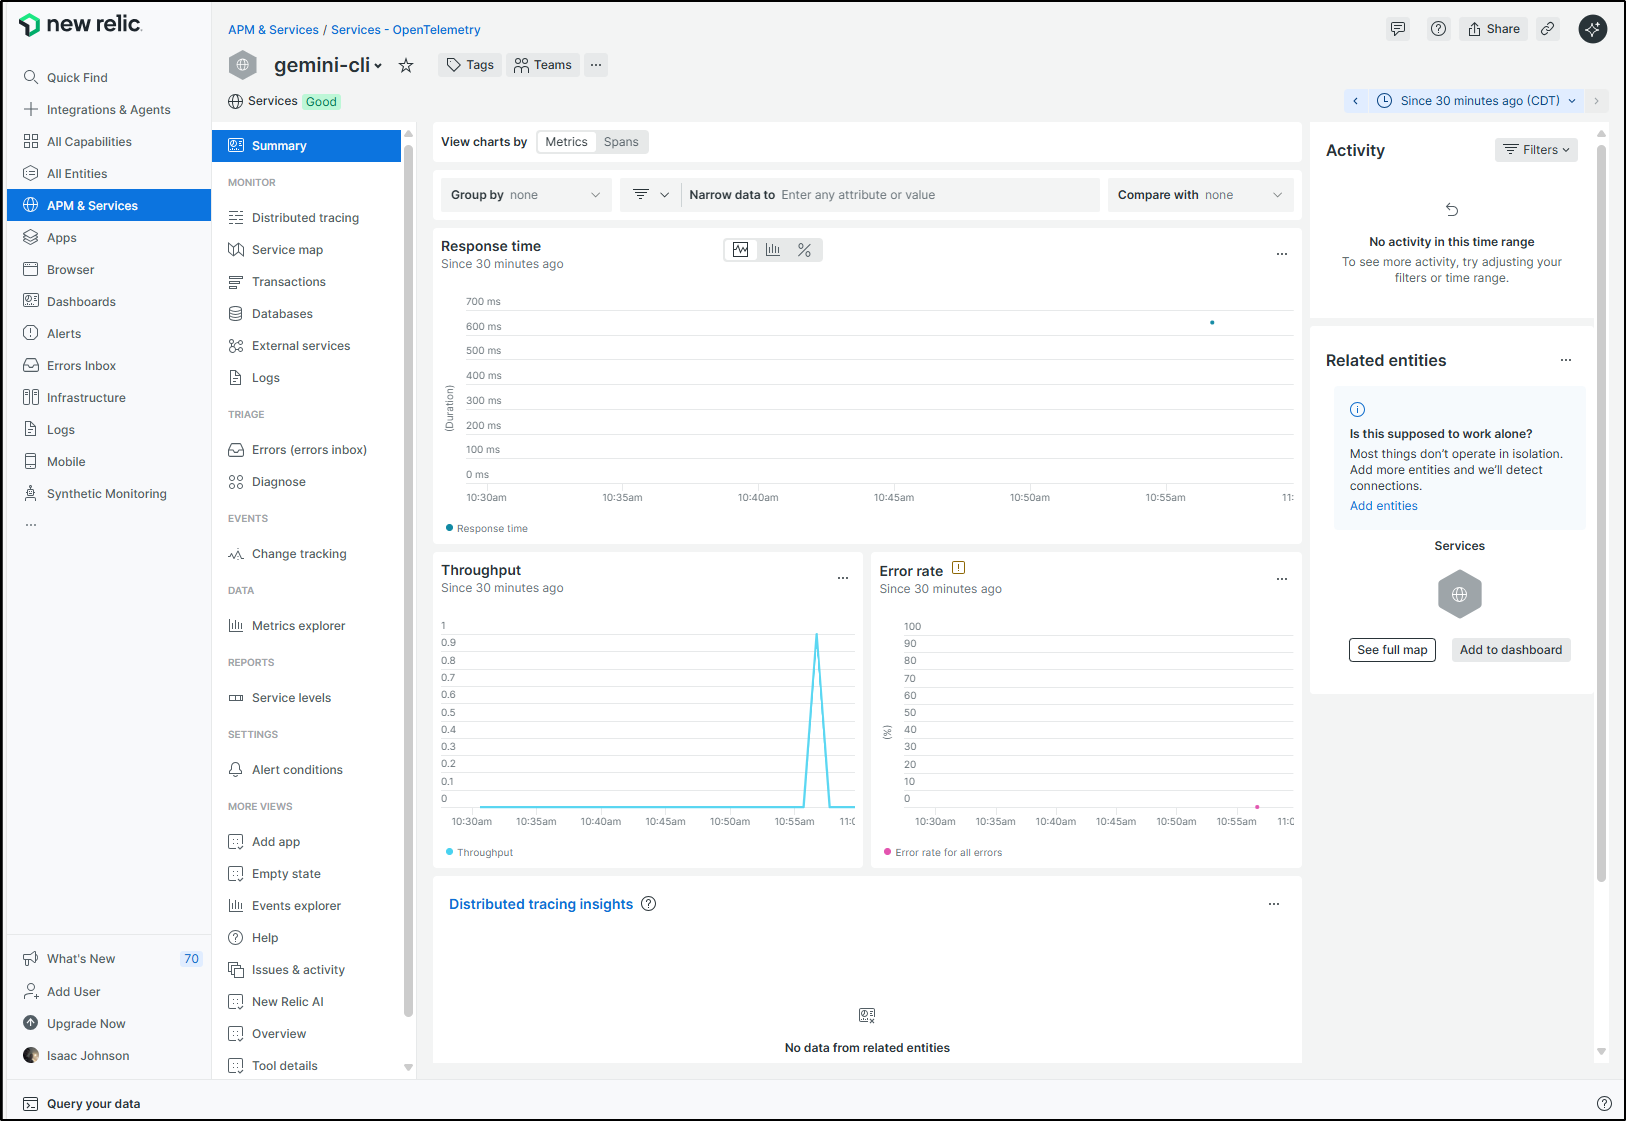
New Relic
However, that was enough to generate some OTLP data and forward on to New Relic
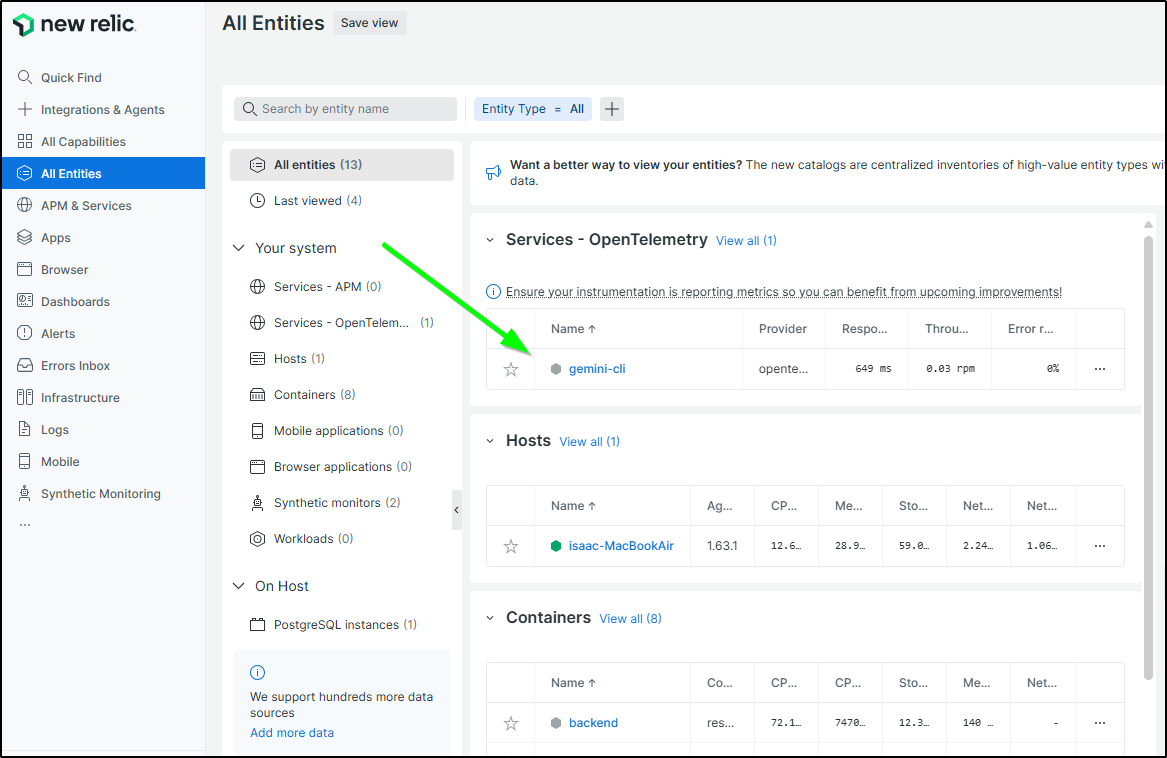
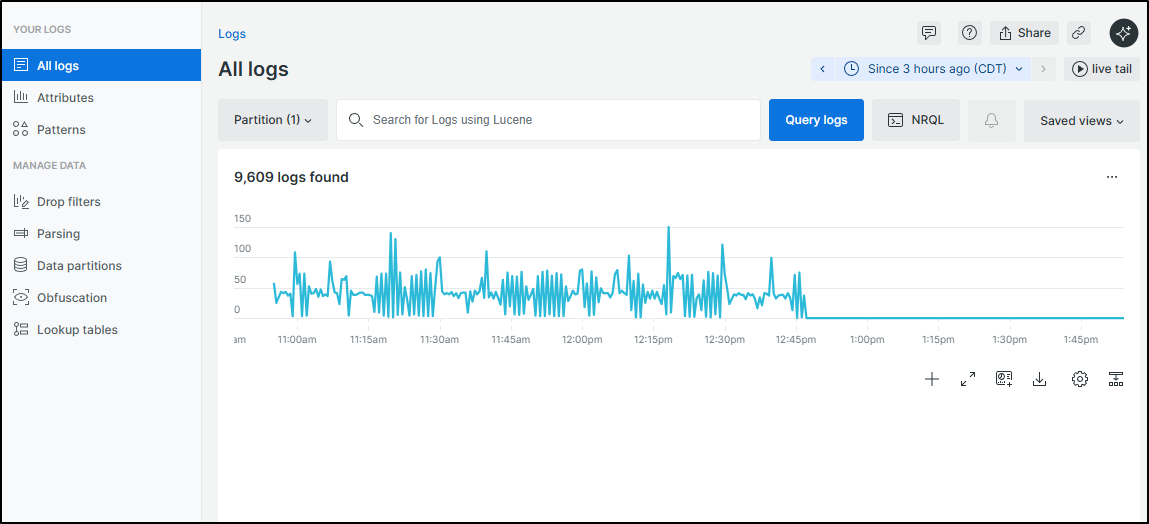
I can see throughput captured right off the top
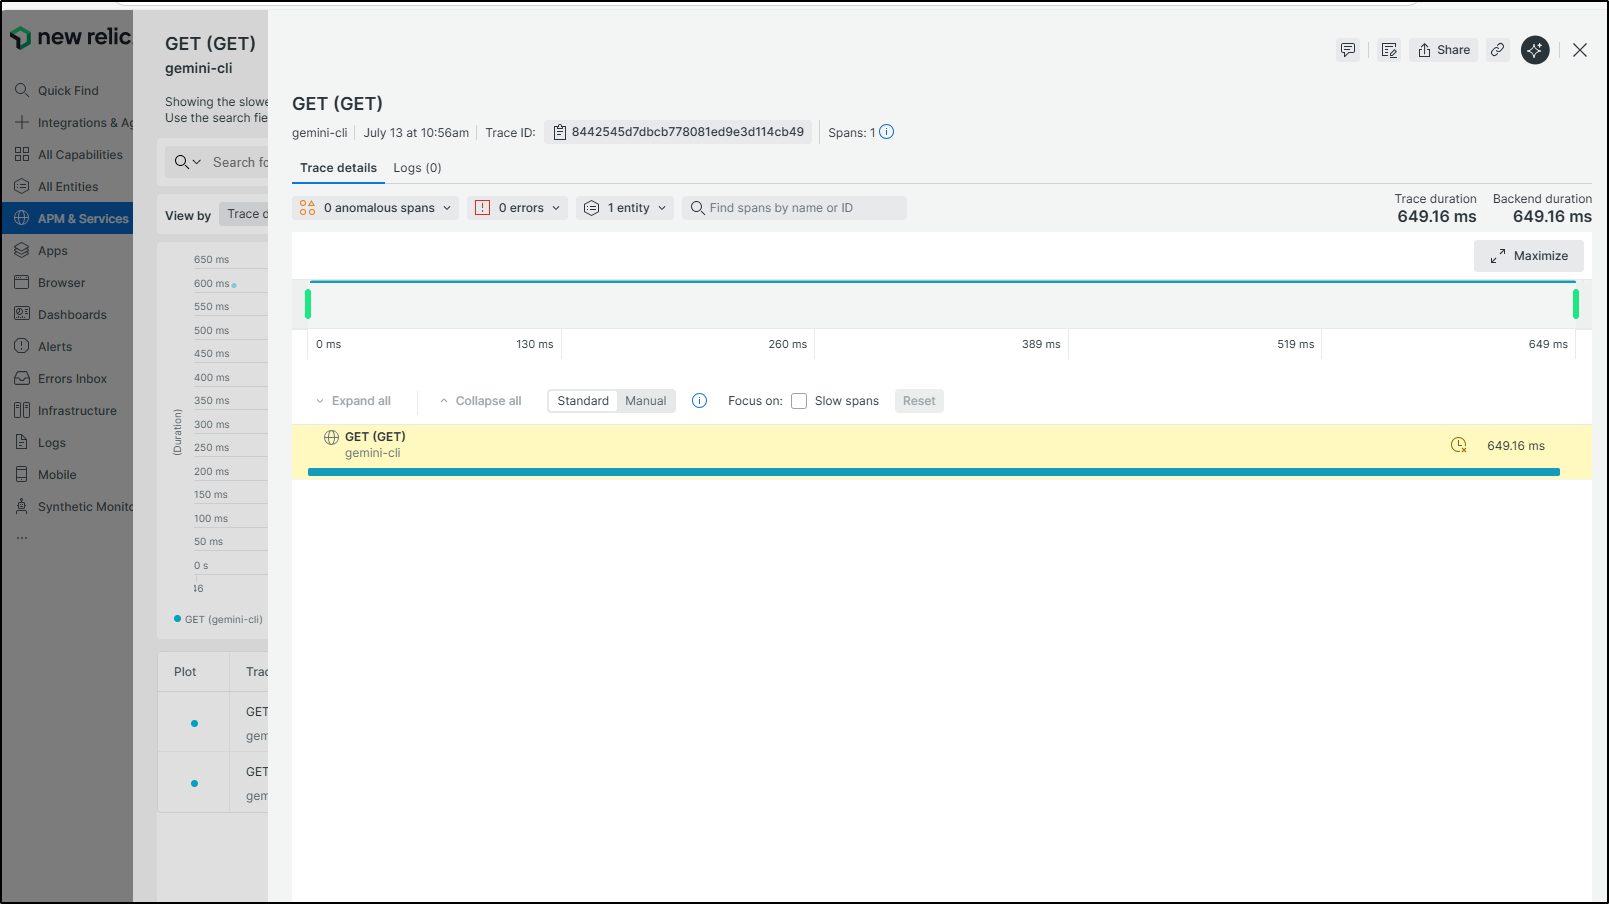
I can see at least one span (trace)
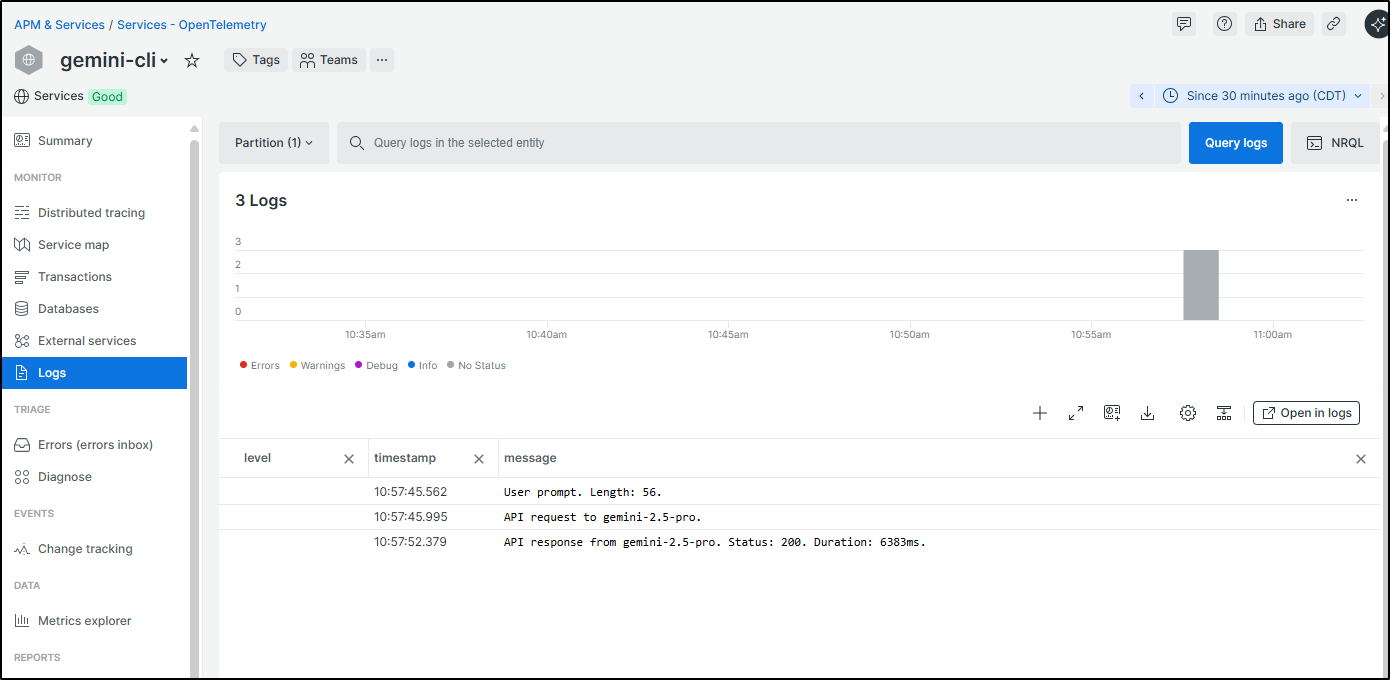
and, of course, logs as pushed forward by Alloy
Before I go on, I noticed something that is blowing my free tier limits.
I have an agent on a K8s cluster node and it’s pumping out 2.5k of logs every 30m
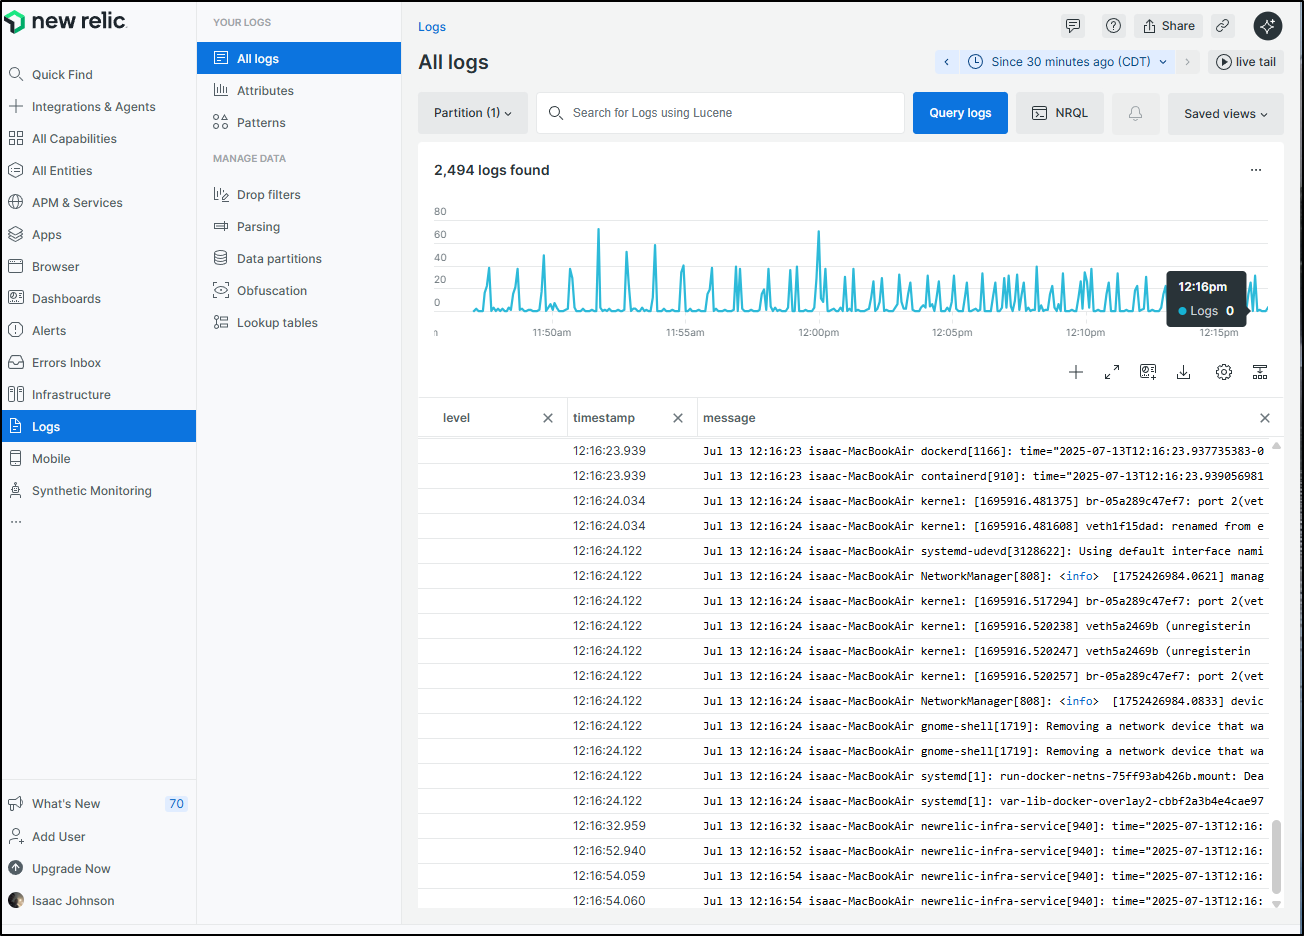
To mitigate this, I just stopped the agent
root@isaac-MacBookAir:~# systemctl stop newrelic-infra.service
root@isaac-MacBookAir:~#
Which had the intended effect
Metrics
Let’s take a moment and look at the Metrics that are sent up
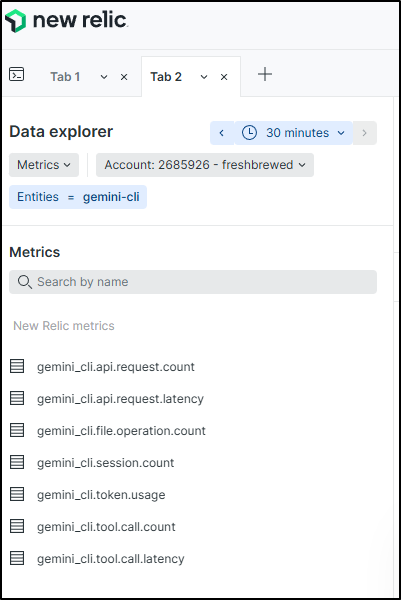
and we can see a lot are sent up
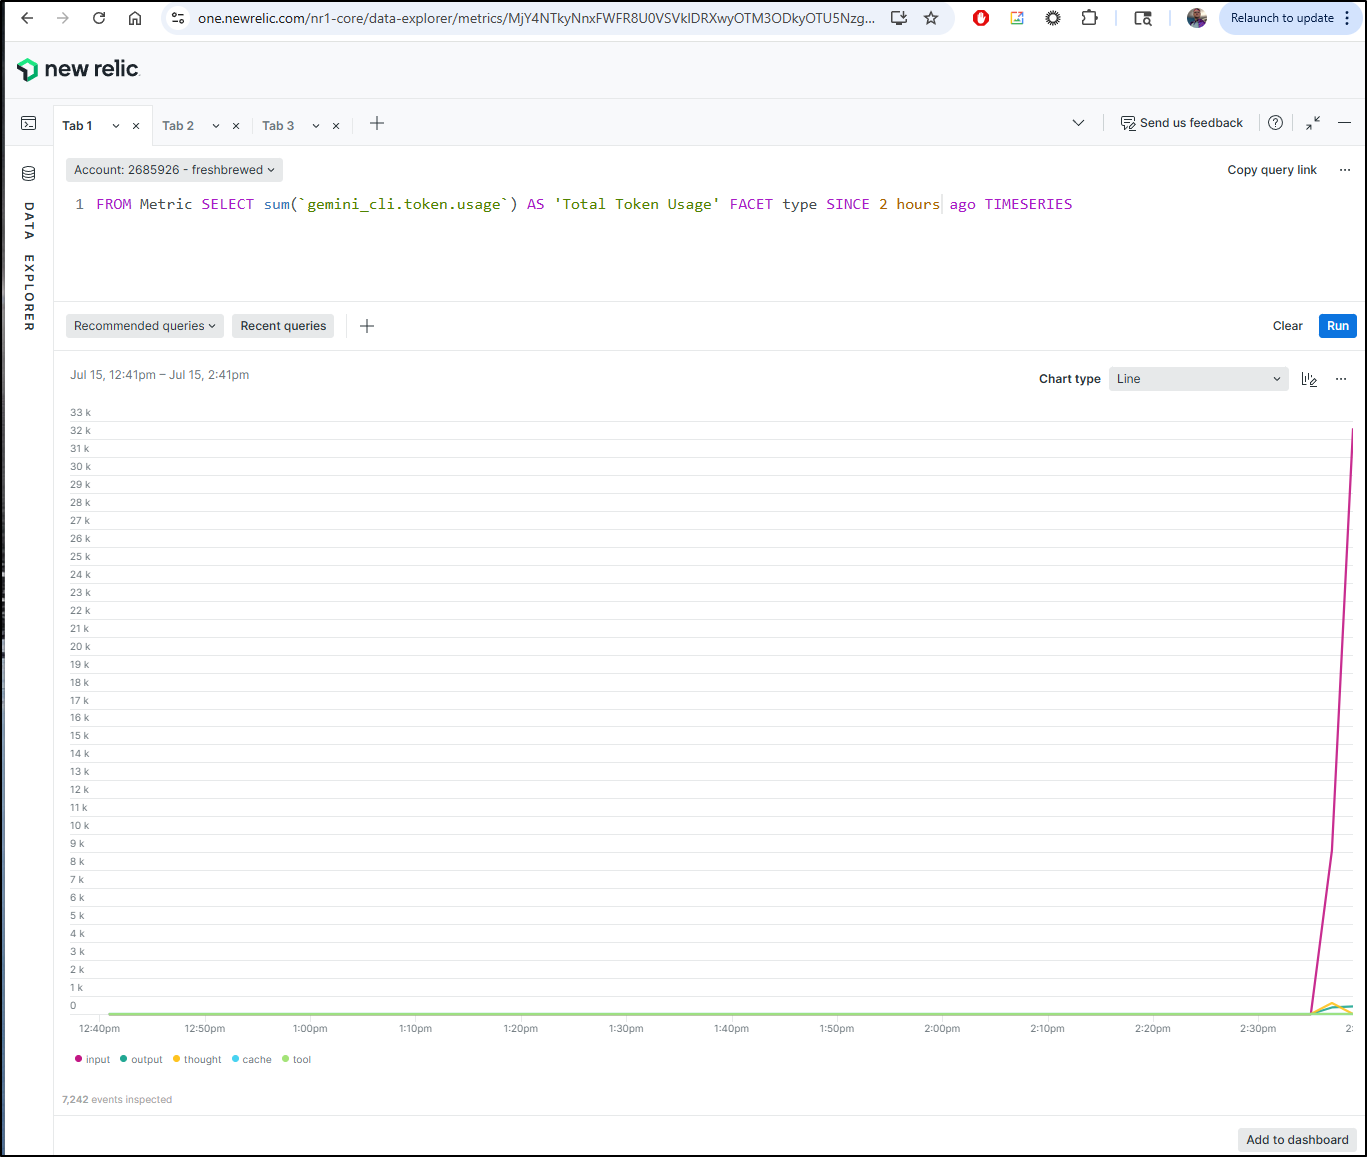
For instance, we can use the NRQL below to get a graph of token usage
FROM Metric SELECT sum(
gemini_cli.token.usage) AS ‘Total Token Usage’ FACET type SINCE 2 hours ago TIMESERIES
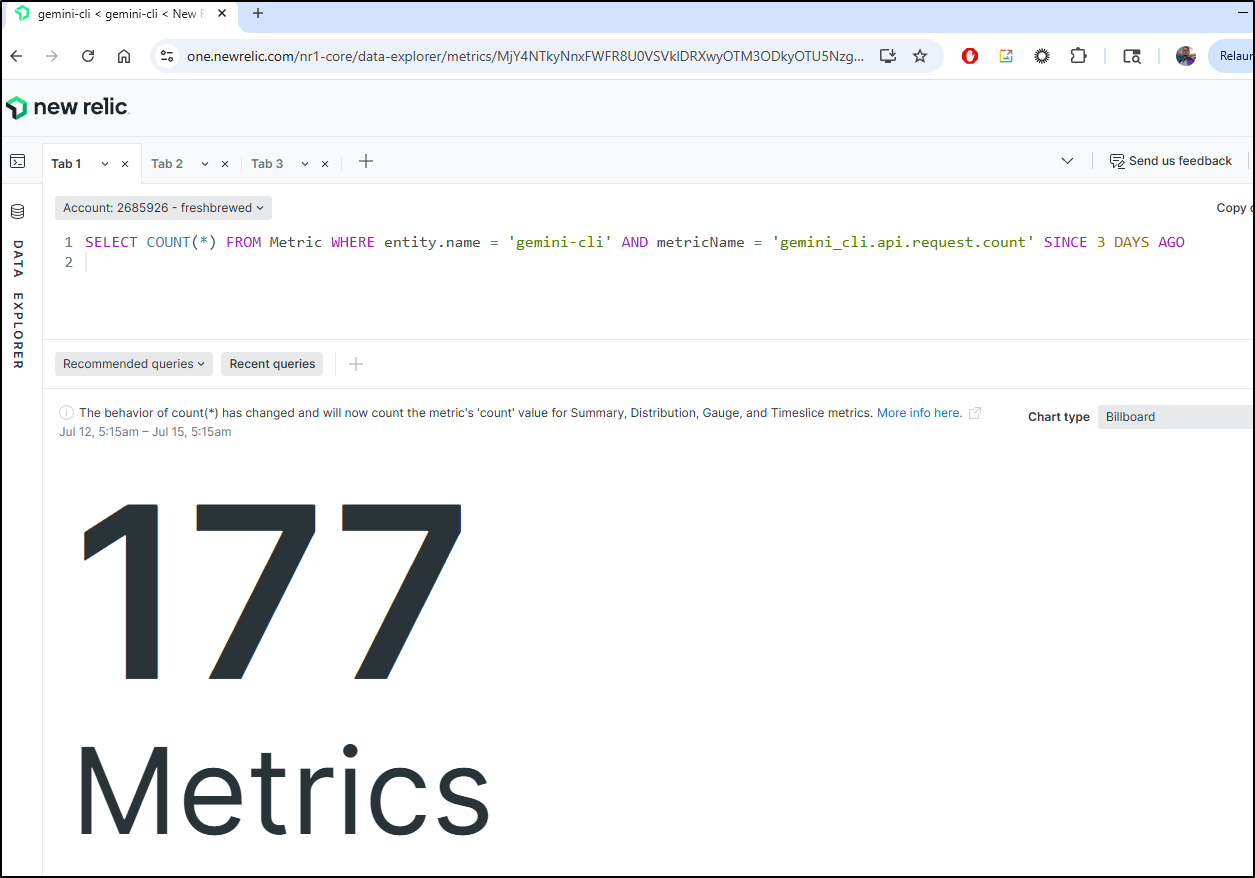
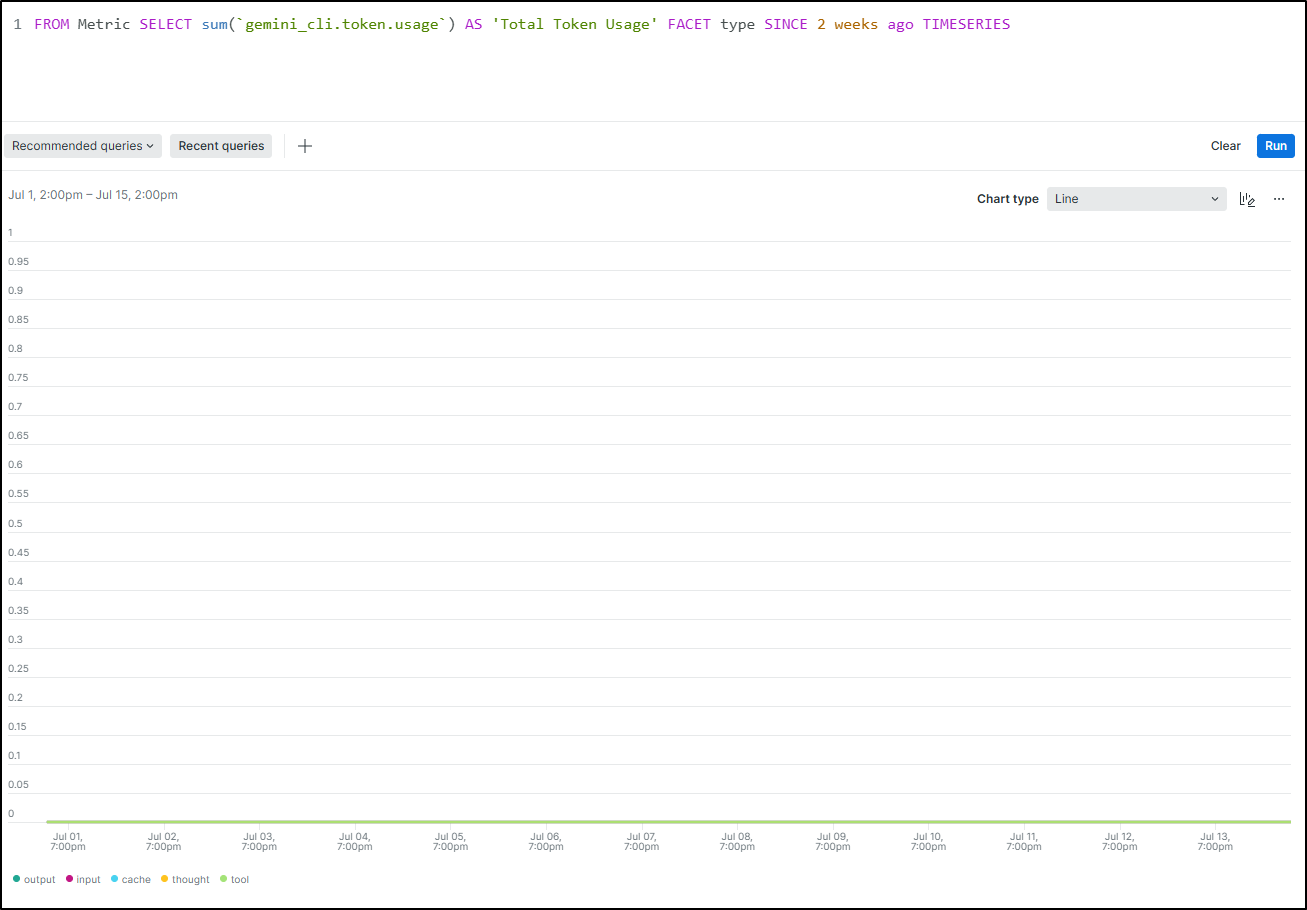
Something I realized about the TIMESERIES is it can hide data if the granularity isn’t narrow enough.
For instance, that same query run at the same took looks empty if I set the windows to 2 weeks
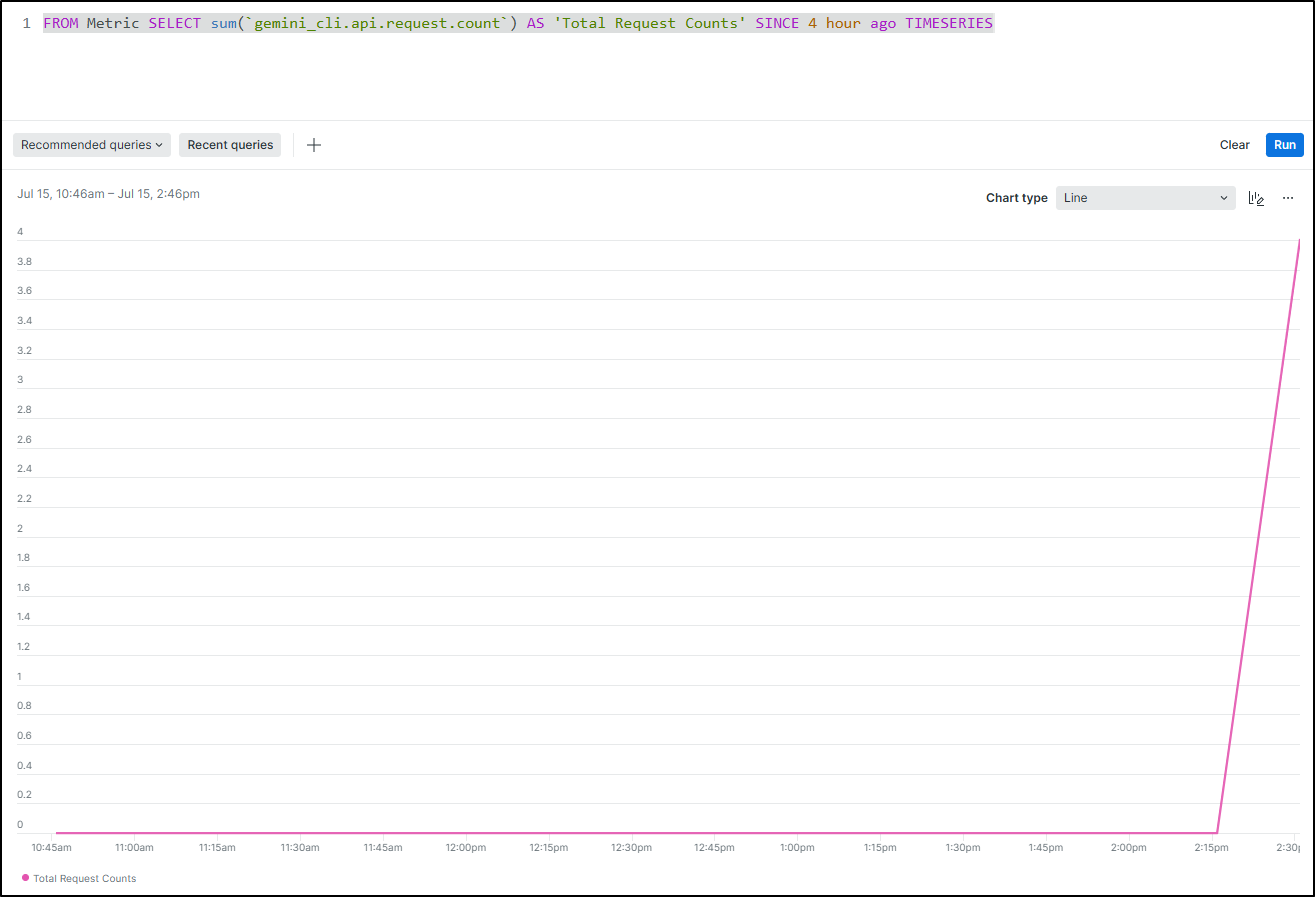
Much like Token Usage, we can check our Requests as well with a query like
FROM Metric SELECT sum(
gemini_cli.api.request.count) AS ‘Total Request Counts’ SINCE 4 hour ago TIMESERIES
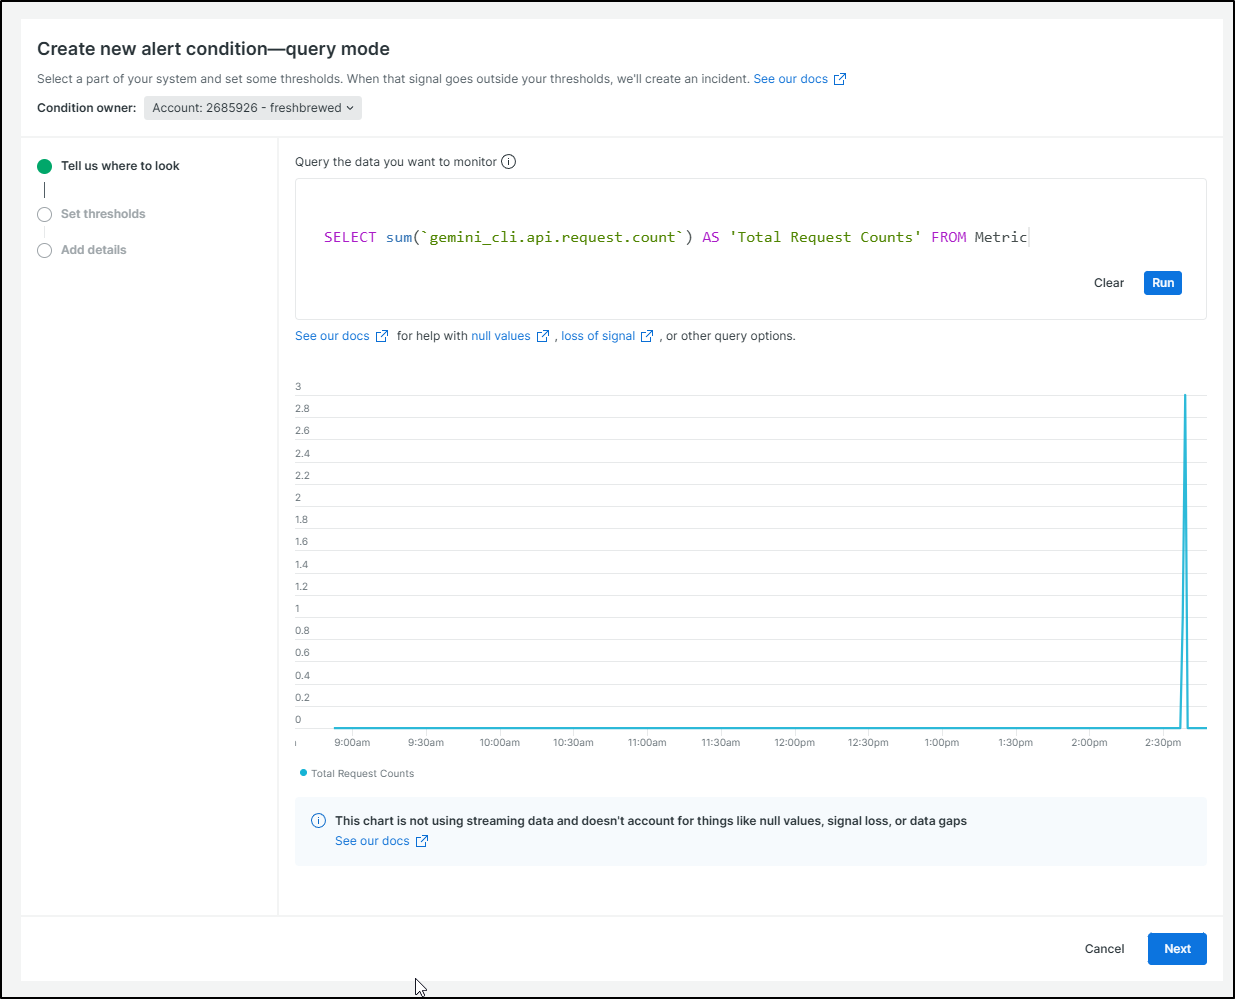
Alerts
This is where we may wish to alert on egregious usage.
For instance, I could create a new alert on Requests
then set a threshold like 500
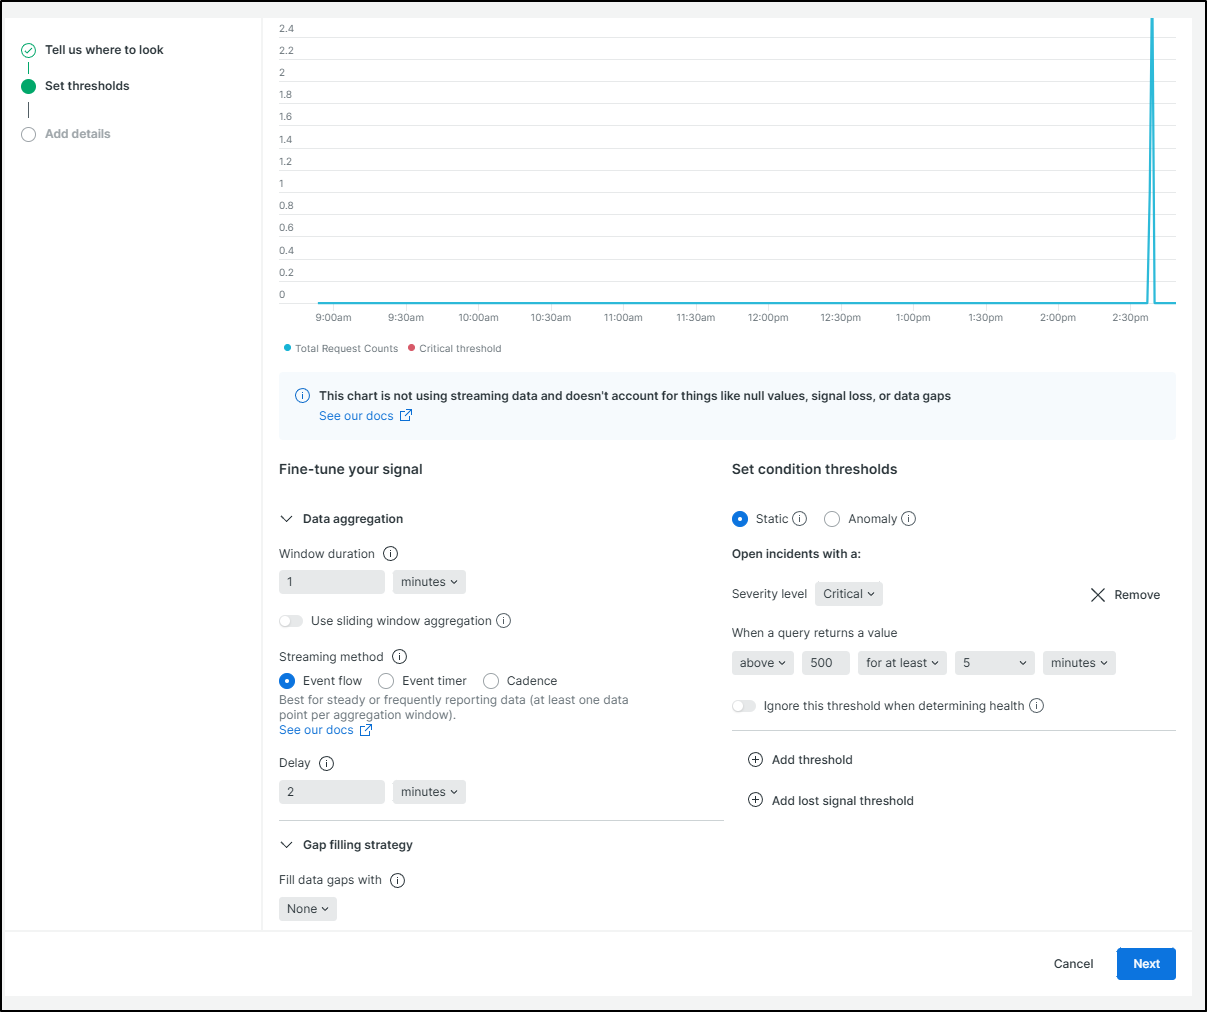
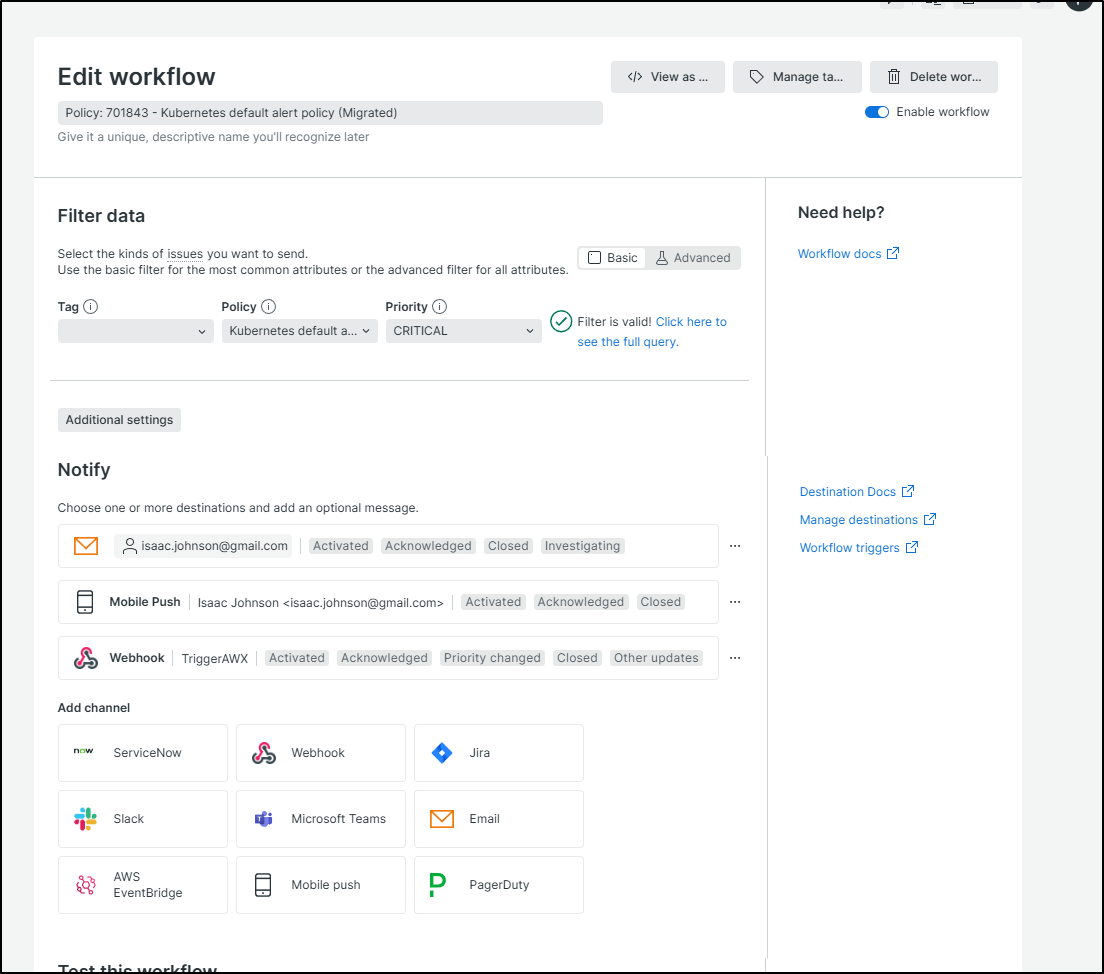
Then create an alert or leverage an existing alerting policy
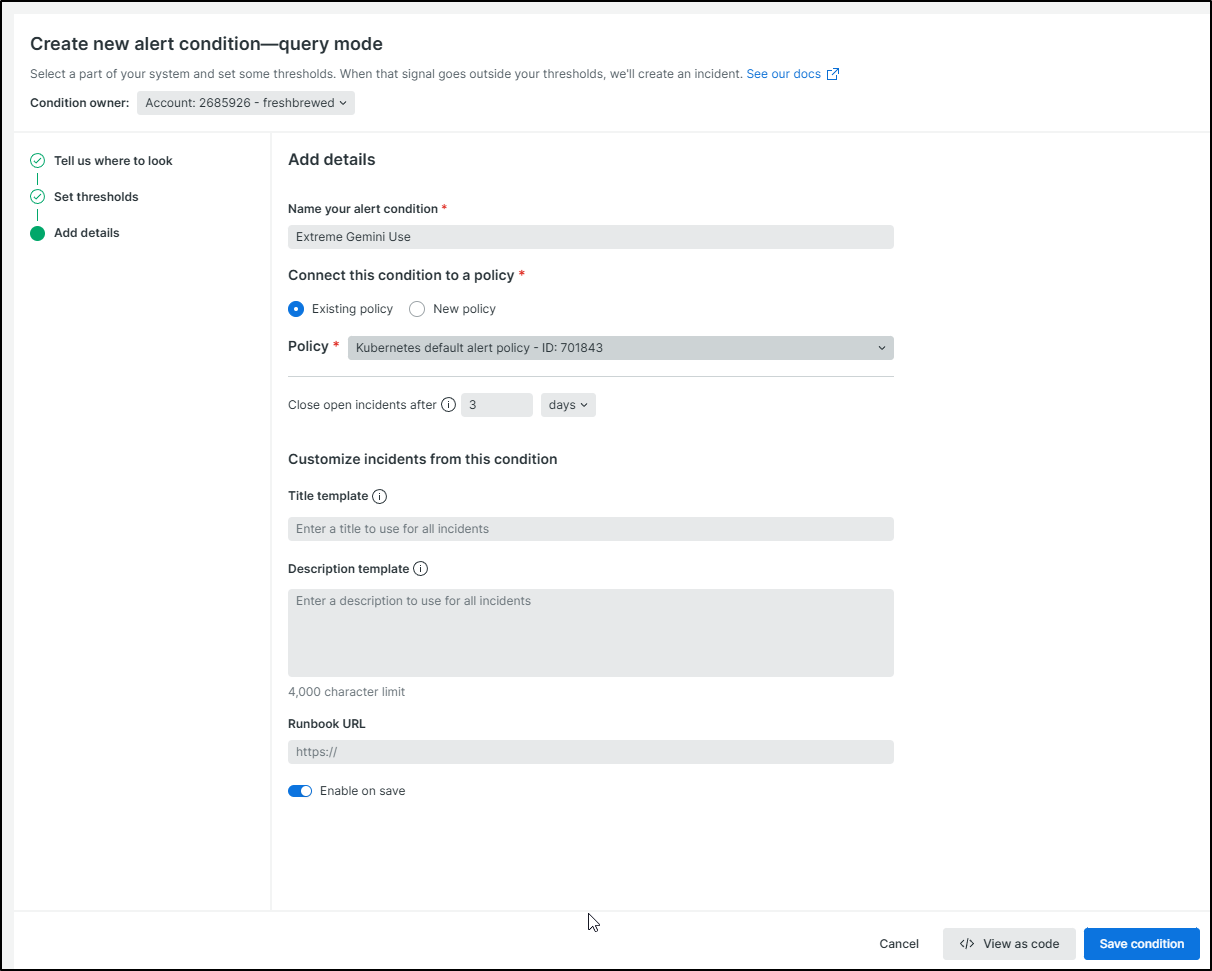
That alert policy can do things like message slack, create a JIRA or send to email or PagerDuty
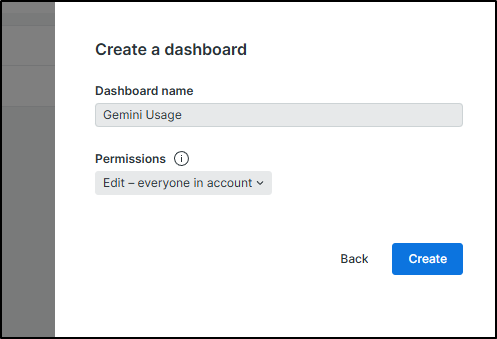
Dashboards
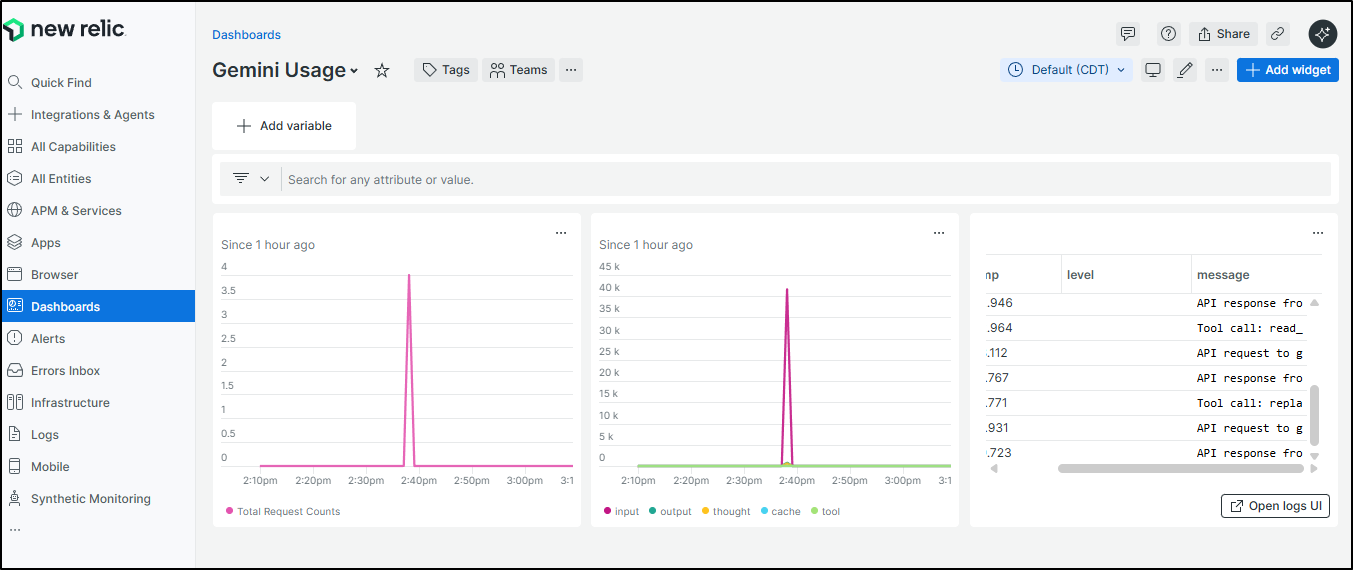
I can also create a dashboard we could use to view the data
I can now create queries for requests, tokens and logs related to Gemini CLI
Summary
Today we walked through using Grafana Alloy, their Open Telemetry collector, to send metrics, logs and traces to New Relic’s OTLP endpoint.
I spoke on how one might expose the endpoint externally then showed how using the telemetry section for the Gemini CLI allows us to collect usage data.
Lastly, I showed how to query metrics and logs and build a dashboard as well as Alert Policy in new relic to alert on excessive usage.