

Published: Jun 24, 2025 by Isaac Johnson
Continuing from the last post on Goldilocks, I wanted to dig into three more Open-Source tools from Fairwinds.
Nova is about scanning our cluster for installed Helm Charts, then checking to see if they are out of date. It can also check the underlying container versions as well. Pluto is all about doing a check for out-of-date Kubernetes API versions. I don’t cover it below, but you can add Pluto checks as a Github Action. Lastly, Polaris is an open-source policy engine for Kubernetes. We’ll dig into scans but only touch on enforcement with the admission controller.
Nova
Nova is actually quite easy to install as it has a nice brew install recipe
builder@LuiGi:~/Workspaces$ brew tap fairwindsops/tap
==> Auto-updating Homebrew...
Adjust how often this is run with HOMEBREW_AUTO_UPDATE_SECS or disable with
HOMEBREW_NO_AUTO_UPDATE. Hide these hints with HOMEBREW_NO_ENV_HINTS (see `man brew`).
==> Downloading https://ghcr.io/v2/homebrew/portable-ruby/portable-ruby/blobs/sha256:b5c9268815fbab7b7971307b2871f4206e081218b9deb4625d668d6c3563483b
################################################################################################################################################################### 100.0%
==> Pouring portable-ruby-3.4.4.x86_64_linux.bottle.tar.gz
==> Auto-updated Homebrew!
Updated 4 taps (oven-sh/bun, derailed/k9s, homebrew/core and homebrew/cask).
==> New Formulae
addons-linter                     cpdf                              hyper-mcp                         oven-sh/bun/bun@1.2.13            shamrock
alejandra                         cram                              jjui                              oven-sh/bun/bun@1.2.14            skalibs
autocycler                        crd2pulumi                        jwt-hack                          oven-sh/bun/bun@1.2.15            skani
aws-lc                            credo                             kargo                             oxen                              smenu
benchi                            e2b                               kraken2                           pangene                           sqruff
bento                             elf2uf2-rs                        ktop                              pdtm                              style-dictionary
blueprint-compiler                erlang@27                         kubectl-ai                        perbase                           sylph
boa                               execline                          libbsc                            pieces-cli                        tabixpp
bower-mail                        fastga                            libpq@16                          pixd                              timoni
breseq                            fastk                             lima-additional-guestagents       polaris                           tldx
bsc                               flip-link                         lzsa                              polypolish                        tmuxai
btcli                             flye                              mender-cli                        qnm                               toml-bombadil
chart-releaser                    foxglove-cli                      miniprot                          rasusa                            trimal
clang-include-graph               gcc@14                            mongo-c-driver@1                  readsb                            tsnet-serve
claude-squad                      gcli                              nelm                              reckoner                          urx
codex                             goshs                             nerdlog                           rna-star                          webdav
concurrentqueue                   guichan                           nova                              ropebwt3                          xgo
cookcli                           hellwal                           nx                                s6-rc                             xml2rfc
cornelis                          htmlhint                          oterm                             samply                            zsh-history-enquirer

You have 47 outdated formulae installed.

==> Tapping fairwindsops/tap
Cloning into '/home/linuxbrew/.linuxbrew/Homebrew/Library/Taps/fairwindsops/homebrew-tap'...
remote: Enumerating objects: 1381, done.
remote: Counting objects: 100% (96/96), done.
remote: Compressing objects: 100% (96/96), done.
remote: Total 1381 (delta 46), reused 0 (delta 0), pack-reused 1285 (from 2)
Receiving objects: 100% (1381/1381), 229.58 KiB | 1.12 MiB/s, done.
Resolving deltas: 100% (610/610), done.
Tapped 10 formulae (24 files, 367.8KB).
We can now use brew install fairwindsops/tap/nova to install
$ brew install fairwindsops/tap/nova
==> Fetching fairwindsops/tap/nova
==> Downloading https://github.com/FairwindsOps/nova/releases/download/v3.11.3/nova_3.11.3_linux_amd64.tar.gz
==> Downloading from https://objects.githubusercontent.com/github-production-release-asset-2e65be/265260634/dac2d566-4ba7-4ced-bede-bf019645ee99?X-Amz-Algorithm=AWS4-HMAC
################################################################################################################################################################### 100.0%
==> Installing nova from fairwindsops/tap
🍺  /home/linuxbrew/.linuxbrew/Cellar/nova/3.11.3: 7 files, 46.5MB, built in 2 seconds
==> Running `brew cleanup nova`...
Disable this behaviour by setting HOMEBREW_NO_INSTALL_CLEANUP.
Hide these hints with HOMEBREW_NO_ENV_HINTS (see `man brew`).
==> `brew cleanup` has not been run in the last 30 days, running now...
Disable this behaviour by setting HOMEBREW_NO_INSTALL_CLEANUP.
Hide these hints with HOMEBREW_NO_ENV_HINTS (see `man brew`).
Removing: /home/builder/.cache/Homebrew/bootsnap/639e12fc48ffa53195f5b0dab8c505b86837020cb2f99aa17238c8c72331f143... (623 files, 5.7MB)
Removing: /home/linuxbrew/.linuxbrew/lib/python3.12/site-packages/__pycache__/typing_extensions.cpython-312.pyc... (136.2KB)
Pruned 0 symbolic links and 11 directories from /home/linuxbrew/.linuxbrew
I can now run nova bare for usage
$ nova
Error, you must specify a sub-command.
A fairwinds tool to check for updated chart releases.

Usage:
  nova [flags]
  nova [command]

Available Commands:
  completion      Generate the autocompletion script for the specified shell
  find            Find out-of-date deployed releases.
  generate-config Generate a config file.
  help            Help about any command
  version         Prints the current version.

Flags:
      --alsologtostderr                   log to standard error as well as files (no effect when -logtostderr=true) (default true)
      --config string                     Config file to use. If empty, flags will be used instead
      --context string                    A context to use in the kubeconfig.
  -d, --desired-versions stringToString   A map of chart=override_version to override the helm repository when checking. (default [])
      --format string                     An output format (table, json) (default "json")
  -h, --help                              help for nova
  -a, --include-all                       Show all charts even if no latest version is found.
      --kubeconfig string                 A path to a kubeconfig file.
      --logtostderr                       log to standard error instead of files (default true)
  -n, --namespace string                  Namespace to look in. If empty, scan will be cluster-wide
      --output-file string                Path on local filesystem to write file output to
      --poll-artifacthub                  When true, polls artifacthub to match against helm releases in the cluster. If false, you must provide a url list via --url/-u. Default is true. (default true)
      --show-old                          Only show charts that are not on the latest version
  -u, --url strings                       URL for a helm chart repo
  -v, --v Level                           number for the log level verbosity
      --wide                              Output chart name and namespace

Use "nova [command] --help" for more information about a command.
By default the output is JSON so I’ll need to specify table
$ nova find --format table
Release Name                  Installed      Latest      Old      Deprecated
============                  =========      ======      ===      ==========
cert-manager                  v1.14.3        1.17.2      true     false
harbor-registry               1.14.0         1.17.1      true     false
matrix-synapse                3.8.2          3.12.2      true     false
adwerxawx                     3.4.3          3.4.3       false    false
actions-runner-controller     0.23.7         0.23.7      false    false
act-runner                    1.0.0          1.0.0       false    false
forgejo                       4.0.1          12.5.1      true     false
my-datadog-release            3.58.1         3.118.0     true     false
sonarqube                     10.5.0+2748    2025.3.0    true     false
bitwarden                     2024.4.0       2025.5.1    true     false
cryptpad                      0.0.19         2.3.0       true     false
backstage                     1.9.5          2.5.2       true     false
redis                         19.6.1         21.2.1      true     false
postgresql                    15.5.15        16.7.10     true     false
docmost                       0.1.0          0.3.1       true     false
my-opentelemetry-collector    0.101.2        0.126.0     true     false
myzipkin                      0.3.4          0.3.6       true     false
alloy                         0.6.0          1.1.1       true     false
my-release                    1.0.2          3.0.11      true     false
my-yourls                     6.1.14         8.2.5       true     false
yourls                        6.1.14         8.2.5       true     false
onedev                        11.5.3         11.9.0      true     false
valkey-rel                    2.0.2          3.0.11      true     false
my-release                    3.15.0         0.3.2       false    false
kimai                         4.3.1          4.3.5       true     false
mydbrelease                   0.1.21292      0.1.3       false    false
postgres                      16.6.0         16.7.10     true     false
coder-db                      16.4.5         16.7.10     true     false
coder                         2.21.0         2.23.0      true     false
my-nc-release                 6.6.10         6.6.10      false    false
myfider                       0.0.6          0.1.0       true     false
vpa                           4.7.2          4.7.2       false    false
goldilocks                    9.0.2          9.0.2       false    false


Want more? Automate Nova for free with Fairwinds Insights!
🚀 https://fairwinds.com/insights-signup/nova 🚀
I later ran this on a fresh cluster and still found issues
$ nova find --format table
Release Name      Installed    Latest    Old     Deprecated
============      =========    ======    ===     ==========
grafana           9.0.0        9.2.7     true    false
insights-agent    4.6.3        4.6.6     true    false


Want more? Automate Nova for free with Fairwinds Insights!
🚀 https://fairwinds.com/insights-signup/nova 🚀
Or just looking at container images
$ nova find --containers --format table
Container Name                   Current Version    Old     Latest    Latest Minor     Latest Patch
==============                   ===============    ===     ======    =============    =============
docker.io/grafana/grafana        12.0.0             true    12.0.2    12.0.2           12.0.2
quay.io/prometheus/prometheus    v3.2.1             true    v3.4.1    v3.4.1           v3.2.1


Want more? Automate Nova for free with Fairwinds Insights!
🚀 https://fairwinds.com/insights-signup/nova 🚀
Bash completion
We can put in auto-complete to our shell
builder@LuiGi:~/Workspaces/jekyll-blog$ nova completion bash >> ~/.bashrc

Want more? Automate Nova for free with Fairwinds Insights!
🚀 https://fairwinds.com/insights-signup/nova 🚀
builder@LuiGi:~/Workspaces/jekyll-blog$ source ~/.bashrc
builder@LuiGi:~/Workspaces/jekyll-blog$ nova
completion       (Generate the autocompletion script for the specified shell)
find             (Find out-of-date deployed releases.)
generate-config  (Generate a config file.)
help             (Help about any command)
version          (Prints the current version.)
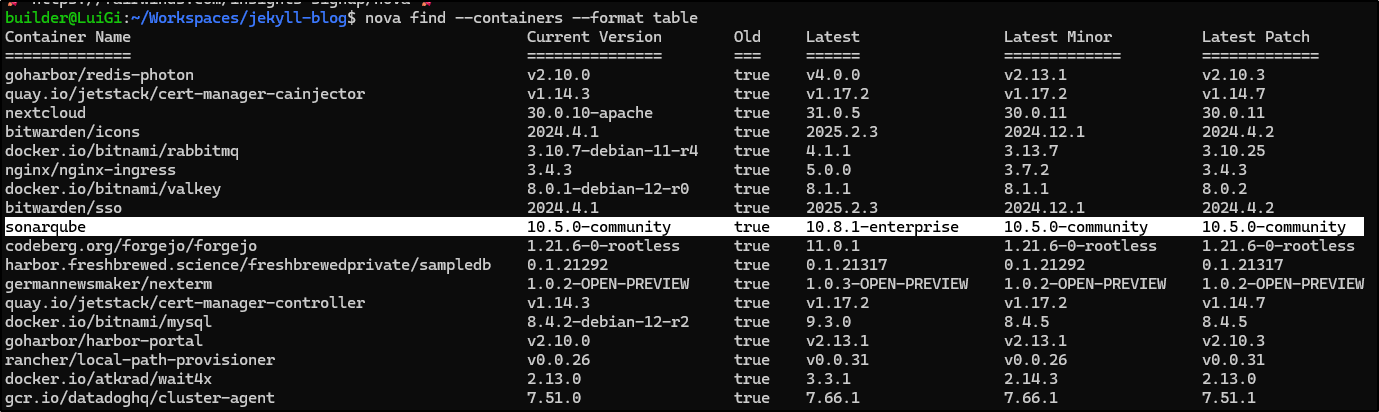
If we use nova find --containers --format table we can get a list of all our containers that are out of date
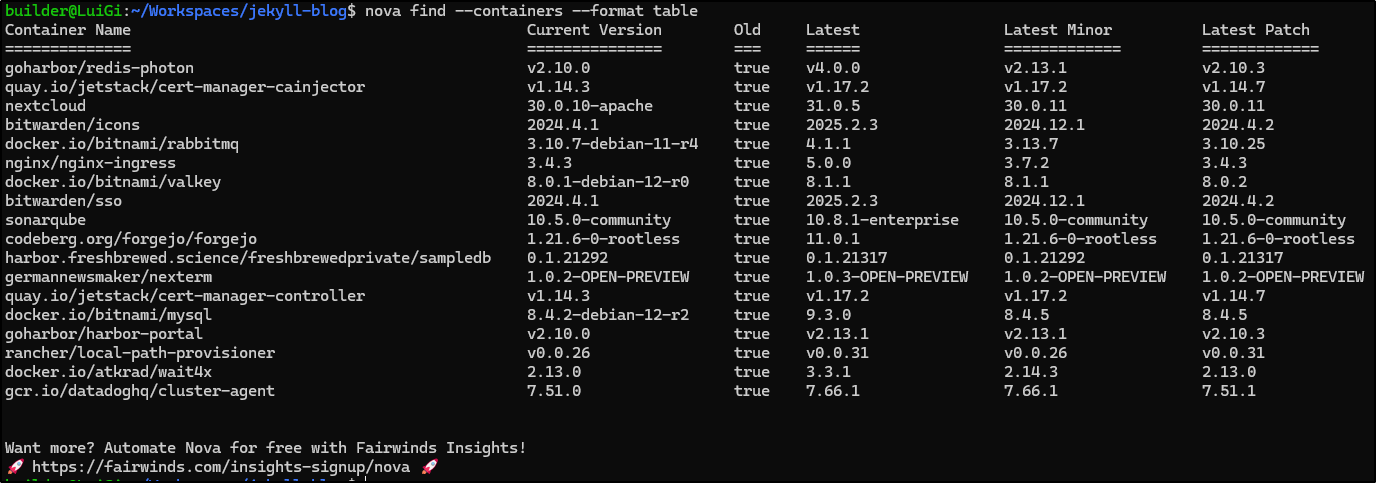
It’s important to review the details. For instance, as you see below, it noted a newer version of Sonarqube but it was the Enterprise edition and not Community
We could use JQ to find a specific version
$ nova find --containers --format json 2>/dev/null | head -n1 | jq -r '.container_images[] | select(.name=="idjohnson/kasarest") | .latest_v
ersion'
1.1.5
Pluto
While Nova is for out of date Helm and Containers, Pluto is for out of date kubernetes APIs
It’s easy enough to install with brew
$ brew install pluto
==> Auto-updating Homebrew...
Adjust how often this is run with HOMEBREW_AUTO_UPDATE_SECS or disable with
HOMEBREW_NO_AUTO_UPDATE. Hide these hints with HOMEBREW_NO_ENV_HINTS (see `man brew`).
==> Auto-updated Homebrew!
Updated 2 taps (homebrew/core and homebrew/cask).
==> New Formulae
abpoa                               dvisvgm                             osx-trash                           pulumictl                           stringtie

You have 47 outdated formulae installed.

==> Downloading https://ghcr.io/v2/homebrew/core/pluto/manifests/5.21.7
########################################################################################################################################################################### 100.0%
==> Fetching pluto
==> Downloading https://ghcr.io/v2/homebrew/core/pluto/blobs/sha256:e9d55ff469acda549be1d1d50d8156ac1925a632406bea21235a61a10a17bd6f
########################################################################################################################################################################### 100.0%
==> Pouring pluto--5.21.7.x86_64_linux.bottle.tar.gz
🍺  /home/linuxbrew/.linuxbrew/Cellar/pluto/5.21.7: 9 files, 47.4MB
==> Running `brew cleanup pluto`...
Disable this behaviour by setting HOMEBREW_NO_INSTALL_CLEANUP.
Hide these hints with HOMEBREW_NO_ENV_HINTS (see `man brew`).
==> Caveats
Bash completion has been installed to:
  /home/linuxbrew/.linuxbrew/etc/bash_completion.d
I can run pluto to find any active resources with deprecated APIs
$ pluto detect-api-resources
I0609 17:27:40.301161   50951 warnings.go:110] "Warning: v1 ComponentStatus is deprecated in v1.19+"
There were no resources found with known deprecated apiVersions.


Want more? Automate Pluto for free with Fairwinds Insights!
 🚀 https://fairwinds.com/insights-signup/pluto 🚀

$ pluto detect-all-in-cluster
I0609 17:29:12.363812   51569 warnings.go:110] "Warning: v1 ComponentStatus is deprecated in v1.19+"
There were no resources found with known deprecated apiVersions.


Want more? Automate Pluto for free with Fairwinds Insights!
 🚀 https://fairwinds.com/insights-signup/pluto 🚀
I can also check a manifest for out of date APIs as well
$ pluto detect deployment/k8s-deployment-int.yaml
There were no resources found with known deprecated apiVersions.
Polaris
Let’s install with helm
$ helm repo add fairwinds-stable https://charts.fairwinds.com/stable
Now we can install it
$ helm upgrade --install polaris fairwinds-stable/polaris --namespace polaris --create-namespace
Release "polaris" does not exist. Installing it now.
NAME: polaris
LAST DEPLOYED: Mon Jun  9 17:36:54 2025
NAMESPACE: polaris
STATUS: deployed
REVISION: 1
TEST SUITE: None
NOTES:
** Please be patient while the chart is being deployed **

Enjoy Polaris and smooth sailing!
To view the dashboard execute this command:

kubectl port-forward --namespace polaris svc/polaris-dashboard 8080:80

Then open http://localhost:8080 in your browser.
Let’s port-forward the service
$ kubectl port-forward --namespace polaris svc/polaris-dashboard 8080:80
error: unable to forward port because pod is not running. Current status=Pending
$ kubectl port-forward --namespace polaris svc/polaris-dashboard 8080:80
Forwarding from 127.0.0.1:8080 -> 8080
Forwarding from [::1]:8080 -> 8080
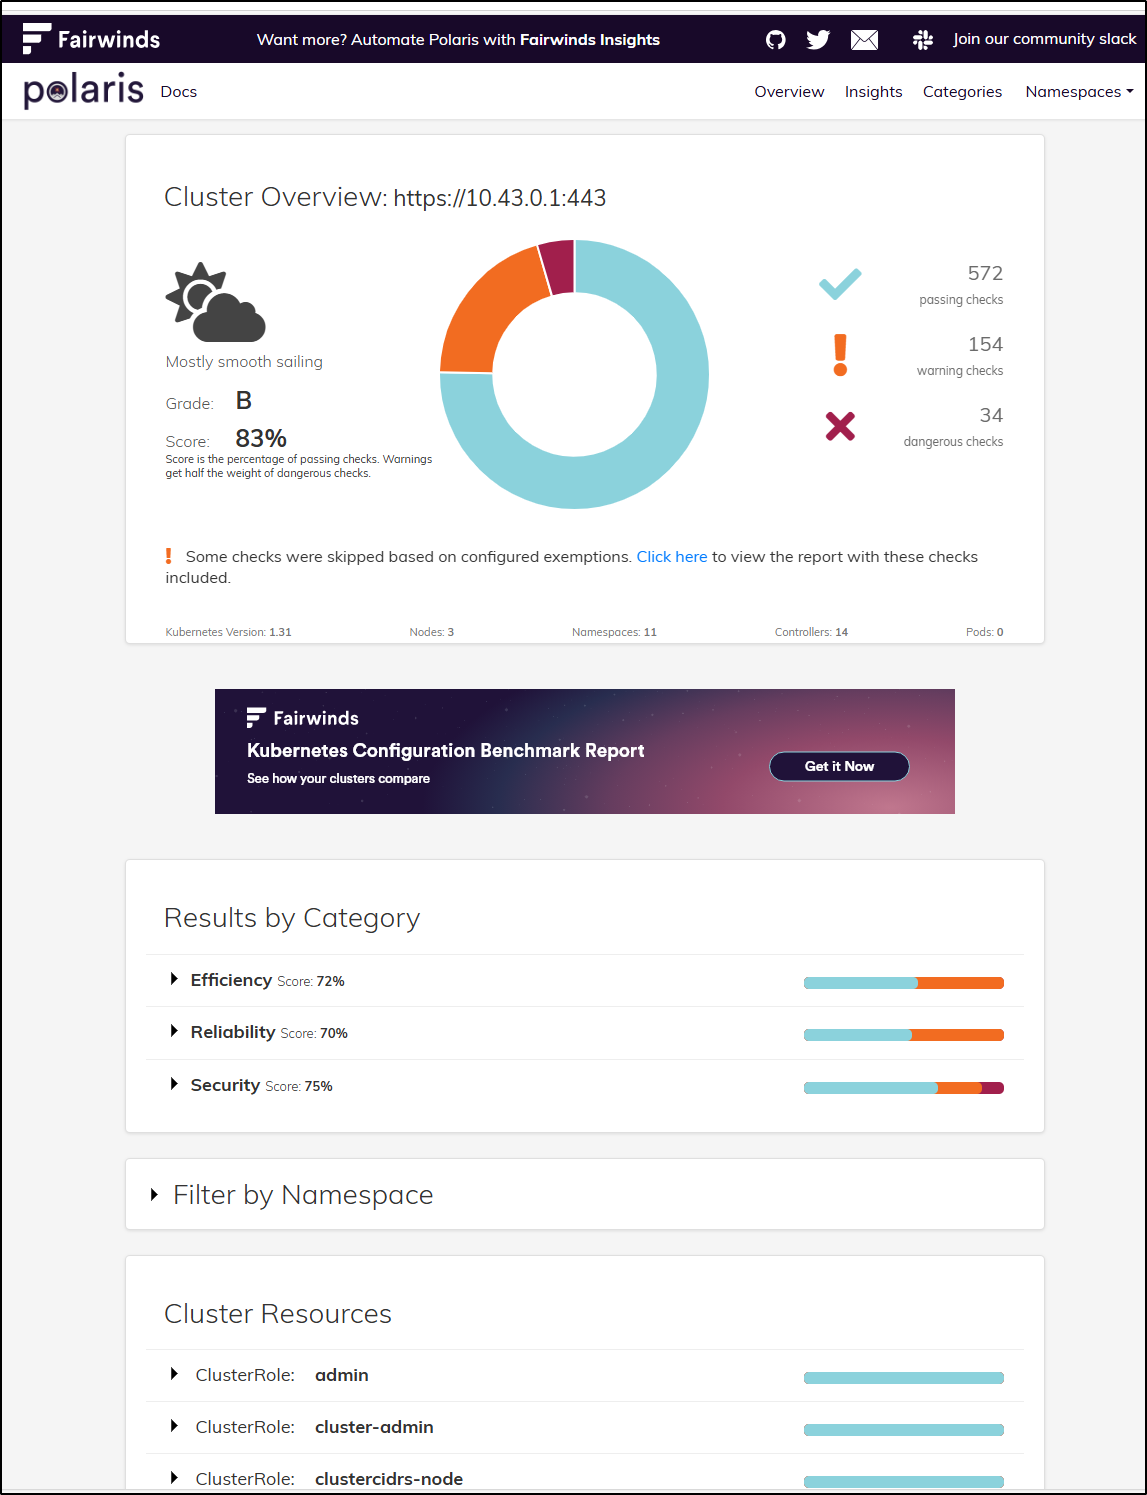
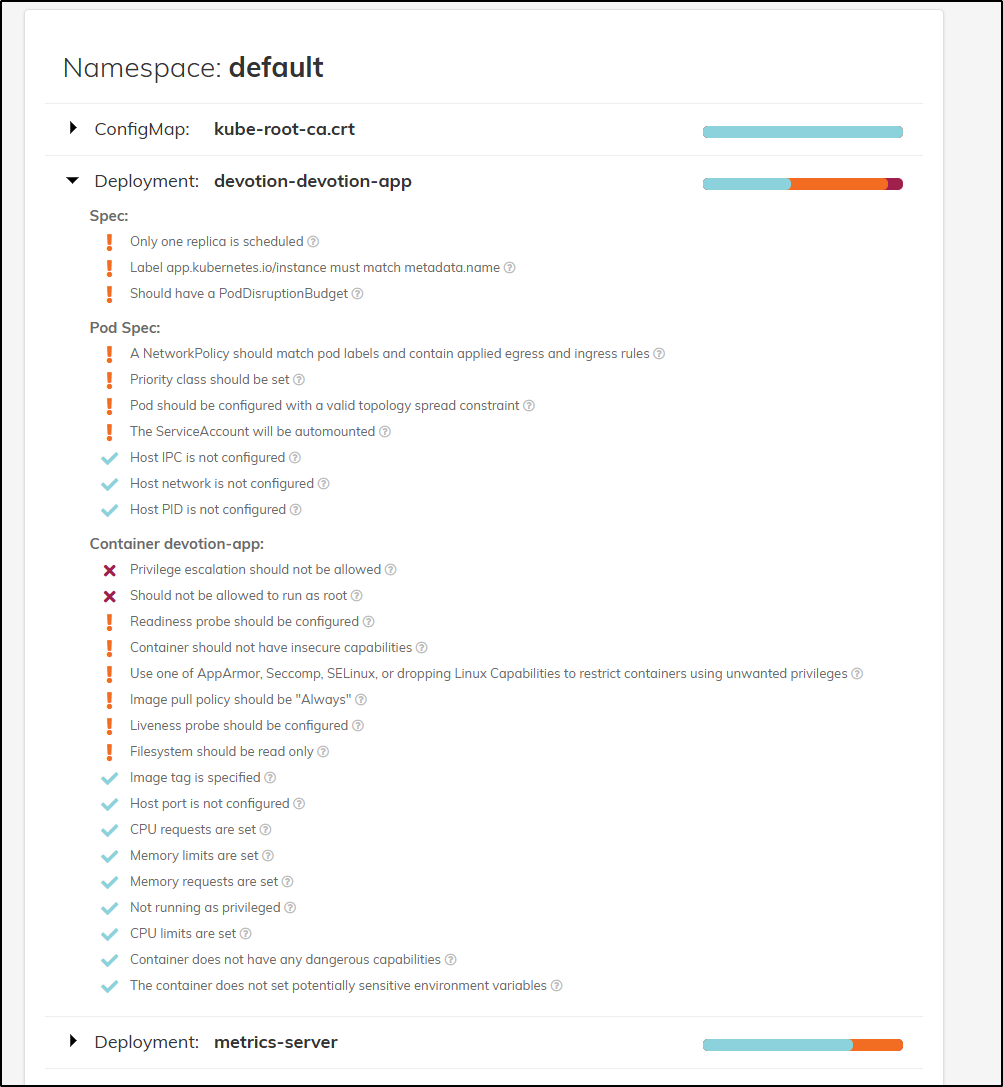
We can drill down to the areas of concern
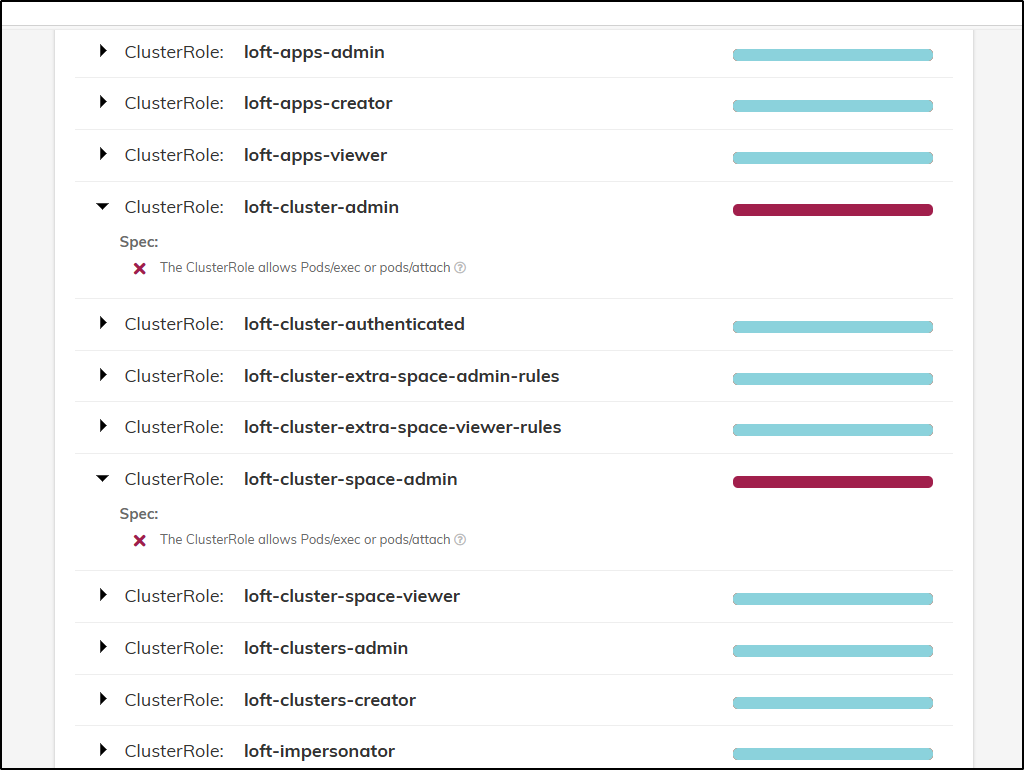
Some of my self-hosted apps need some work
If we wish to block workloads with an admission controller, we can switch from a reporter to an admission controller
--set webhook.enable=true --set dashboard.enable=false
I was going to do this in my test cluster but found the lack of a cert-manager stopped the upgrade
$ helm upgrade –install polaris fairwinds-stable/polaris –namespace demo –create-namespace –set webhook.enable=true –set dashboard.enable=false Release “polaris” does not exist. Installing it now. Error: unable to build kubernetes objects from release manifest: [resource mapping not found for name: “polaris-cert” namespace: “” from “”: no matches for kind “Certificate” in version “cert-manager.io/v1alpha1” ensure CRDs are installed first, resource mapping not found for name: “polaris-selfsigned” namespace: “” from “”: no matches for kind “Issuer” in version “cert-manager.io/v1alpha1” ensure CRDs are installed first]
But I can change it back
$ helm upgrade --install polaris fairwinds-stable/polaris --namespace polaris --create-namespace --set webhook.enable=false --set dashboard
.enable=true
Release "polaris" has been upgraded. Happy Helming!
NAME: polaris
LAST DEPLOYED: Mon Jun  9 17:55:55 2025
NAMESPACE: polaris
STATUS: deployed
REVISION: 2
TEST SUITE: None
NOTES:
** Please be patient while the chart is being deployed **

Enjoy Polaris and smooth sailing!
To view the dashboard execute this command:

kubectl port-forward --namespace polaris svc/polaris-dashboard 8080:80

Then open http://localhost:8080 in your browser.
Insights
It is worth pointing out that Polaris is the basis for Fairwinds Insights which takes the scans from Polaris and turns them into actionable insights. THe idea is we can use these for FinOps, policy enforcement and even some automated ticketing.
I’m not a pitch-man for Fairwinds. So I don’t want to lead into a sell (not what I do). But I do think it’s worth pointing out that they intend for you to use Polaris to get an idea of what can be seen and then, if you really like it, consider buying Insights for your production clusters.
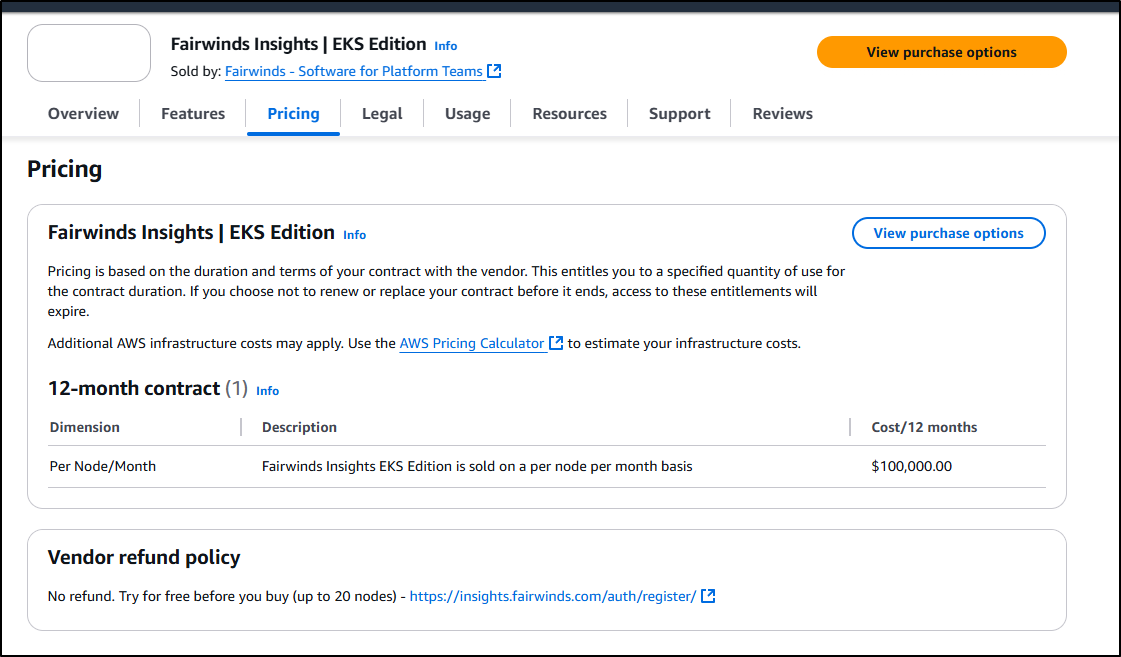
But here we come back to a bit of my rant time on pricing. Their pricing page shows it’s one of those “let us talk to you” models with opaque pricing.
We can get some hints though. If bought via AWS marketplace for EKS, it’s US$100,000 per node per year
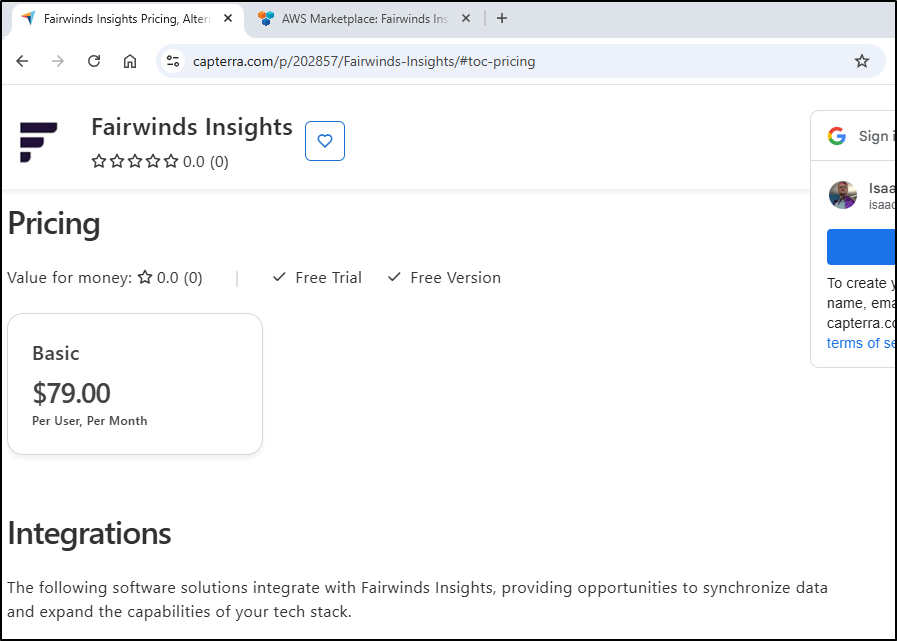
And an older Capterra page suggested US$79/user/mo
However, I saw that AWS Marketplace link had a try before you buy link
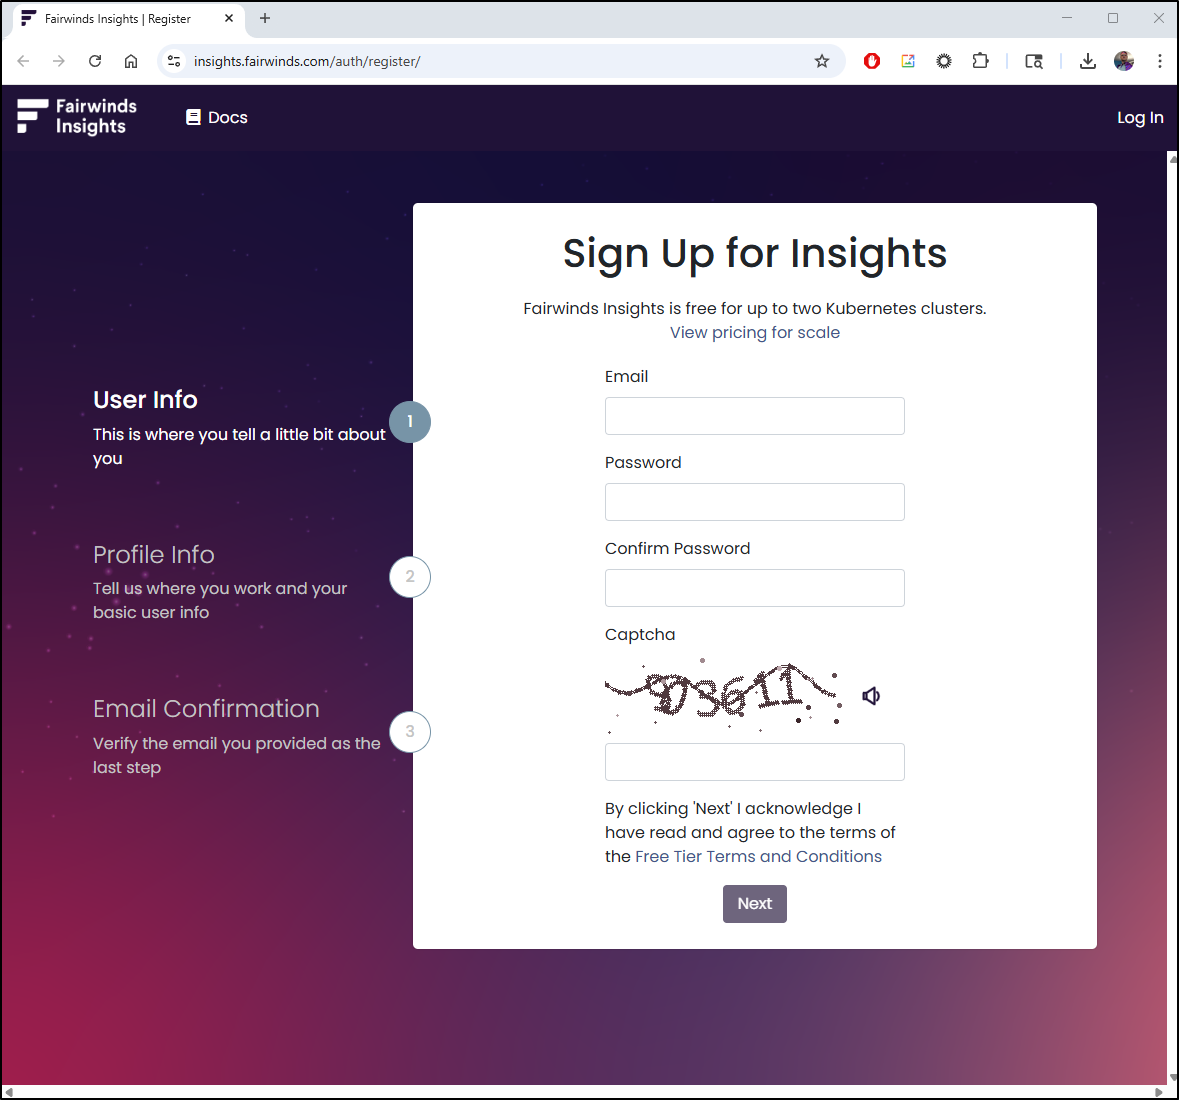
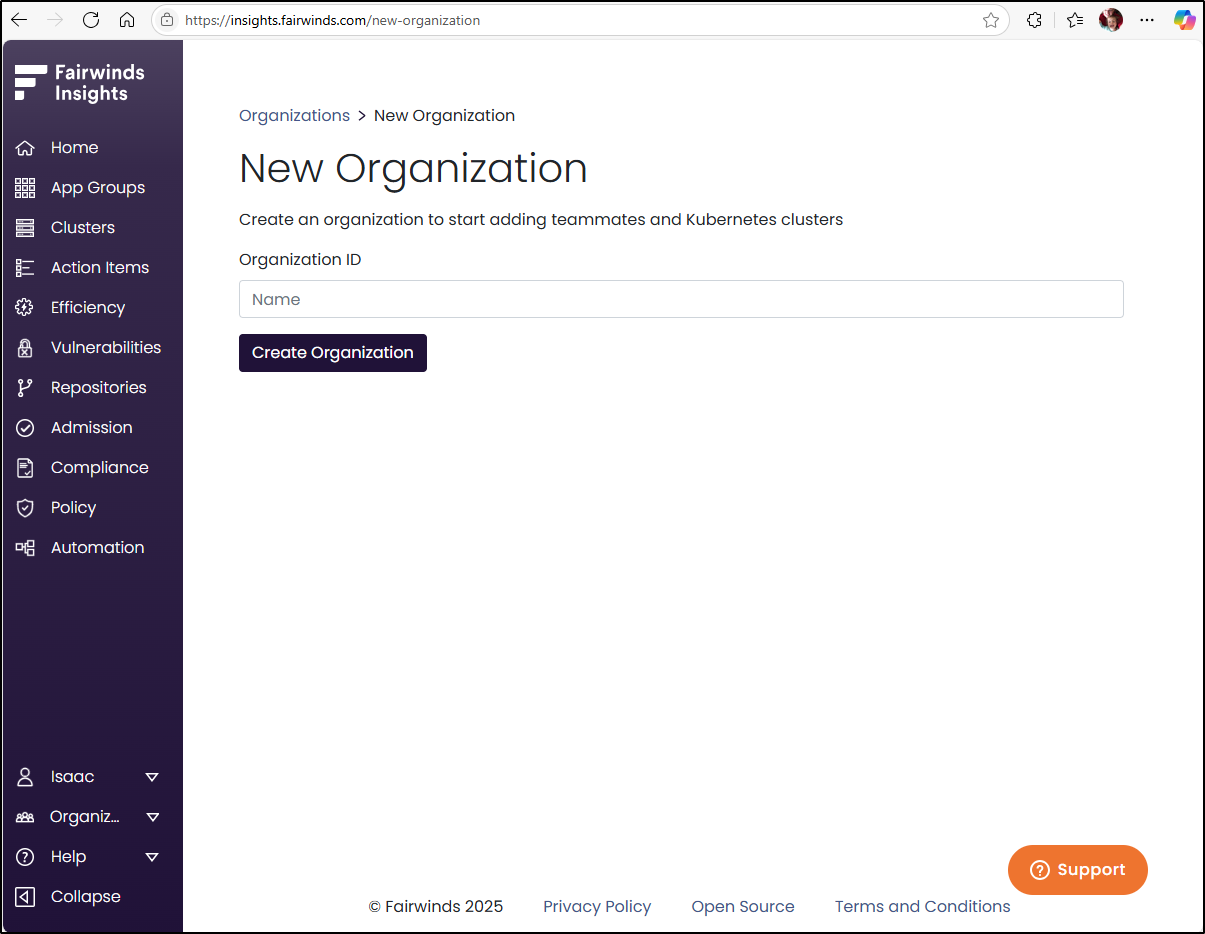
I signed up and now my first step is to create an Organization
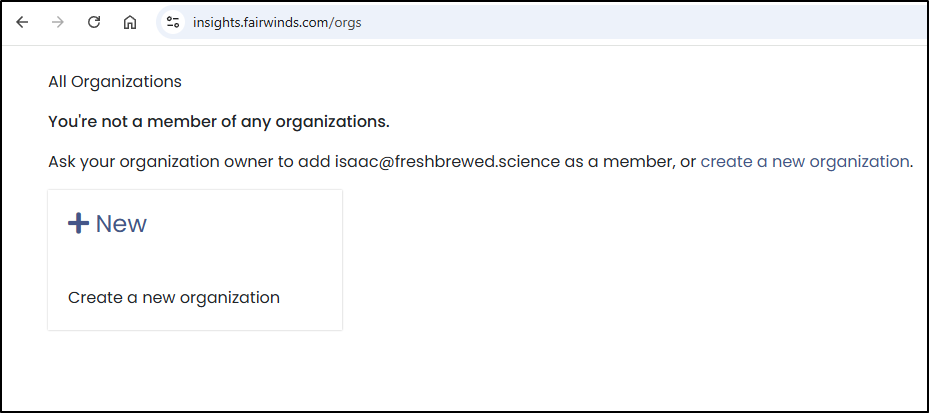
Which dropped me into an odd landing page, but I think I can create clusters from here
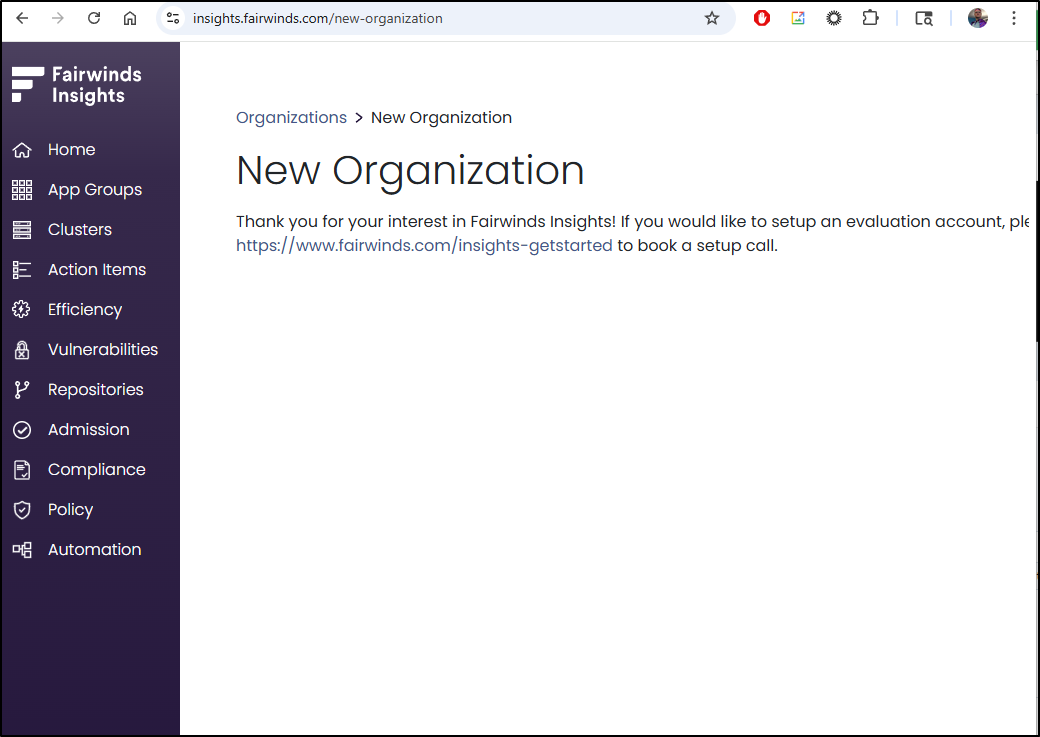
This is broken. I can’t go to any of those links because they just redirect back to “insights-getstarted” which is prompting me for another form
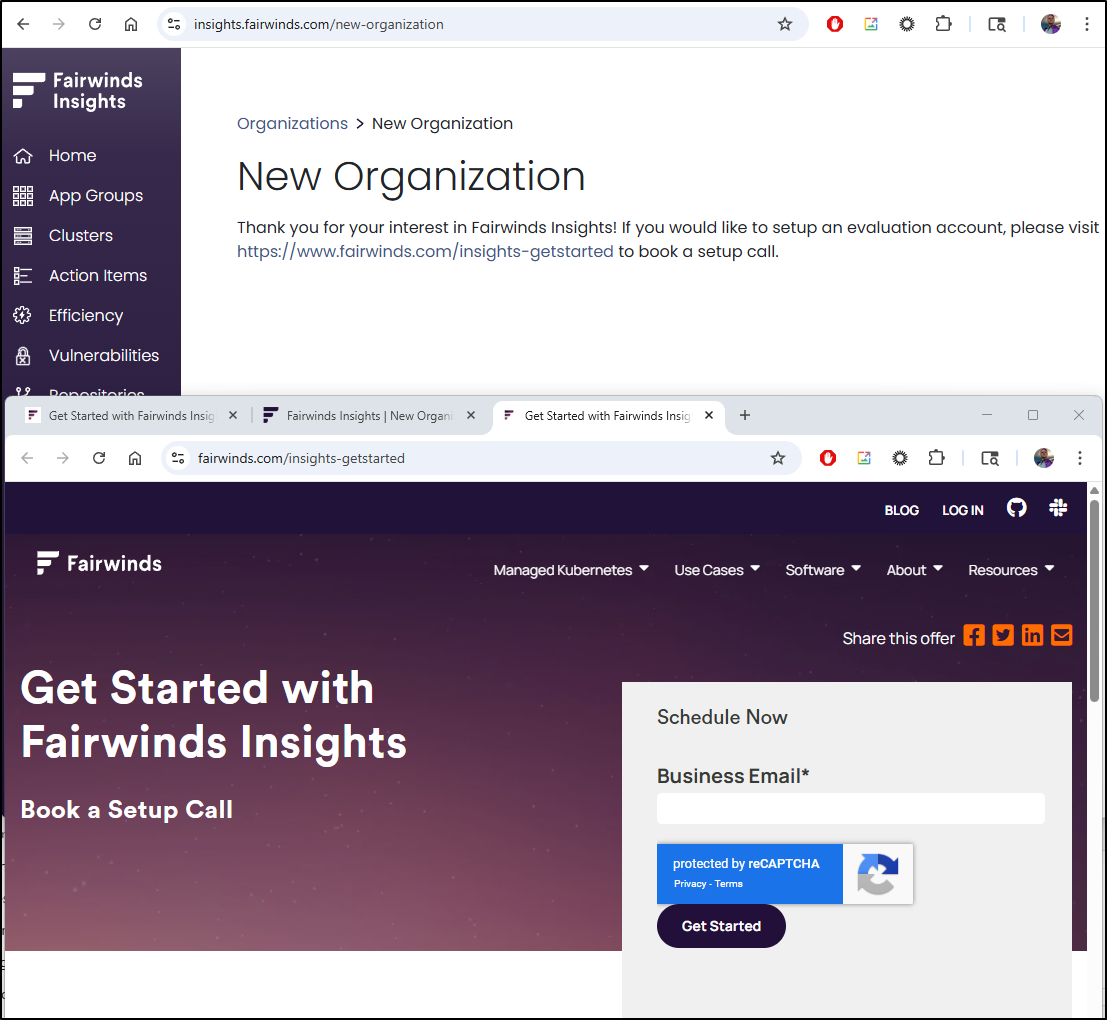
That forces me into a 30m meet and greet. I have time, but this is annoying.
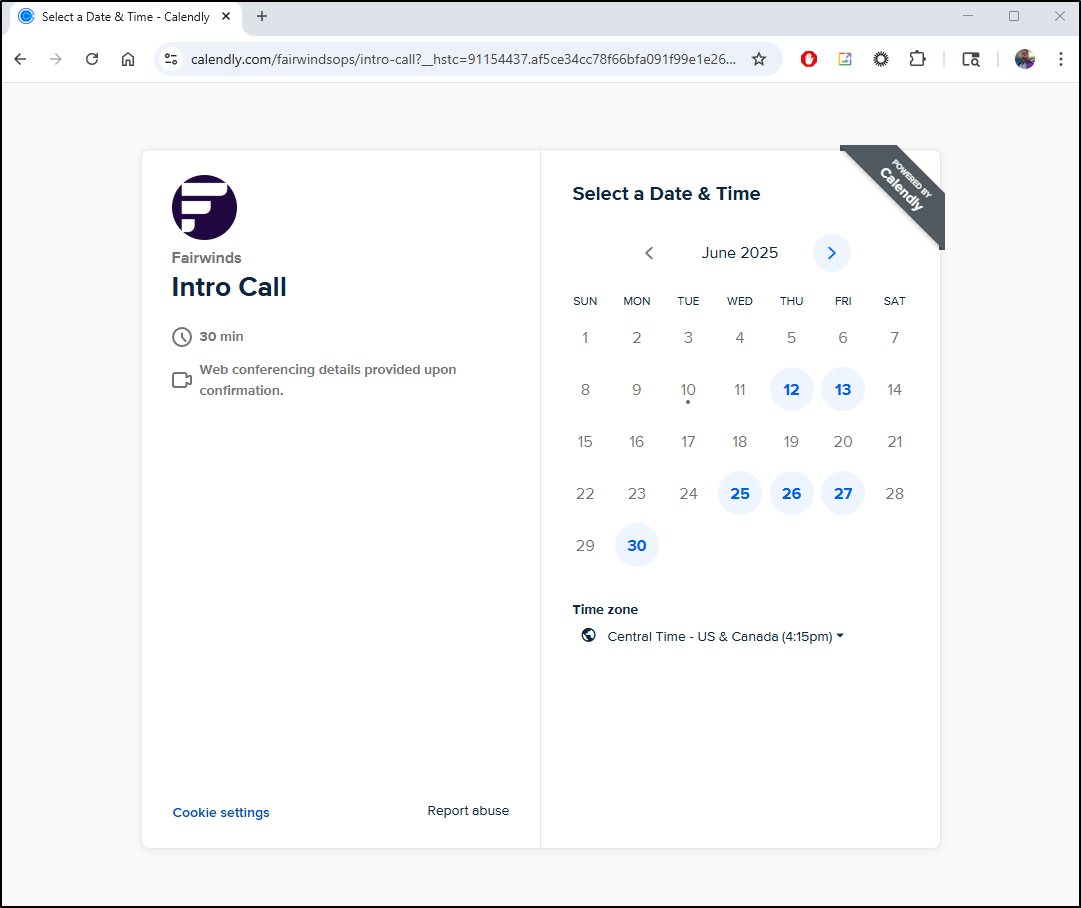
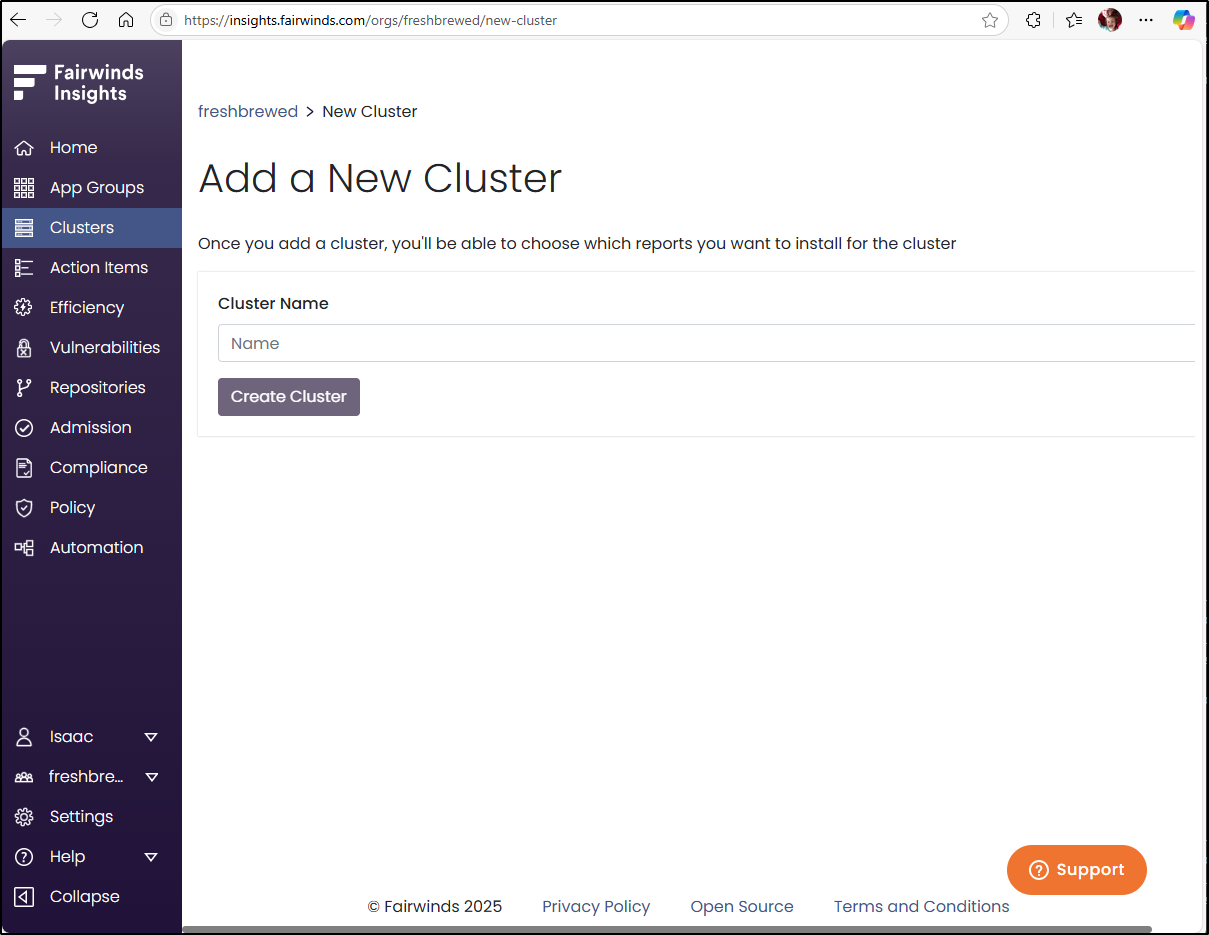
Once I had a good conversation, I was able to create an organization
Then add a cluster
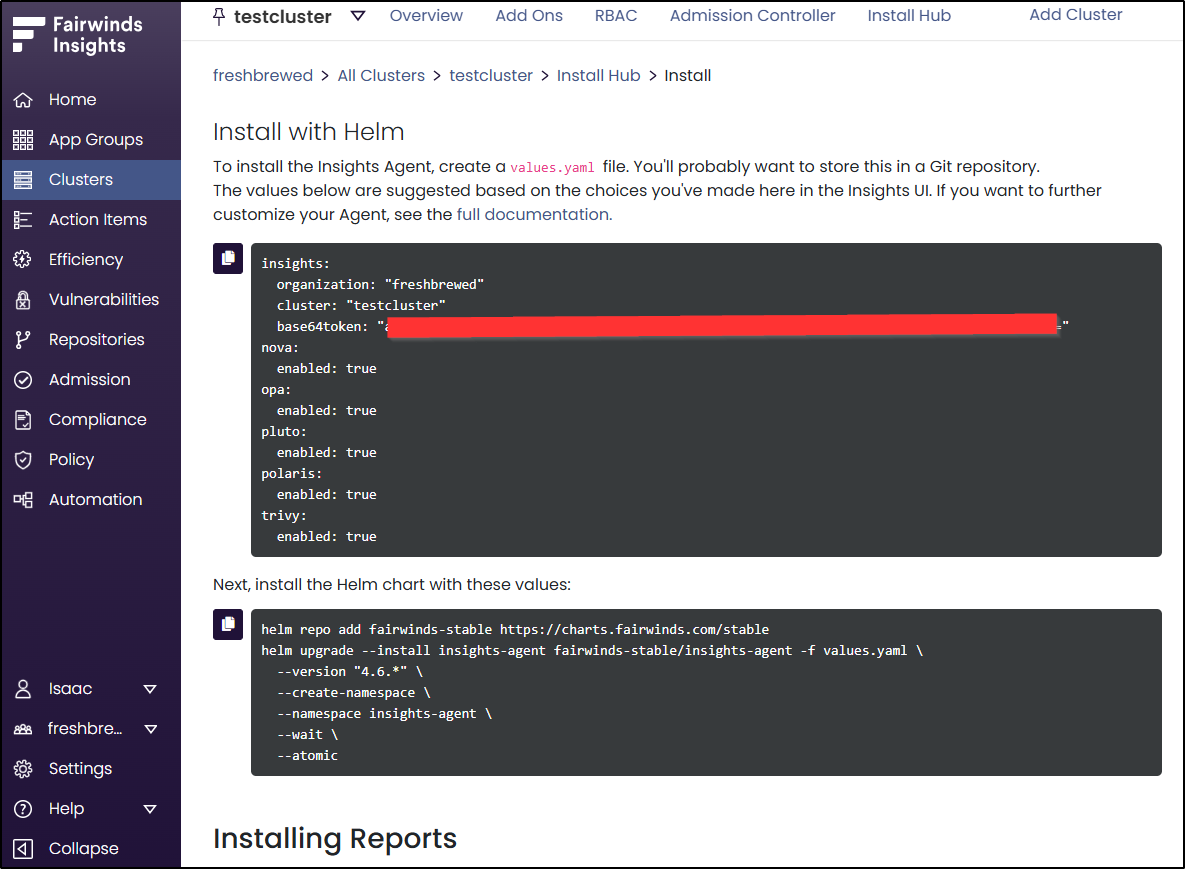
I can then install with helm
My cluster was in a pretty unhealthy state, so I took a moment to upgrade it so it was running clean
$ kubectl get nodes
NAME                  STATUS   ROLES                  AGE   VERSION
builder-macbookpro2   Ready    <none>                 20m   v1.31.9+k3s1
isaac-macbookair      Ready    control-plane,master   21m   v1.31.9+k3s1
isaac-macbookpro      Ready    <none>                 20m   v1.31.9+k3s1
I can now deploy the Fairwinds chart
builder@LuiGi:~/Workspaces/fairwinds$ vi values.yaml
builder@LuiGi:~/Workspaces/fairwinds$ helm repo add fairwinds-stable https://charts.fairwinds.com/stable
"fairwinds-stable" already exists with the same configuration, skipping
builder@LuiGi:~/Workspaces/fairwinds$ helm upgrade --install insights-agent fairwinds-stable/insights-agent -f values.yaml \
  --version "4.6.*" \
  --create-namespace \
  --namespace insights-agent \
  --wait \
  --atomic
Release "insights-agent" does not exist. Installing it now.
NAME: insights-agent
LAST DEPLOYED: Tue Jun 24 08:30:49 2025
NAMESPACE: insights-agent
STATUS: deployed
REVISION: 1
Repository Scans
In setting up connections, I was a bit worried what “write” access would entail so I granted FW just access to some of my Github repos
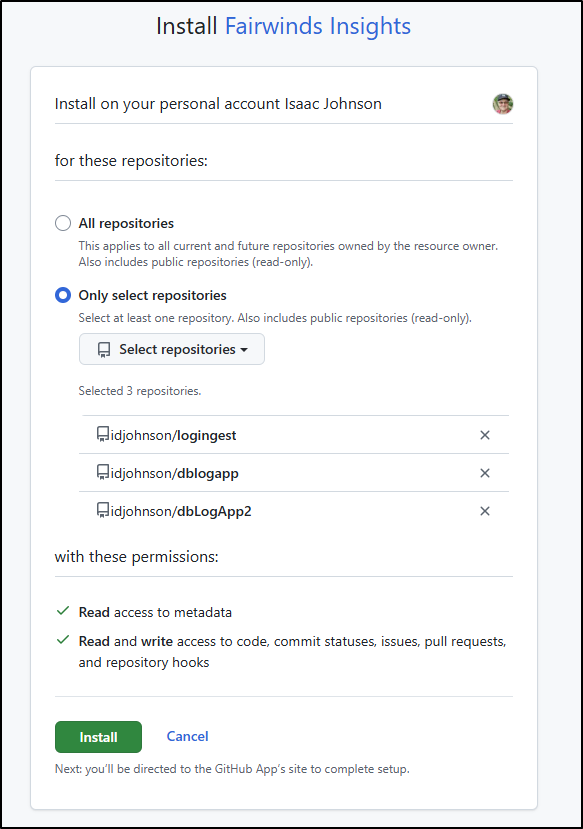
Which I guess is good as three is my limit for scans
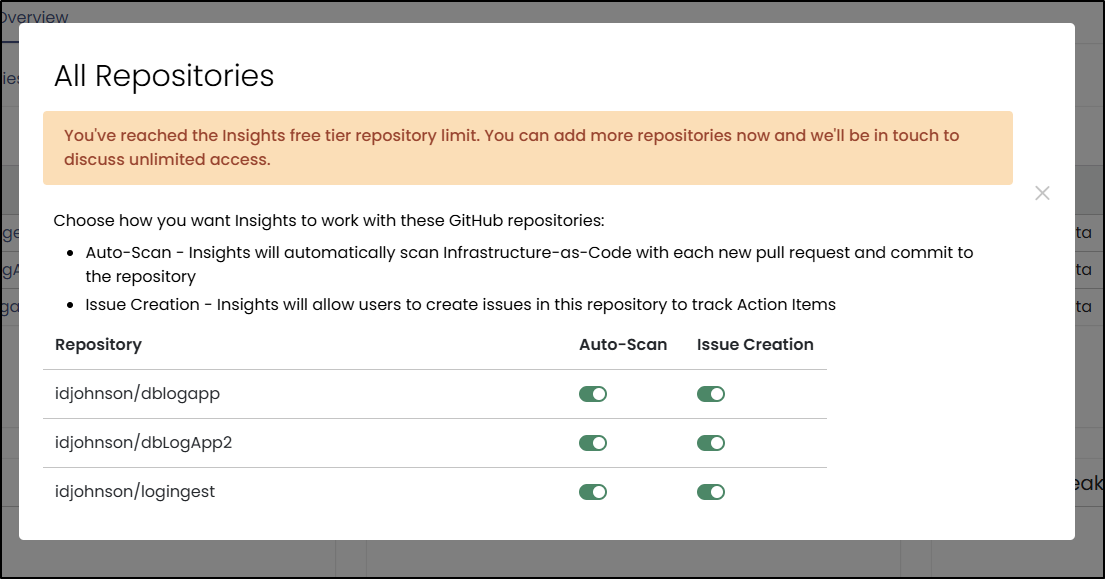
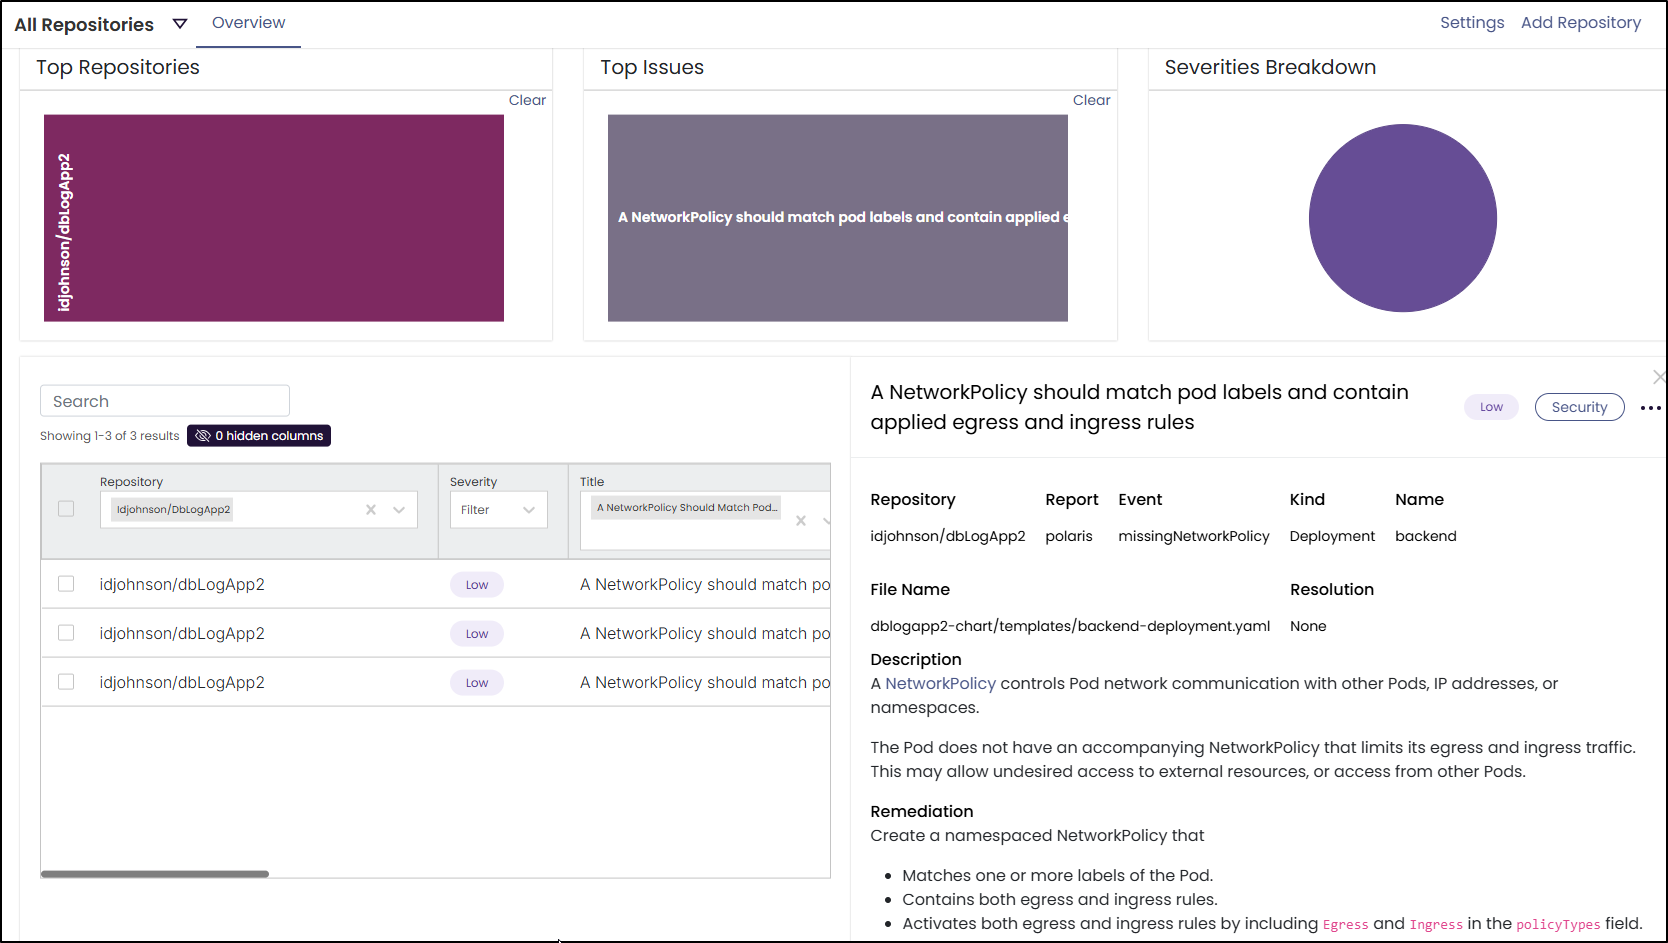
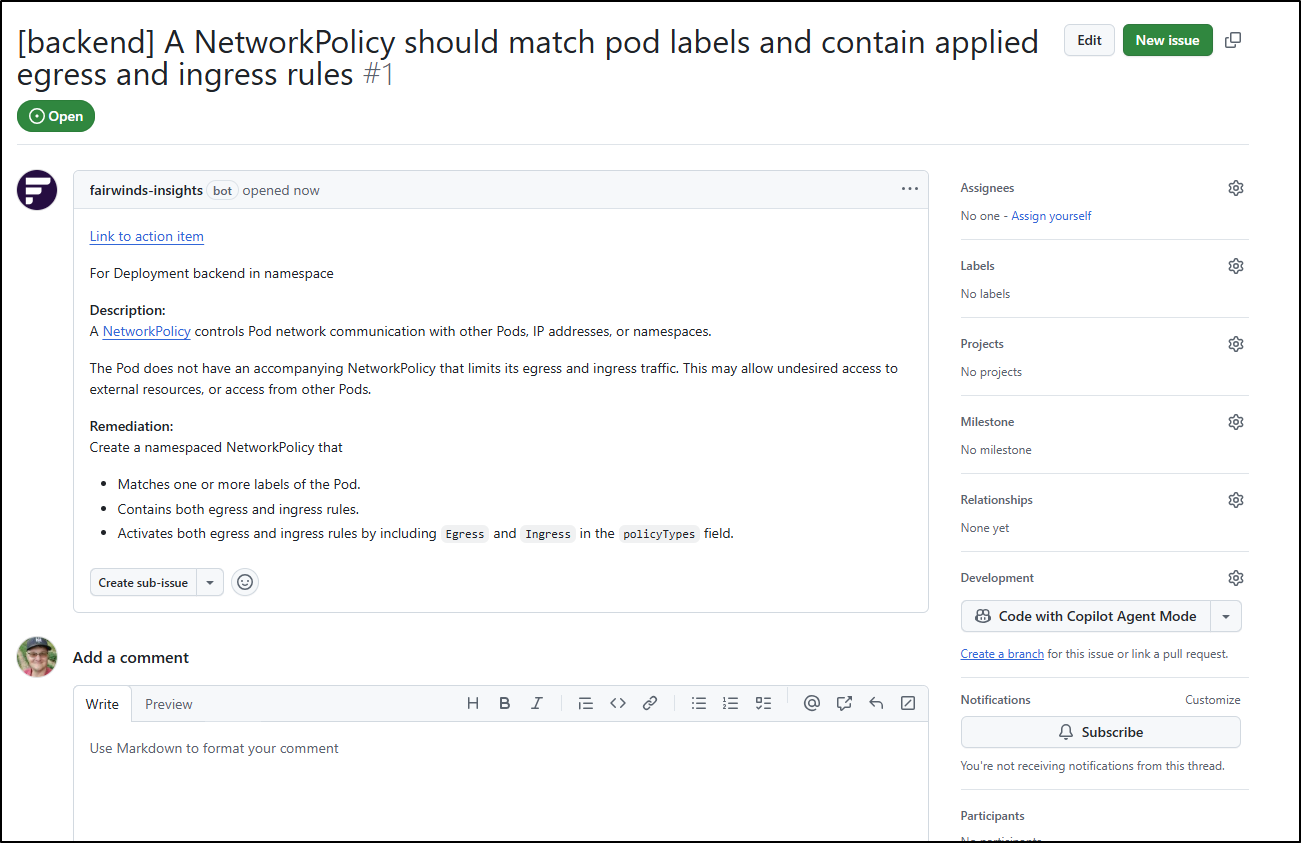
It identified some absent policies in my deployments, specifically NetworkPolicies
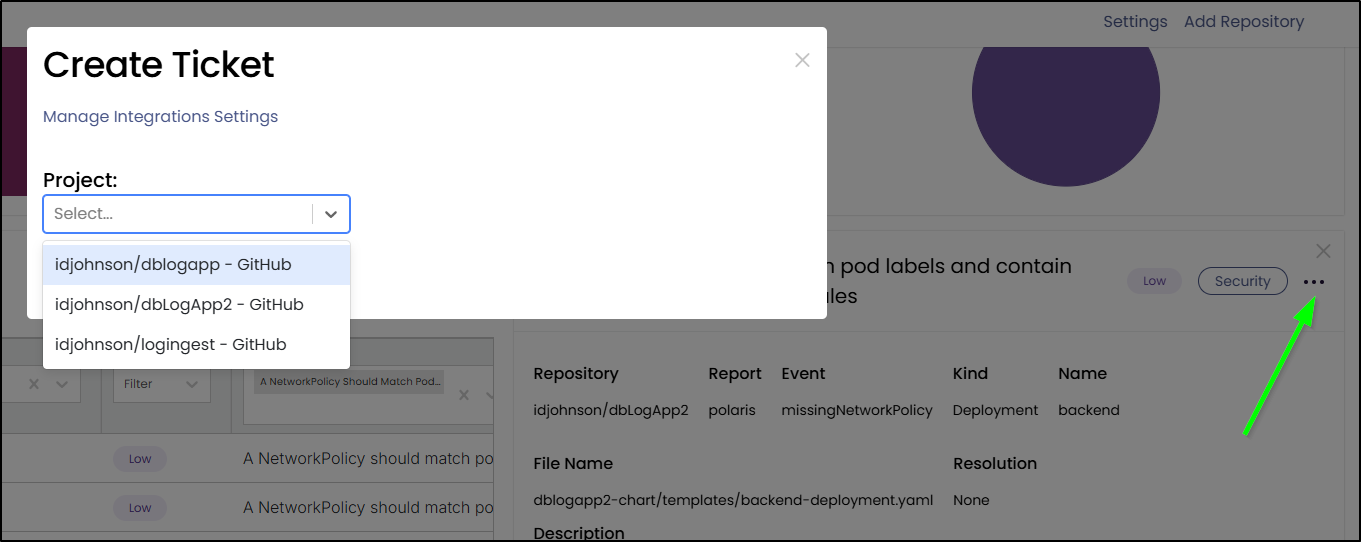
From the ellipse menu, we can “Create a ticket” and pick a project
I can add optional fields. In my case, I added an “area” field
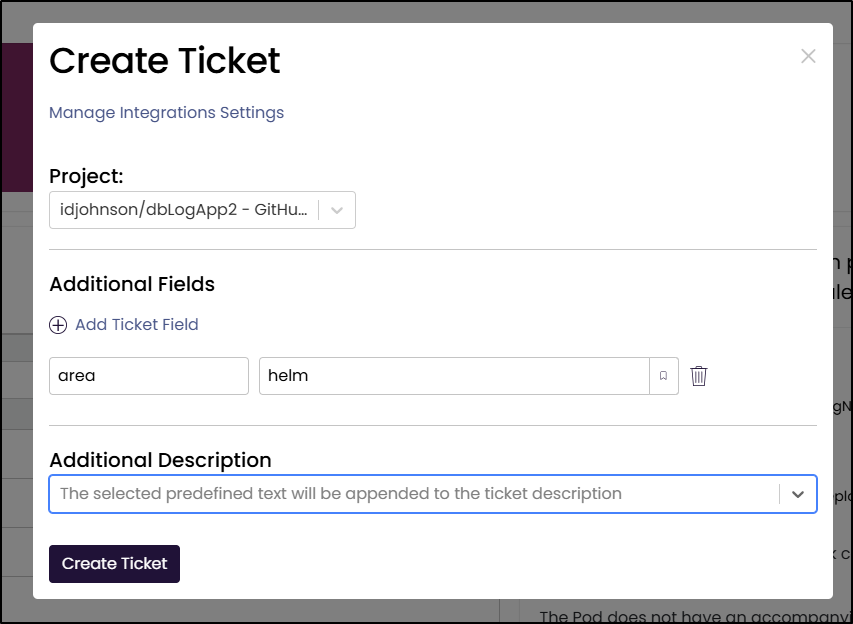
I now have a new issue that can track that as an item to address
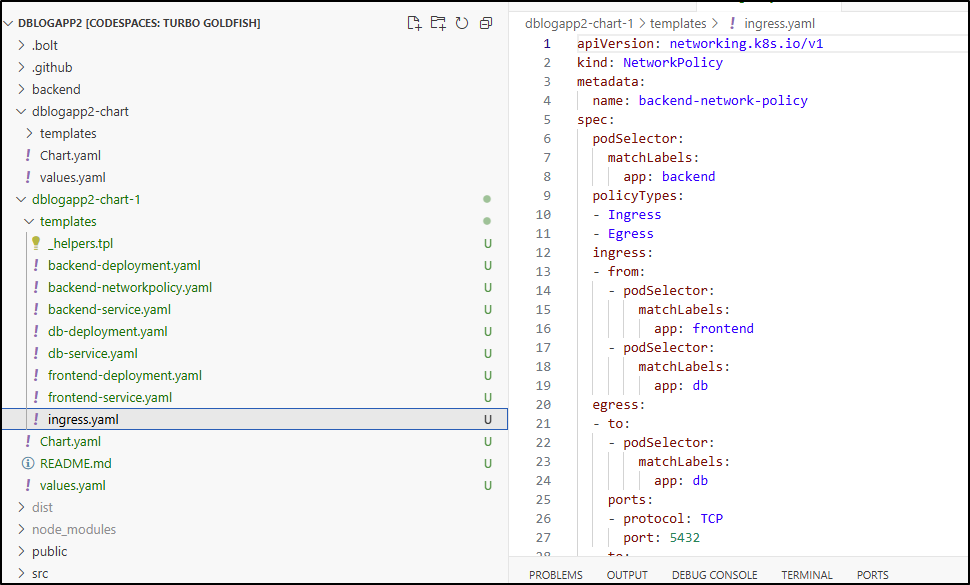
I fed the ask into Copilot which went and made a new chart altogether
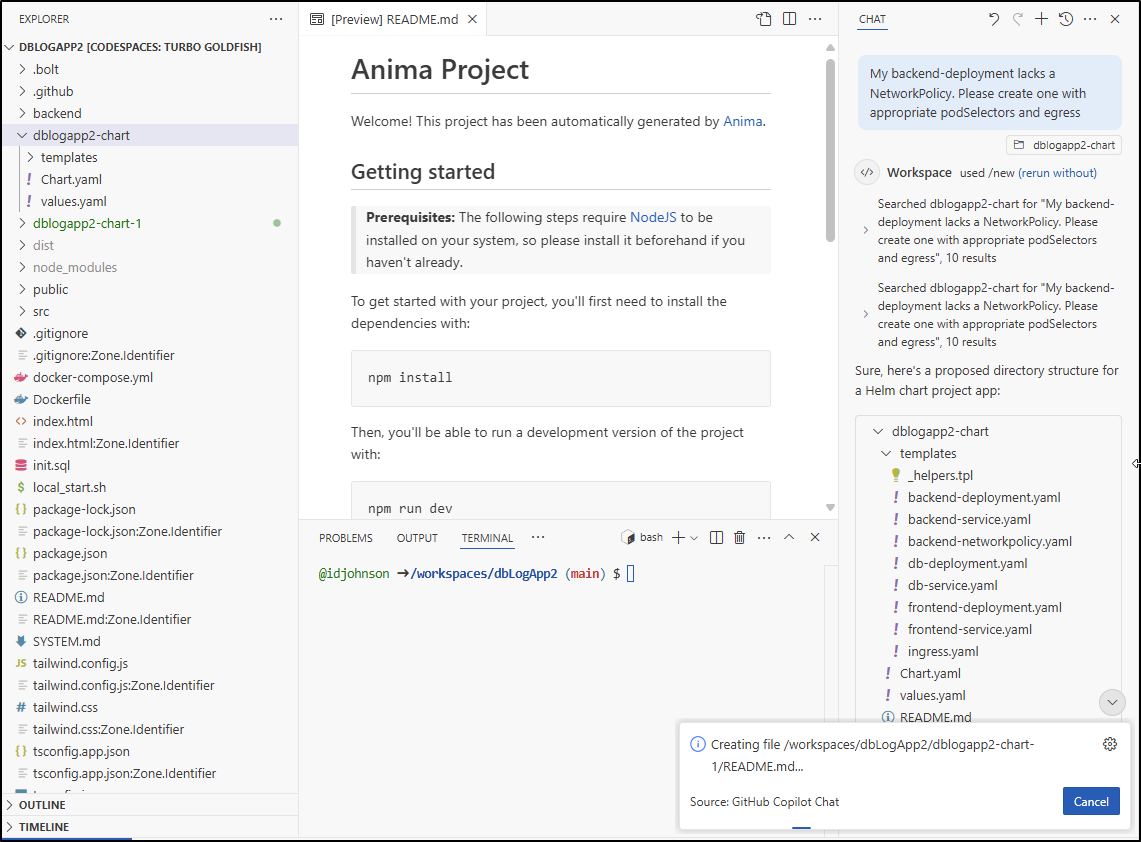
I sort of worked, but made a mess of the yamls and put NetworkPolicies in all the manifests
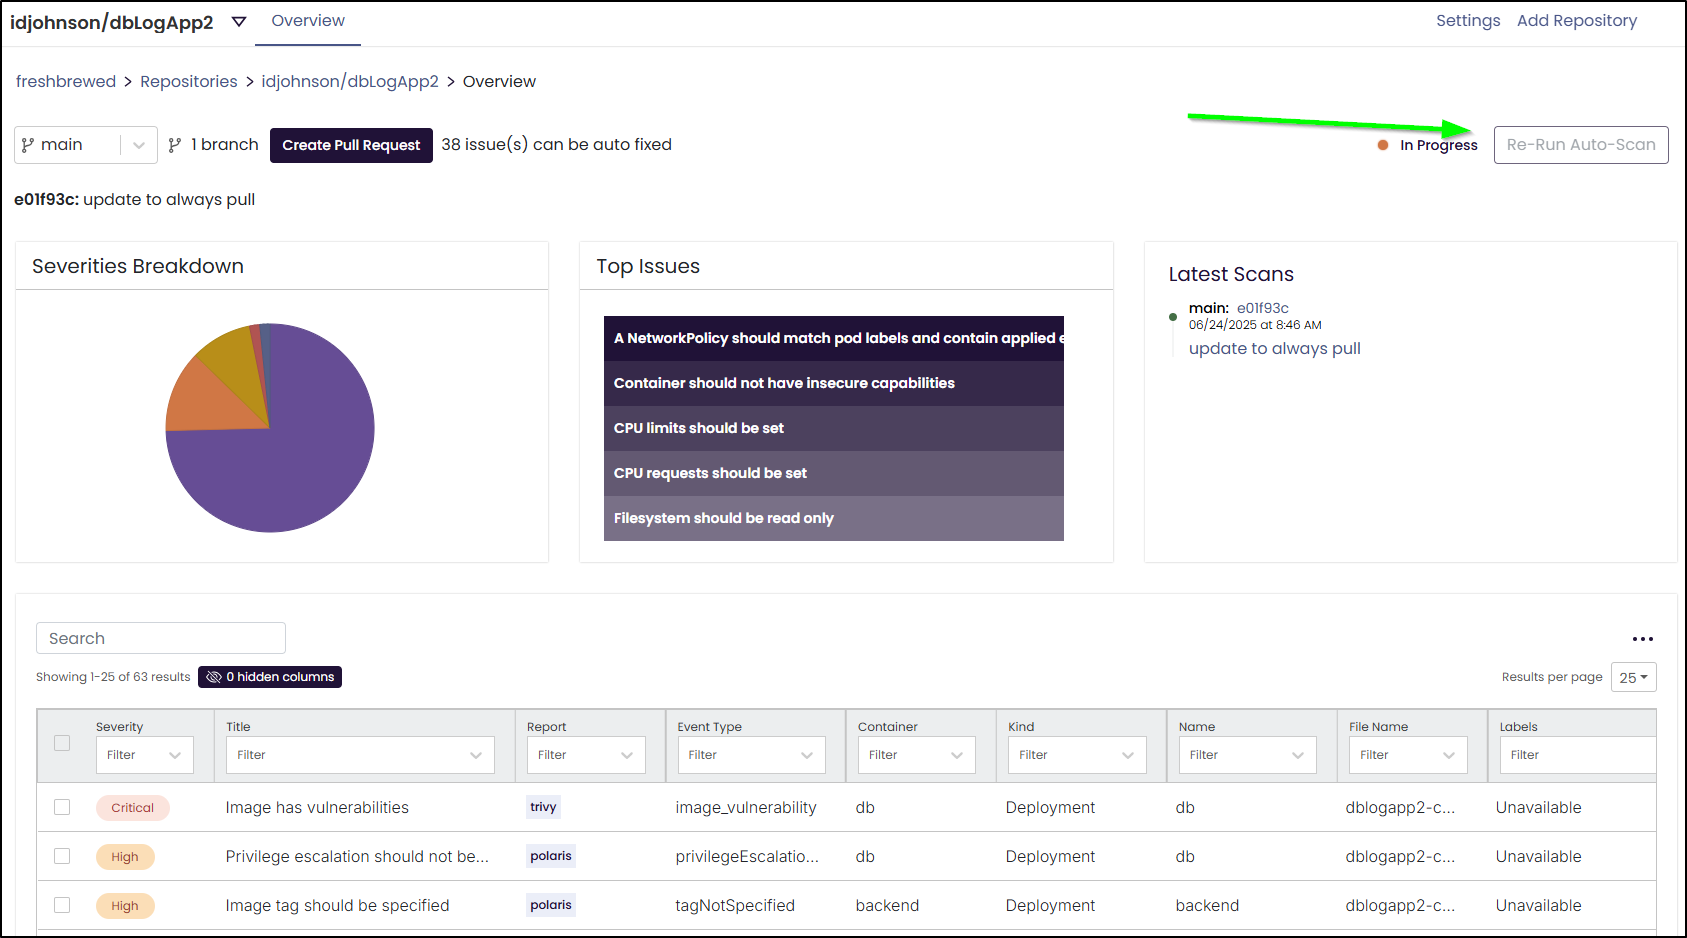
I can re-run a scan after updates
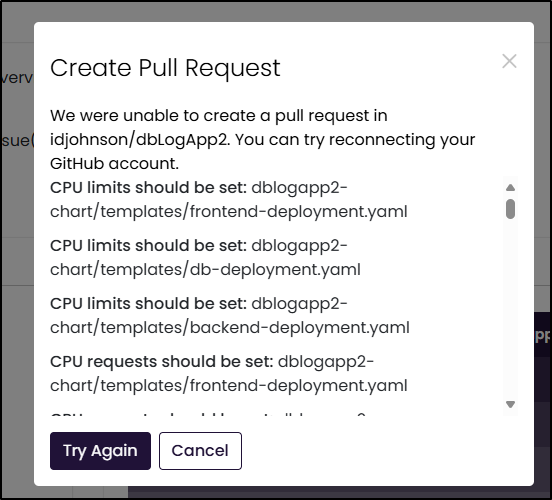
Let’s try creating a PR for the issues it suggests it can fix
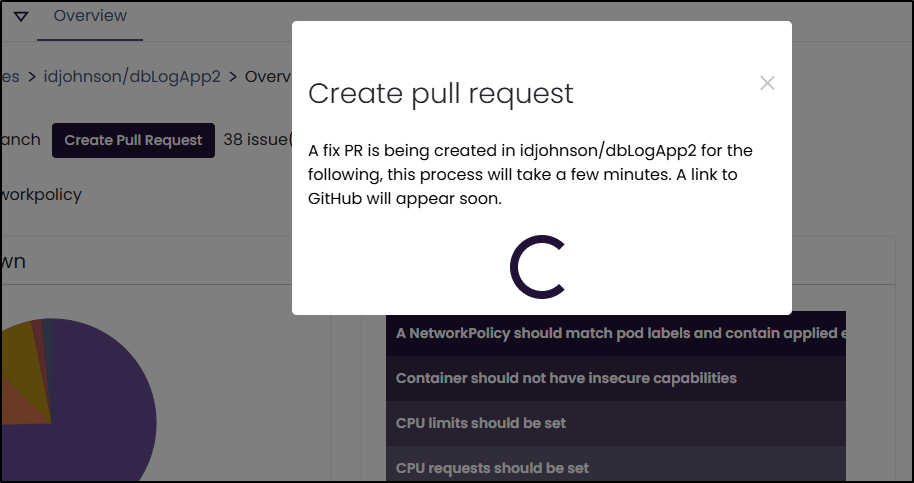
Though, while I tried twice, it didn’t seem able to create a PR
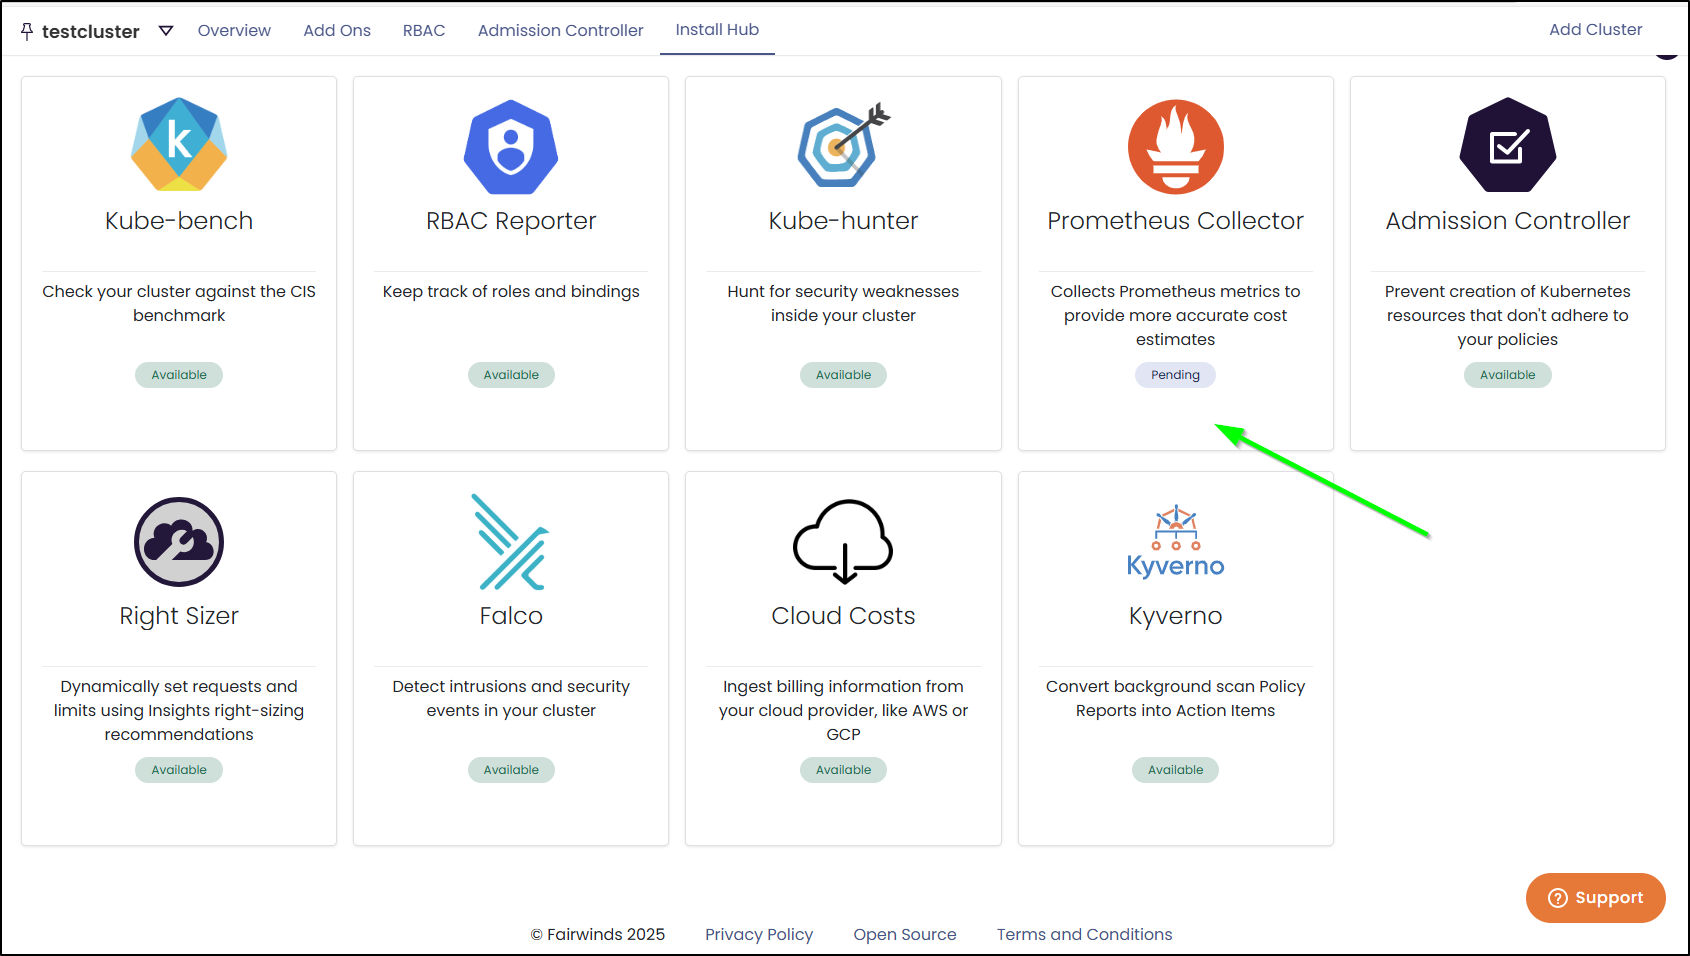
Some items won’t gather until we add Prometheus:
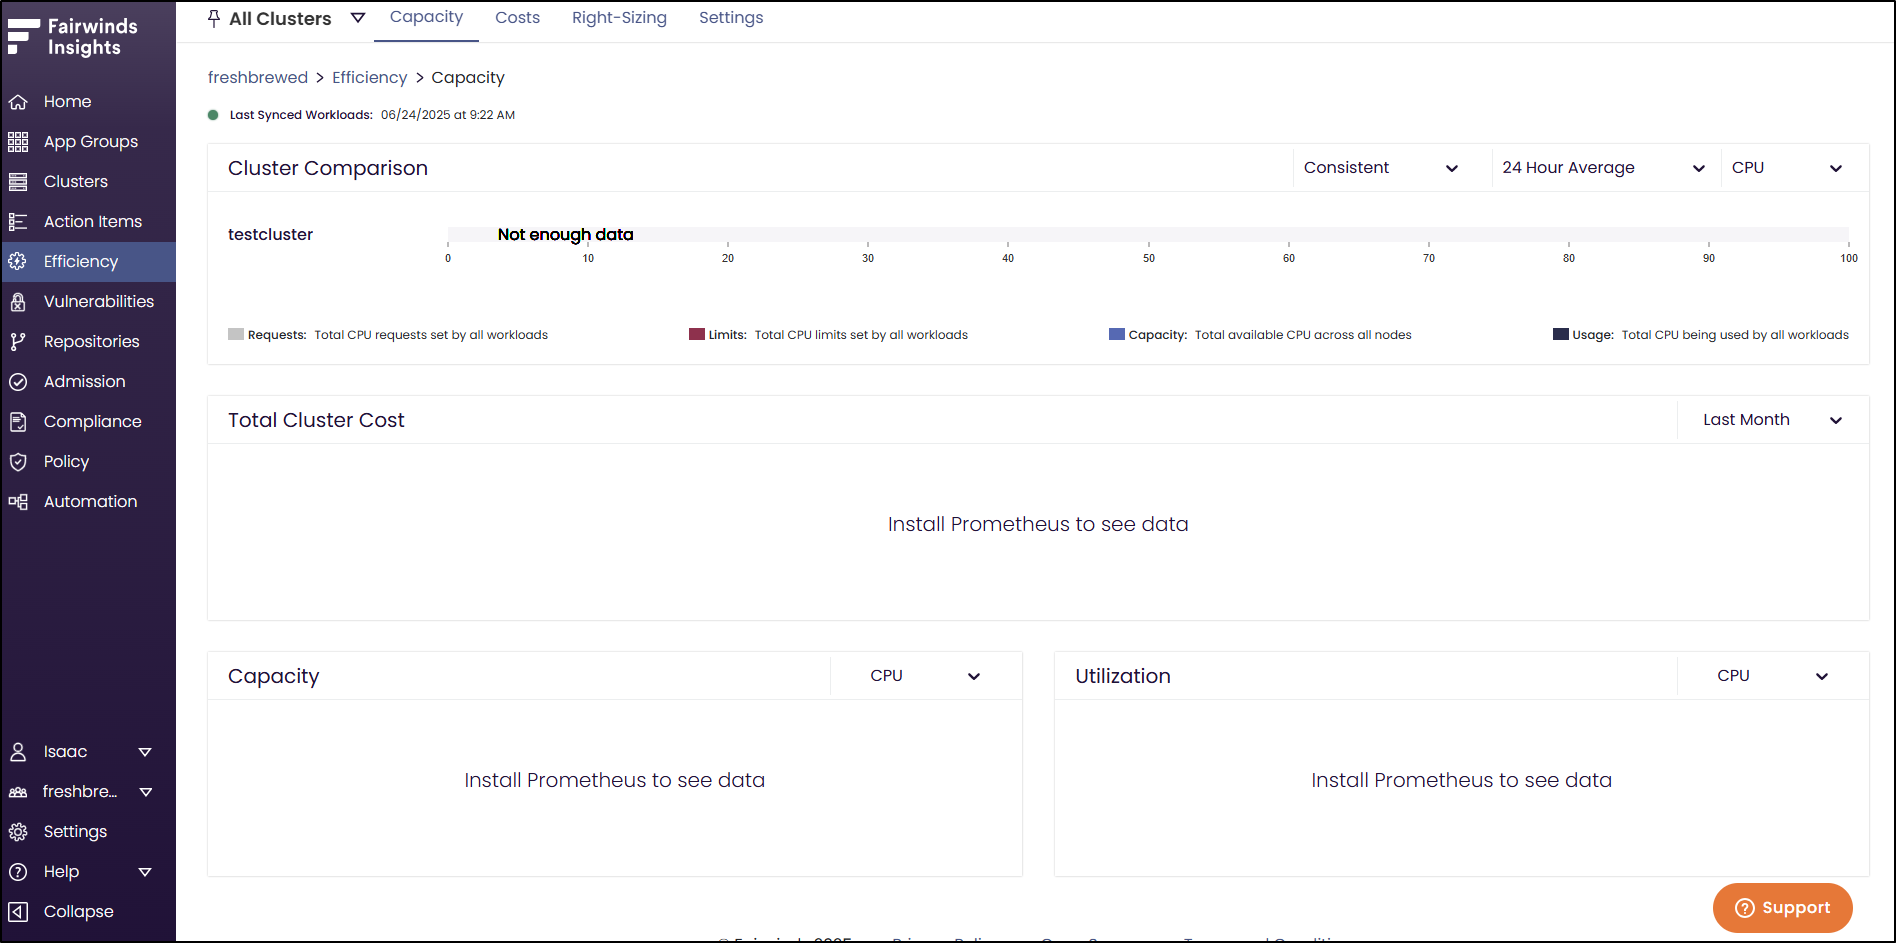
So let’s do that
$ helm repo add prometheus-community https://prometheus-community.github.io/helm-charts
"prometheus-community" has been added to your repositories
$ helm install prometheus prometheus-community/prometheus
NAME: prometheus
LAST DEPLOYED: Tue Jun 24 09:41:09 2025
NAMESPACE: default
STATUS: deployed
REVISION: 1
TEST SUITE: None
NOTES:
The Prometheus server can be accessed via port 80 on the following DNS name from within your cluster:
prometheus-server.default.svc.cluster.local


Get the Prometheus server URL by running these commands in the same shell:
  export POD_NAME=$(kubectl get pods --namespace default -l "app.kubernetes.io/name=prometheus,app.kubernetes.io/instance=prometheus" -o jsonpath="{.items[0].metadata.name}")
  kubectl --namespace default port-forward $POD_NAME 9090


The Prometheus alertmanager can be accessed via port 9093 on the following DNS name from within your cluster:
prometheus-alertmanager.default.svc.cluster.local


Get the Alertmanager URL by running these commands in the same shell:
  export POD_NAME=$(kubectl get pods --namespace default -l "app.kubernetes.io/name=alertmanager,app.kubernetes.io/instance=prometheus" -o jsonpath="{.items[0].metadata.name}")
  kubectl --namespace default port-forward $POD_NAME 9093
#################################################################################
######   WARNING: Pod Security Policy has been disabled by default since    #####
######            it deprecated after k8s 1.25+. use                        #####
######            (index .Values "prometheus-node-exporter" "rbac"          #####
###### .          "pspEnabled") with (index .Values                         #####
######            "prometheus-node-exporter" "rbac" "pspAnnotations")       #####
######            in case you still need it.                                #####
#################################################################################


The Prometheus PushGateway can be accessed via port 9091 on the following DNS name from within your cluster:
prometheus-prometheus-pushgateway.default.svc.cluster.local


Get the PushGateway URL by running these commands in the same shell:
  export POD_NAME=$(kubectl get pods --namespace default -l "app=prometheus-pushgateway,component=pushgateway" -o jsonpath="{.items[0].metadata.name}")
  kubectl --namespace default port-forward $POD_NAME 9091

For more information on running Prometheus, visit:
https://prometheus.io/
I might as well do Grafana while I’m add it
$ helm repo add grafana https://grafana.github.io/helm-charts
"grafana" already exists with the same configuration, skipping
$ helm install grafana grafana/grafana
NAME: grafana
LAST DEPLOYED: Tue Jun 24 09:42:26 2025
NAMESPACE: default
STATUS: deployed
REVISION: 1
NOTES:
1. Get your 'admin' user password by running:

   kubectl get secret --namespace default grafana -o jsonpath="{.data.admin-password}" | base64 --decode ; echo


2. The Grafana server can be accessed via port 80 on the following DNS name from within your cluster:

   grafana.default.svc.cluster.local

   Get the Grafana URL to visit by running these commands in the same shell:
     export POD_NAME=$(kubectl get pods --namespace default -l "app.kubernetes.io/name=grafana,app.kubernetes.io/instance=grafana" -o jsonpath="{.items[0].metadata.name}")
     kubectl --namespace default port-forward $POD_NAME 3000

3. Login with the password from step 1 and the username: admin
#################################################################################
######   WARNING: Persistence is disabled!!! You will lose your data when   #####
######            the Grafana pod is terminated.                            #####
#################################################################################
I didn’t see anything change in Fairwinds, so I tried exposing a Nodeport
$ kubectl expose service prometheus-server --type=NodePort --target-port=9090 --name=prometheus-server-ext
service/prometheus-server-ext exposed
It could be I just need to “Add Report” to get Fairwinds to connect to Prometheus
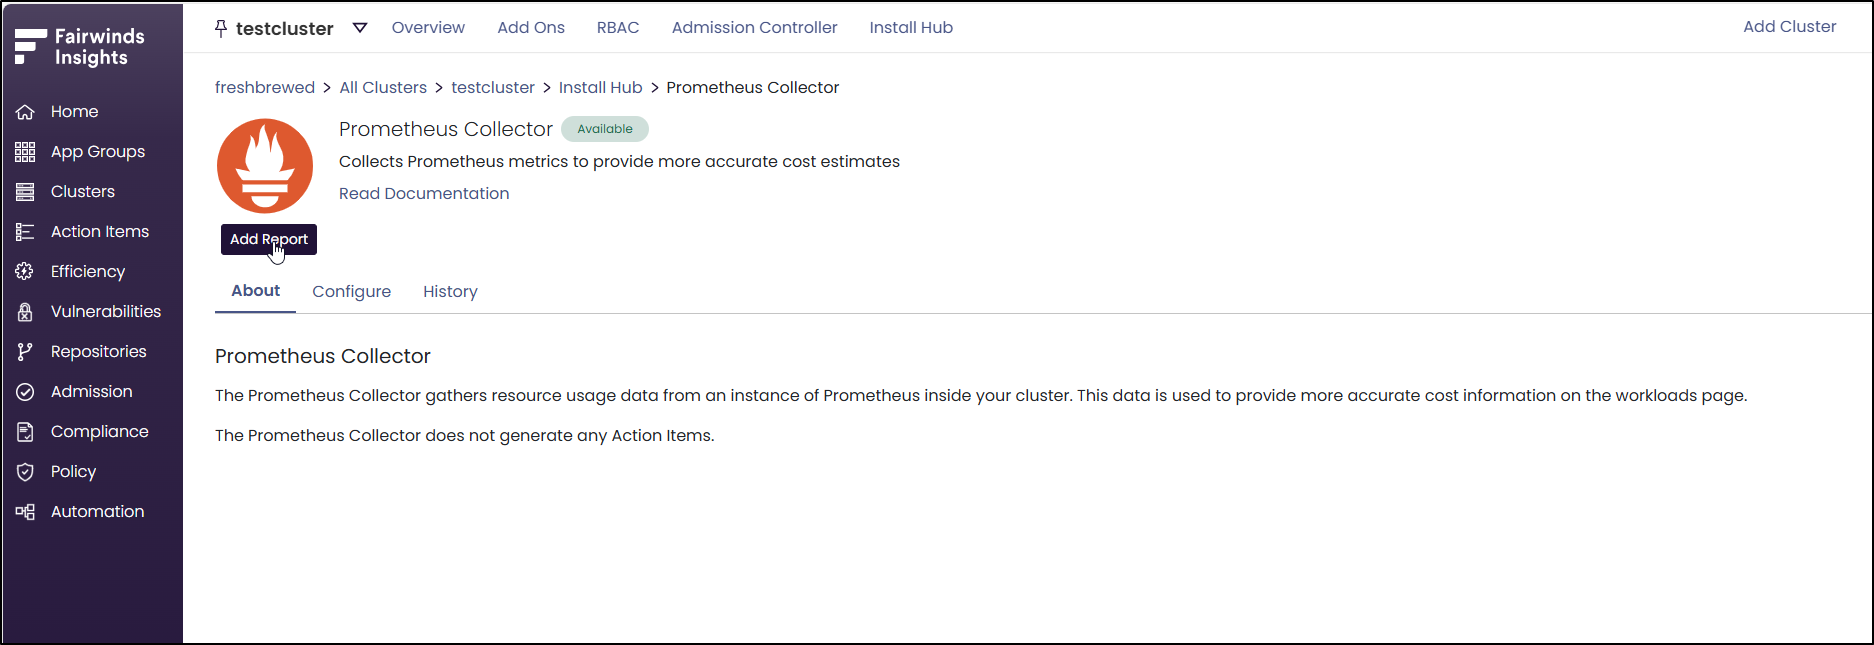
Though I do see it Pending, not Installed
I spoke with the good people at Fairwinds and the way that agent can get added a bit easier is to let the helm installer add it.
I updated my values file to add the prometheus-metrics block:
$ cat values.yaml
insights:
  organization: "freshbrewed"
  cluster: "testcluster"
  base64token: "asdfasdfasdfasfdsadfasdfasdfasdfsadfsdf=="
nova:
  enabled: true
opa:
  enabled: true
pluto:
  enabled: true
polaris:
  enabled: true
trivy:
  enabled: true
prometheus-metrics:
  enabled: true
  installPrometheusServer: true
I removed the instance I had installed by hand
$ helm delete prometheus
release "prometheus" uninstalled
Then I can update to use the new values
$ helm upgrade --install insights-agent fairwinds-stable/insights-agent -f values.yaml   --version "4.6.*"   --create-namespace   --namespace insights-agent   --wait   --atomic
Release "insights-agent" has been upgraded. Happy Helming!
NAME: insights-agent
LAST DEPLOYED: Tue Jun 24 10:30:34 2025
NAMESPACE: insights-agent
STATUS: deployed
REVISION: 2
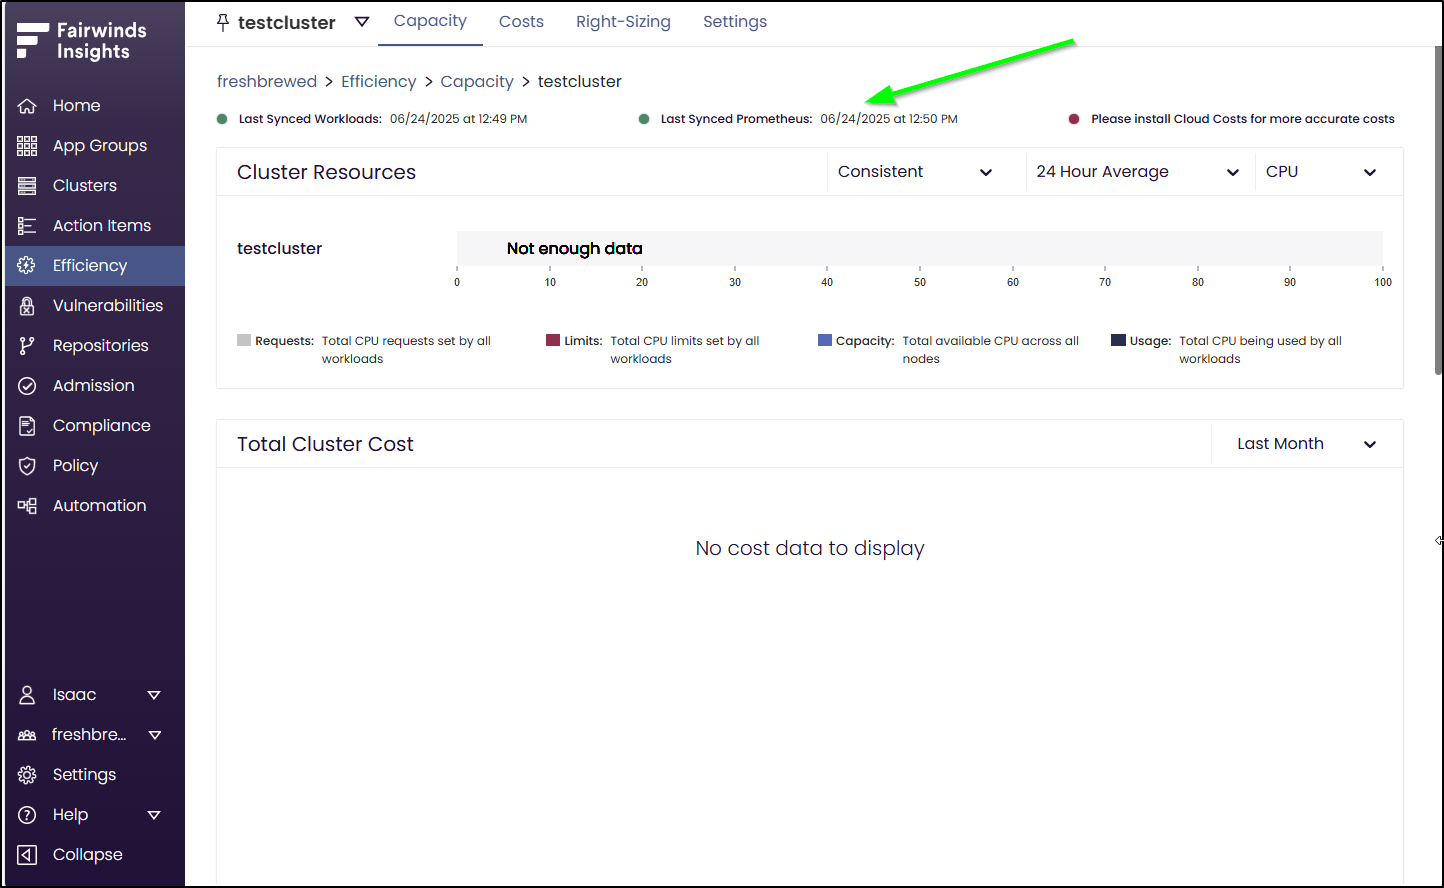
I can now see data is getting synced
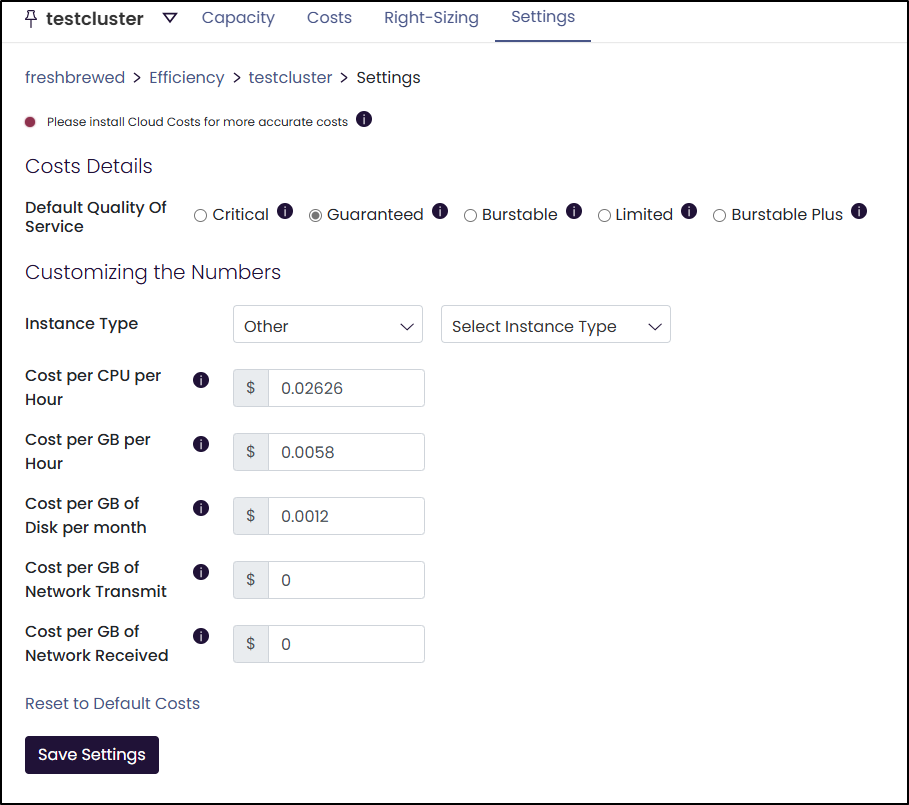
For costing, we can use AWS and GCP or just use Other
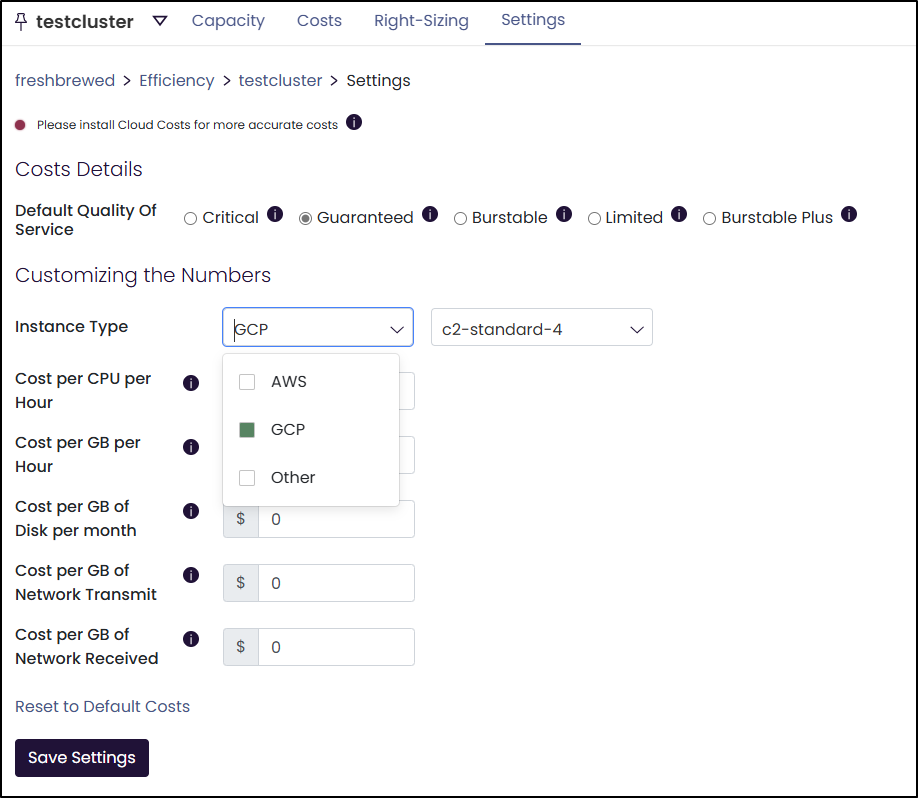
For instance, I might estimate my compute and amortize my $440 worth of disks that last 3 years for 10Tb this way
Reports
I’m also curious about Reports. Even though I have no workloads on there yet, let’s run a report
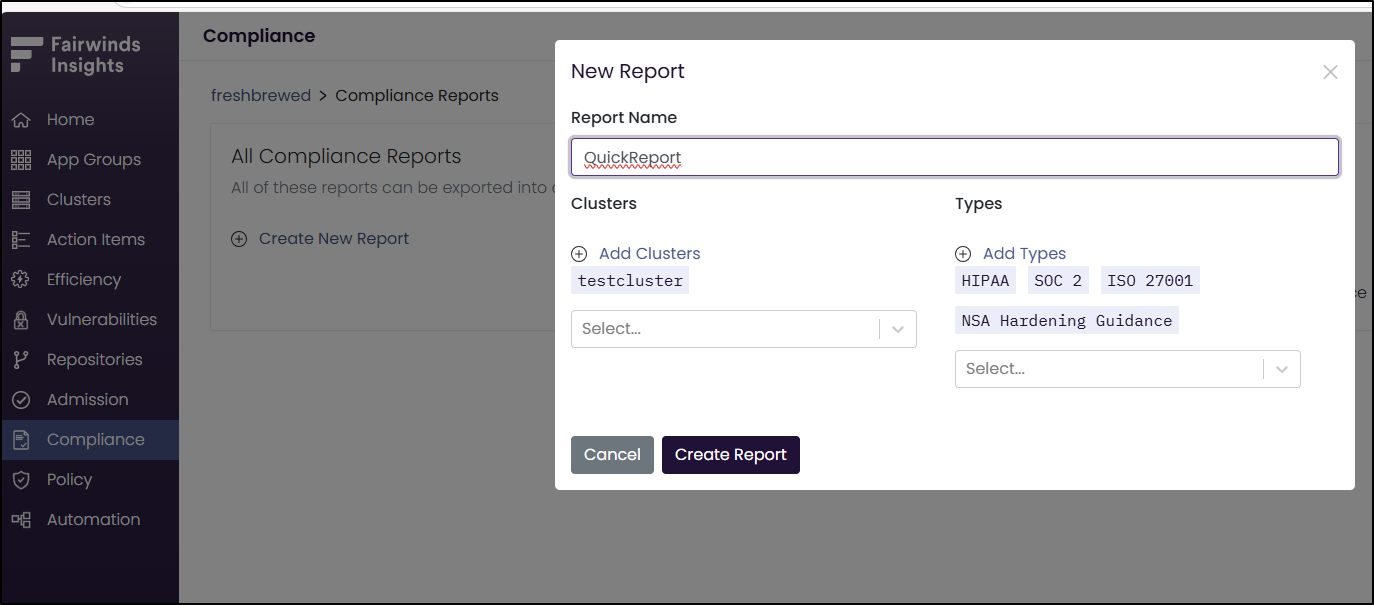
I see the report was created
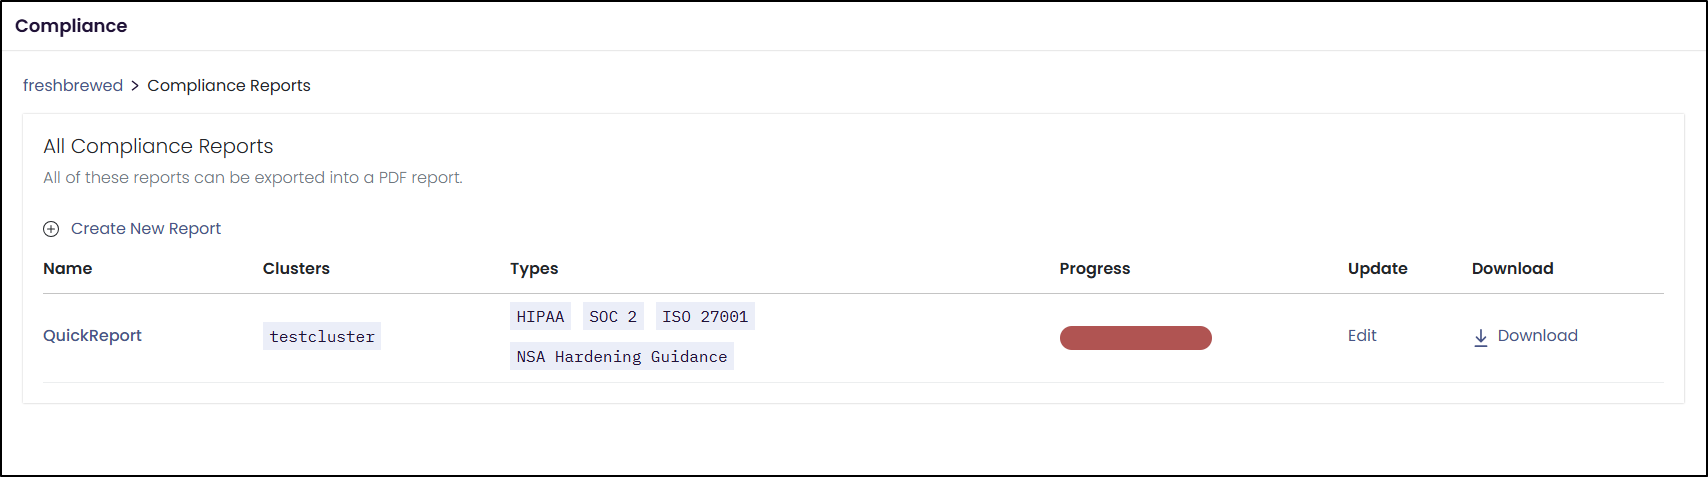
But viewing the details shows it has yet to run
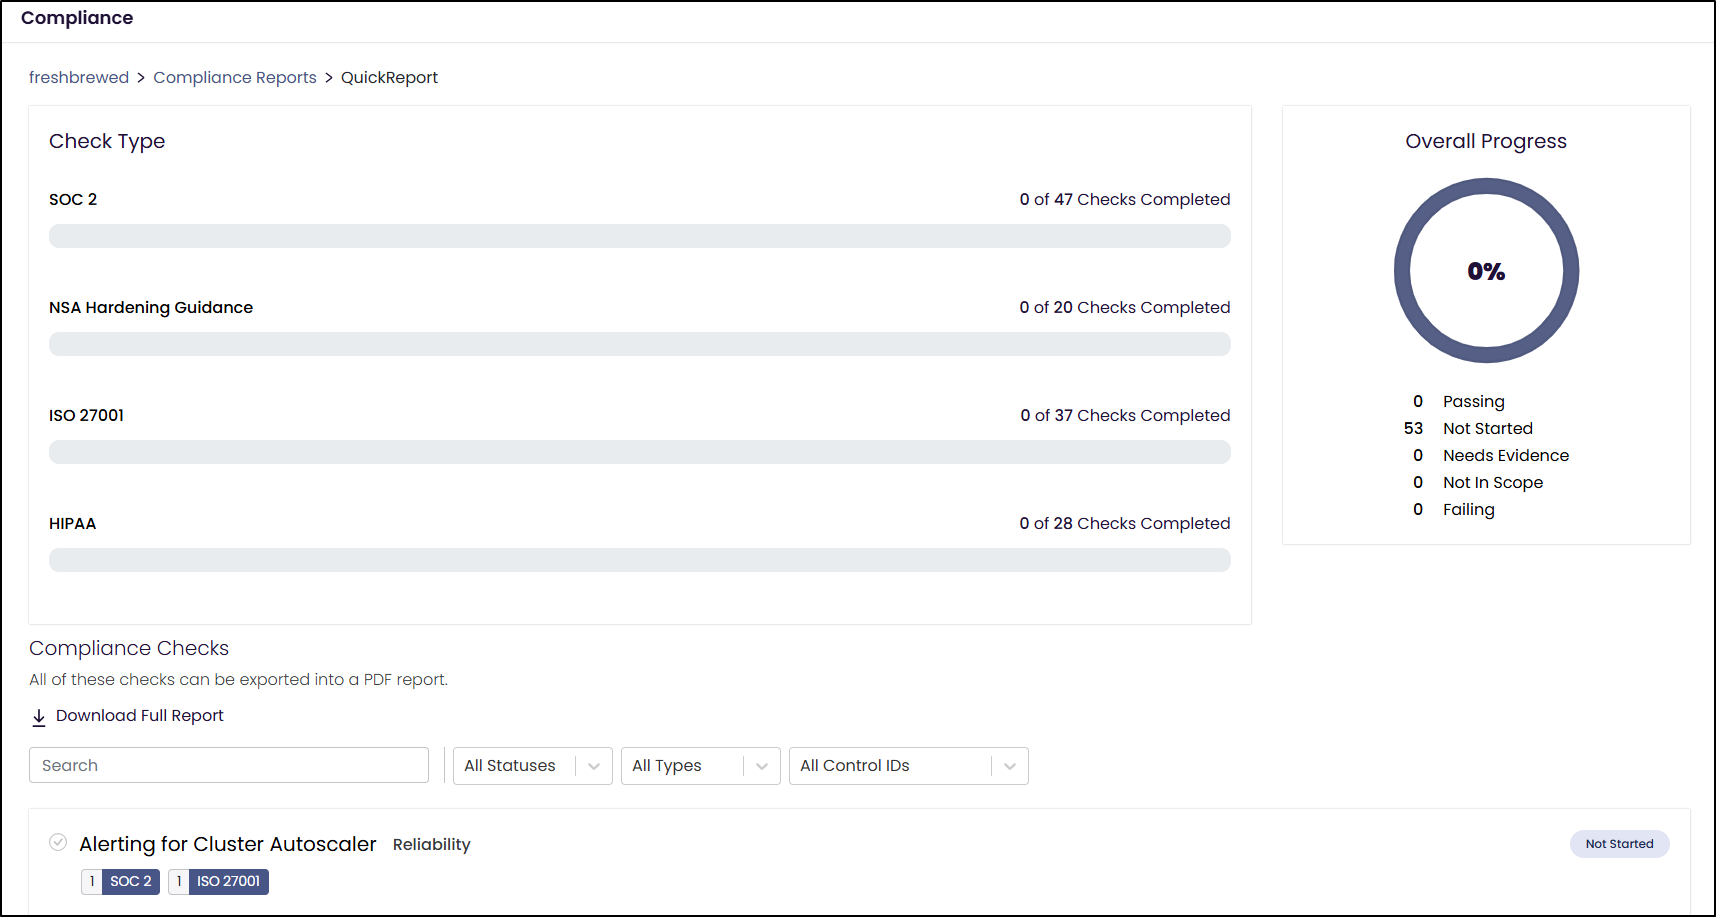
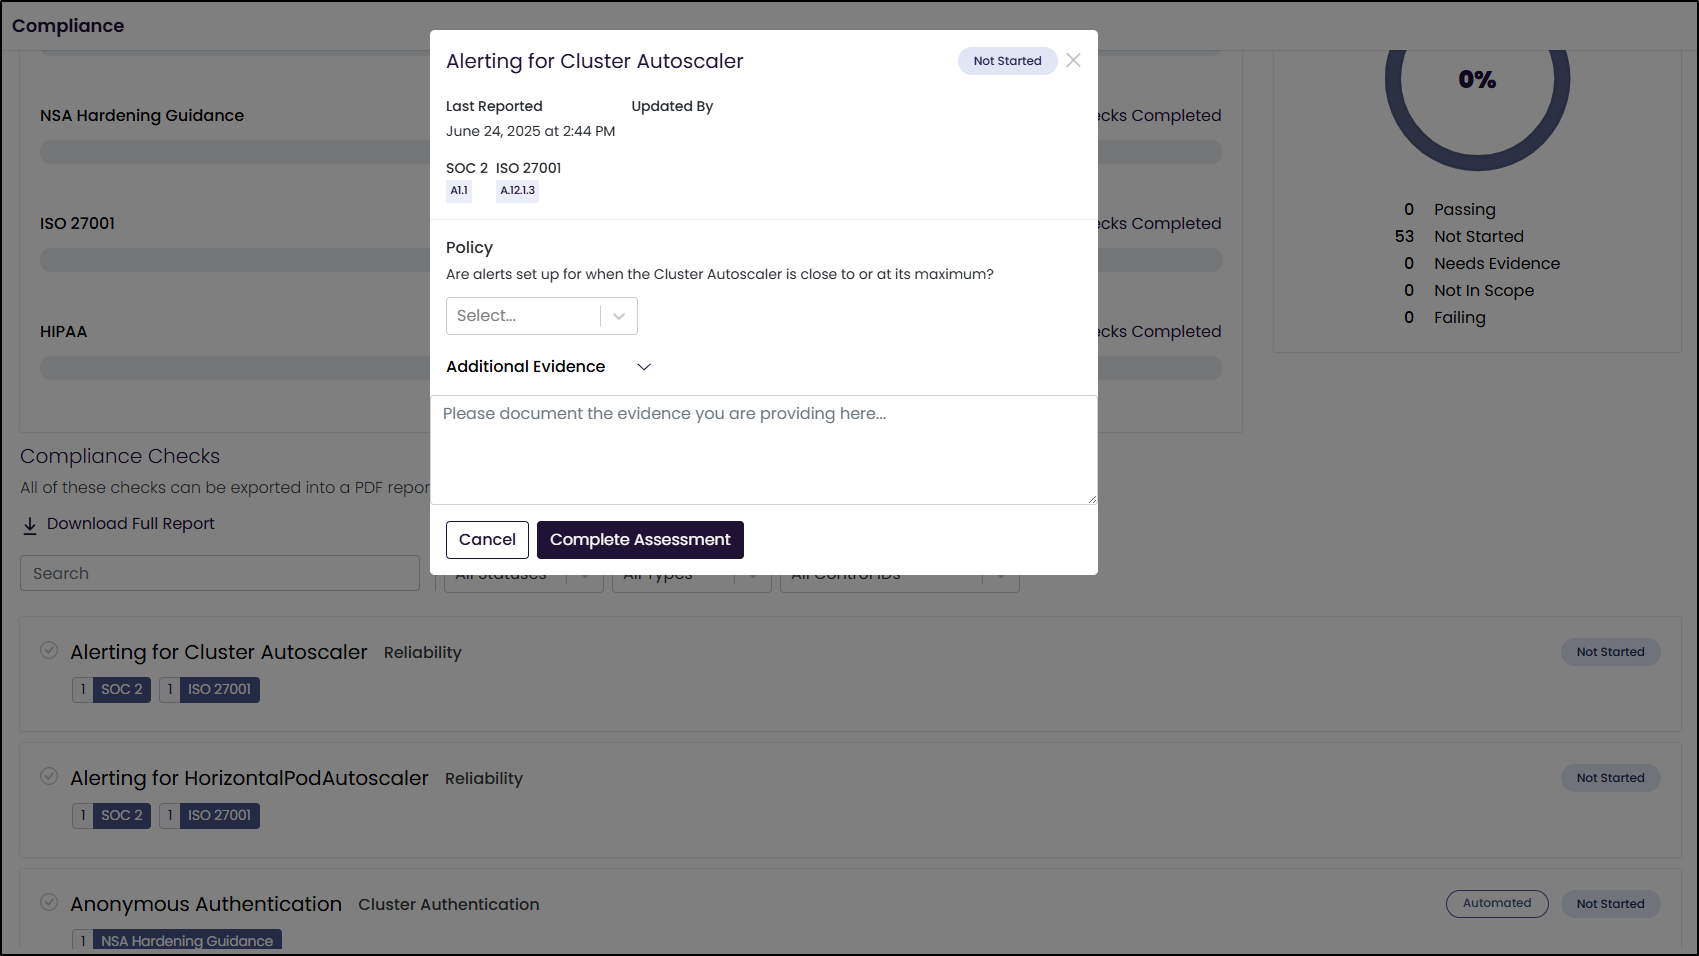
As I circled back later, I realized that the work was actually on me. The steps below were questions I would need to answer for each Check
Trivy scans
One thing that caught me off-guard was some errors in my Trivy log. It was trying to scan images listed in my Github repo that are in a private CR (Harbor).
This was really quite easy to fix. I just needed to add a valid image pull secret:
$ kubectl apply -f ./myharborreg.yaml
secret/myharborreg created
Then add it to the values file and update
$ cat values.yaml | tail -n4
trivy:
  enabled: true
  privateImages:
    dockerConfigSecret: "myharborreg"
$ helm upgrade --install insights-agent fairwinds-stable/insights-agent -f values.yaml   --version "4.6.*"   --create-namespace   --namespace insights-agent   --wait   --atomic
Release "insights-agent" has been upgraded. Happy Helming!
NAME: insights-agent
LAST DEPLOYED: Tue Jun 24 13:06:59 2025
NAMESPACE: insights-agent
STATUS: deployed
REVISION: 3
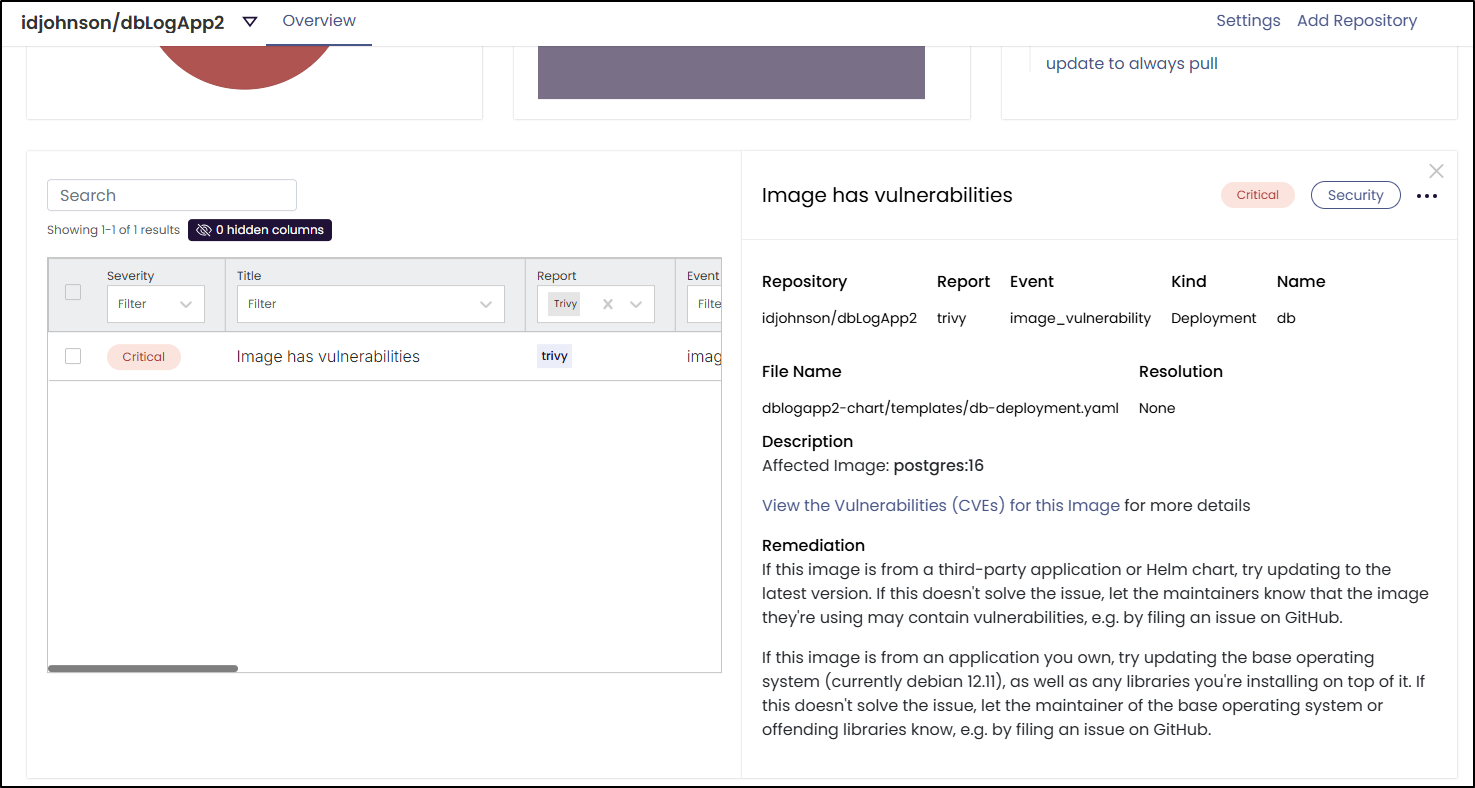
Presently I just have an issue in a Docker hub container image, but it shows Trivy scans are working
Summary
Today we looked at Nova which can scan our Kubernetes cluster for out of date charts and containers. We then tried Pluto which looks for deprecated APIs (which I found none) before checking out Polaris. Polaris builds on Goldilocks to look for inefficiencies and other issues broken down by security, efficiency and reliability
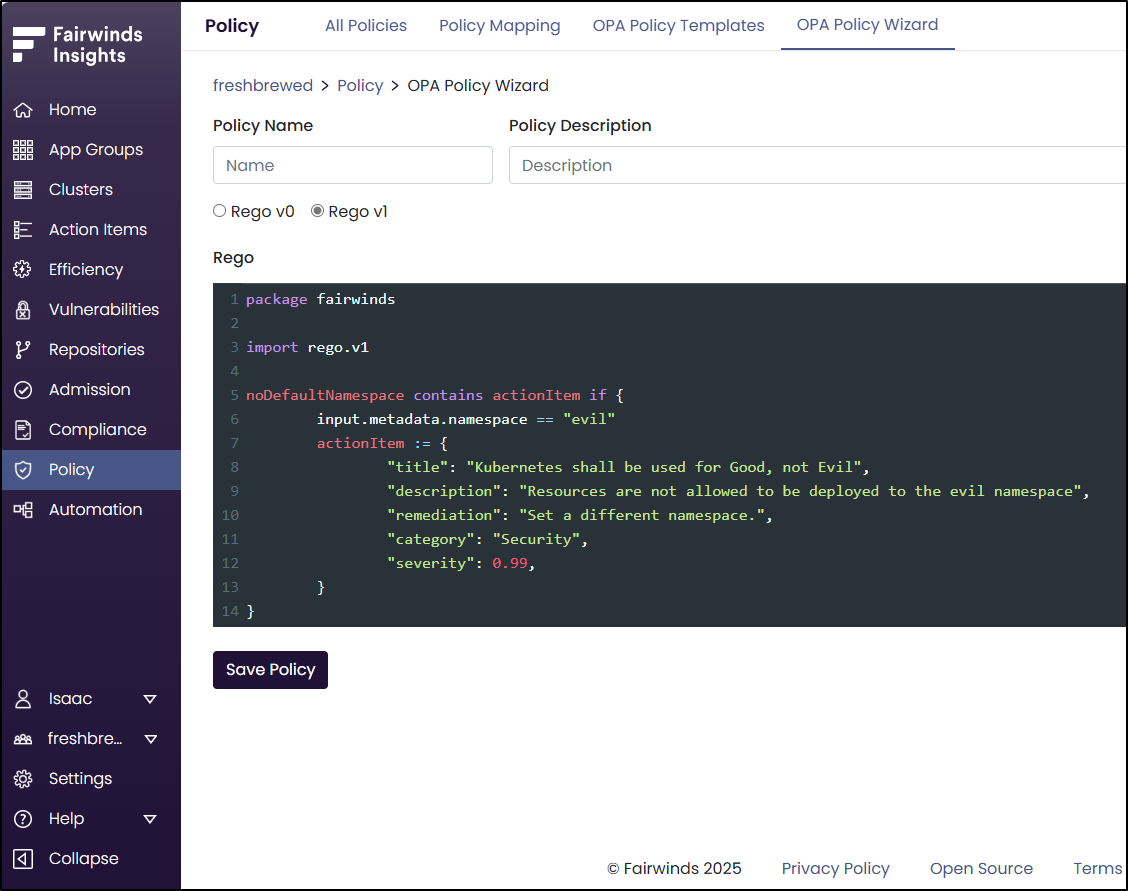
Lastly, I took the commercial offering “Insights” for a spin which is about bringing all these tools together (and more). For instance, Insights includes a policy agent we didn’t have time to explore:
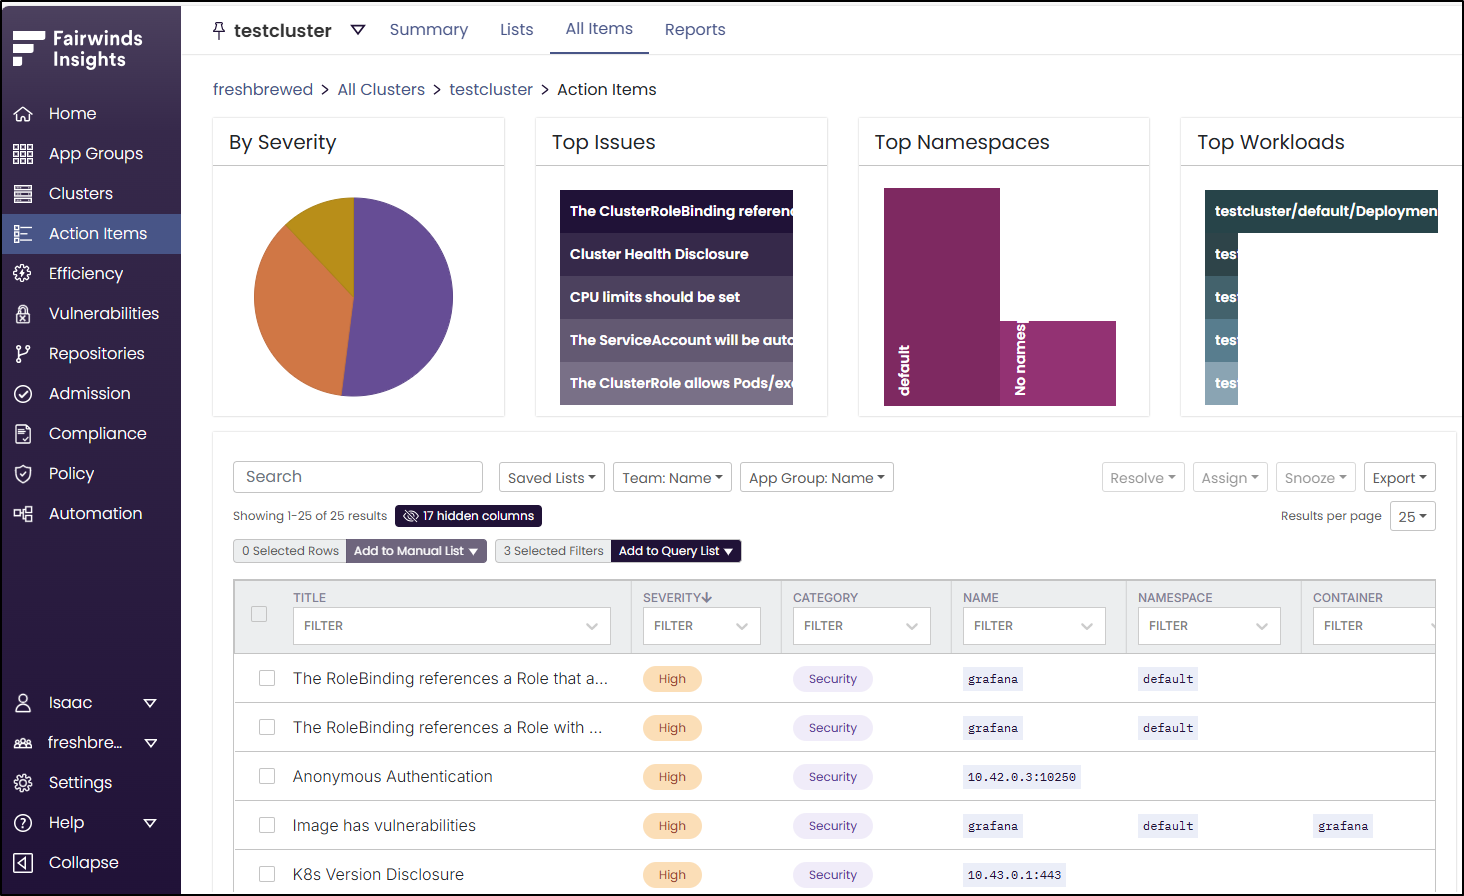
I like insights because it makes it easy to aggregate issues together into reports we can search and sort
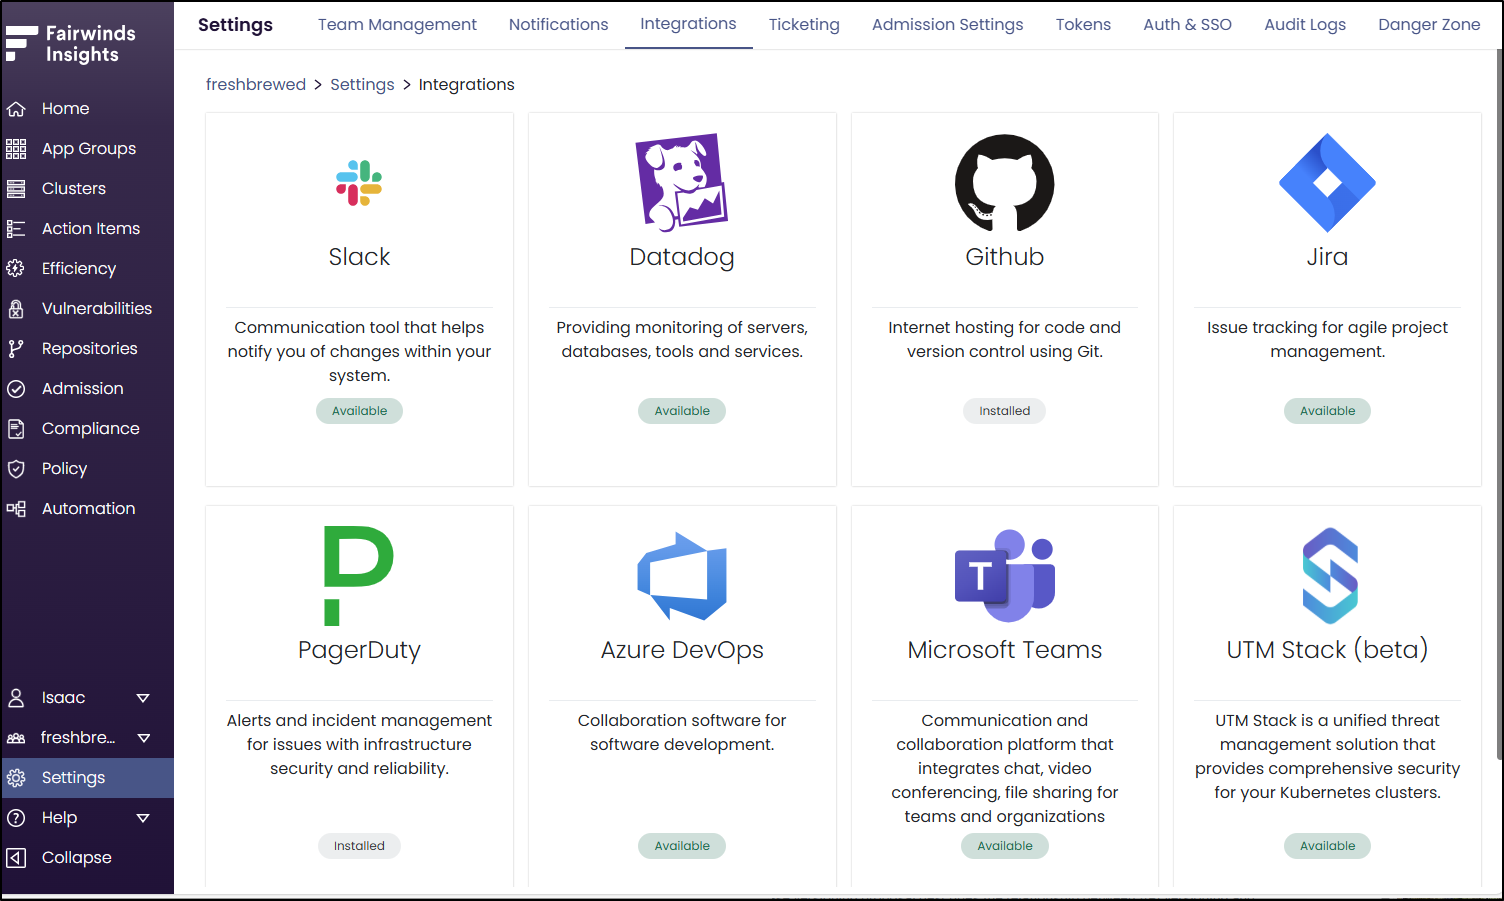
There are also a few integrations that could add some value (like Azure DevOps)
What I like about this model (and I told Fairwinds the same thing), is that this Open-Source model lets a team try it out, find value and if they want to offload Day-2 support, buy Insights as a managed offering.
I’ll continue to explore Insights in a more professional manner, but as a blogger, I definitely love the Fairwinds Open-Source offerings.