Published: Feb 22, 2024 by Isaac Johnson
Recently I was looking to fetch some metrics from the Prometheus in Kubecost and found it was down. Today we’ll look at how you fix a stuck Prometheus server, upgrading Kubecost to the latest chart with Helm and then some of the newer alerting features. We’ll use email, Slack and PagerDuty for that.
Fixing
First, I had found the Kubecost Prometheus metrics collector had been down.
Checking into why, I found the Prometheus server was broken due to a lock file getting stuck
$ kubectl logs kubecost-prometheus-server-8697c46bc-mwp8z -n kubecost  prometheus-server | tail -n 10
ts=2024-01-27T15:29:33.698Z caller=main.go:833 level=info msg="Stopping notify discovery manager..."
ts=2024-01-27T15:29:33.698Z caller=main.go:855 level=info msg="Stopping scrape manager..."
ts=2024-01-27T15:29:33.698Z caller=main.go:829 level=info msg="Notify discovery manager stopped"
ts=2024-01-27T15:29:33.698Z caller=main.go:815 level=info msg="Scrape discovery manager stopped"
ts=2024-01-27T15:29:33.698Z caller=manager.go:950 level=info component="rule manager" msg="Stopping rule manager..."
ts=2024-01-27T15:29:33.698Z caller=manager.go:960 level=info component="rule manager" msg="Rule manager stopped"
ts=2024-01-27T15:29:33.698Z caller=notifier.go:600 level=info component=notifier msg="Stopping notification manager..."
ts=2024-01-27T15:29:33.698Z caller=main.go:1088 level=info msg="Notifier manager stopped"
ts=2024-01-27T15:29:33.698Z caller=main.go:849 level=info msg="Scrape manager stopped"
ts=2024-01-27T15:29:33.698Z caller=main.go:1097 level=error err="opening storage failed: lock DB directory: resource temporarily unavailable"
To fix it, I need to get onto that volume (storage-volume)
$ kubectl get deployments -n kubecost kubecost-prometheus-server -o yaml | tail -n50 | head -n33
            scheme: HTTP
          initialDelaySeconds: 30
          periodSeconds: 10
          successThreshold: 1
          timeoutSeconds: 30
        resources: {}
        terminationMessagePath: /dev/termination-log
        terminationMessagePolicy: File
        volumeMounts:
        - mountPath: /etc/config
          name: config-volume
        - mountPath: /data
          name: storage-volume
      dnsPolicy: ClusterFirst
      restartPolicy: Always
      schedulerName: default-scheduler
      securityContext:
        fsGroup: 1001
        runAsGroup: 1001
        runAsNonRoot: true
        runAsUser: 1001
      serviceAccount: kubecost-prometheus-server
      serviceAccountName: kubecost-prometheus-server
      terminationGracePeriodSeconds: 300
      volumes:
      - configMap:
          defaultMode: 420
          name: kubecost-prometheus-server
        name: config-volume
      - name: storage-volume
        persistentVolumeClaim:
          claimName: kubecost-prometheus-server
status:
While, I can’t exec into a crashing pod to fix
$ kubectl exec -it kubecost-prometheus-server-8697c46bc-mwp8z -n kubecost --container prometheus-server -- /bin/bash
error: unable to upgrade connection: container not found ("prometheus-server")
I can, however, make a debug pod
$ cat debug.yaml
apiVersion: v1
kind: Pod
metadata:
  name: ubuntu-pod
spec:
  containers:
  - name: ubuntu-container
    image: ubuntu
    command: ["/bin/sleep", "3600"]
    command:
    volumeMounts:
    - name: kps-volume
      mountPath: /mnt/kps
    - name: kpsvc-volume
      mountPath: /mnt/kpsvc
  volumes:
  - name: kps-volume
    configMap:
      name: kubecost-prometheus-server
  - name: kpsvc-volume
    persistentVolumeClaim:
      claimName: kubecost-prometheus-server
Launch it into the namespace
$ kubectl apply -f ./debug.yaml -n kubecost
pod/ubuntu-pod created
And then I can exec into it and remove the lock
builder@DESKTOP-QADGF36:~$ kubectl exec -it ubuntu-pod -n kubecost -- /bin/bash
root@ubuntu-pod:/# ls -ltra /mnt/kps
total 12
lrwxrwxrwx 1 root root   12 Jan 27 15:39 rules -> ..data/rules
lrwxrwxrwx 1 root root   26 Jan 27 15:39 recording_rules.yml -> ..data/recording_rules.yml
lrwxrwxrwx 1 root root   21 Jan 27 15:39 prometheus.yml -> ..data/prometheus.yml
lrwxrwxrwx 1 root root   13 Jan 27 15:39 alerts -> ..data/alerts
lrwxrwxrwx 1 root root   25 Jan 27 15:39 alerting_rules.yml -> ..data/alerting_rules.yml
lrwxrwxrwx 1 root root   32 Jan 27 15:39 ..data -> ..2024_01_27_15_39_55.3698848498
drwxr-xr-x 2 root root 4096 Jan 27 15:39 ..2024_01_27_15_39_55.3698848498
drwxrwxrwx 3 root root 4096 Jan 27 15:39 .
drwxr-xr-x 1 root root 4096 Jan 27 15:40 ..
root@ubuntu-pod:/# ls -ltra /mnt/kps
kps/   kpsvc/
root@ubuntu-pod:/# ls -ltra /mnt/kpsvc/
total 120
-rw-r--r--  1 1001 1001    0 Aug  1 20:57 lock
drwxr-xr-x  3 1001 1001 4096 Dec 16 23:00 01HHTDQMSYP3DFG77GAMCSTR4E
drwxr-xr-x  3 1001 1001 4096 Dec 17 17:00 01HHWBH1K67M2YMHXNNBR8G19X
drwxr-xr-x  3 1001 1001 4096 Dec 18 11:00 01HHY9APK63H6KRASAFV37KQC5
drwxr-xr-x  3 1001 1001 4096 Dec 19 05:00 01HJ0745GH4KKR6Z0GHTTXH98H
drwxr-xr-x  3 1001 1001 4096 Dec 19 23:00 01HJ24XRMSP1QZ025K0T4RS4BR
drwxr-xr-x  3 1001 1001 4096 Dec 20 17:00 01HJ42Q73PRYGXWKPB59DV9DE3
drwxr-xr-x  3 1001 1001 4096 Dec 21 11:00 01HJ60GTXNPQYEAQ2PKG767CE3
drwxr-xr-x  3 1001 1001 4096 Dec 22 05:00 01HJ7YA9H8WGHF8J3T3BY1VGTK
drwxr-xr-x  3 1001 1001 4096 Dec 22 23:00 01HJ9W3YPB3K1RHT8CDAA77X8J
drwxr-xr-x  3 1001 1001 4096 Dec 23 17:00 01HJBSXFTNX4MWRD3AZCZBGJ83
drwxr-xr-x  3 1001 1001 4096 Dec 24 11:00 01HJDQQ62R6JRVCNG4J4C8FKYJ
drwxr-xr-x  3 1001 1001 4096 Dec 25 05:00 01HJFNGJ031MNESX2JYAS67R0G
drwxr-xr-x  3 1001 1001 4096 Dec 25 23:00 01HJHKA8VJD4R7Q1NX151P260K
drwxr-xr-x  3 1001 1001 4096 Dec 26 17:00 01HJKH3PA91A8TEMFFN4M0TGRF
drwxr-xr-x  3 1001 1001 4096 Dec 27 11:00 01HJNEXDBT8DQ83YR2ECS32KWK
drwxr-xr-x  3 1001 1001 4096 Dec 28 05:00 01HJQCPQ276G5ENYR82KXM7ZS3
drwxr-xr-x  3 1001 1001 4096 Dec 28 23:00 01HJSAGC54R2AWAXK8Q2CXGP28
drwxr-xr-x  3 1001 1001 4096 Dec 29 17:00 01HJV89SJTXRXGXMPSY5PJBB24
drwxr-xr-x  3 1001 1001 4096 Dec 30 11:00 01HJX63HQ48JYCHWRK7ANS00R3
drwxr-xr-x  3 1001 1001 4096 Dec 30 17:00 01HJXTP8WMSNZZ3MSK4ZXEN0D4
drwxr-xr-x  3 1001 1001 4096 Dec 30 21:00 01HJY8DKG3P63D3T8D3XYQZ26D
drwxr-xr-x  3 1001 1001 4096 Dec 30 23:00 01HJYF9AQPNRWS7RJNVYDJ0BFG
drwxr-xr-x  3 1001 1001 4096 Dec 30 23:00 01HJYF9MGWEMYSB8HPTWGM87KH
drwxr-xr-x  3 1001 1001 4096 Dec 31 01:00 01HJYP520BRZMD7GRWM0H7D1YB
drwxr-xr-x  3 1001 1001 4096 Dec 31 03:00 01HJYX0SANQ018ZWYTAPDAC0K7
drwxrwxrwx 29 root root 4096 Dec 31 03:00 .
drwxr-xr-x  2 1001 1001 4096 Dec 31 03:00 chunks_head
drwxr-xr-x  3 1001 1001 4096 Dec 31 03:00 wal
-rw-r--r--  1 1001 1001 1001 Jan 27 15:39 queries.active
drwxr-xr-x  1 root root 4096 Jan 27 15:40 ..
root@ubuntu-pod:/# rm -f /mnt/kpsvc/lock
root@ubuntu-pod:/# ls -ltra /mnt/kpsvc/
total 120
drwxr-xr-x  3 1001 1001 4096 Dec 16 23:00 01HHTDQMSYP3DFG77GAMCSTR4E
drwxr-xr-x  3 1001 1001 4096 Dec 17 17:00 01HHWBH1K67M2YMHXNNBR8G19X
drwxr-xr-x  3 1001 1001 4096 Dec 18 11:00 01HHY9APK63H6KRASAFV37KQC5
drwxr-xr-x  3 1001 1001 4096 Dec 19 05:00 01HJ0745GH4KKR6Z0GHTTXH98H
drwxr-xr-x  3 1001 1001 4096 Dec 19 23:00 01HJ24XRMSP1QZ025K0T4RS4BR
drwxr-xr-x  3 1001 1001 4096 Dec 20 17:00 01HJ42Q73PRYGXWKPB59DV9DE3
drwxr-xr-x  3 1001 1001 4096 Dec 21 11:00 01HJ60GTXNPQYEAQ2PKG767CE3
drwxr-xr-x  3 1001 1001 4096 Dec 22 05:00 01HJ7YA9H8WGHF8J3T3BY1VGTK
drwxr-xr-x  3 1001 1001 4096 Dec 22 23:00 01HJ9W3YPB3K1RHT8CDAA77X8J
drwxr-xr-x  3 1001 1001 4096 Dec 23 17:00 01HJBSXFTNX4MWRD3AZCZBGJ83
drwxr-xr-x  3 1001 1001 4096 Dec 24 11:00 01HJDQQ62R6JRVCNG4J4C8FKYJ
drwxr-xr-x  3 1001 1001 4096 Dec 25 05:00 01HJFNGJ031MNESX2JYAS67R0G
drwxr-xr-x  3 1001 1001 4096 Dec 25 23:00 01HJHKA8VJD4R7Q1NX151P260K
drwxr-xr-x  3 1001 1001 4096 Dec 26 17:00 01HJKH3PA91A8TEMFFN4M0TGRF
drwxr-xr-x  3 1001 1001 4096 Dec 27 11:00 01HJNEXDBT8DQ83YR2ECS32KWK
drwxr-xr-x  3 1001 1001 4096 Dec 28 05:00 01HJQCPQ276G5ENYR82KXM7ZS3
drwxr-xr-x  3 1001 1001 4096 Dec 28 23:00 01HJSAGC54R2AWAXK8Q2CXGP28
drwxr-xr-x  3 1001 1001 4096 Dec 29 17:00 01HJV89SJTXRXGXMPSY5PJBB24
drwxr-xr-x  3 1001 1001 4096 Dec 30 11:00 01HJX63HQ48JYCHWRK7ANS00R3
drwxr-xr-x  3 1001 1001 4096 Dec 30 17:00 01HJXTP8WMSNZZ3MSK4ZXEN0D4
drwxr-xr-x  3 1001 1001 4096 Dec 30 21:00 01HJY8DKG3P63D3T8D3XYQZ26D
drwxr-xr-x  3 1001 1001 4096 Dec 30 23:00 01HJYF9AQPNRWS7RJNVYDJ0BFG
drwxr-xr-x  3 1001 1001 4096 Dec 30 23:00 01HJYF9MGWEMYSB8HPTWGM87KH
drwxr-xr-x  3 1001 1001 4096 Dec 31 01:00 01HJYP520BRZMD7GRWM0H7D1YB
drwxr-xr-x  3 1001 1001 4096 Dec 31 03:00 01HJYX0SANQ018ZWYTAPDAC0K7
drwxr-xr-x  2 1001 1001 4096 Dec 31 03:00 chunks_head
drwxr-xr-x  3 1001 1001 4096 Dec 31 03:00 wal
-rw-r--r--  1 1001 1001 1001 Jan 27 15:39 queries.active
drwxr-xr-x  1 root root 4096 Jan 27 15:40 ..
drwxrwxrwx 29 root root 4096 Jan 27 15:41 .
That fixed it
$ kubectl get pods -n kubecost
NAME                                           READY   STATUS    RESTARTS       AGE
kubecost-prometheus-node-exporter-5nnlx        1/1     Running   5 (72d ago)    323d
kubecost-prometheus-node-exporter-b6gbr        1/1     Running   7 (122d ago)   323d
kubecost-cost-analyzer-6b4bd74fc9-pmrw6        2/2     Running   0              253d
kubecost-prometheus-node-exporter-2wsf2        1/1     Running   2 (253d ago)   323d
kubecost-grafana-8496485545-655mb              2/2     Running   4 (253d ago)   302d
kubecost-kube-state-metrics-59fd4555f4-lw5b4   1/1     Running   2 (253d ago)   302d
kubecost-prometheus-node-exporter-f9w74        1/1     Running   14 (27d ago)   323d
kubecost-prometheus-server-8697c46bc-bs582     2/2     Running   0              10m
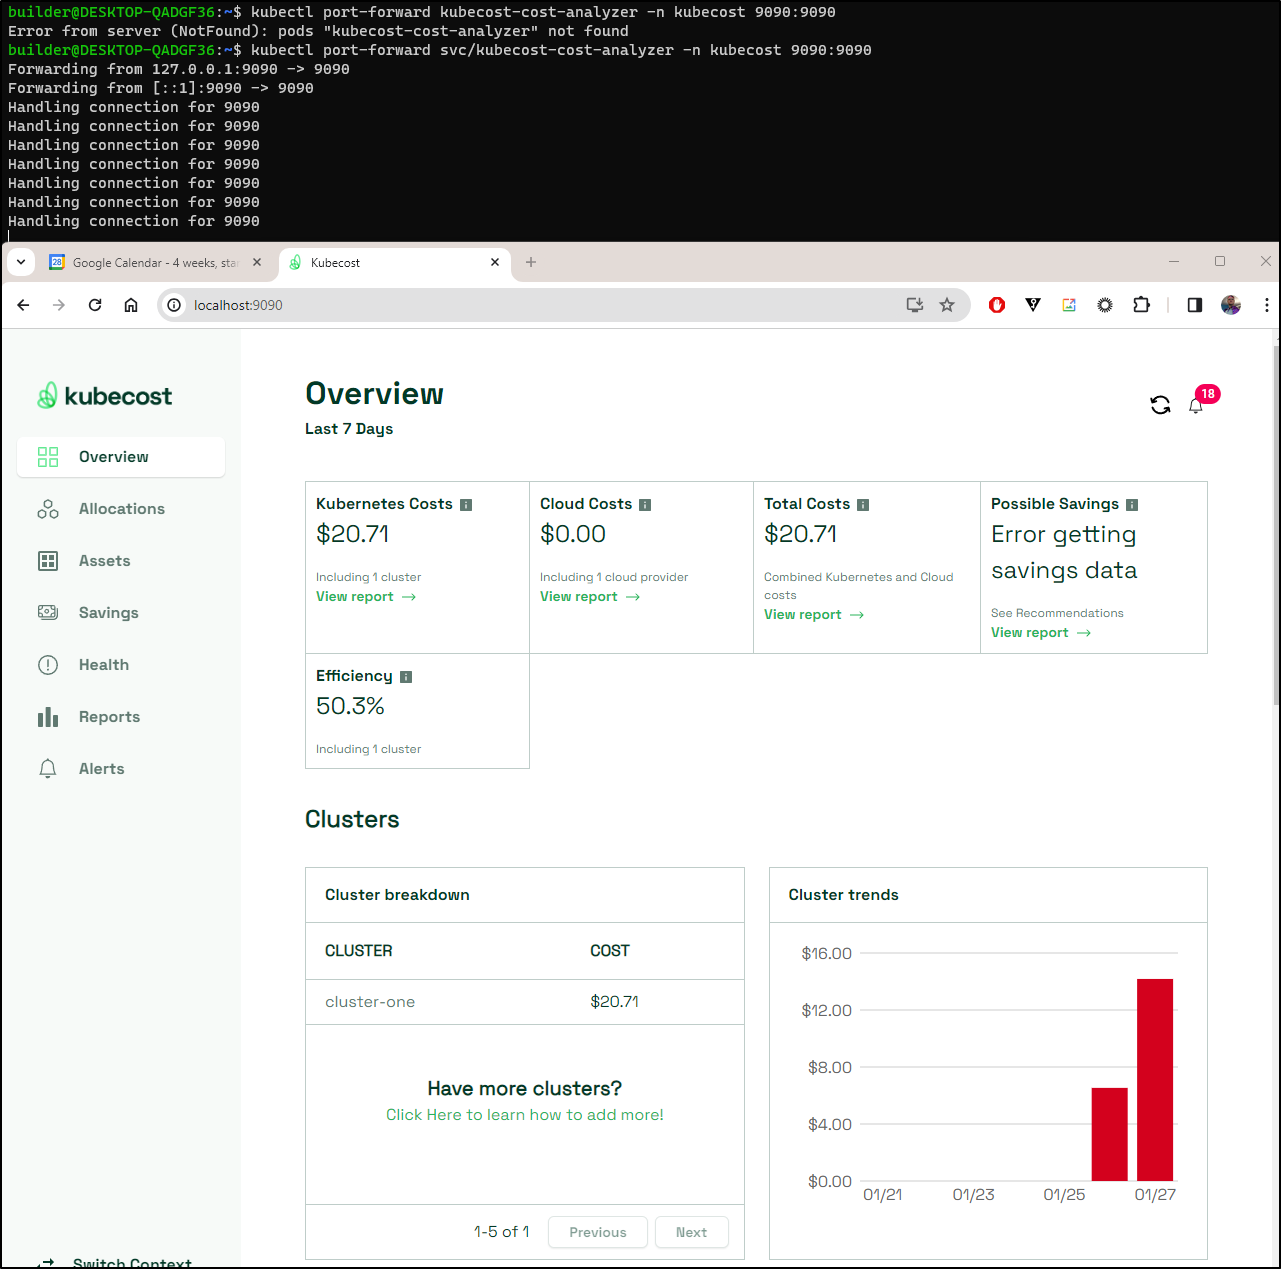
With it restored, I can now check costs. The days Prometheus was down, there is no data
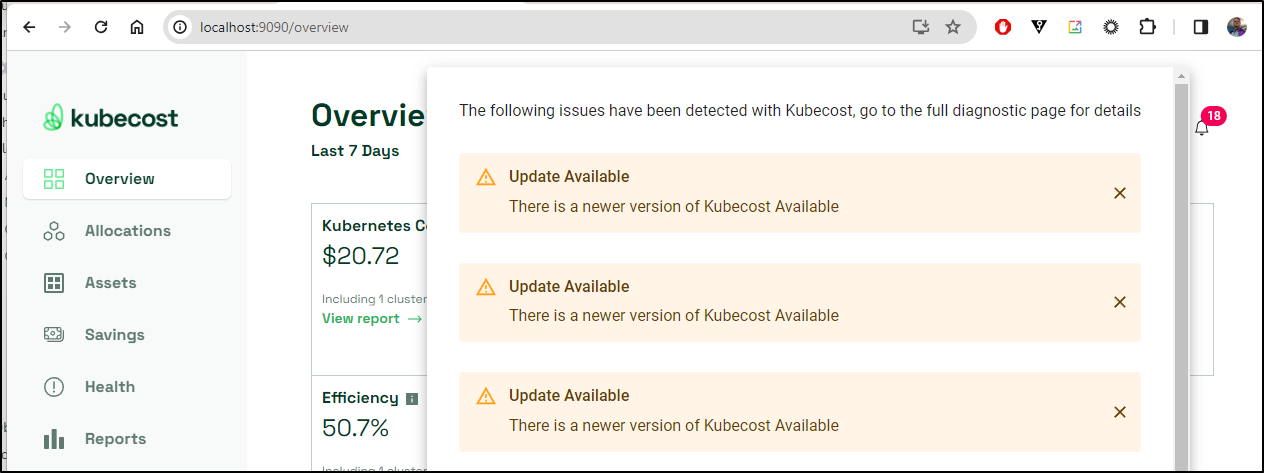
I see notifications that updates are available
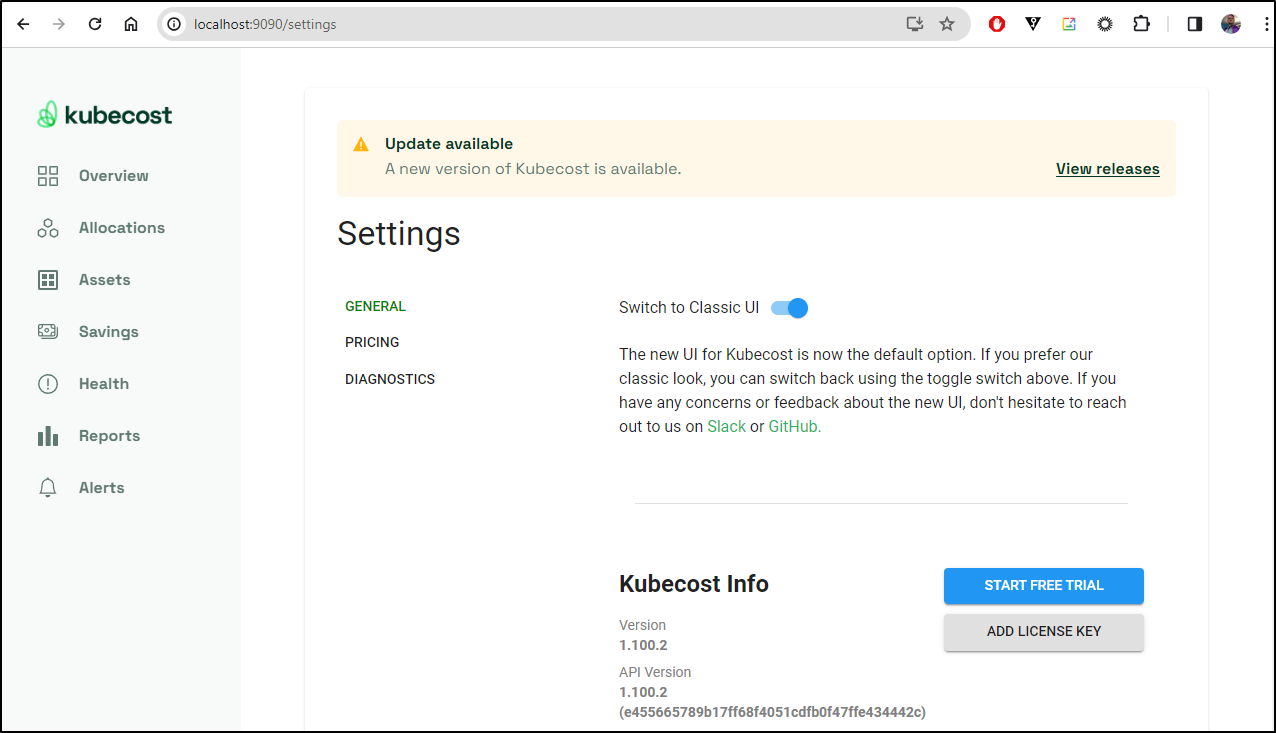
And I see the same in settings, which shows we are at version 1.100.2
Which lines up with our chart
$ helm list -n kubecost
NAME            NAMESPACE       REVISION        UPDATED                                 STATUS          CHART                   APP VERSION
kubecost        kubecost        1               2023-03-09 16:31:25.359127784 -0600 CST deployed        cost-analyzer-1.100.2   1.100.2
Since I’m not using any settings
$ helm get values -n kubecost kubecost
USER-SUPPLIED VALUES:
null
I’ll just try a simple update and upgrade
$ helm repo update

$ helm upgrade kubecost -n kubecost kubecost/cost-analyzer
W0128 12:03:29.164623   26752 warnings.go:70] policy/v1beta1 PodSecurityPolicy is deprecated in v1.21+, unavailable in v1.25+
W0128 12:03:30.589349   26752 warnings.go:70] policy/v1beta1 PodSecurityPolicy is deprecated in v1.21+, unavailable in v1.25+
W0128 12:03:30.665985   26752 warnings.go:70] policy/v1beta1 PodSecurityPolicy is deprecated in v1.21+, unavailable in v1.25+
W0128 12:03:31.718732   26752 warnings.go:70] policy/v1beta1 PodSecurityPolicy is deprecated in v1.21+, unavailable in v1.25+
Release "kubecost" has been upgraded. Happy Helming!
NAME: kubecost
LAST DEPLOYED: Sun Jan 28 12:03:21 2024
NAMESPACE: kubecost
STATUS: deployed
REVISION: 2
NOTES:
--------------------------------------------------
Kubecost 1.108.1 has been successfully installed.

Please allow 5-10 minutes for Kubecost to gather metrics.

When configured, cost reconciliation with cloud provider billing data will have a 48 hour delay.

When pods are Ready, you can enable port-forwarding with the following command:

    kubectl port-forward --namespace kubecost deployment/kubecost-cost-analyzer 9090

Then, navigate to http://localhost:9090 in a web browser.

Having installation issues? View our Troubleshooting Guide at http://docs.kubecost.com/troubleshoot-install
I see this brought us up to version 1.108.1
builder@DESKTOP-QADGF36:~$ kubectl get pods -n kubecost
NAME                                          READY   STATUS    RESTARTS       AGE
kubecost-grafana-8496485545-655mb             2/2     Running   4 (254d ago)   303d
kubecost-prometheus-node-exporter-p9nr6       1/1     Running   0              31s
kubecost-cost-analyzer-657b9686fb-5zr7q       0/2     Running   0              35s
kubecost-grafana-956b98df8-kwpq8              1/2     Running   0              37s
kubecost-prometheus-node-exporter-h8tgd       1/1     Running   0              20s
kubecost-prometheus-server-7c6b558d97-pws4m   1/2     Running   0              31s
kubecost-prometheus-node-exporter-dvqpq       1/1     Running   0              12s
kubecost-prometheus-node-exporter-dtc9x       1/1     Running   0              5s
builder@DESKTOP-QADGF36:~$ helm list -n kubecost
NAME            NAMESPACE       REVISION        UPDATED                                 STATUS          CHART                   APP VERSION
kubecost        kubecost        2               2024-01-28 12:03:21.461670211 -0600 CST deployed        cost-analyzer-1.108.1   1.108.1
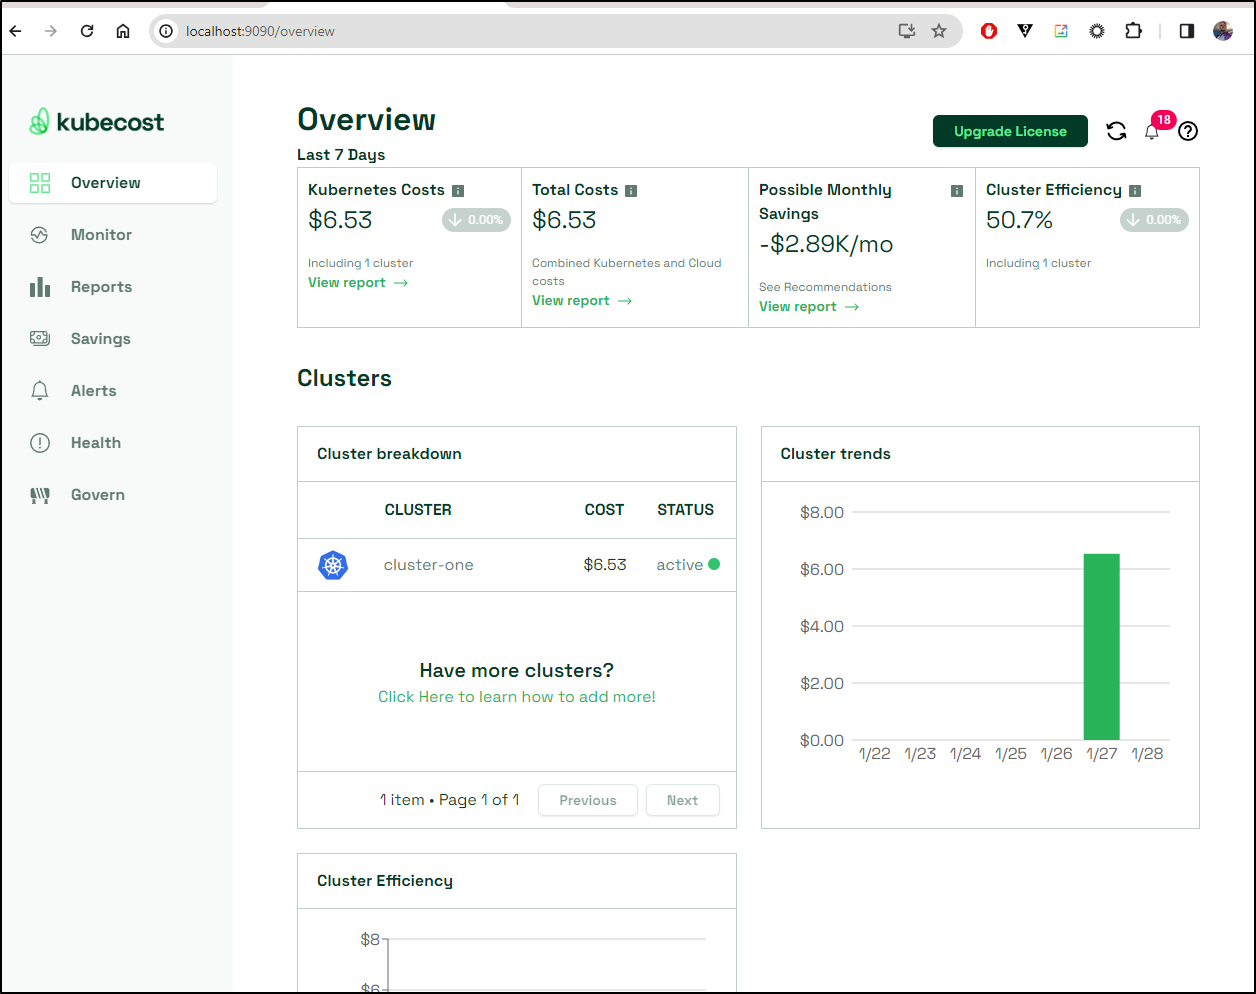
This looks pretty similar
Even though this is an on-prem cluster which means the only real cost I have is electricity (and most of the time my solar panels negate that), I do find cost details helpful.
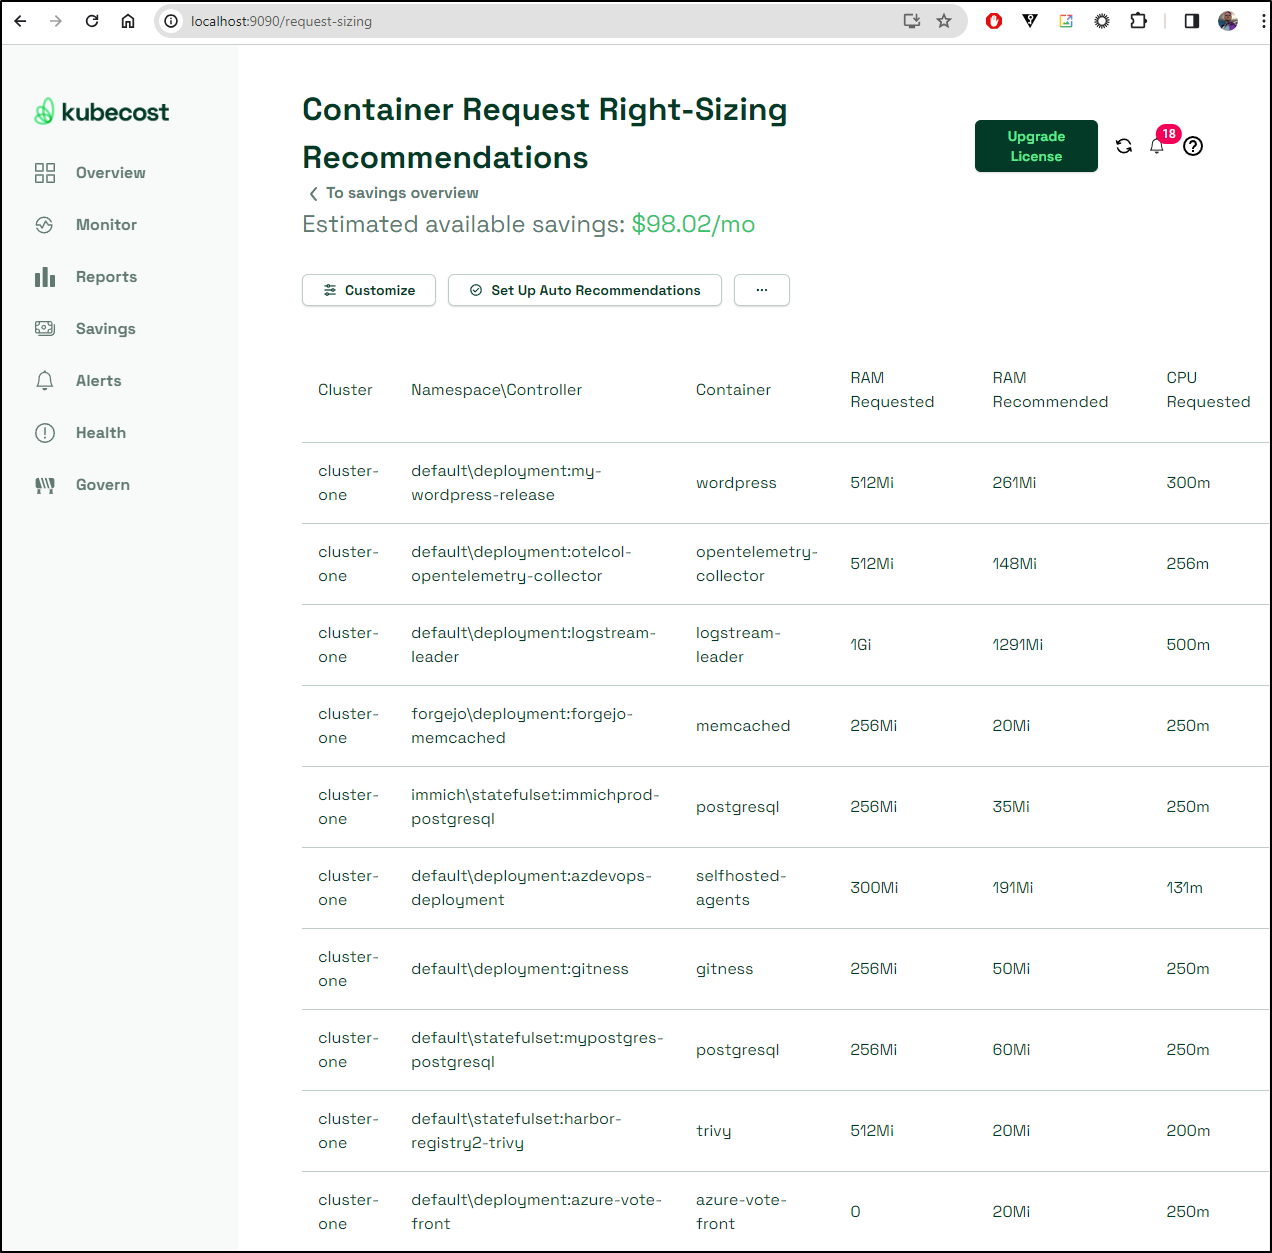
For instance, looking at the “right-sizing” of containers can help us tweak our Requests/Limits to better fit the cluster.
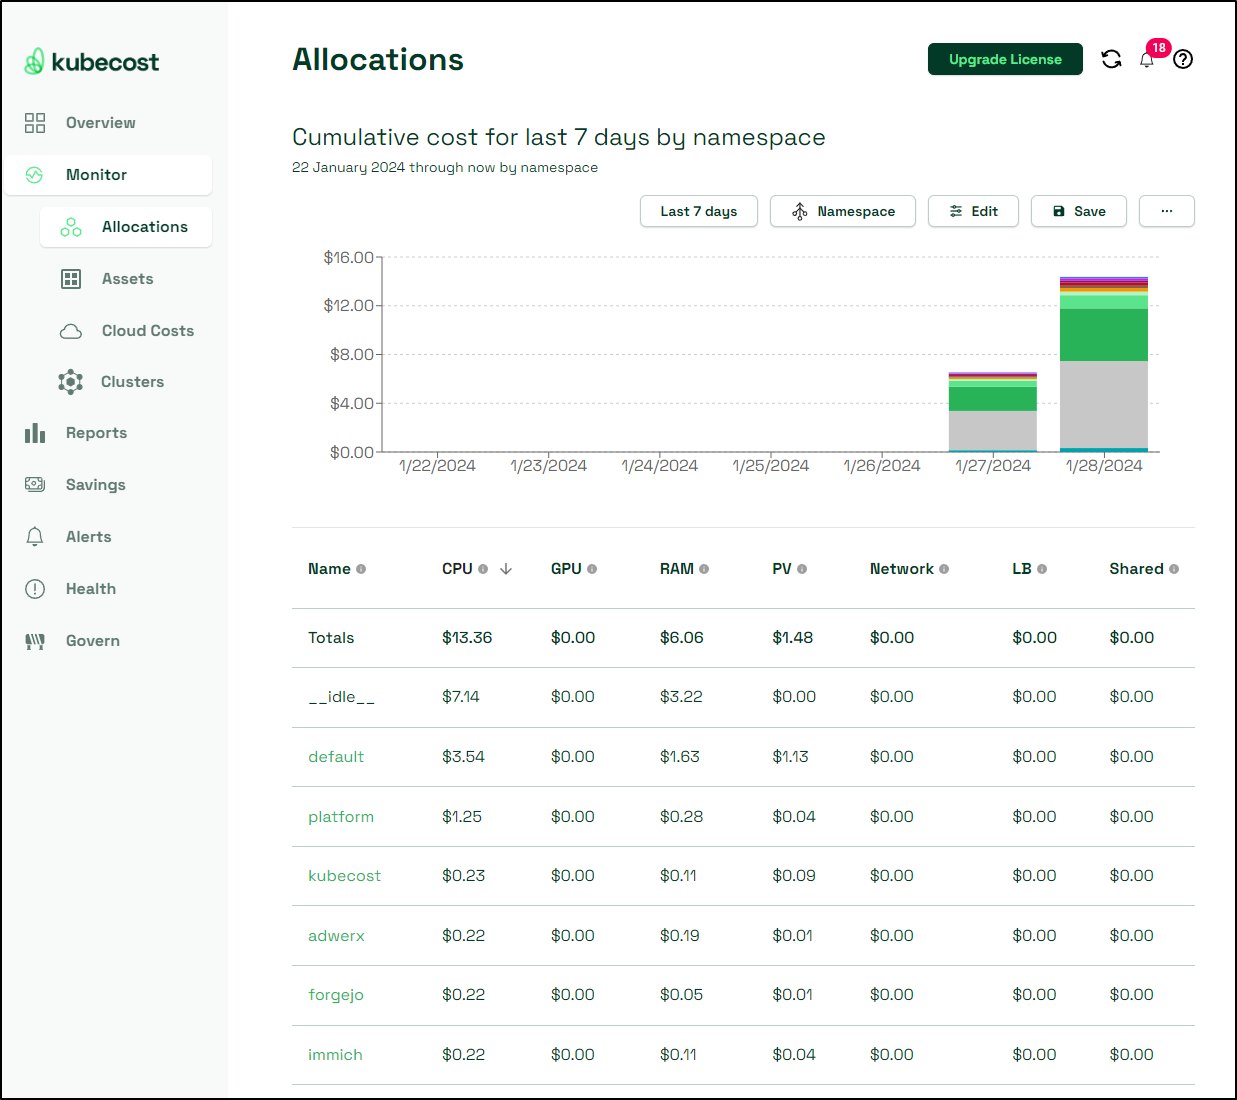
Another great report is looking at the Cumulative costs by CPU. This shows me what namespaces are chewing up resources. At least once I used this to find an old “idea” I left running that was burning cycles unnecessarily.
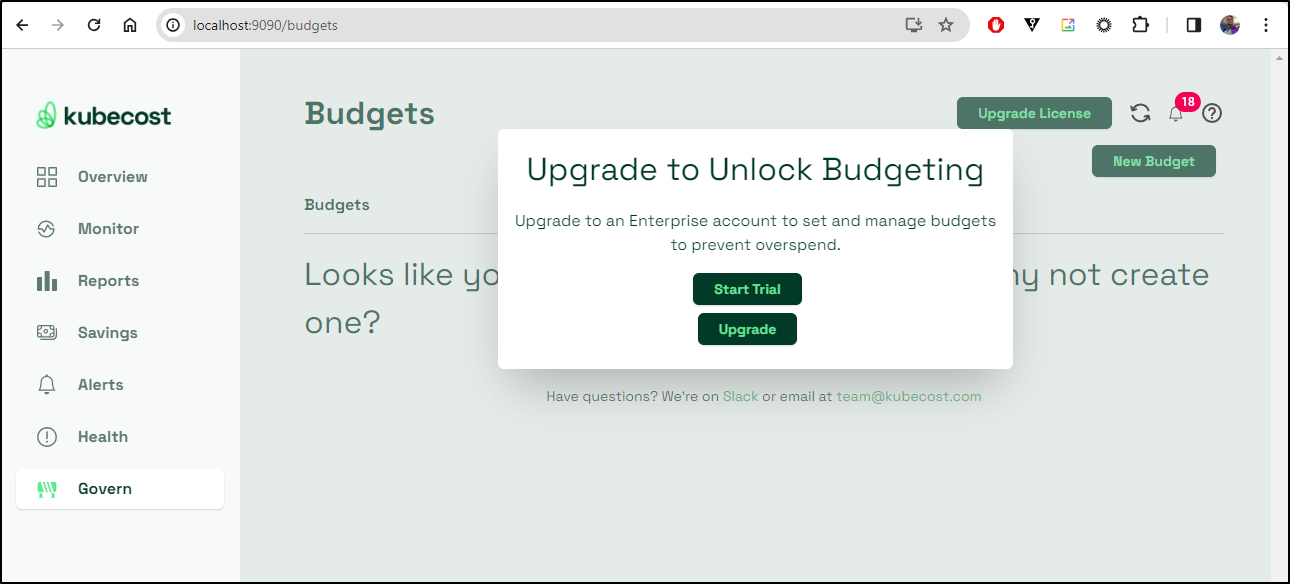
In this latest release they’ve added a button you cannot use without an enterprise license. I find this rather annoying. This feels like Ad-ware
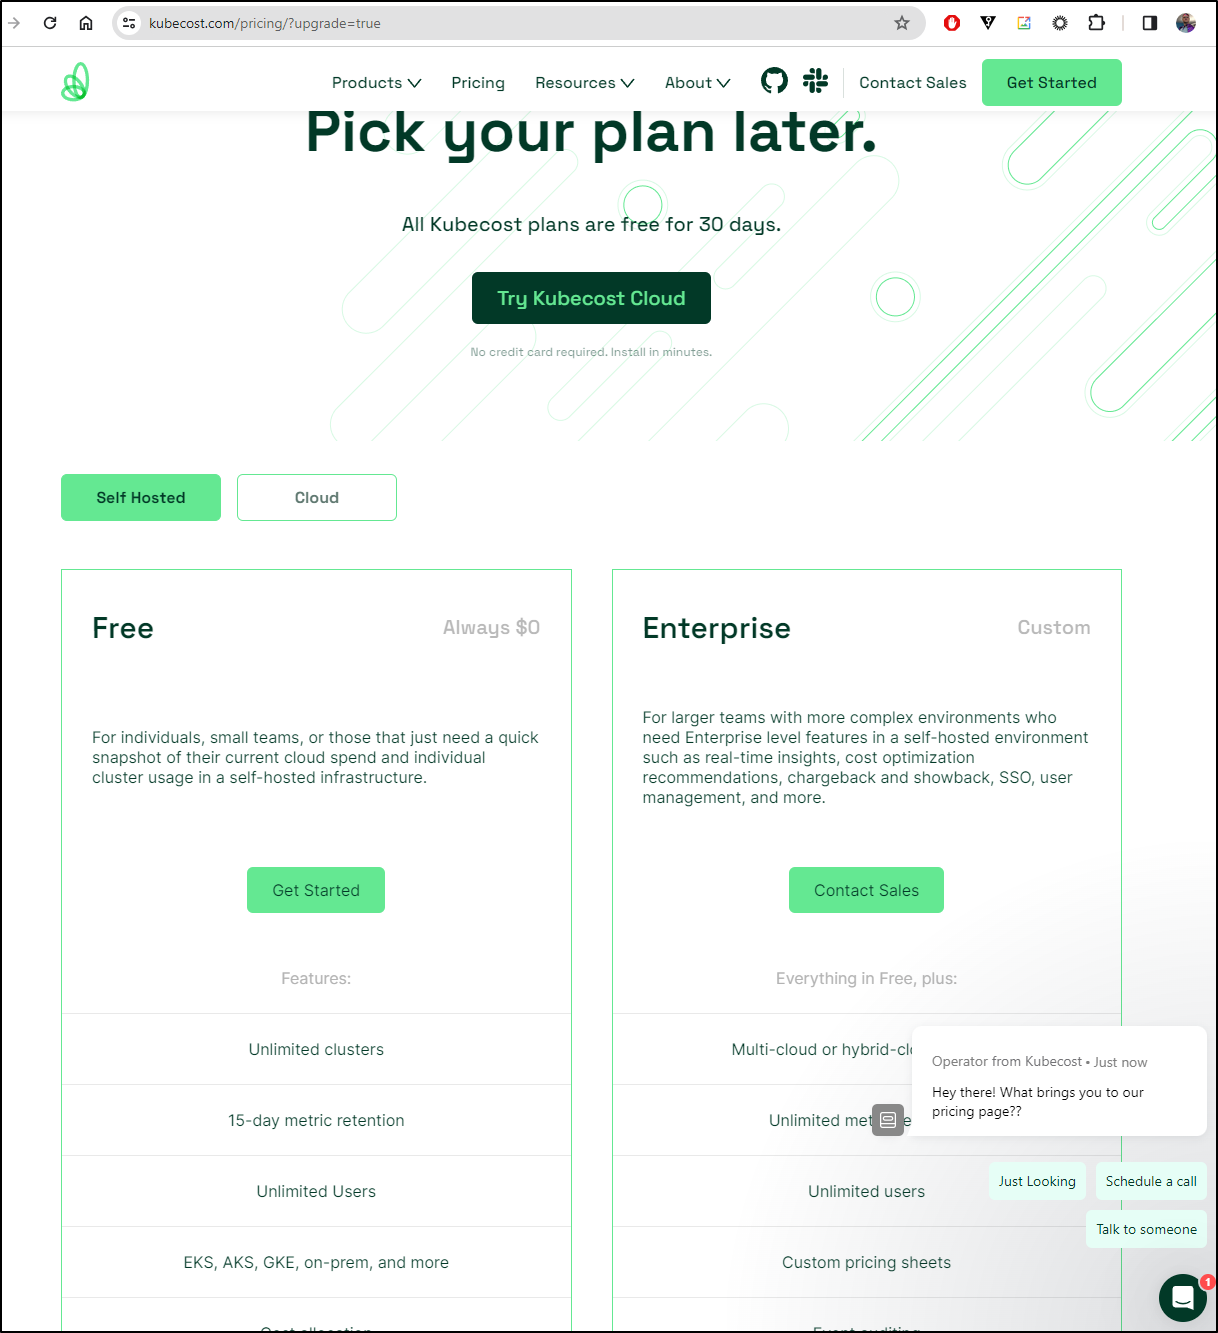
And of course, if I chose to “Upgrade” it get no prices (boooo!!!!)
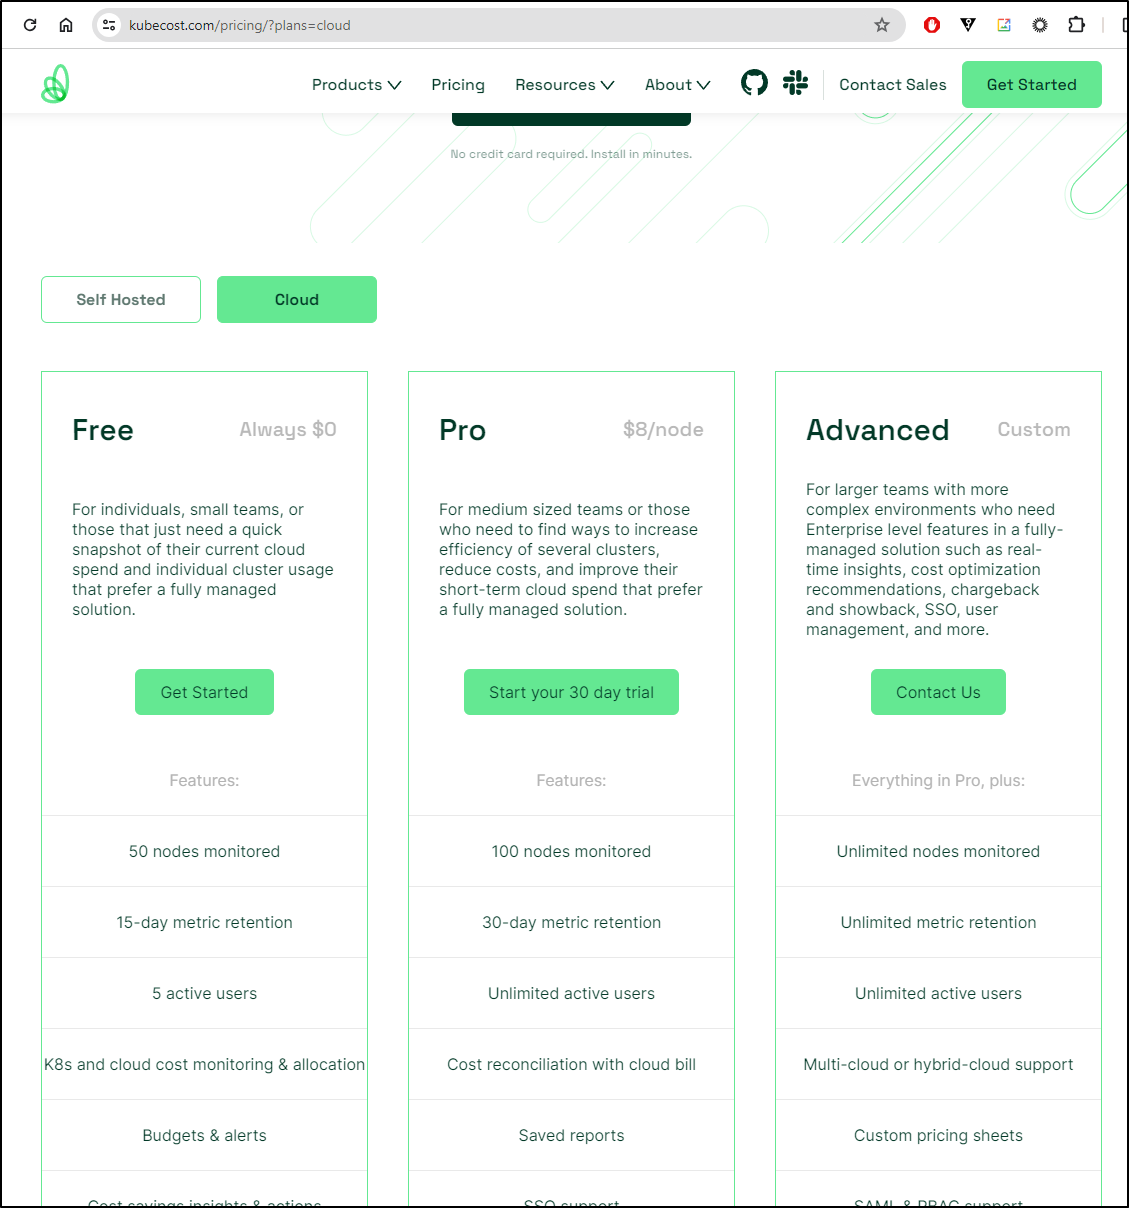
Though, if you chose the SaaS option, there are prices, and I should add they have added features like budgets/alerts to free which is nice
Alerts
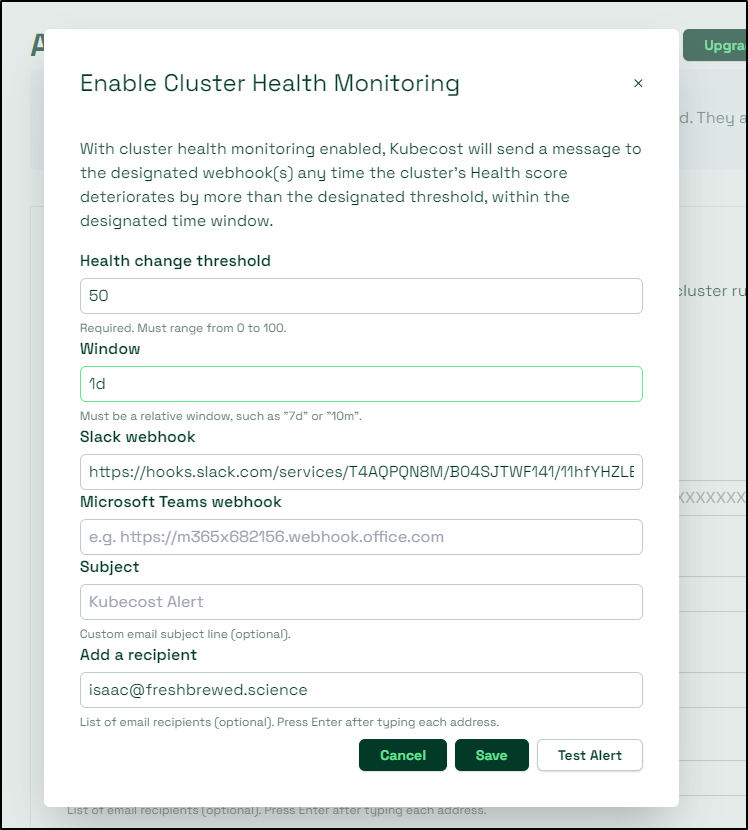
Let’s add an alert for Cluster Health Monitoring
Here, when I test it, I can see outputs to Slack
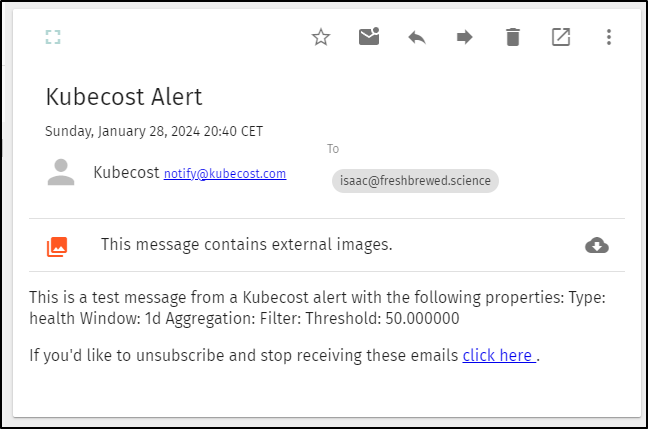
and email
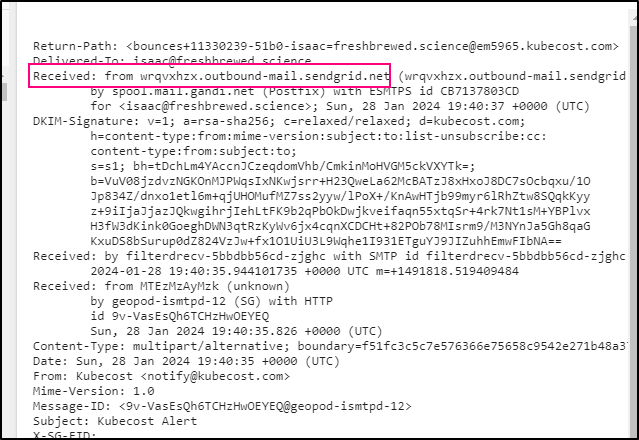
I was a bit curious how they were emailing and it seems they use Sendgrid
The Kubecost Health Monitoring is more about notifying when it cannot connect to its storage. I’m not sure if that is just Prom or Prom and its PVCs. Either way, I see that as an Infra outage and should treat it as such.
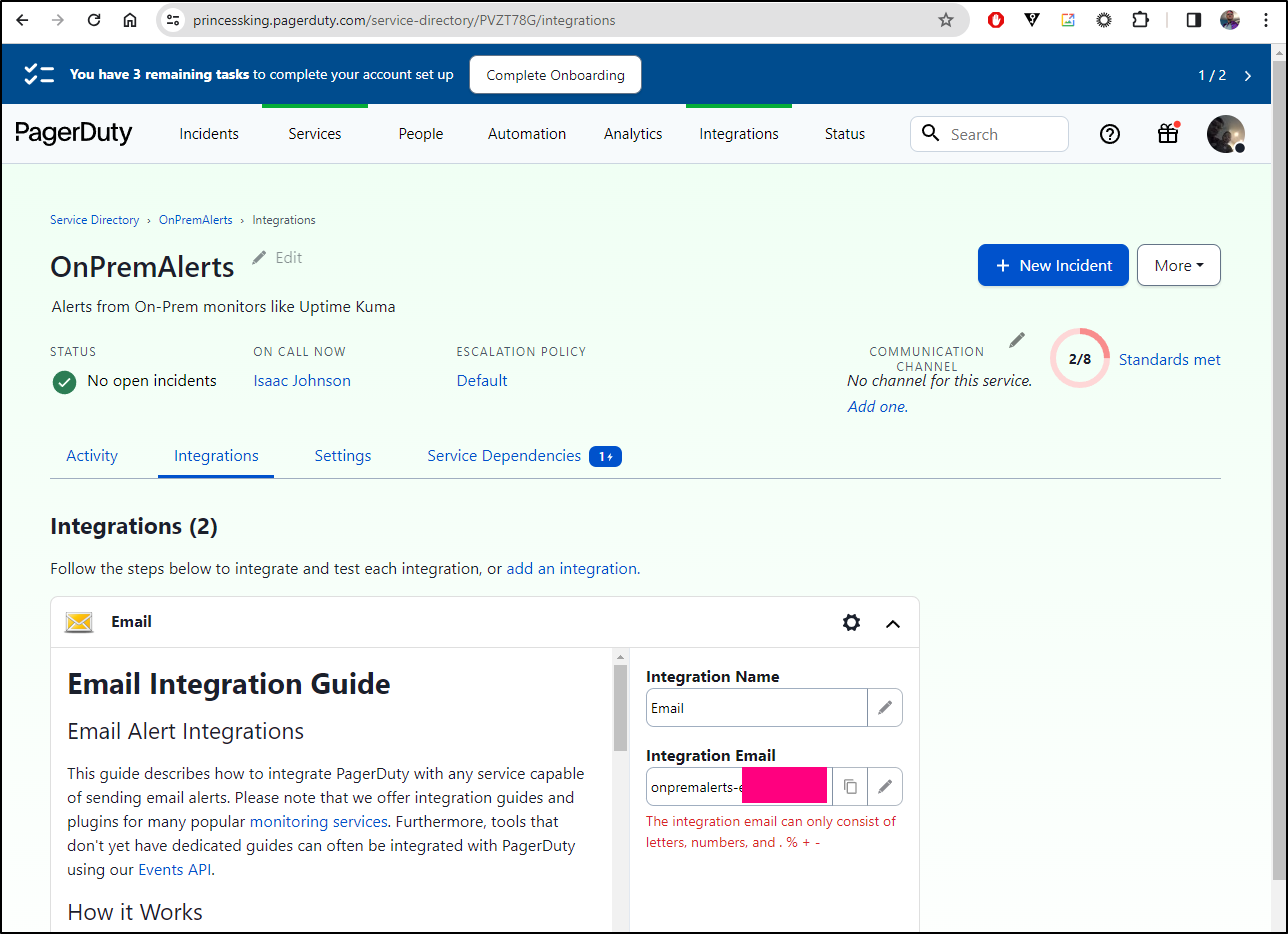
I’ll grab the email for my OnPremAlerts in PagerDuty
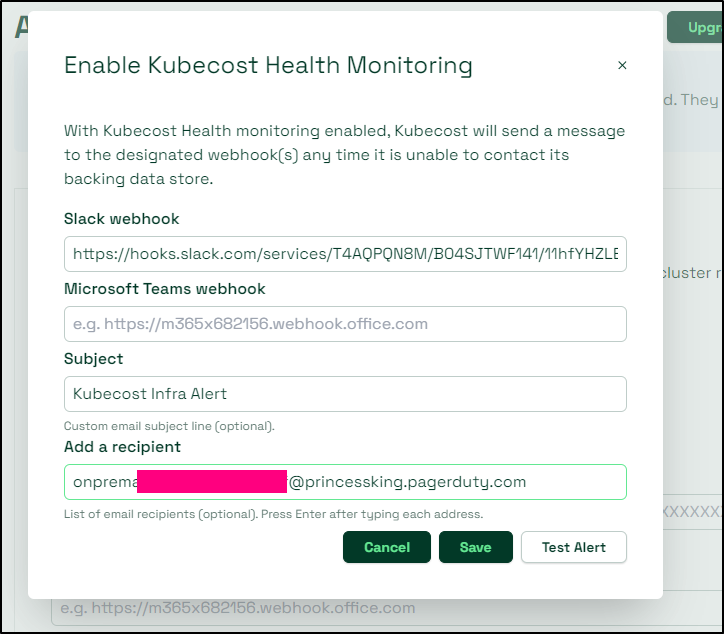
And use that in the settings
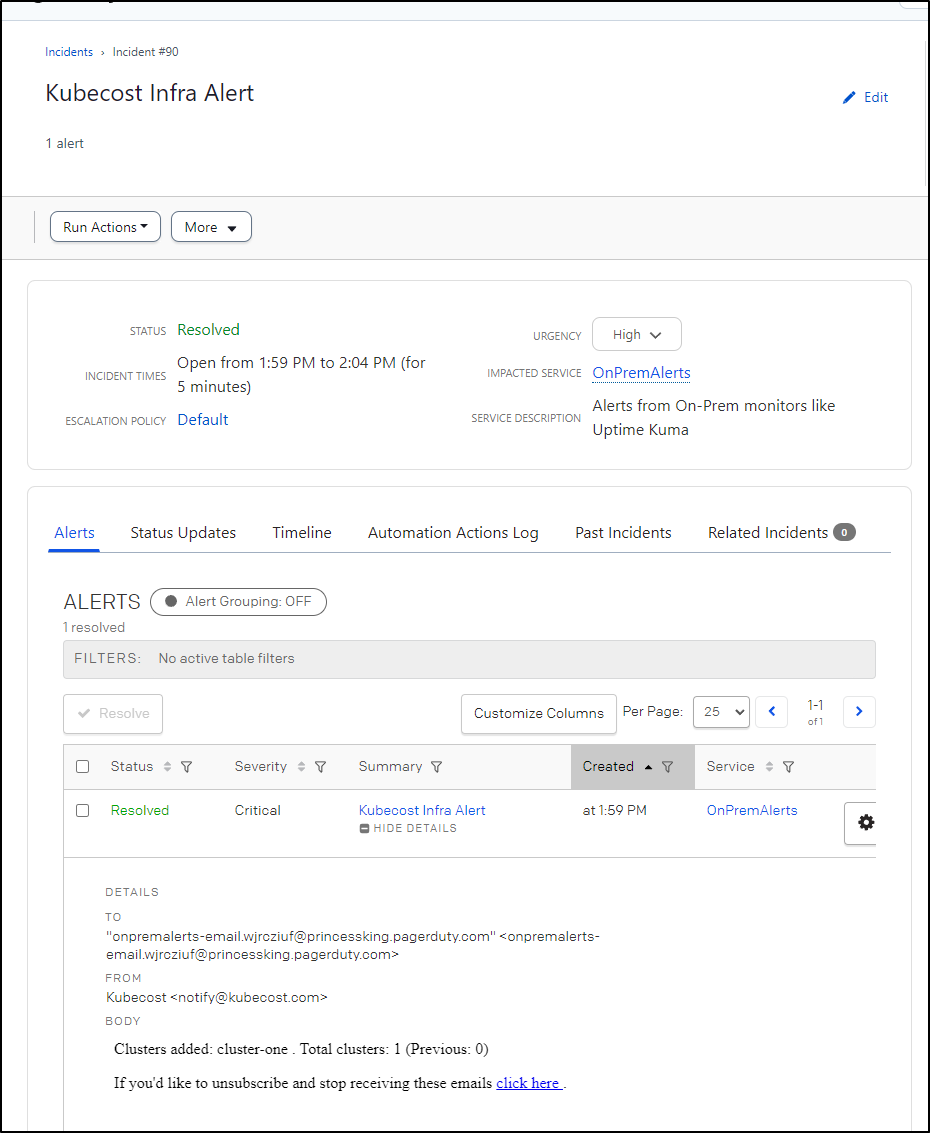
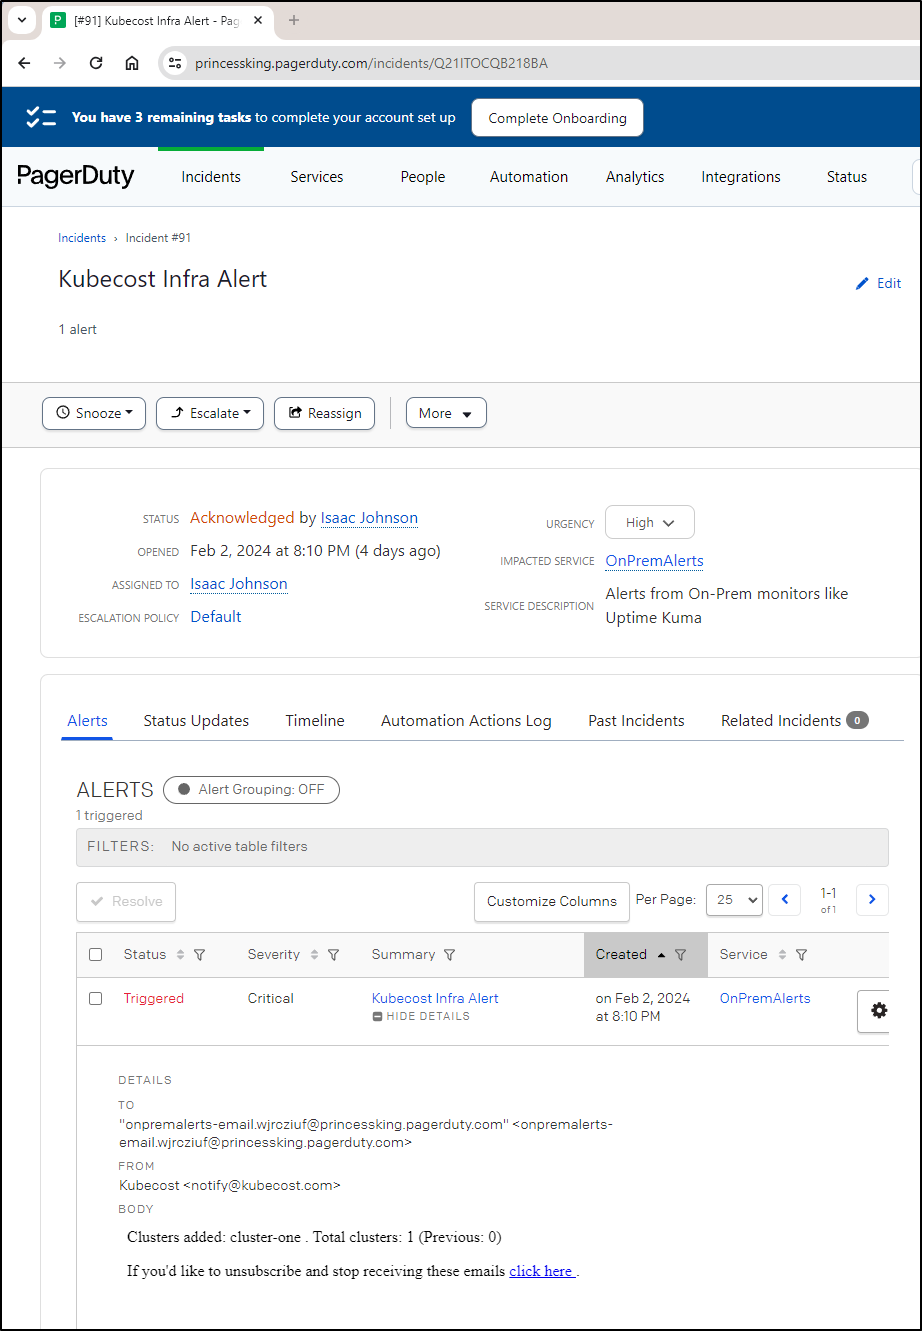
I was a bit thrown by getting a PagerDuty alert about 15 minutes later. When I went to check, it seems to have suggested Kubecost “added” a new cluster.
I’ll be keeping an eye on this in case it ends up being noisy (in which case it cannot use PD which is my ring-my-phone option).
Update
In the weeks that followed, I only got paged a could times. For instance, when a cluster came back online
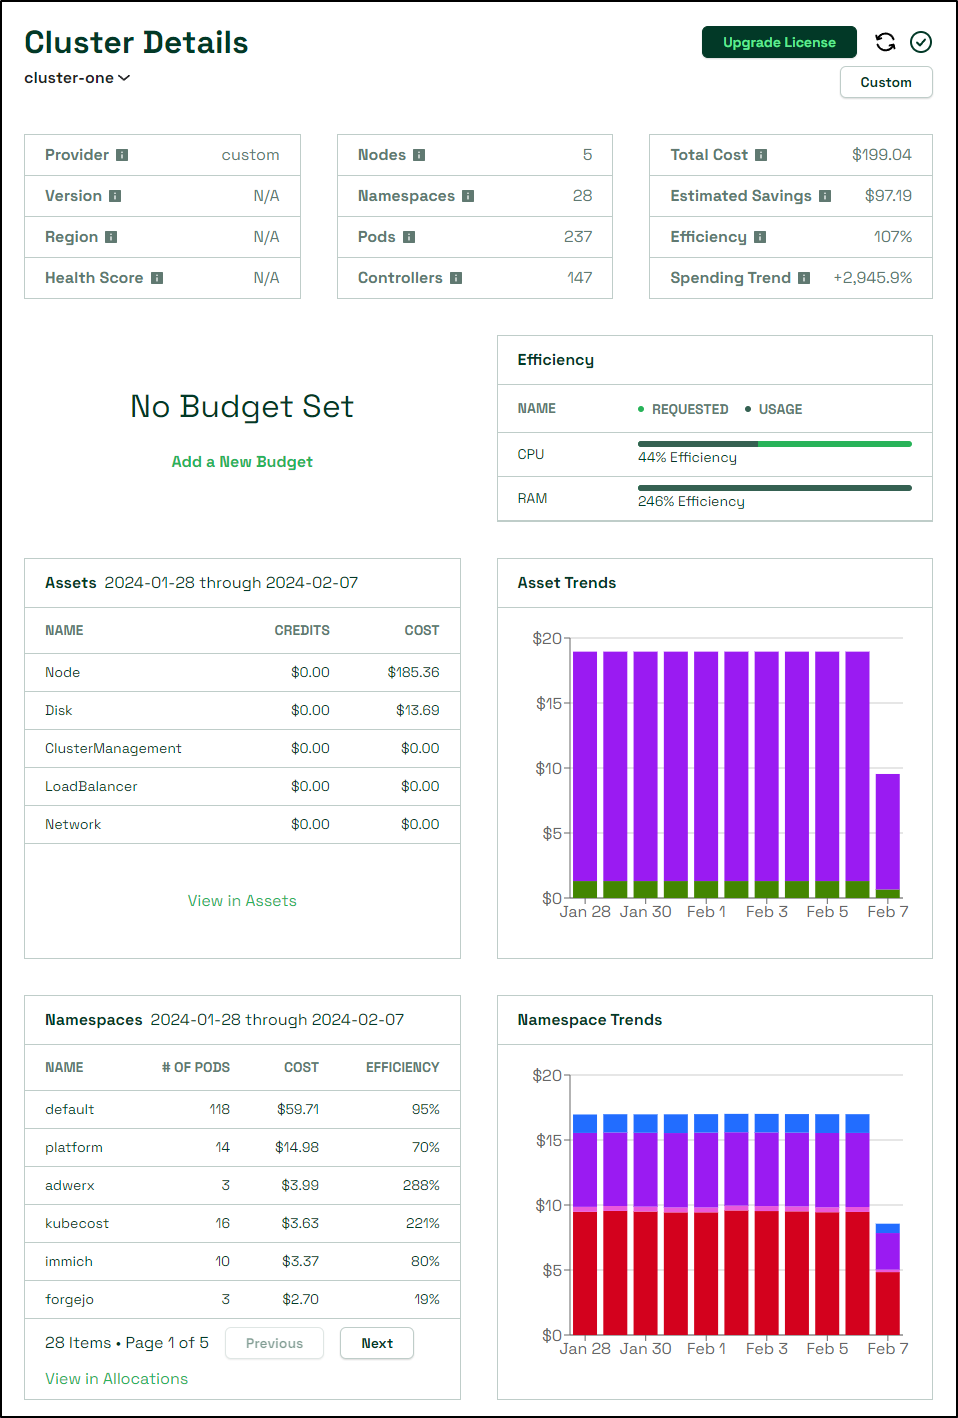
Looking at a few days of data, we can see it’s pretty consistent on usage
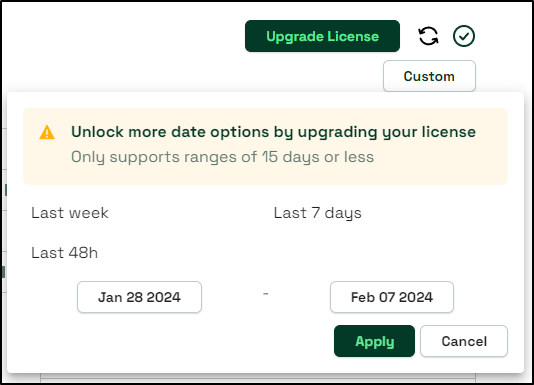
However, we can only look at two weeks of data due to a paywall
This does not bother me too much as I also run OpenCost
Doing a port forward to that
$ kubectl port-forward svc/opencost 9090:9090
Forwarding from 127.0.0.1:9090 -> 9090
Forwarding from [::1]:9090 -> 9090
Handling connection for 9090
Handling connection for 9090
Handling connection for 9090
Handling connection for 9090
Handling connection for 9090
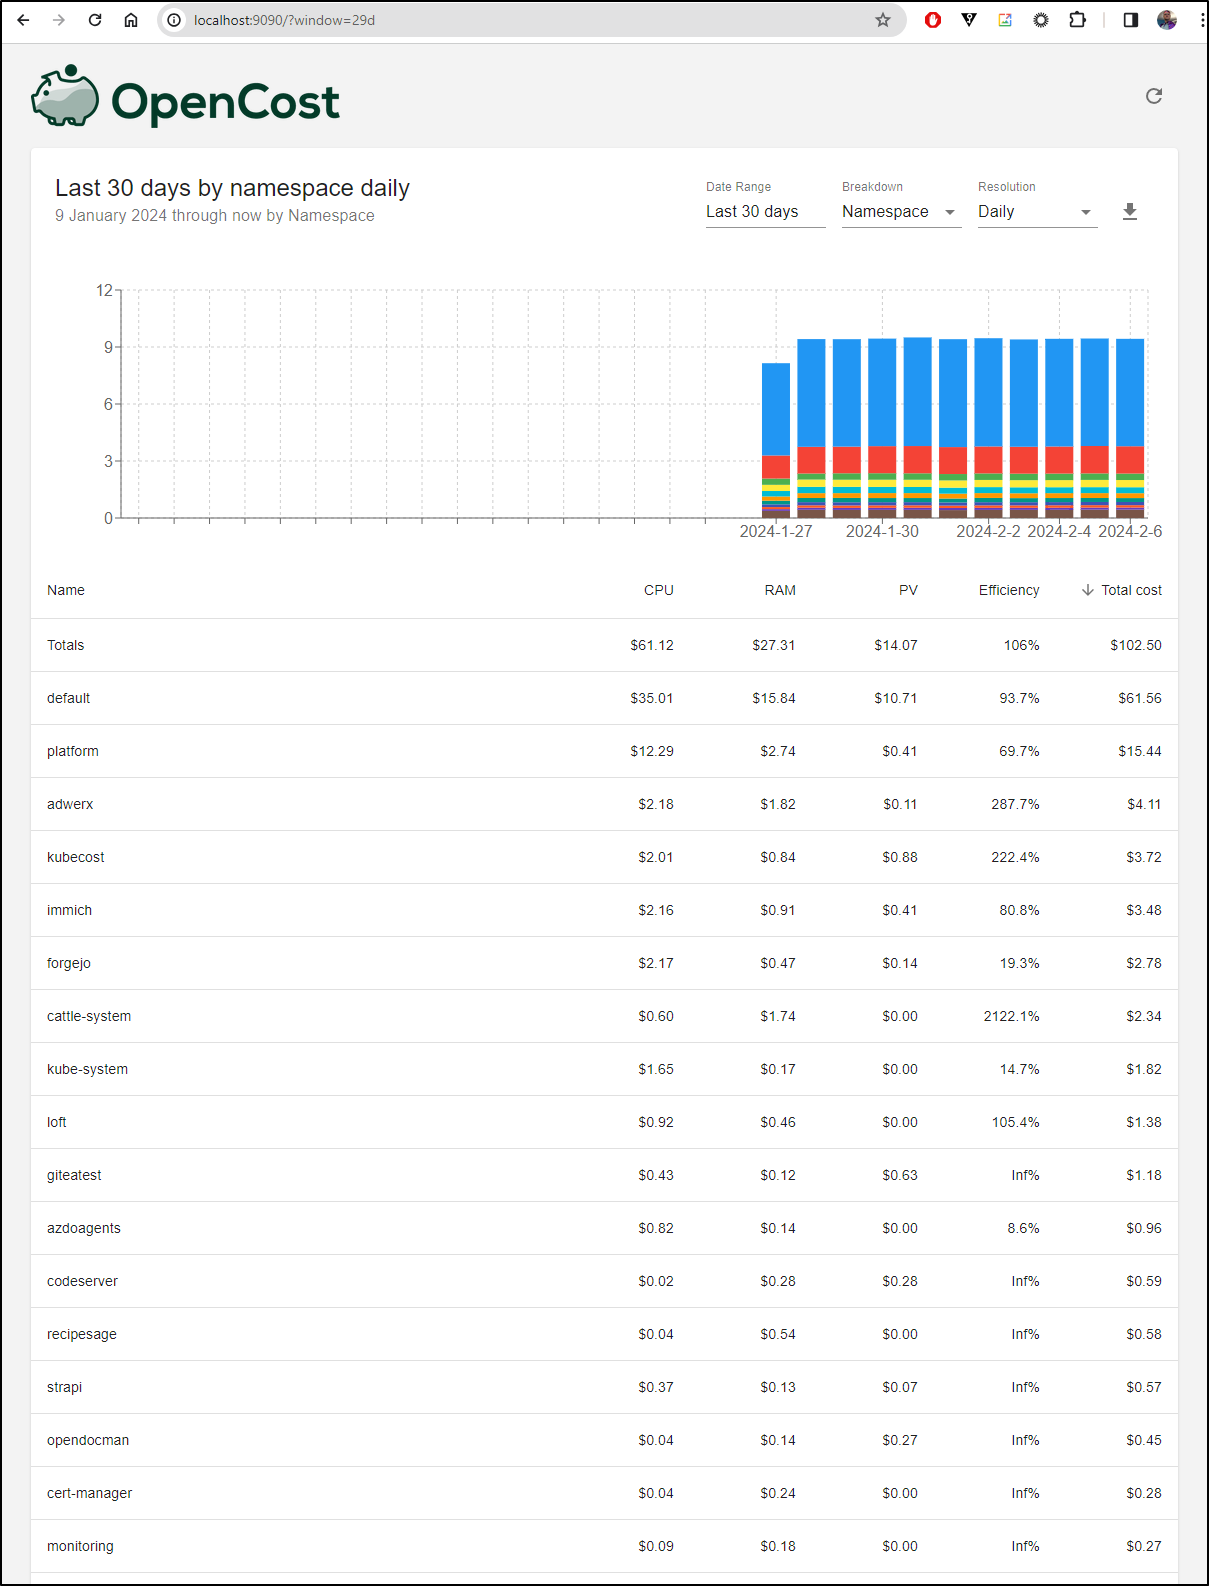
Can fetch data as far back as it has collected
Presently, I’m running version 1.103.1 from chart 1.14.0
$ helm list | grep open
opencost                                default         1               2023-05-17 09:12:38.435624112 -0500 CDT deployed        opencost-1.14.0                 1.103.1
otelcol                                 default         5               2023-01-11 07:24:33.952482006 -0600 CST deployed        opentelemetry-collector-0.43.2  0.67.0
What is clever about it, though, is it’s really just fetching the data from the Kubecost Prometheus (so I didn’t need two collectors)
$ helm get values opencost
USER-SUPPLIED VALUES:
opencost:
  exporter:
    image:
      registry: gcr.io
      repository: kubecost1/opencost
      tag: kc-eu-2023
  prometheus:
    external:
      enabled: true
      url: http://kubecost-prometheus-server.kubecost.svc
    internal:
      enabled: false
Let’s upgrade to the latest and see if there are new features
$ helm repo add opencost-charts https://opencost.github.io/opencost-helm-chart
"opencost-charts" has been added to your repositories

$ helm repo update
Hang tight while we grab the latest from your chart repositories...
...Successfully got an update from the "opencost-charts" chart repository
...Successfully got an update from the "opencost" chart repository
...Successfully got an update from the "azure-samples" chart repository
...Successfully got an update from the "jfelten" chart repository
...Successfully got an update from the "kuma" chart repository
...Successfully got an update from the "confluentinc" chart repository
...Successfully got an update from the "sonarqube" chart repository
...Successfully got an update from the "jetstack" chart repository
...Successfully got an update from the "makeplane" chart repository
...Successfully got an update from the "actions-runner-controller" chart repository
...Successfully got an update from the "gitea-charts" chart repository
...Successfully got an update from the "lifen-charts" chart repository
...Successfully got an update from the "rook-release" chart repository
...Successfully got an update from the "portainer" chart repository
...Successfully got an update from the "crossplane-stable" chart repository
...Successfully got an update from the "akomljen-charts" chart repository
...Successfully got an update from the "elastic" chart repository
...Successfully got an update from the "rancher-latest" chart repository
...Successfully got an update from the "rhcharts" chart repository
...Successfully got an update from the "nginx-stable" chart repository
...Successfully got an update from the "zabbix-community" chart repository
...Successfully got an update from the "sumologic" chart repository
...Successfully got an update from the "adwerx" chart repository
...Successfully got an update from the "harbor" chart repository
...Successfully got an update from the "kube-state-metrics" chart repository
...Successfully got an update from the "nfs" chart repository
...Successfully got an update from the "ngrok" chart repository
...Successfully got an update from the "dapr" chart repository
...Successfully got an update from the "datadog" chart repository
...Unable to get an update from the "freshbrewed" chart repository (https://harbor.freshbrewed.science/chartrepo/library):
        failed to fetch https://harbor.freshbrewed.science/chartrepo/library/index.yaml : 404 Not Found
...Unable to get an update from the "myharbor" chart repository (https://harbor.freshbrewed.science/chartrepo/library):
        failed to fetch https://harbor.freshbrewed.science/chartrepo/library/index.yaml : 404 Not Found
...Successfully got an update from the "btungut" chart repository
...Successfully got an update from the "novum-rgi-helm" chart repository
...Successfully got an update from the "ingress-nginx" chart repository
...Successfully got an update from the "openfunction" chart repository
...Successfully got an update from the "longhorn" chart repository
...Successfully got an update from the "hashicorp" chart repository
...Successfully got an update from the "kiwigrid" chart repository
...Successfully got an update from the "incubator" chart repository
...Successfully got an update from the "spacelift" chart repository
...Successfully got an update from the "castai-helm" chart repository
...Successfully got an update from the "kubecost" chart repository
...Successfully got an update from the "signoz" chart repository
...Successfully got an update from the "openzipkin" chart repository
...Successfully got an update from the "open-telemetry" chart repository
...Successfully got an update from the "argo-cd" chart repository
...Successfully got an update from the "ananace-charts" chart repository
...Successfully got an update from the "uptime-kuma" chart repository
...Successfully got an update from the "newrelic" chart repository
...Successfully got an update from the "gitlab" chart repository
...Successfully got an update from the "grafana" chart repository
...Successfully got an update from the "bitnami" chart repository
...Successfully got an update from the "prometheus-community" chart repository
...Unable to get an update from the "epsagon" chart repository (https://helm.epsagon.com):
        Get "https://helm.epsagon.com/index.yaml": dial tcp: lookup helm.epsagon.com on 172.22.64.1:53: server misbehaving
Update Complete. ⎈Happy Helming!⎈
I did a quick peek at the current helm values for the chart to be sure I didn’t miss anything, but once confirmed, upgrading was as simply as dumping my current valeus and doing a helm upgrade
$ helm get values opencost -o yaml > opencost.values.yaml
$ helm upgrade opencost opencost-charts/opencost -f ./opencost.values.yaml
Release "opencost" has been upgraded. Happy Helming!
NAME: opencost
LAST DEPLOYED: Wed Feb  7 06:26:09 2024
NAMESPACE: default
STATUS: deployed
REVISION: 2
TEST SUITE: None
I actually caught a quick issue. I had set the specific image in my values
$ helm get values opencost -o yaml
opencost:
  exporter:
    image:
      registry: gcr.io
      repository: kubecost1/opencost
      tag: kc-eu-2023
  prometheus:
    external:
      enabled: true
      url: http://kubecost-prometheus-server.kubecost.svc
    internal:
      enabled: false
The latest is actually over in quay.io not GCR.
I updated to the proper image:
$ cat opencost.values.yaml
opencost:
  exporter:
    image:
      registry: quay.io
      repository: kubecost1/kubecost-cost-model
      tag: ""
  prometheus:
    external:
      enabled: true
      url: http://kubecost-prometheus-server.kubecost.svc
    internal:
      enabled: false
This time it took a few minutes to come up
$ kubectl get pod -l app.kubernetes.io/name=opencost
NAME                       READY   STATUS    RESTARTS   AGE
opencost-cb984b766-5n8mn   2/2     Running   0          3m20s
I think it was due to some old data on unmounted PVCs (from a prior Gitea)
$ kubectl logs opencost-cb984b766-5n8mn
Defaulted container "opencost" out of: opencost, opencost-ui
2024-02-07T12:30:26.11723109Z ??? Log level set to info
2024-02-07T12:30:26.117937899Z INF Starting cost-model version 1.108.0 (25d0064)
2024-02-07T12:30:26.117999347Z INF Prometheus/Thanos Client Max Concurrency set to 5
2024-02-07T12:30:26.133044116Z INF Success: retrieved the 'up' query against prometheus at: http://kubecost-prometheus-server.kubecost.svc
2024-02-07T12:30:26.137764604Z INF Retrieved a prometheus config file from: http://kubecost-prometheus-server.kubecost.svc
2024-02-07T12:30:26.141746906Z INF Using scrape interval of 60.000000
2024-02-07T12:30:26.142502041Z INF NAMESPACE: kubecost
2024-02-07T12:30:27.043696086Z INF Done waiting
2024-02-07T12:30:27.044013503Z INF Starting *v1.Deployment controller
2024-02-07T12:30:27.044253443Z INF Starting *v1.Namespace controller
2024-02-07T12:30:27.044303058Z INF Starting *v1.StatefulSet controller
2024-02-07T12:30:27.044337145Z INF Starting *v1.ReplicaSet controller
2024-02-07T12:30:27.044349672Z INF Starting *v1.Service controller
2024-02-07T12:30:27.044365081Z INF Starting *v1.PersistentVolume controller
2024-02-07T12:30:27.044394376Z INF Starting *v1.Node controller
2024-02-07T12:30:27.044396972Z INF Starting *v1.PersistentVolumeClaim controller
2024-02-07T12:30:27.04442263Z INF Starting *v1.Pod controller
2024-02-07T12:30:27.044424583Z INF Starting *v1.StorageClass controller
2024-02-07T12:30:27.044448724Z INF Starting *v1.ConfigMap controller
2024-02-07T12:30:27.044451017Z INF Starting *v1.Job controller
2024-02-07T12:30:27.044476637Z INF Starting *v1.ReplicationController controller
2024-02-07T12:30:27.04450075Z INF Starting *v1beta1.PodDisruptionBudget controller
2024-02-07T12:30:27.044673376Z INF Starting *v1.DaemonSet controller
2024-02-07T12:30:27.065100155Z INF Unsupported provider, falling back to default
2024-02-07T12:30:27.182644557Z INF No pricing-configs configmap found at install time, using existing configs: configmaps "pricing-configs" not found
2024-02-07T12:30:27.296704924Z INF No metrics-config configmap found at install time, using existing configs: configmaps "metrics-config" not found
2024-02-07T12:30:27.297392041Z INF Init: AggregateCostModel cache warming enabled
2024-02-07T12:30:27.297503955Z INF EXPORT_CSV_FILE is not set, CSV export is disabled
2024-02-07T12:30:27.297839364Z INF aggregation: cache warming defaults: 1d::::::::namespace::::weighted:false:false:true
2024-02-07T12:30:27.29790814Z INF ComputeAggregateCostModel: missed cache: 1d:1m:1.000000h:false (found false, disableAggregateCostModelCache true, noCache false)
2024-02-07T12:30:27.297977894Z WRN Failed to locate default region
2024-02-07T12:30:27.310657258Z WRN Failed to load 'name' field for ClusterInfo
2024-02-07T12:30:27.880785727Z WRN Metric emission: error getting LoadBalancer cost: strconv.ParseFloat: parsing "": invalid syntax
2024-02-07T12:30:27.880861288Z INF ComputeAggregateCostModel: setting L2 cache: 1d:1m:1.000000h:false
2024-02-07T12:30:27.883674424Z ERR Metric emission: failed to delete RAMAllocation with labels: [giteatest unmounted-pvs unmounted-pvs  ]
2024-02-07T12:30:27.883844951Z ERR Metric emission: failed to delete CPUAllocation with labels: [giteatest unmounted-pvs unmounted-pvs  ]
2024-02-07T12:30:27.883912753Z ERR Metric emission: failed to delete GPUAllocation with labels: [giteatest unmounted-pvs unmounted-pvs  ]
2024-02-07T12:30:27.884010662Z ERR Metric emission: failed to delete RAMAllocation with labels: [default unmounted-pvs unmounted-pvs  ]
2024-02-07T12:30:27.884064128Z ERR Metric emission: failed to delete CPUAllocation with labels: [default unmounted-pvs unmounted-pvs  ]
2024-02-07T12:30:27.884107738Z ERR Metric emission: failed to delete GPUAllocation with labels: [default unmounted-pvs unmounted-pvs  ]
2024-02-07T12:30:27.894369853Z INF ComputeAggregateCostModel: setting aggregate cache: 1d::::::::namespace::::weighted:false:false:true
2024-02-07T12:30:28.04384772Z INF caching 1d cluster costs for 11m0s
2024-02-07T12:30:28.043893709Z INF aggregation: warm cache: 1d
2024-02-07T12:30:28.299257787Z INF Flushing cost data caches: :0%
2024-02-07T12:31:27.929712188Z WRN No request or usage data found during CPU allocation calculation. Setting allocation to 0.
2024-02-07T12:31:27.930575686Z WRN No request or usage data found during CPU allocation calculation. Setting allocation to 0.
2024-02-07T12:31:27.939911926Z WRN Metric emission: error getting LoadBalancer cost: strconv.ParseFloat: parsing "": invalid syntax
2024-02-07T12:31:27.941441788Z ERR Metric emission: failed to delete RAMAllocation with labels: [giteatest unmounted-pvs unmounted-pvs  ]
2024-02-07T12:31:27.941468369Z ERR Metric emission: failed to delete CPUAllocation with labels: [giteatest unmounted-pvs unmounted-pvs  ]
2024-02-07T12:31:27.941478248Z ERR Metric emission: failed to delete GPUAllocation with labels: [giteatest unmounted-pvs unmounted-pvs  ]
2024-02-07T12:31:27.941522574Z ERR Metric emission: failed to delete RAMAllocation with labels: [default unmounted-pvs unmounted-pvs  ]
2024-02-07T12:31:27.941546939Z ERR Metric emission: failed to delete CPUAllocation with labels: [default unmounted-pvs unmounted-pvs  ]
2024-02-07T12:31:27.941569898Z ERR Metric emission: failed to delete GPUAllocation with labels: [default unmounted-pvs unmounted-pvs  ]
2024-02-07T12:32:27.970317657Z WRN Metric emission: error getting LoadBalancer cost: strconv.ParseFloat: parsing "": invalid syntax
2024-02-07T12:32:27.972171883Z ERR Metric emission: failed to delete RAMAllocation with labels: [default unmounted-pvs unmounted-pvs  ]
2024-02-07T12:32:27.97220194Z ERR Metric emission: failed to delete CPUAllocation with labels: [default unmounted-pvs unmounted-pvs  ]
2024-02-07T12:32:27.972213251Z ERR Metric emission: failed to delete GPUAllocation with labels: [default unmounted-pvs unmounted-pvs  ]
2024-02-07T12:32:27.972243882Z ERR Metric emission: failed to delete RAMAllocation with labels: [giteatest unmounted-pvs unmounted-pvs  ]
2024-02-07T12:32:27.972266024Z ERR Metric emission: failed to delete CPUAllocation with labels: [giteatest unmounted-pvs unmounted-pvs  ]
2024-02-07T12:32:27.972286617Z ERR Metric emission: failed to delete GPUAllocation with labels: [giteatest unmounted-pvs unmounted-pvs  ]
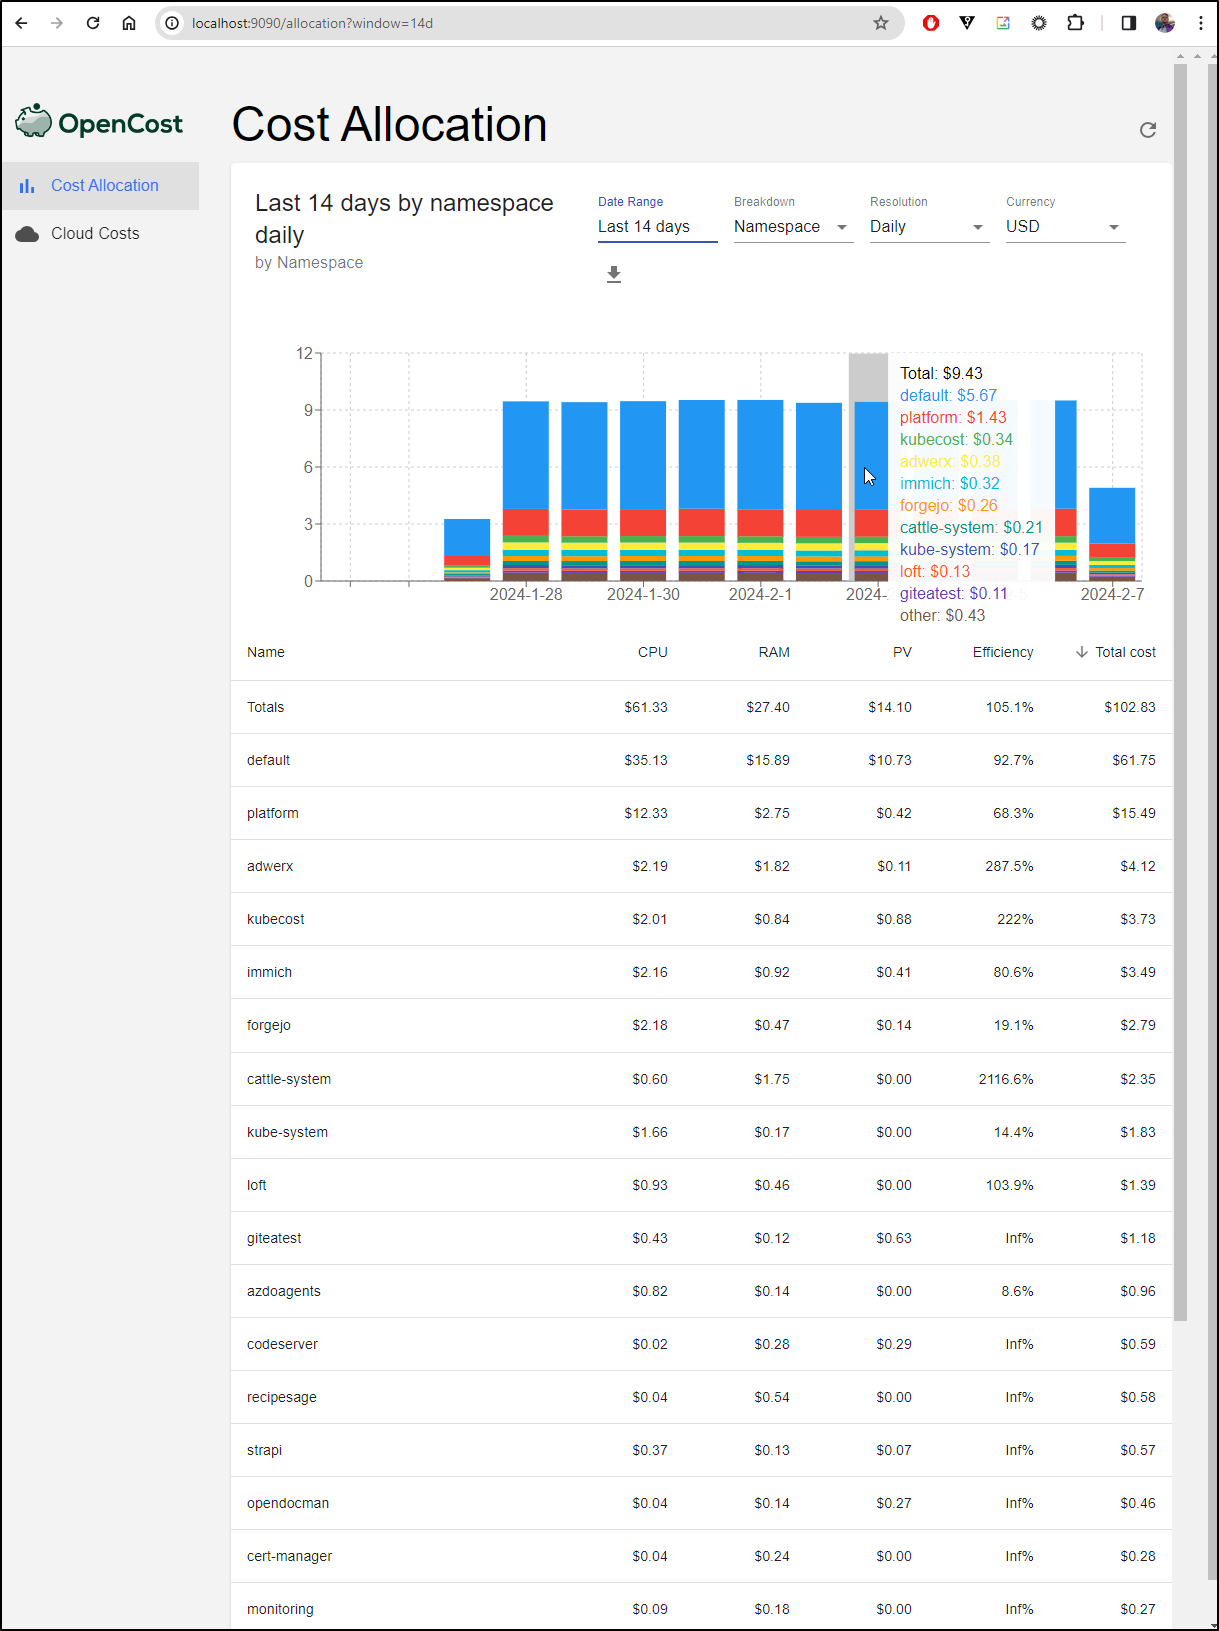
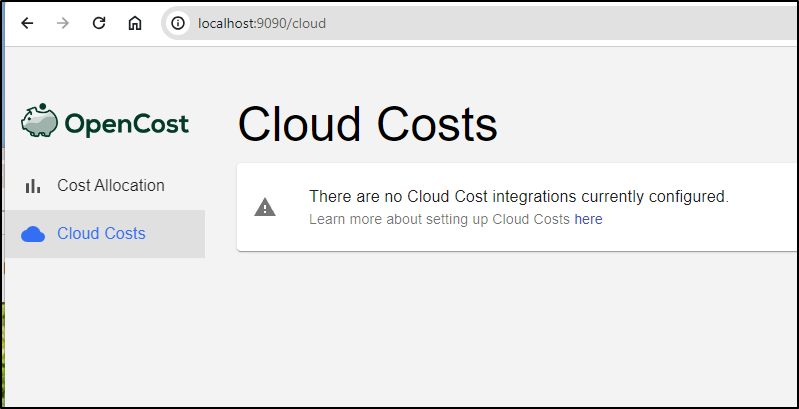
The new UI isn’t that much different. It does have a faster hover-over and a new “Cloud Costs” section
Which needs to be configured to be usable.
Recommendations
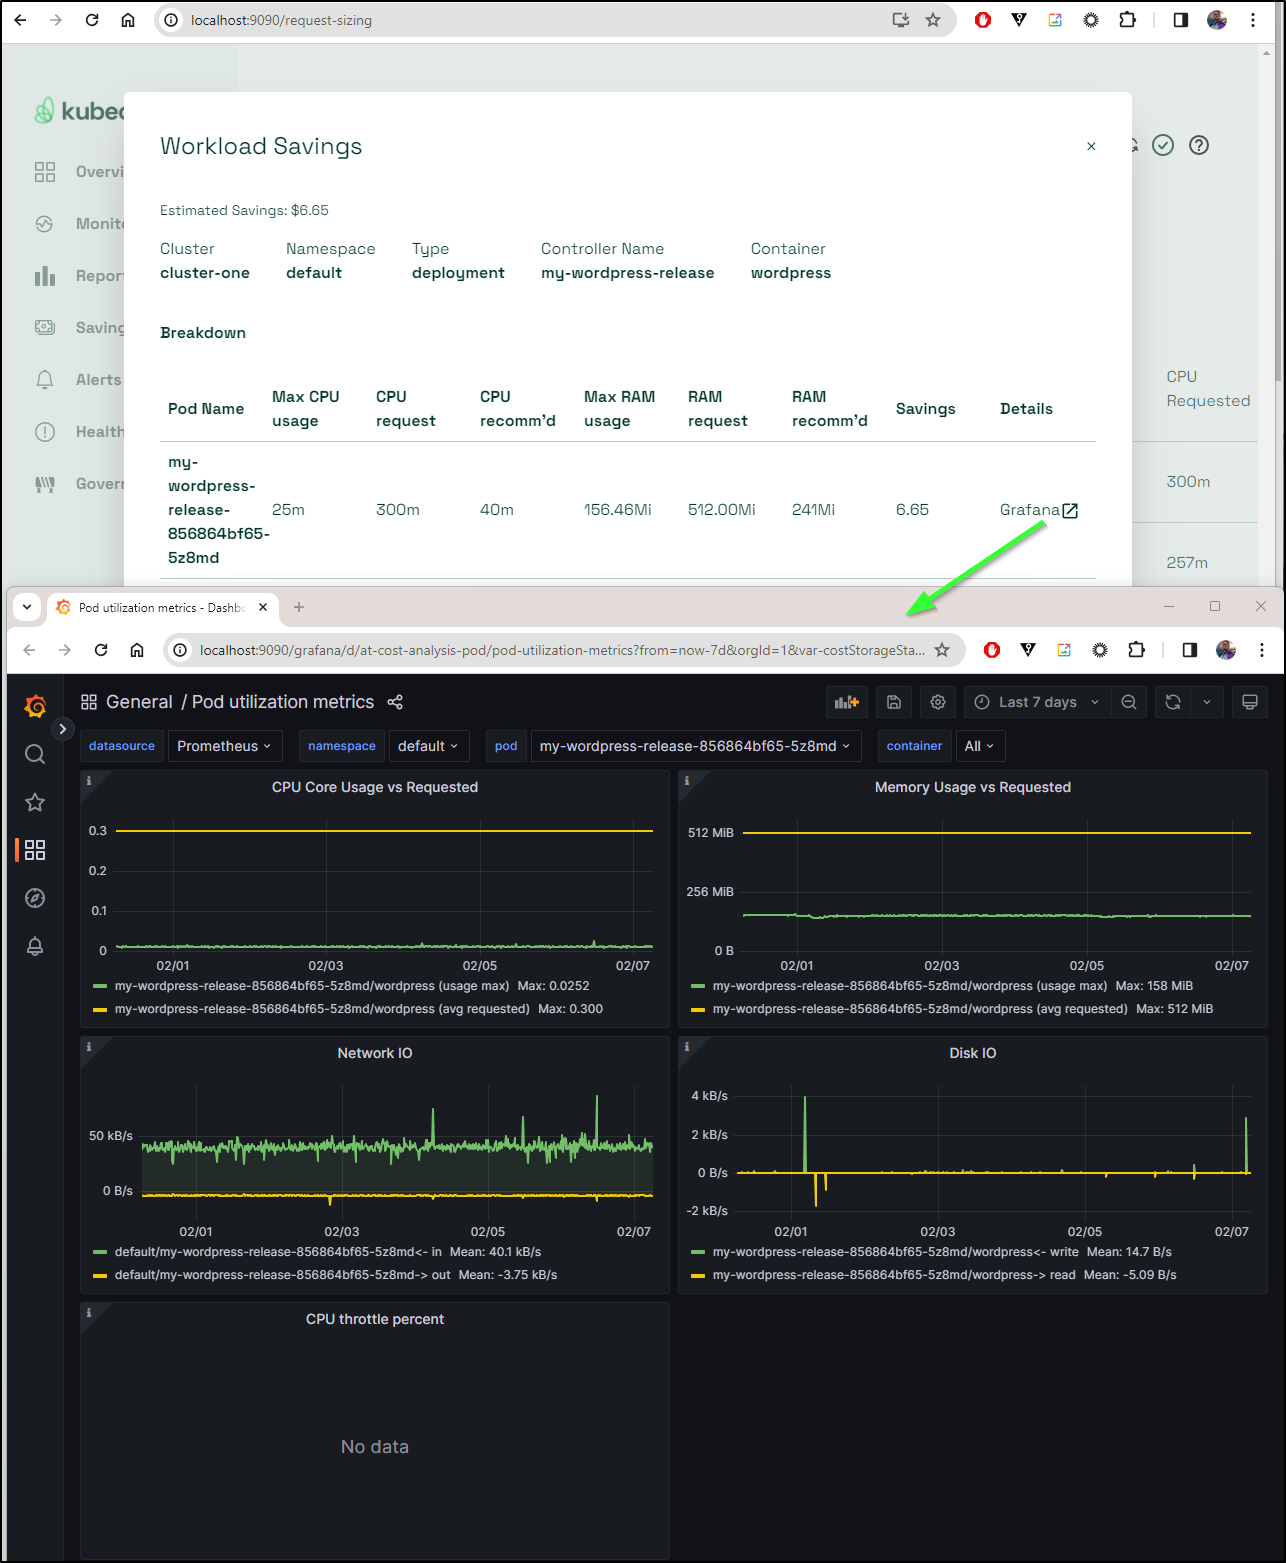
One of the nice features I noticed (once I had collected some new data) was that the Workload Savings recommendations have a link out to Grafana where we can see the specifics behind the request.
For instance, it recommends I right-size my wordpress instance and when I click “Grafana”, I can see recent stats on it:
I tried to load Grafana directly
$ kubectl port-forward svc/kubecost-grafana -n kubecost 8080:80
Forwarding from 127.0.0.1:8080 -> 3000
Forwarding from [::1]:8080 -> 3000
Handling connection for 8080
Handling connection for 8080
Handling connection for 8080
Handling connection for 8080
Handling connection for 8080
Handling connection for 8080
Handling connection for 8080
E0207 06:41:58.250350   11112 portforward.go:381] error copying from remote stream to local connection: readfrom tcp6 [::1]:8080->[::1]:48836: write tcp6 [::1]:8080->[::1]:48836: write: broken pipe
E0207 06:41:58.254090   11112 portforward.go:381] error copying from remote stream to local connection: readfrom tcp6 [::1]:8080->[::1]:48838: write tcp6 [::1]:8080->[::1]:48838: write: broken pipe
Handling connection for 8080
Handling connection for 8080
E0207 06:41:58.297065   11112 portforward.go:381] error copying from remote stream to local connection: readfrom tcp6 [::1]:8080->[::1]:48858: write tcp6 [::1]:8080->[::1]:48858: write: broken pipe
E0207 06:41:58.300948   11112 portforward.go:381] error copying from remote stream to local connection: readfrom tcp6 [::1]:8080->[::1]:48850: write tcp6 [::1]:8080->[::1]:48850: write: broken pipe
E0207 06:41:58.319769   11112 portforward.go:381] error copying from remote stream to local connection: readfrom tcp6 [::1]:8080->[::1]:48862: write tcp6 [::1]:8080->[::1]:48862: write: broken pipe
E0207 06:41:58.319819   11112 portforward.go:381] error copying from remote stream to local connection: readfrom tcp6 [::1]:8080->[::1]:48848: write tcp6 [::1]:8080->[::1]:48848: write: broken pipe

E0207 06:42:28.231252   11112 portforward.go:347] error creating error stream for port 8080 -> 3000: Timeout occurred


$ kubectl port-forward kubecost-grafana-956b98df8-kwpq8 -n kubecost 3033:3000
Forwarding from 127.0.0.1:3033 -> 3000
Forwarding from [::1]:3033 -> 3000
Handling connection for 3033
Handling connection for 3033
Handling connection for 3033
Handling connection for 3033
Handling connection for 3033
Handling connection for 3033
Handling connection for 3033
E0207 06:43:30.255917   11438 portforward.go:381] error copying from remote stream to local connection: readfrom tcp6 [::1]:3033->[::1]:41866: write tcp6 [::1]:3033->[::1]:41866: write: broken pipe
Handling connection for 3033
E0207 06:43:30.262927   11438 portforward.go:381] error copying from remote stream to local connection: readfrom tcp6 [::1]:3033->[::1]:41874: write tcp6 [::1]:3033->[::1]:41874: write: broken pipe
Handling connection for 3033
E0207 06:43:30.307733   11438 portforward.go:381] error copying from remote stream to local connection: readfrom tcp6 [::1]:3033->[::1]:41898: write tcp6 [::1]:3033->[::1]:41898: write: broken pipe
E0207 06:43:30.313134   11438 portforward.go:381] error copying from remote stream to local connection: readfrom tcp6 [::1]:3033->[::1]:41900: write tcp6 [::1]:3033->[::1]:41900: write: broken pipe
E0207 06:43:30.316854   11438 portforward.go:381] error copying from remote stream to local connection: readfrom tcp6 [::1]:3033->[::1]:41912: write tcp6 [::1]:3033->[::1]:41912: write: broken pipe
E0207 06:44:00.251398   11438 portforward.go:347] error creating error stream for port 3033 -> 3000: Timeout occurred
E0207 06:44:00.259830   11438 portforward.go:347] error creating error stream for port 3033 -> 3000: Timeout occurred
E0207 06:44:00.305362   11438 portforward.go:347] error creating error stream for port 3033 -> 3000: Timeout occurred
But whether I went to the pod or service, it just hung
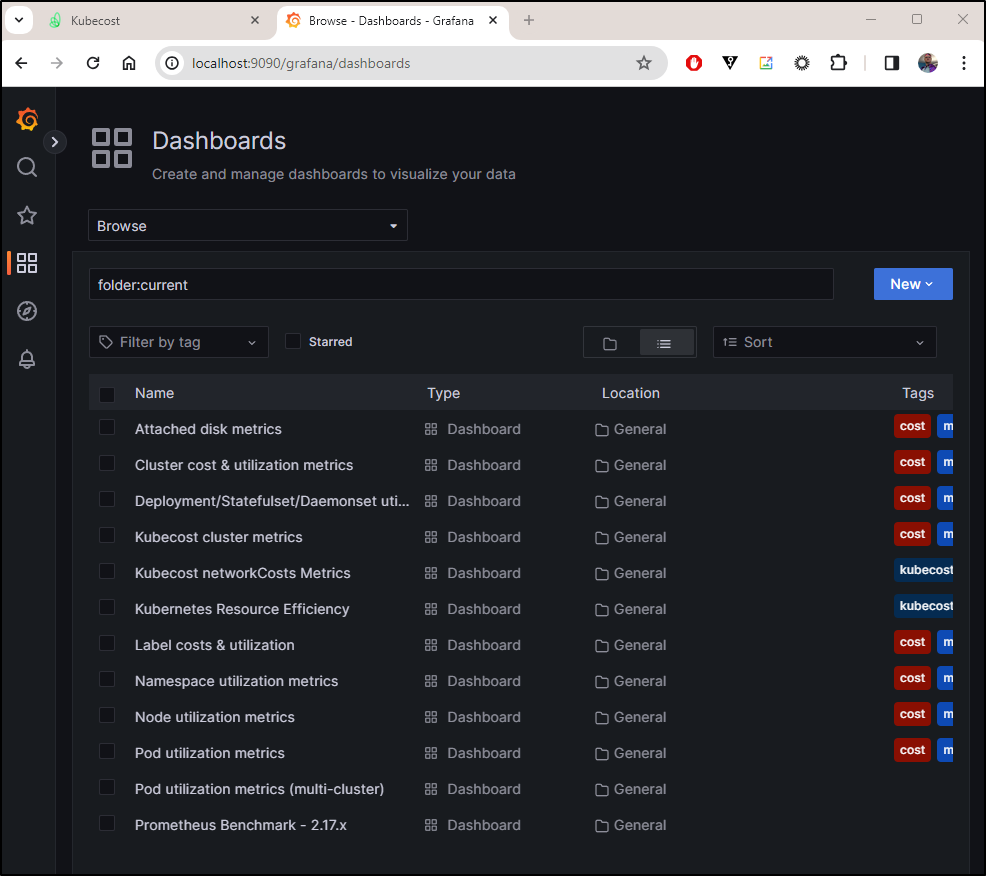
However, I could use the forwarder built-in to Kubecost to get there
$ kubectl port-forward svc/kubecost-cost-analyzer -n kubecost 9090:9090
Forwarding from 127.0.0.1:9090 -> 9090
Forwarding from [::1]:9090 -> 9090
Handling connection for 9090
Handling connection for 9090
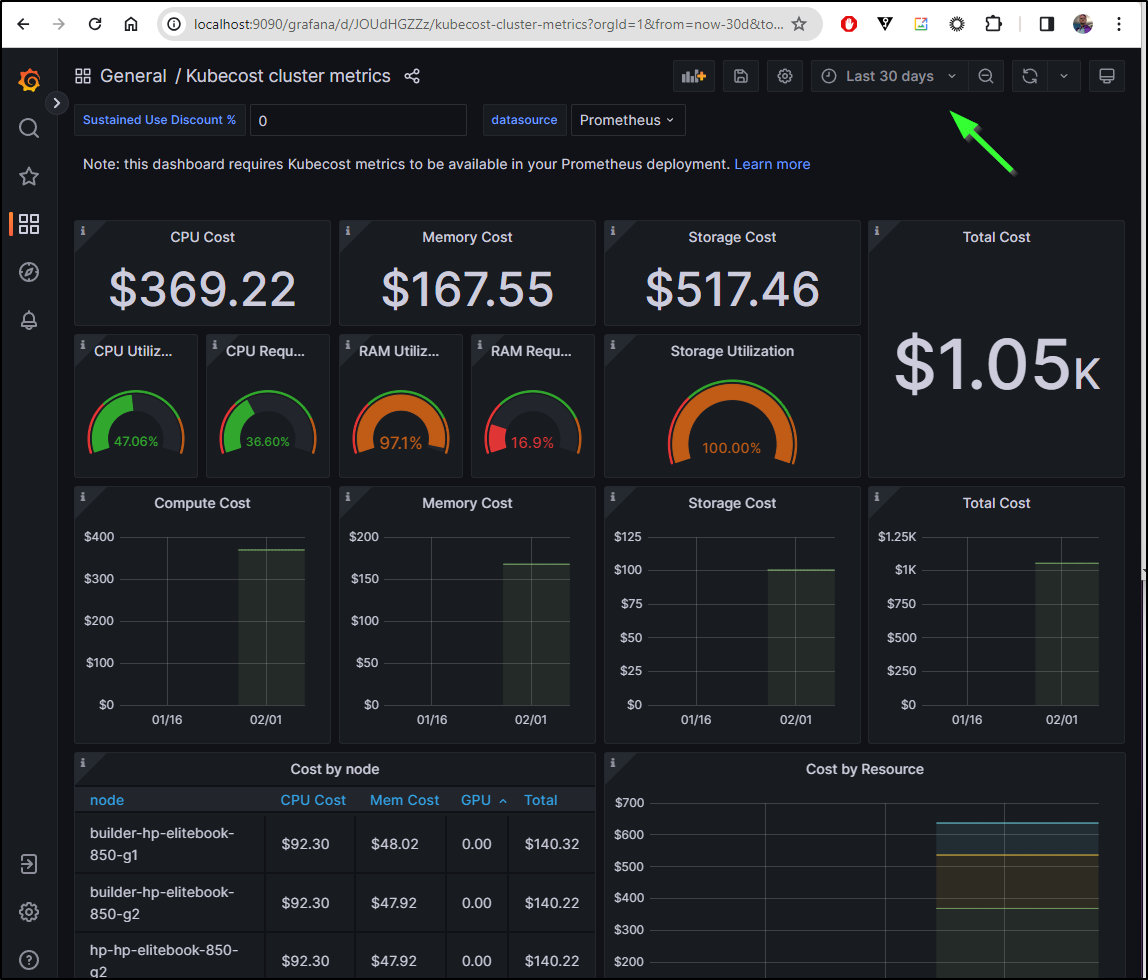
Which actually gets us data beyond the paywall’ed 2 weeks
Summary
We started this by fixing a stuck Prometheus that was preventing Kubecost from getting new data. Once fixed, we easily upgraded to the latest version. We explored email alerts and by virtue of an email integration, PagerDuty alerts as well. Looking at the minor limitations of the free (community) version, I also touched on OpenCost and upgrading that as well.
I still think having both Kubecost and OpenCost in a cluster is really handy for performance tuning. The fact that they can share a metrics collector is a bonus. I love the Grafana backend to Kubecost. Not that the UI is bad, but getting right in to Grafana makes it even better for extensibility and graphing.
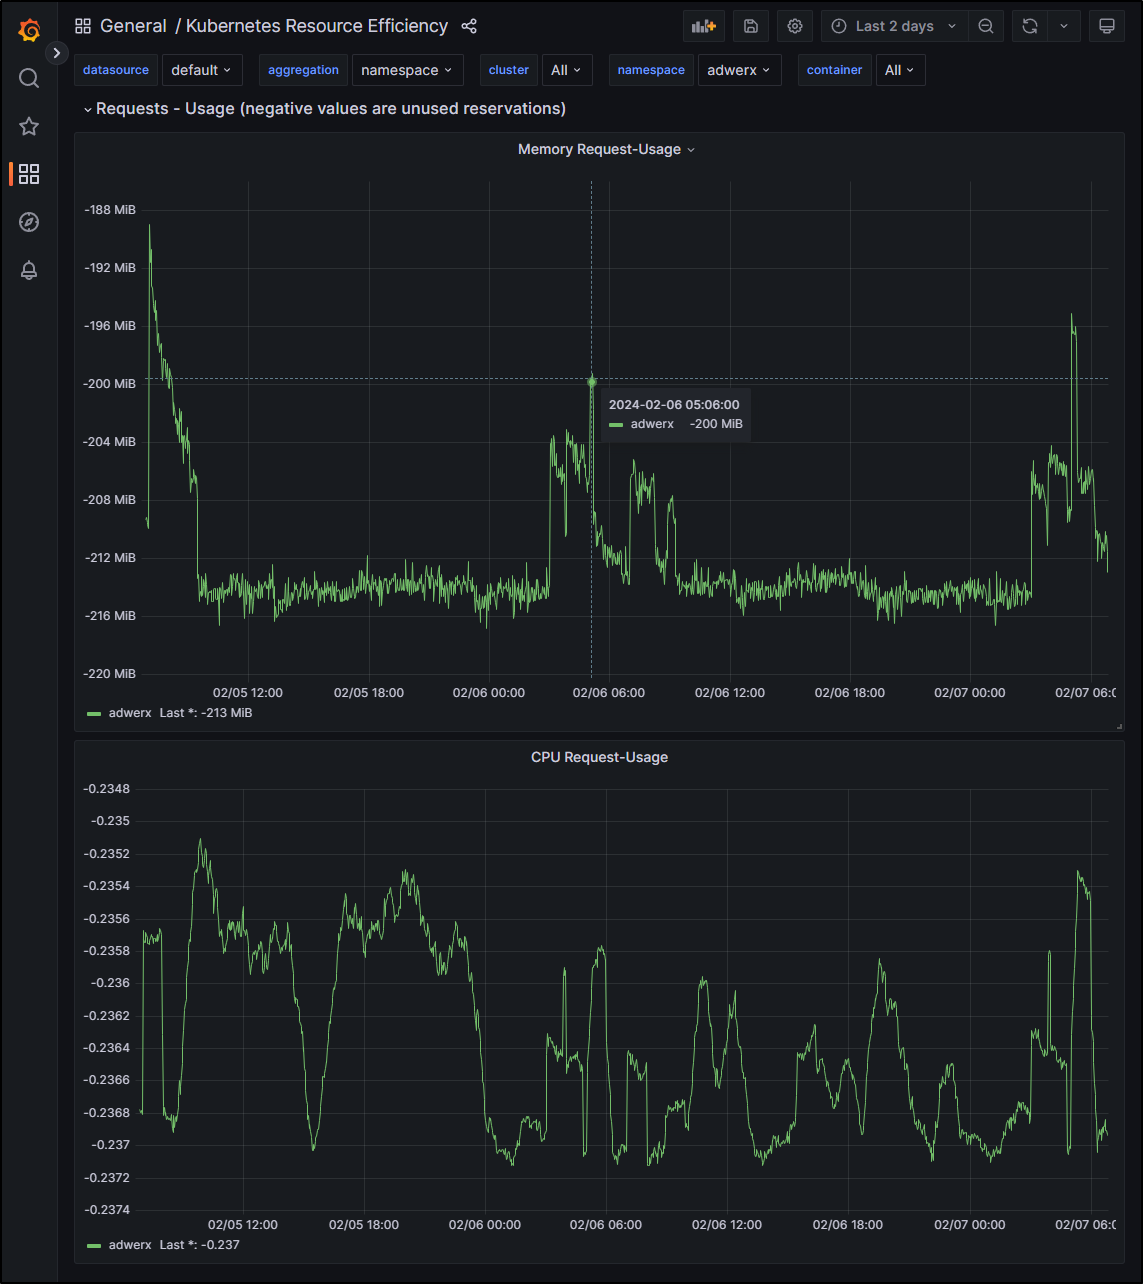
For example, I could pull Resource Efficiency graphs on a specific namespace and period which gives a much more detailed view of the data
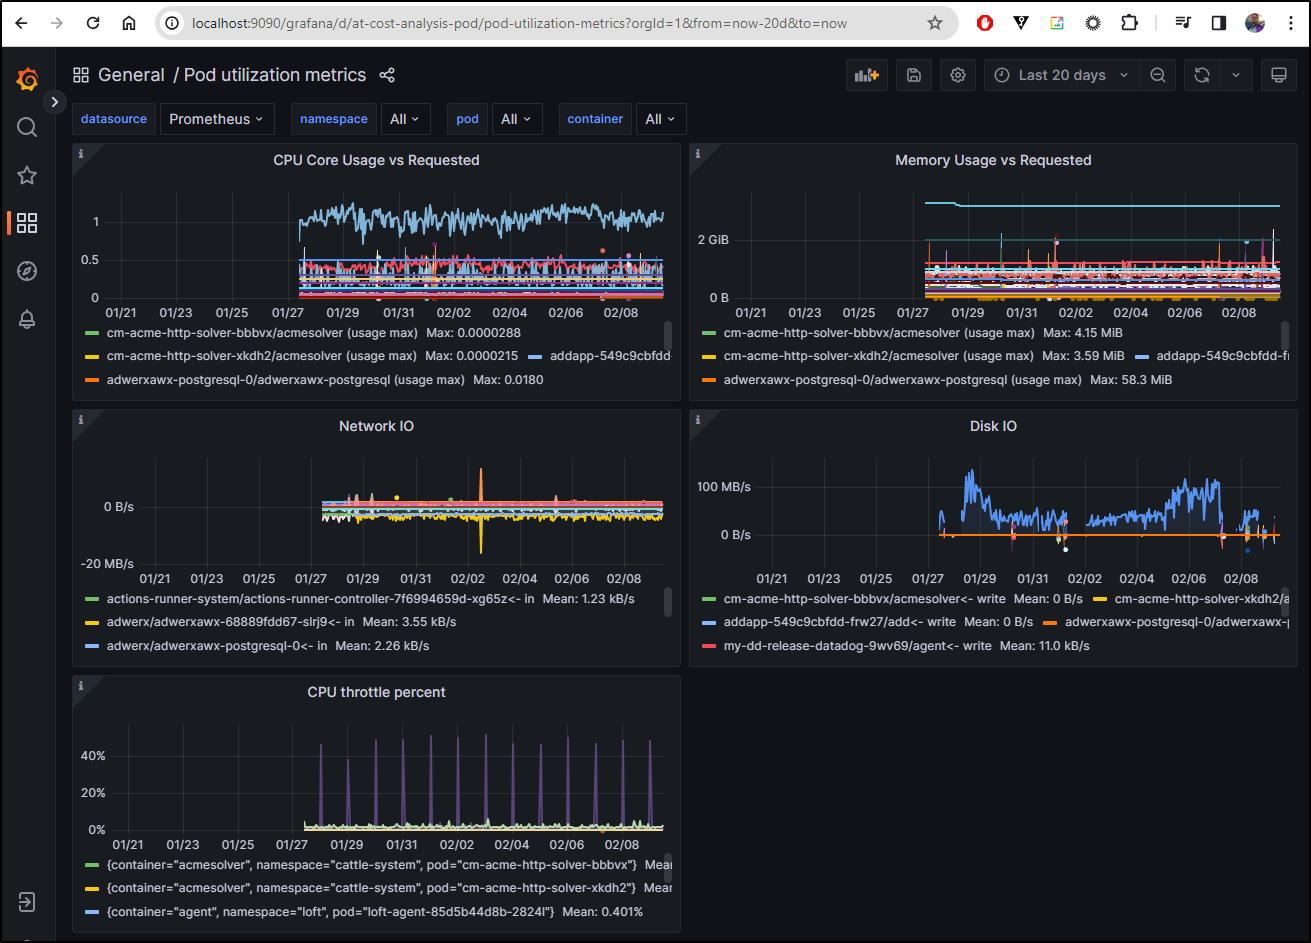
Or pod utilization metrics for whatever time range I desire by virtual of the Grafana forwarder on Kubecost
$ kubectl port-forward svc/kubecost-cost-analyzer -n kubecost 9090:9090
Forwarding from 127.0.0.1:9090 -> 9090
Forwarding from [::1]:9090 -> 9090
Handling connection for 9090


