

Published: Dec 27, 2022 by Isaac Johnson
We last looked at Dynatrace nearly a year ago. Recently they reached out and I thought it might be worth revisiting their APM Suite.
The key areas I want to revisit are performance impacts caused by the OneAgent setup in k3s; last time it took out my GH Runners and slowed my cluster to a halt. I also struggled with pricing guidelines. I have shared this with Dynatrace but before we start kvetching about possible old bugs, let’s give it a full run through.
Today we’ll cover setup in a Kubernetes Cluster including signing up for a Trial. We’ll look at Network monitoring, Monitoring of Services, Traces, Metrics and wrap up with using the Open Telemetry collector.
Cluster setup
This time I’ll start by using the cluster we just setup with Dapr, Zipkin and the calculator app. (You can review those steps in GCP Cloud Trace from last week.)
$ kubectl get nodes
NAME                  STATUS   ROLES                  AGE     VERSION
builder-macbookpro2   Ready    <none>                 2d23h   v1.23.10+k3s1
isaac-macbookpro      Ready    <none>                 2d23h   v1.23.10+k3s1
anna-macbookair       Ready    control-plane,master   3d      v1.23.10+k3s1
And we can see the calculator app works, but i have some other crashing pods (which I want to leave that way)
$ kubectl get pods
NAME                                   READY   STATUS             RESTARTS           AGE
redis-master-0                         1/1     Running            0                  2d23h
redis-replicas-0                       1/1     Running            0                  2d23h
redis-replicas-1                       1/1     Running            0                  2d23h
redis-replicas-2                       1/1     Running            0                  2d23h
csharp-subscriber-66b7c5bcbc-jrxf4     2/2     Running            0                  2d23h
pythonapp-7c9b7f7966-6jkfc             2/2     Running            0                  2d23h
nodeapp-679885bdf8-4d4sc               2/2     Running            0                  2d23h
multiplyapp-bdbdf4b5-lbmn4             2/2     Running            0                  2d23h
divideapp-585848cf4d-vfd4x             2/2     Running            0                  38h
addapp-76dbf95c88-ss7sj                2/2     Running            0                  38h
subtractapp-6c449d8cb9-n4nqb           2/2     Running            0                  38h
calculator-front-end-6694bbfdf-rp769   2/2     Running            0                  38h
zipkin-57797dd5db-mjl9v                1/1     Running            0                  13h
react-form-764468d8b-7zc4w             0/2     CrashLoopBackOff   1505 (102s ago)    2d23h
node-subscriber-6d99bd4bd7-vnmfj       0/2     CrashLoopBackOff   1507 (83s ago)     2d23h
python-subscriber-79986596f9-wmqms     0/2     CrashLoopBackOff   1485 (3m30s ago)   2d23h
I can do some port-forwards to see the calculator app is still functioning
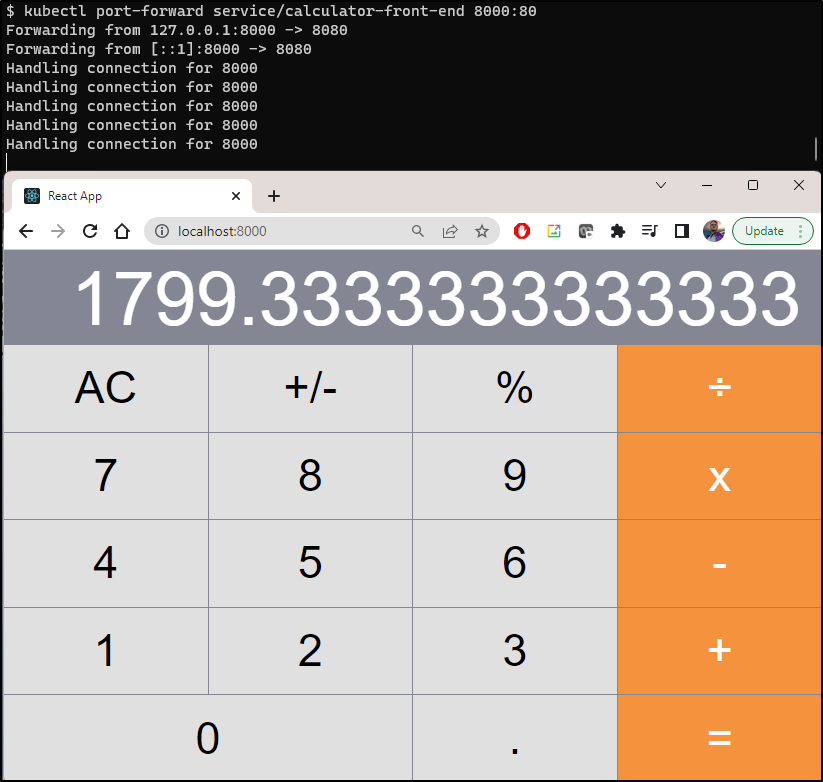
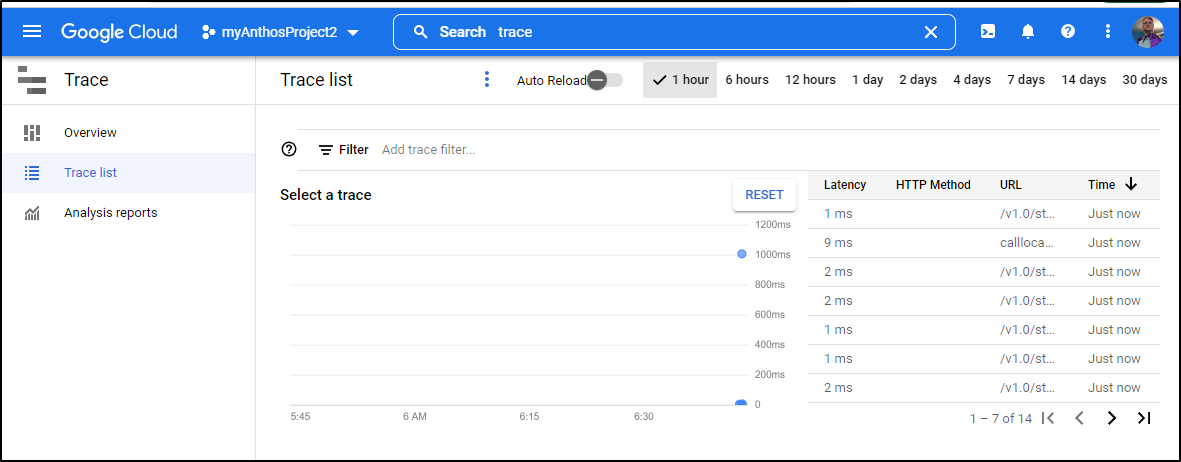
And presently, still sending trace data to GCP
Sign up for Trial
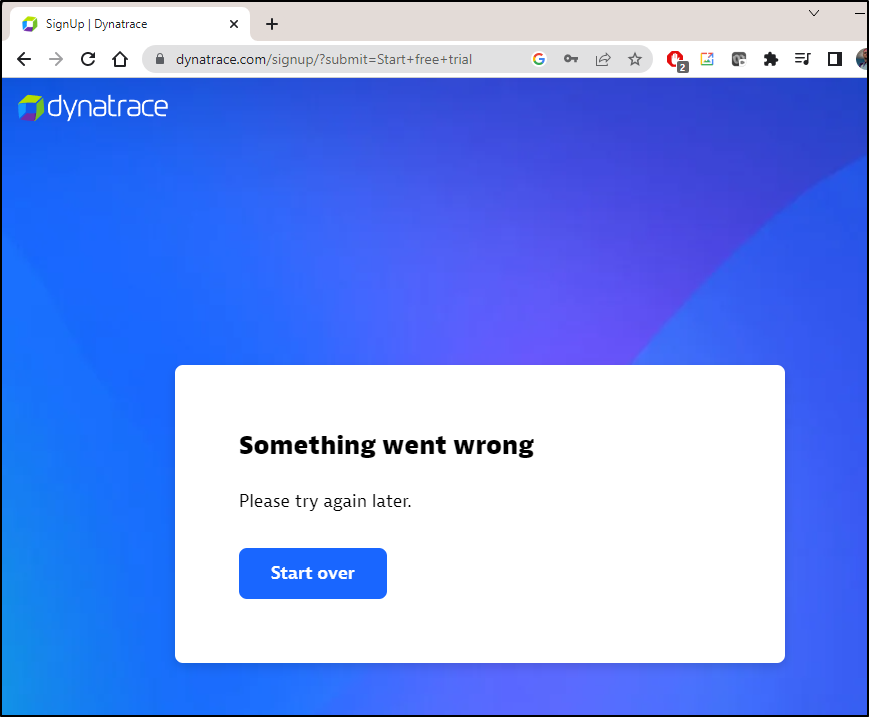
I used the website to signup for a trial.
Oddly, it crashed the first time through (maybe it didn’t like “/” in my company name. I removed it the 2nd time through)
Once through the wizard, we see the Dynatrace dashboard
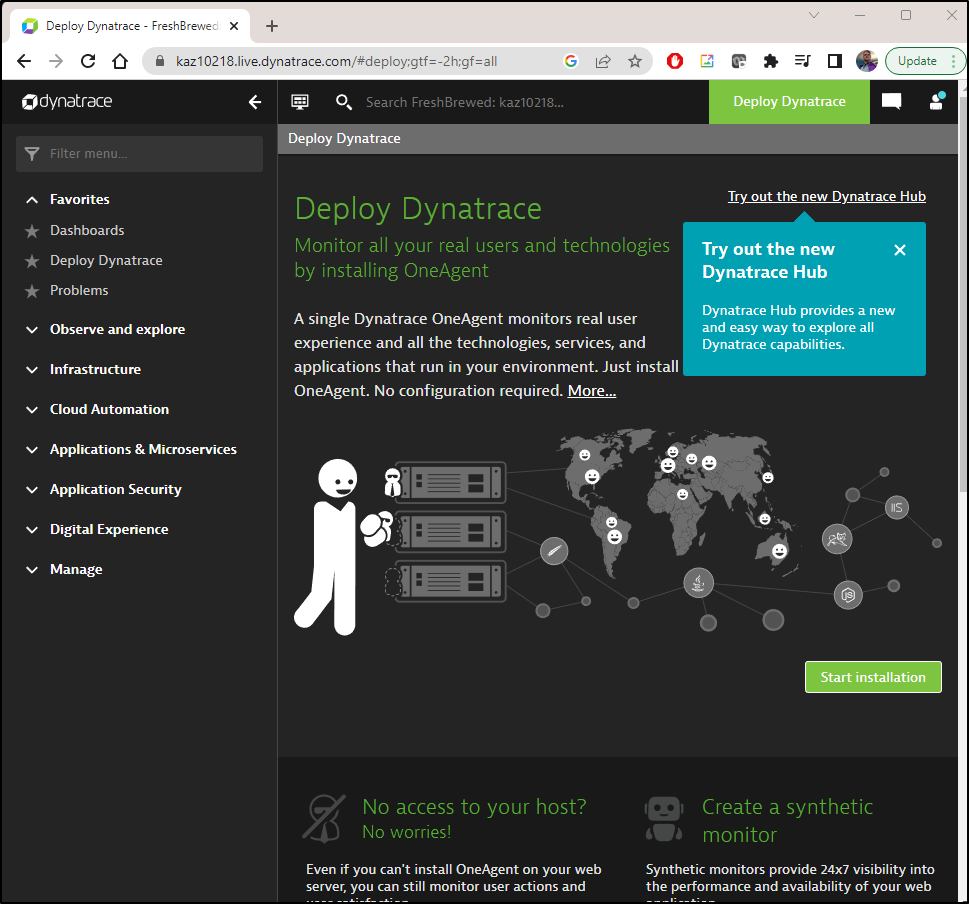
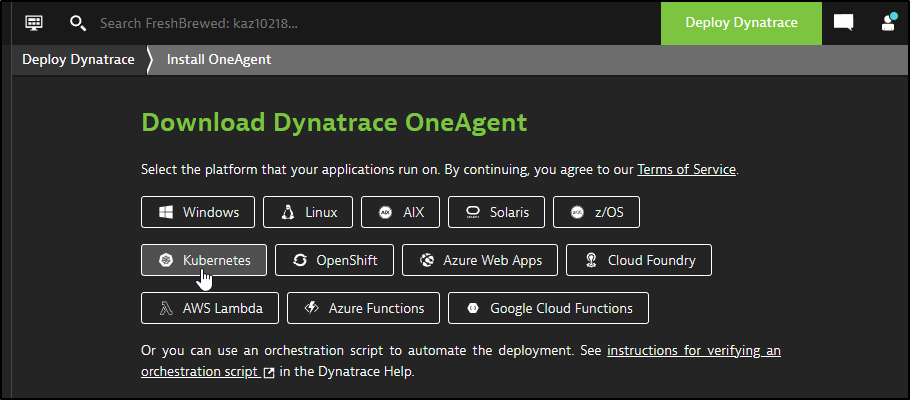
I’ll start with deploying OneAgent for Kubernetes
I’ll fill out some details and then click “Download dynakube.yaml”
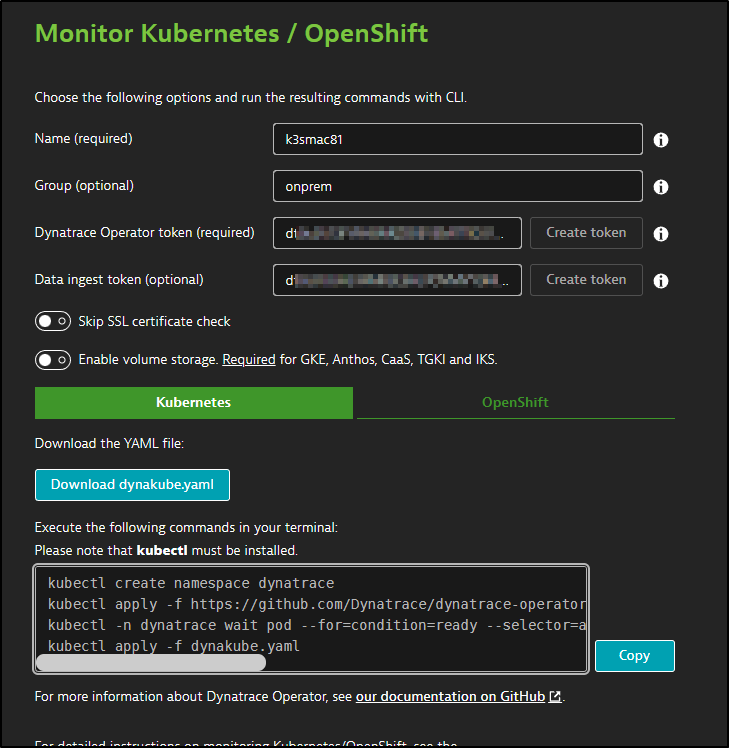
The set of steps provided
kubectl create namespace dynatrace
kubectl apply -f https://github.com/Dynatrace/dynatrace-operator/releases/download/v0.10.0/kubernetes.yaml
kubectl -n dynatrace wait pod --for=condition=ready --selector=app.kubernetes.io/name=dynatrace-operator,app.kubernetes.io/component=webhook --timeout=300s
kubectl apply -f dynakube.yaml
is pretty close, albeit the path to the YAML needs to be set.
$ kubectl create namespace dynatrace
namespace/dynatrace created
$ kubectl apply -f https://github.com/Dynatrace/dynatrace-operator/releases/download/v0.10.0/kubernetes.yaml
poddisruptionbudget.policy/dynatrace-webhook created
serviceaccount/dynatrace-activegate created
serviceaccount/dynatrace-kubernetes-monitoring created
serviceaccount/dynatrace-dynakube-oneagent-privileged created
serviceaccount/dynatrace-dynakube-oneagent-unprivileged created
serviceaccount/dynatrace-operator created
serviceaccount/dynatrace-webhook created
customresourcedefinition.apiextensions.k8s.io/dynakubes.dynatrace.com created
clusterrole.rbac.authorization.k8s.io/dynatrace-kubernetes-monitoring created
clusterrole.rbac.authorization.k8s.io/dynatrace-operator created
clusterrole.rbac.authorization.k8s.io/dynatrace-webhook created
clusterrolebinding.rbac.authorization.k8s.io/dynatrace-kubernetes-monitoring created
clusterrolebinding.rbac.authorization.k8s.io/dynatrace-operator created
clusterrolebinding.rbac.authorization.k8s.io/dynatrace-webhook created
role.rbac.authorization.k8s.io/dynatrace-operator created
role.rbac.authorization.k8s.io/dynatrace-webhook created
rolebinding.rbac.authorization.k8s.io/dynatrace-operator created
rolebinding.rbac.authorization.k8s.io/dynatrace-webhook created
service/dynatrace-webhook created
deployment.apps/dynatrace-operator created
deployment.apps/dynatrace-webhook created
mutatingwebhookconfiguration.admissionregistration.k8s.io/dynatrace-webhook created
validatingwebhookconfiguration.admissionregistration.k8s.io/dynatrace-webhook created
The next step just ensures the pod is up
$ kubectl -n dynatrace wait pod --for=condition=ready --selector=app.kubernetes.io/name=dynatrace-operator,app.kubernetes.io/component=webhook --timeout=300s
pod/dynatrace-webhook-b9c6bd86b-6wfj2 condition met
pod/dynatrace-webhook-b9c6bd86b-dvq2n condition met
Lastly, since I’m in WSL, I need to pass the path to my Downloads dir on Windows
$ kubectl apply -f /mnt/c/Users/isaac/Downloads/dynakube.yaml
secret/k3smac81 created
dynakube.dynatrace.com/k3smac81 created
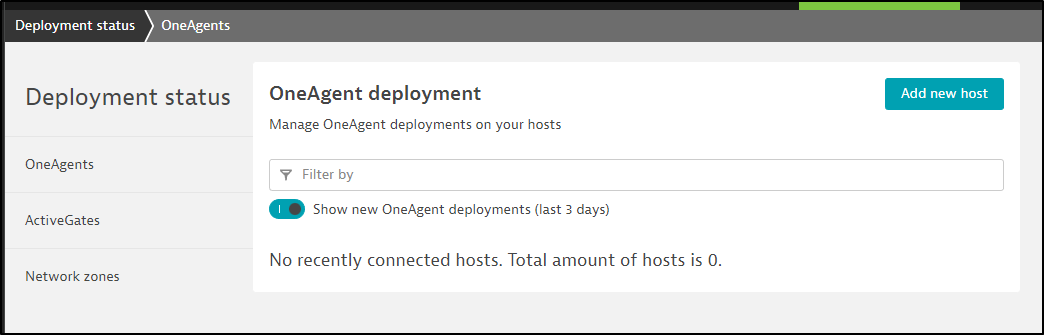
The Dynatrace page will then refresh to check for hosts
The containers came up in time
$ kubectl get pods -n dynatrace
NAME                                  READY   STATUS    RESTARTS   AGE
dynatrace-webhook-b9c6bd86b-6wfj2     1/1     Running   0          4m43s
dynatrace-webhook-b9c6bd86b-dvq2n     1/1     Running   0          4m43s
dynatrace-operator-766c7f4778-bzt6f   1/1     Running   0          4m43s
k3smac81-activegate-0                 0/1     Running   0          99s
k3smac81-oneagent-kqcbv               0/1     Running   0          99s
k3smac81-oneagent-rq2ph               0/1     Running   0          99s
k3smac81-oneagent-sjbsh               1/1     Running   0          99s

$ kubectl get pods -n dynatrace
NAME                                  READY   STATUS    RESTARTS   AGE
dynatrace-webhook-b9c6bd86b-6wfj2     1/1     Running   0          5m13s
dynatrace-webhook-b9c6bd86b-dvq2n     1/1     Running   0          5m13s
dynatrace-operator-766c7f4778-bzt6f   1/1     Running   0          5m13s
k3smac81-activegate-0                 0/1     Running   0          2m9s
k3smac81-oneagent-rq2ph               0/1     Running   0          2m9s
k3smac81-oneagent-sjbsh               1/1     Running   0          2m9s
k3smac81-oneagent-kqcbv               1/1     Running   0          2m9s

$ kubectl get pods -n dynatrace
NAME                                  READY   STATUS    RESTARTS   AGE
dynatrace-webhook-b9c6bd86b-6wfj2     1/1     Running   0          5m34s
dynatrace-webhook-b9c6bd86b-dvq2n     1/1     Running   0          5m34s
dynatrace-operator-766c7f4778-bzt6f   1/1     Running   0          5m34s
k3smac81-activegate-0                 0/1     Running   0          2m30s
k3smac81-oneagent-sjbsh               1/1     Running   0          2m30s
k3smac81-oneagent-kqcbv               1/1     Running   0          2m30s
k3smac81-oneagent-rq2ph               1/1     Running   0          2m30s
Within a couple minutes, I saw my primary host listed
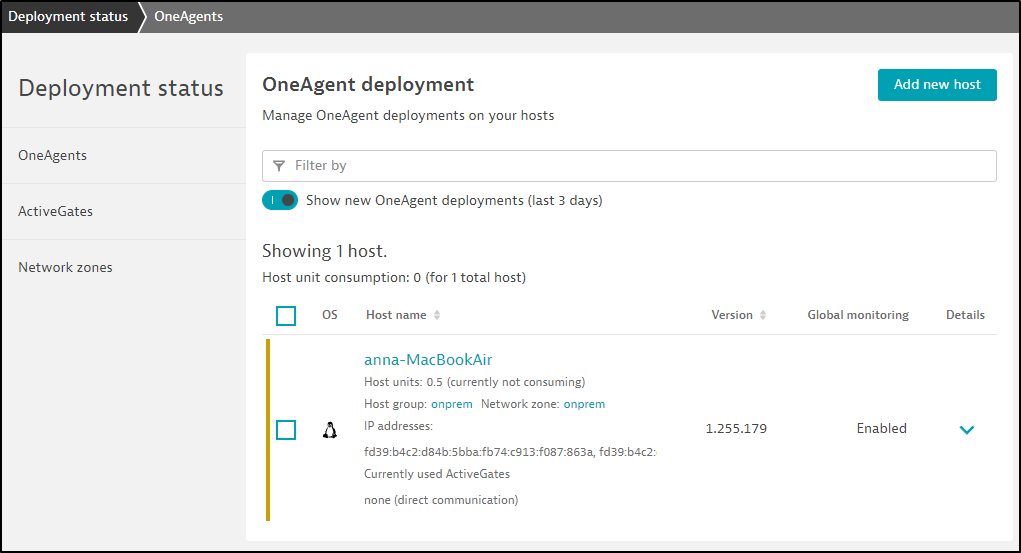
Clicking my host name, I can see some basic details
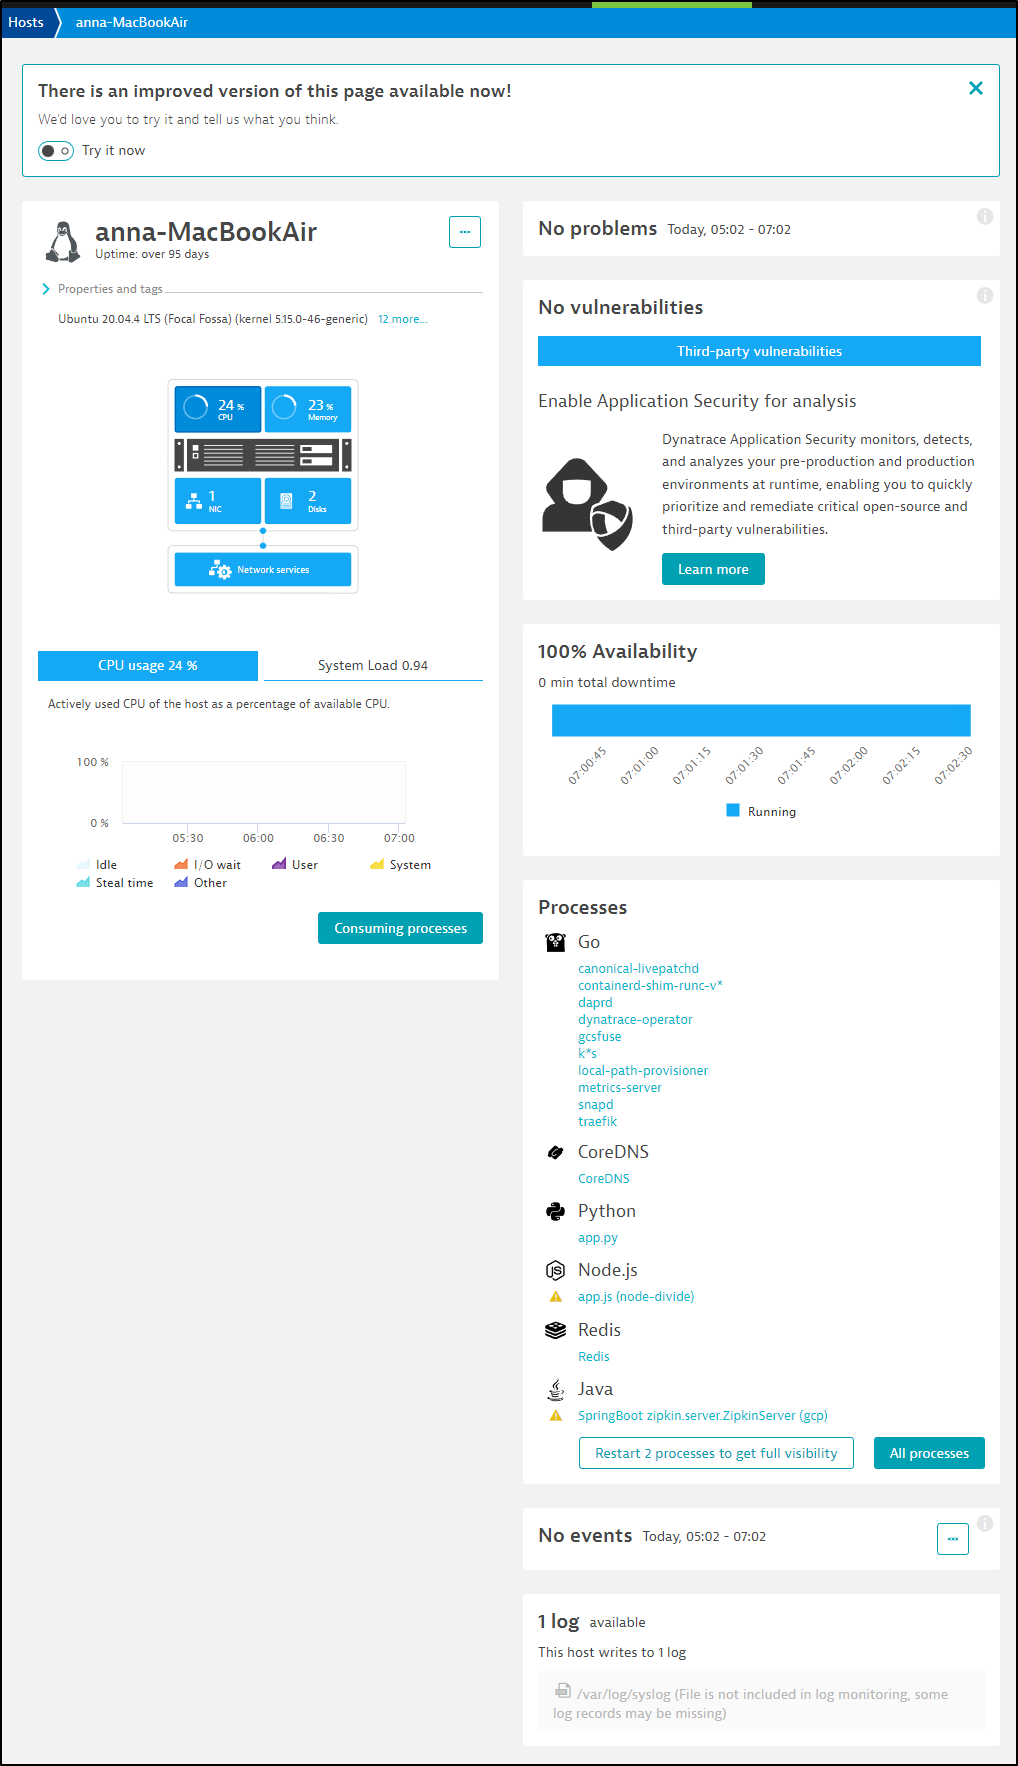
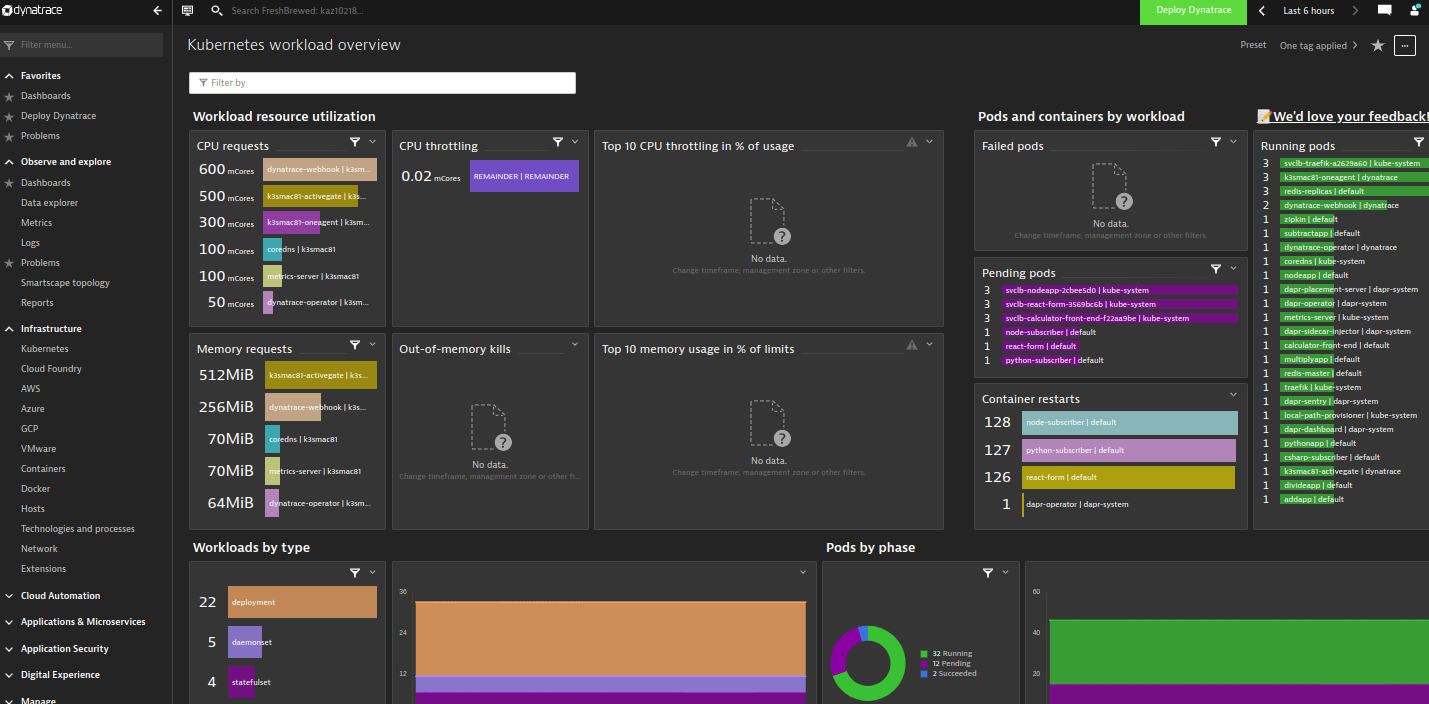
My first step was to jump over the Kubernetes Dashboard. I was excited to see some data right away.
At first it was empty, but a refresh (at this point it had been 5m since I launched OneAgent in the cluster) showed results
I’ll admit that I have done no extra configurations at this point. However, I really wanted to see why my pods failed.
I can still see them in a CLBO state in the cluster
$ kubectl get pods
NAME                                   READY   STATUS             RESTARTS           AGE
redis-master-0                         1/1     Running            0                  3d
redis-replicas-0                       1/1     Running            0                  3d
redis-replicas-1                       1/1     Running            0                  3d
redis-replicas-2                       1/1     Running            0                  3d
csharp-subscriber-66b7c5bcbc-jrxf4     2/2     Running            0                  2d23h
pythonapp-7c9b7f7966-6jkfc             2/2     Running            0                  2d23h
nodeapp-679885bdf8-4d4sc               2/2     Running            0                  2d23h
multiplyapp-bdbdf4b5-lbmn4             2/2     Running            0                  2d23h
divideapp-585848cf4d-vfd4x             2/2     Running            0                  38h
addapp-76dbf95c88-ss7sj                2/2     Running            0                  38h
subtractapp-6c449d8cb9-n4nqb           2/2     Running            0                  38h
calculator-front-end-6694bbfdf-rp769   2/2     Running            0                  38h
zipkin-57797dd5db-mjl9v                1/1     Running            0                  14h
python-subscriber-79986596f9-wmqms     0/2     CrashLoopBackOff   1493 (4m35s ago)   2d23h
node-subscriber-6d99bd4bd7-vnmfj       0/2     CrashLoopBackOff   1515 (3m10s ago)   2d23h
react-form-764468d8b-7zc4w             0/2     CrashLoopBackOff   1513 (3m41s ago)   2d23h
Let’s see if a quick delete (forced cycle) gives Dynatrace some data.
$ kubectl get pods && kubectl delete pod python-subscriber-79986596f9-wmqms & kubectl delete pod node-subscriber-6d99bd4bd7-vnmfj & kubectl delete pod react-form-764468d8b-7zc4
[1] 31008
[2] 31009
Error from server (NotFound): pods "react-form-764468d8b-7zc4" not found
builder@DESKTOP-QADGF36:~/Workspaces/quickstarts/tutorials/distributed-calculator/deploy$ pod "node-subscriber-6d99bd4bd7-vnmfj" deleted
NAME                                   READY   STATUS             RESTARTS         AGE
redis-master-0                         1/1     Running            0                3d
redis-replicas-0                       1/1     Running            0                3d
redis-replicas-1                       1/1     Running            0                3d
redis-replicas-2                       1/1     Running            0                3d
csharp-subscriber-66b7c5bcbc-jrxf4     2/2     Running            0                2d23h
pythonapp-7c9b7f7966-6jkfc             2/2     Running            0                2d23h
nodeapp-679885bdf8-4d4sc               2/2     Running            0                2d23h
multiplyapp-bdbdf4b5-lbmn4             2/2     Running            0                2d23h
divideapp-585848cf4d-vfd4x             2/2     Running            0                38h
addapp-76dbf95c88-ss7sj                2/2     Running            0                38h
subtractapp-6c449d8cb9-n4nqb           2/2     Running            0                38h
calculator-front-end-6694bbfdf-rp769   2/2     Running            0                38h
zipkin-57797dd5db-mjl9v                1/1     Running            0                14h
python-subscriber-79986596f9-wmqms     0/2     CrashLoopBackOff   1495 (71s ago)   2d23h
react-form-764468d8b-7zc4w             0/2     CrashLoopBackOff   1515 (29s ago)   2d23h
node-subscriber-6d99bd4bd7-vnmfj       0/2     ImagePullBackOff   1517 (10s ago)   2d23h
pod "python-subscriber-79986596f9-wmqms" deleted

[1]-  Done                    kubectl get pods && kubectl delete pod python-subscriber-79986596f9-wmqms
[2]+  Done                    kubectl delete pod node-subscriber-6d99bd4bd7-vnmfj
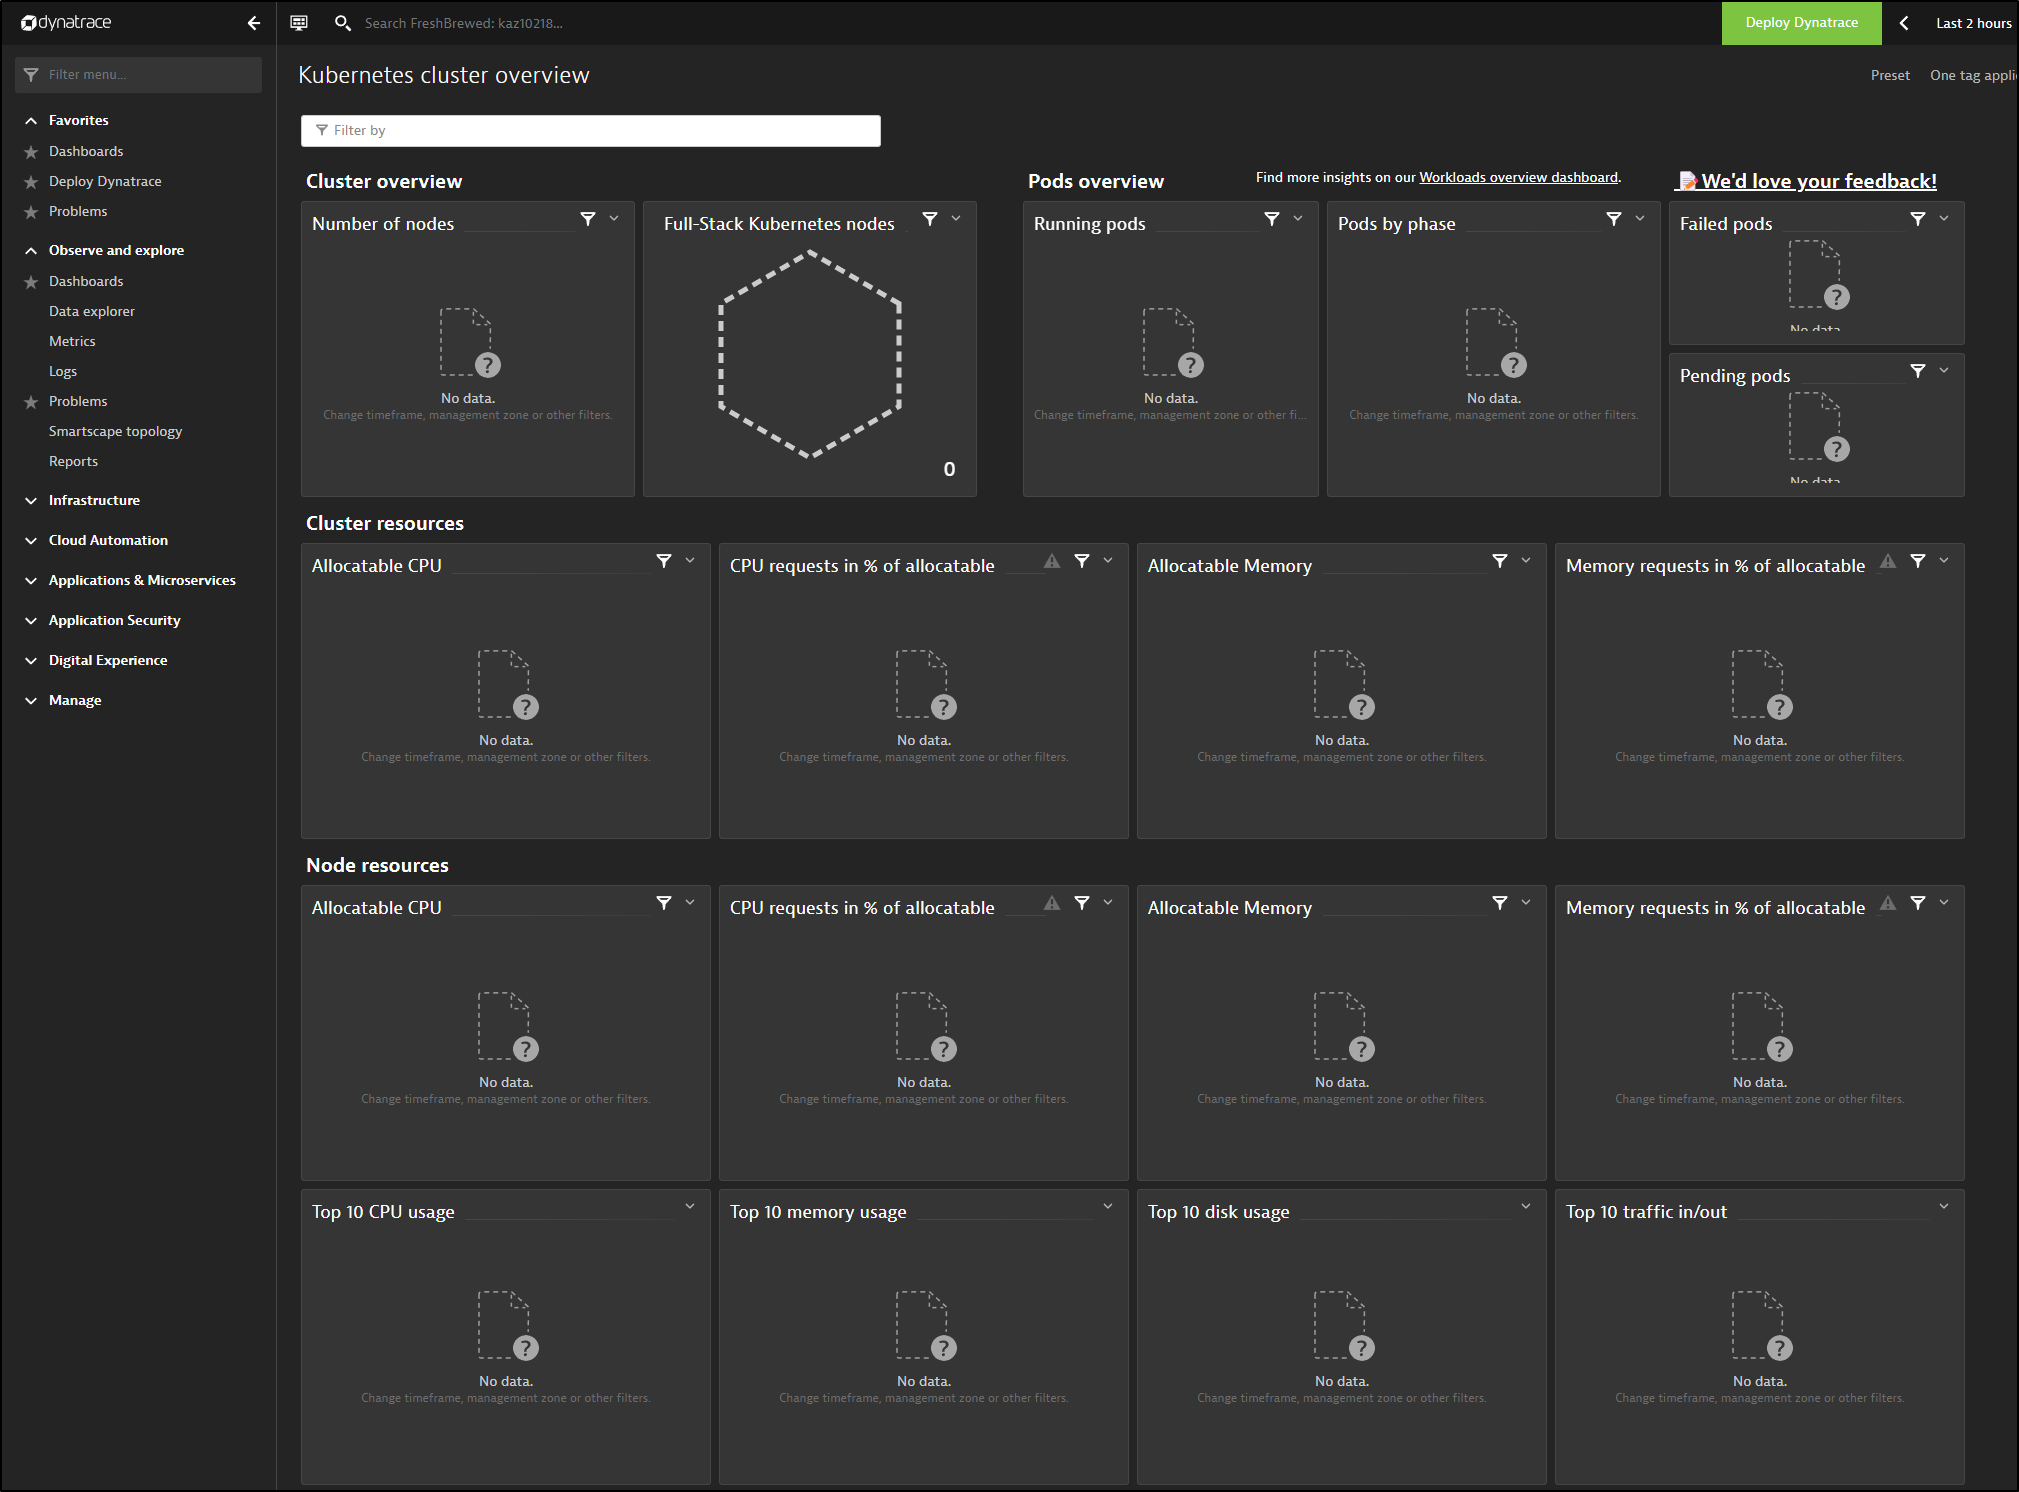
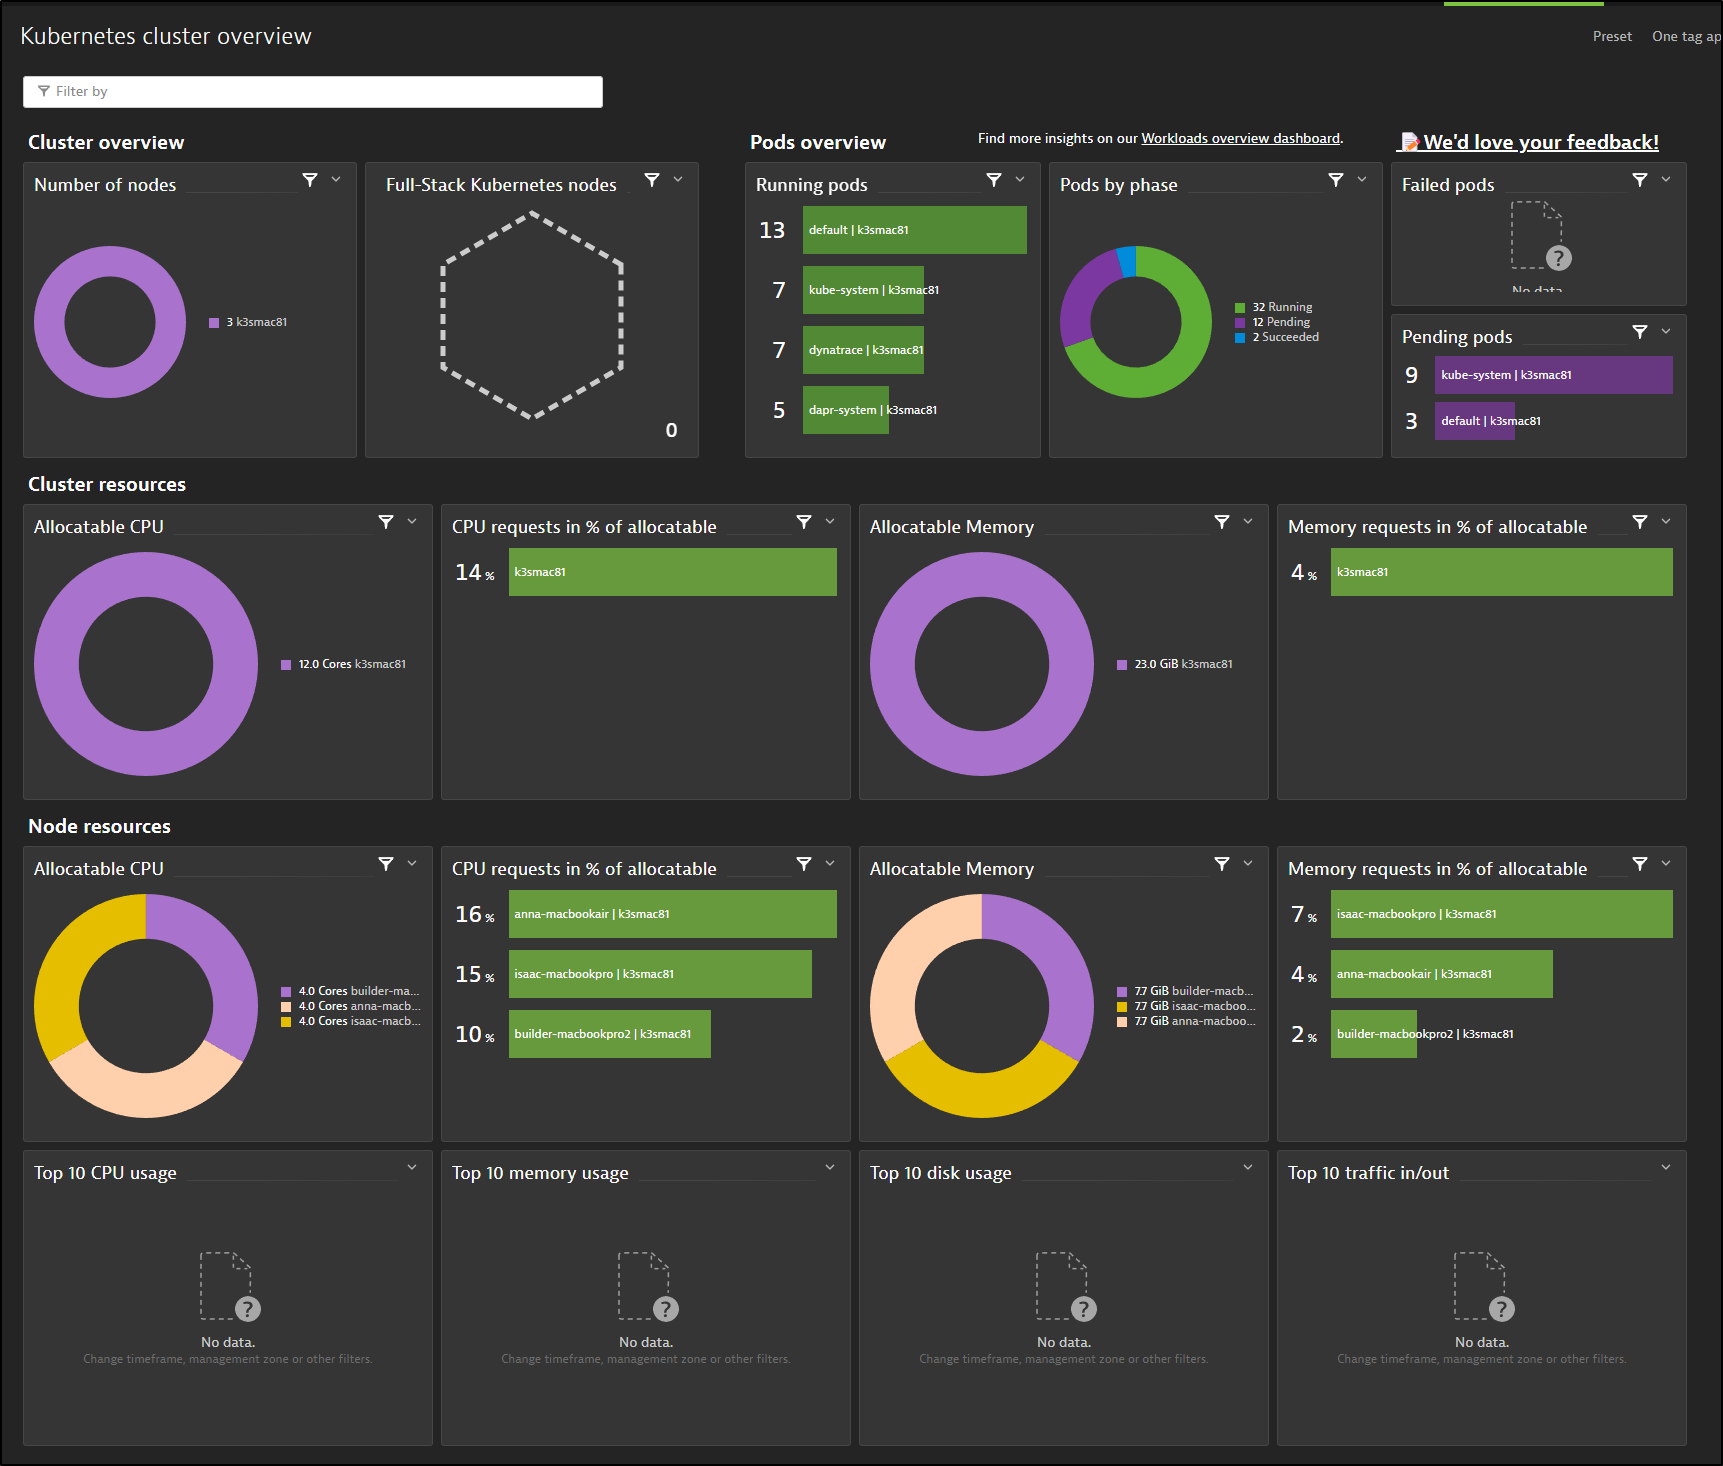
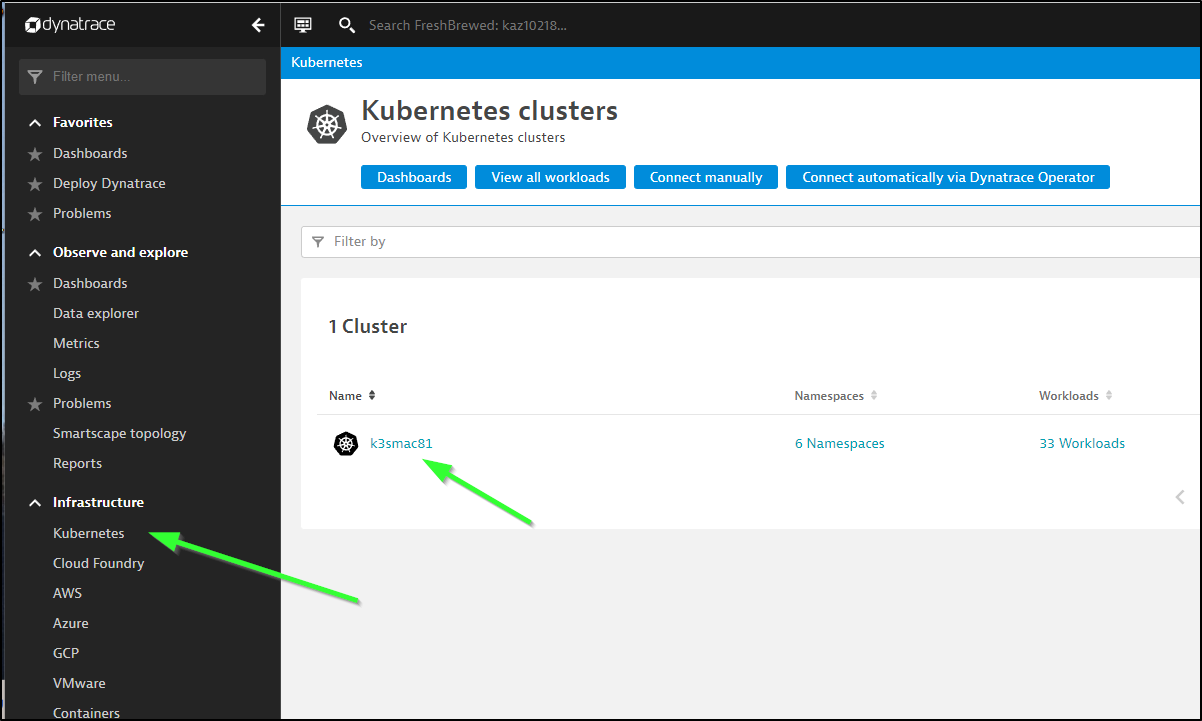
I didn’t see the dashboard refresh with any new information. I then tried going to Kubernetes from Infrastructure
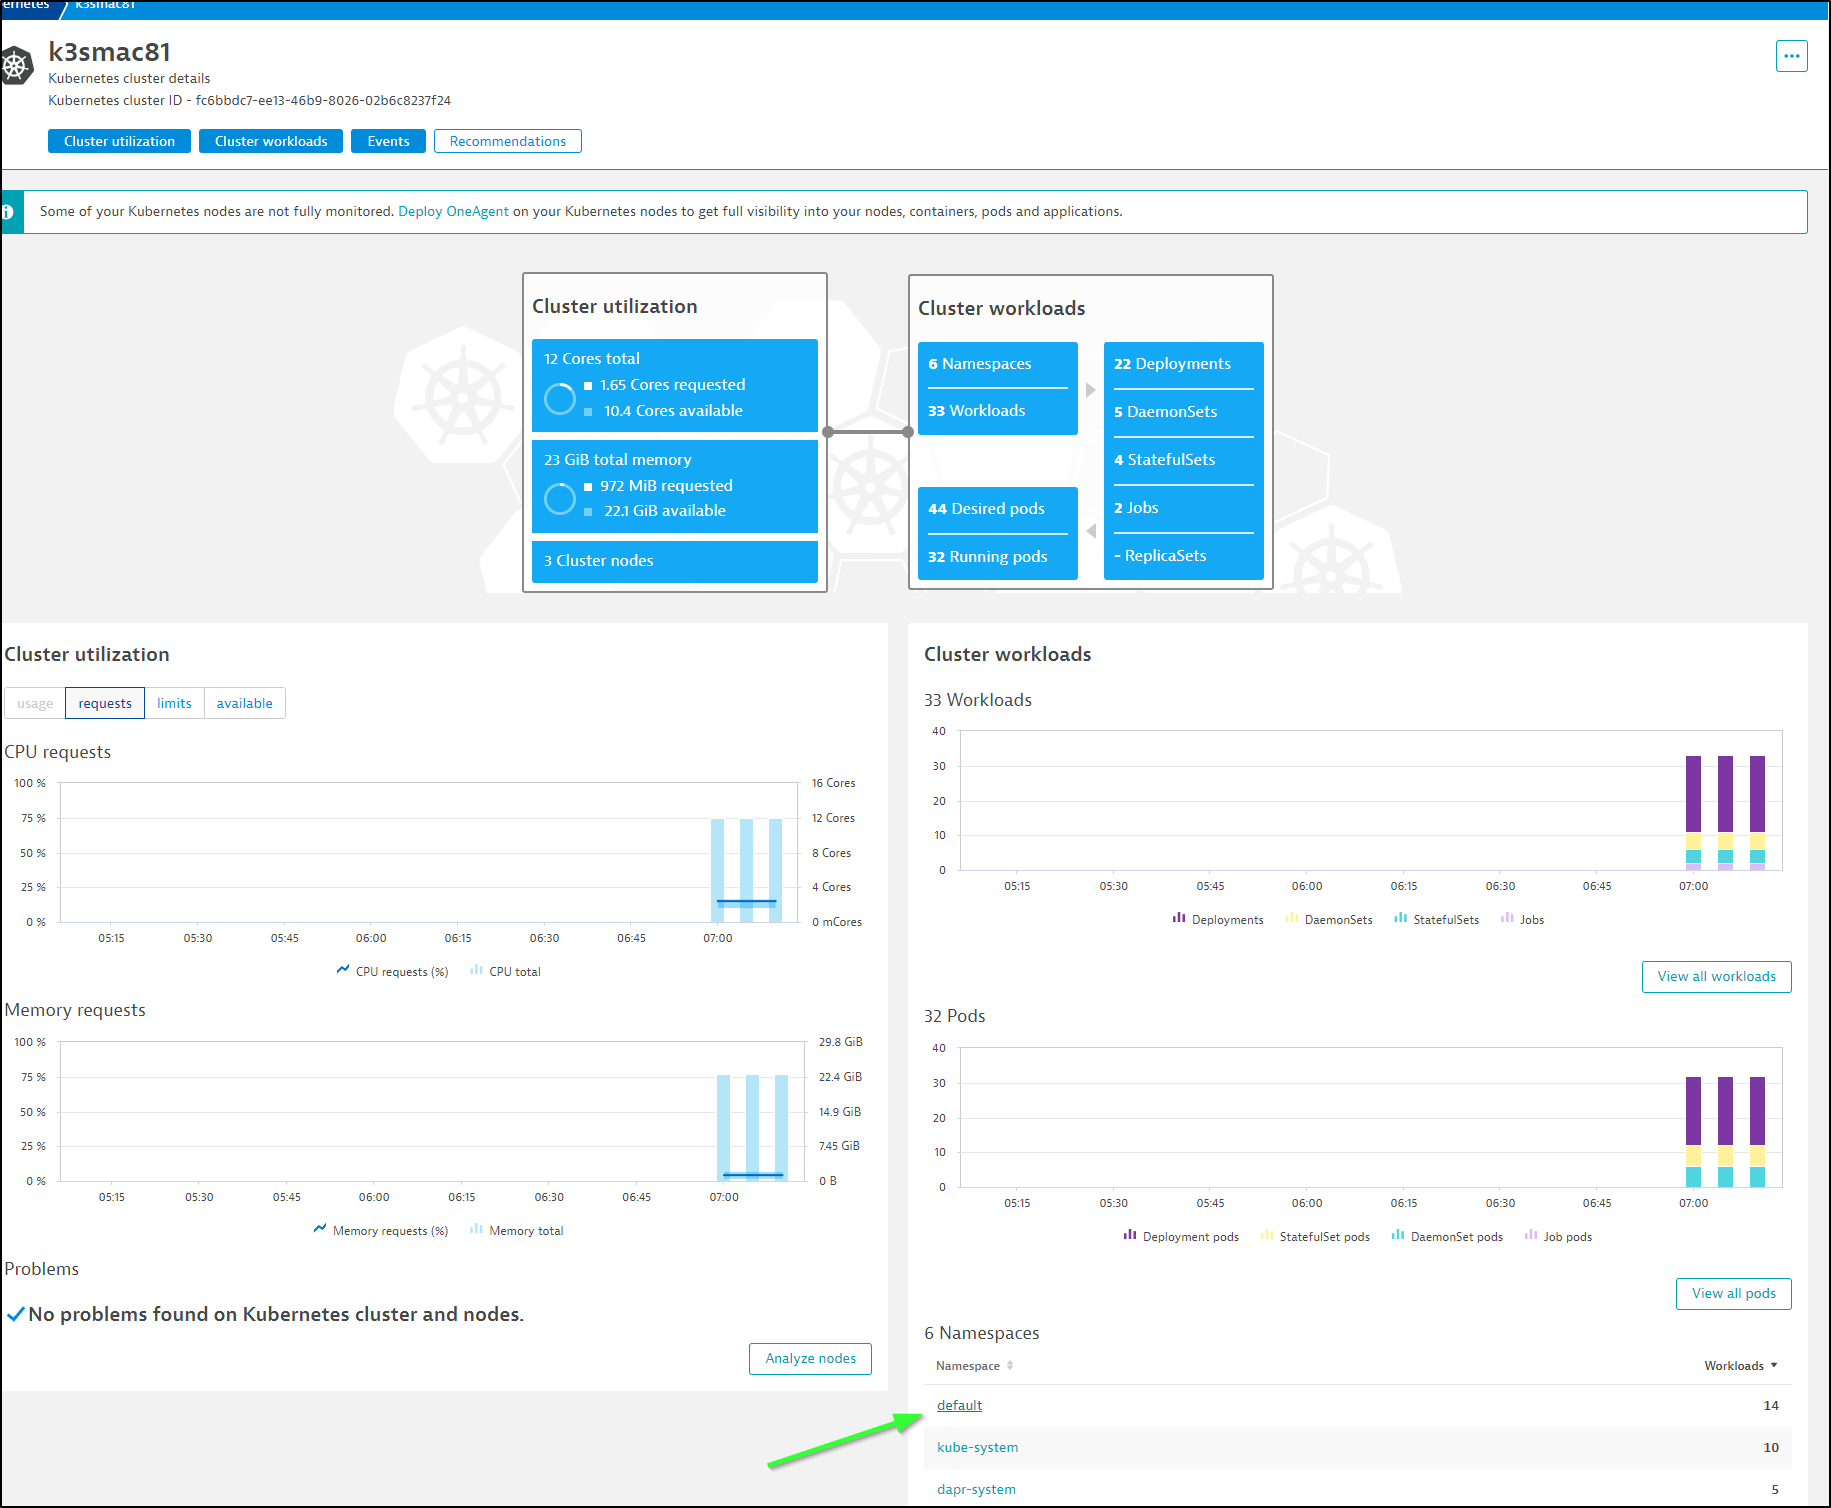
There I picked my ‘k3smac81’ cluster
Then the default namespace
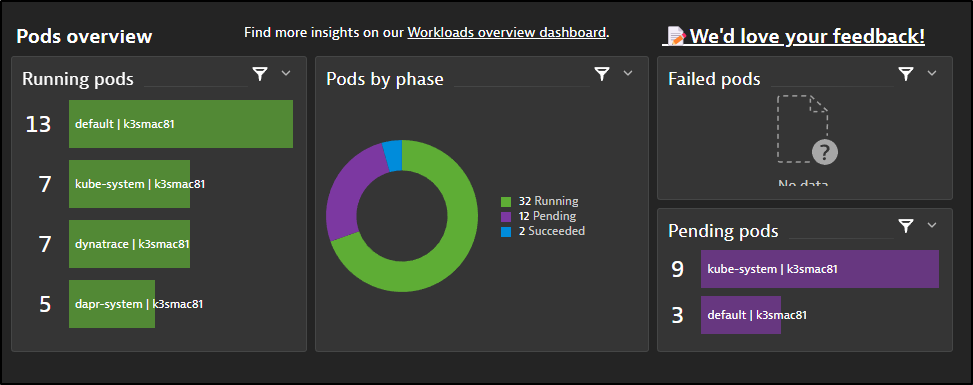
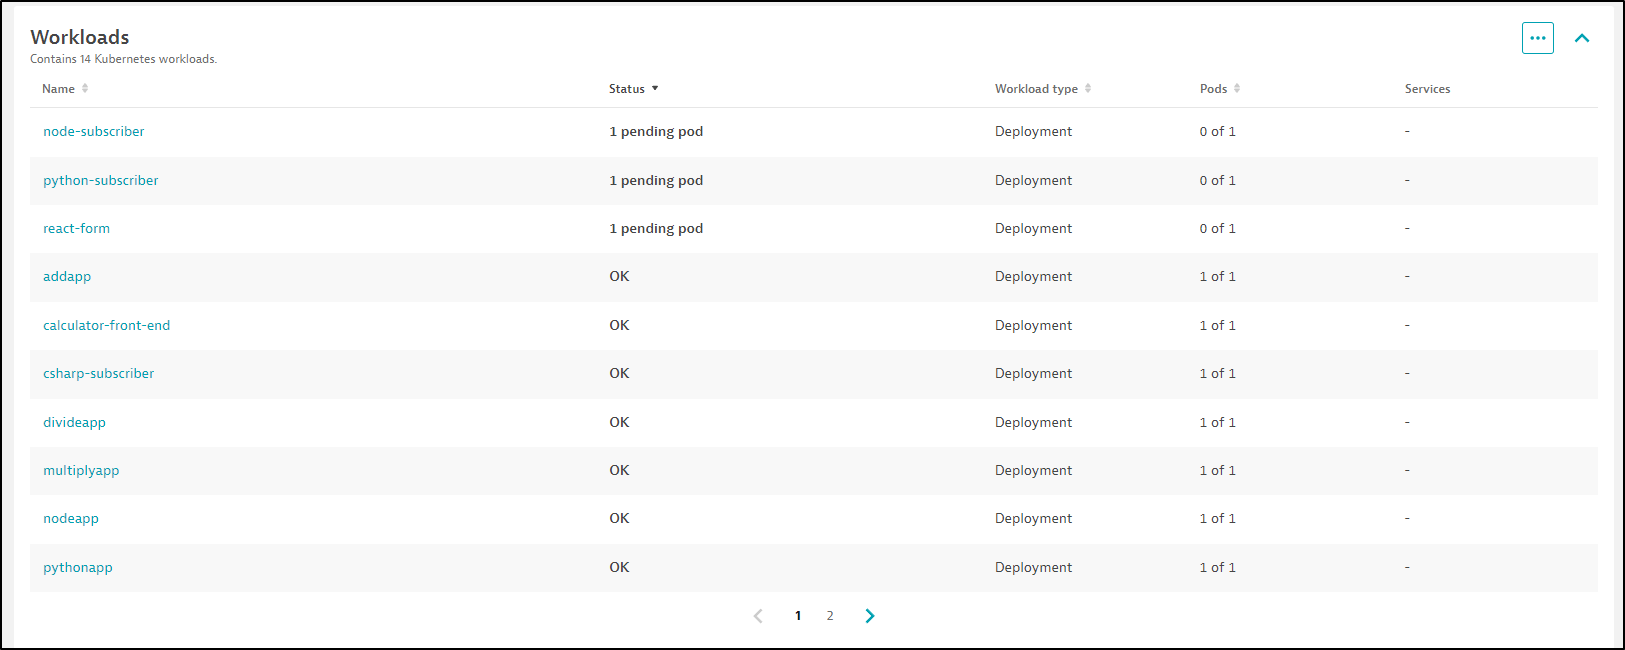
From there I could sort by status and see 3 pending pods
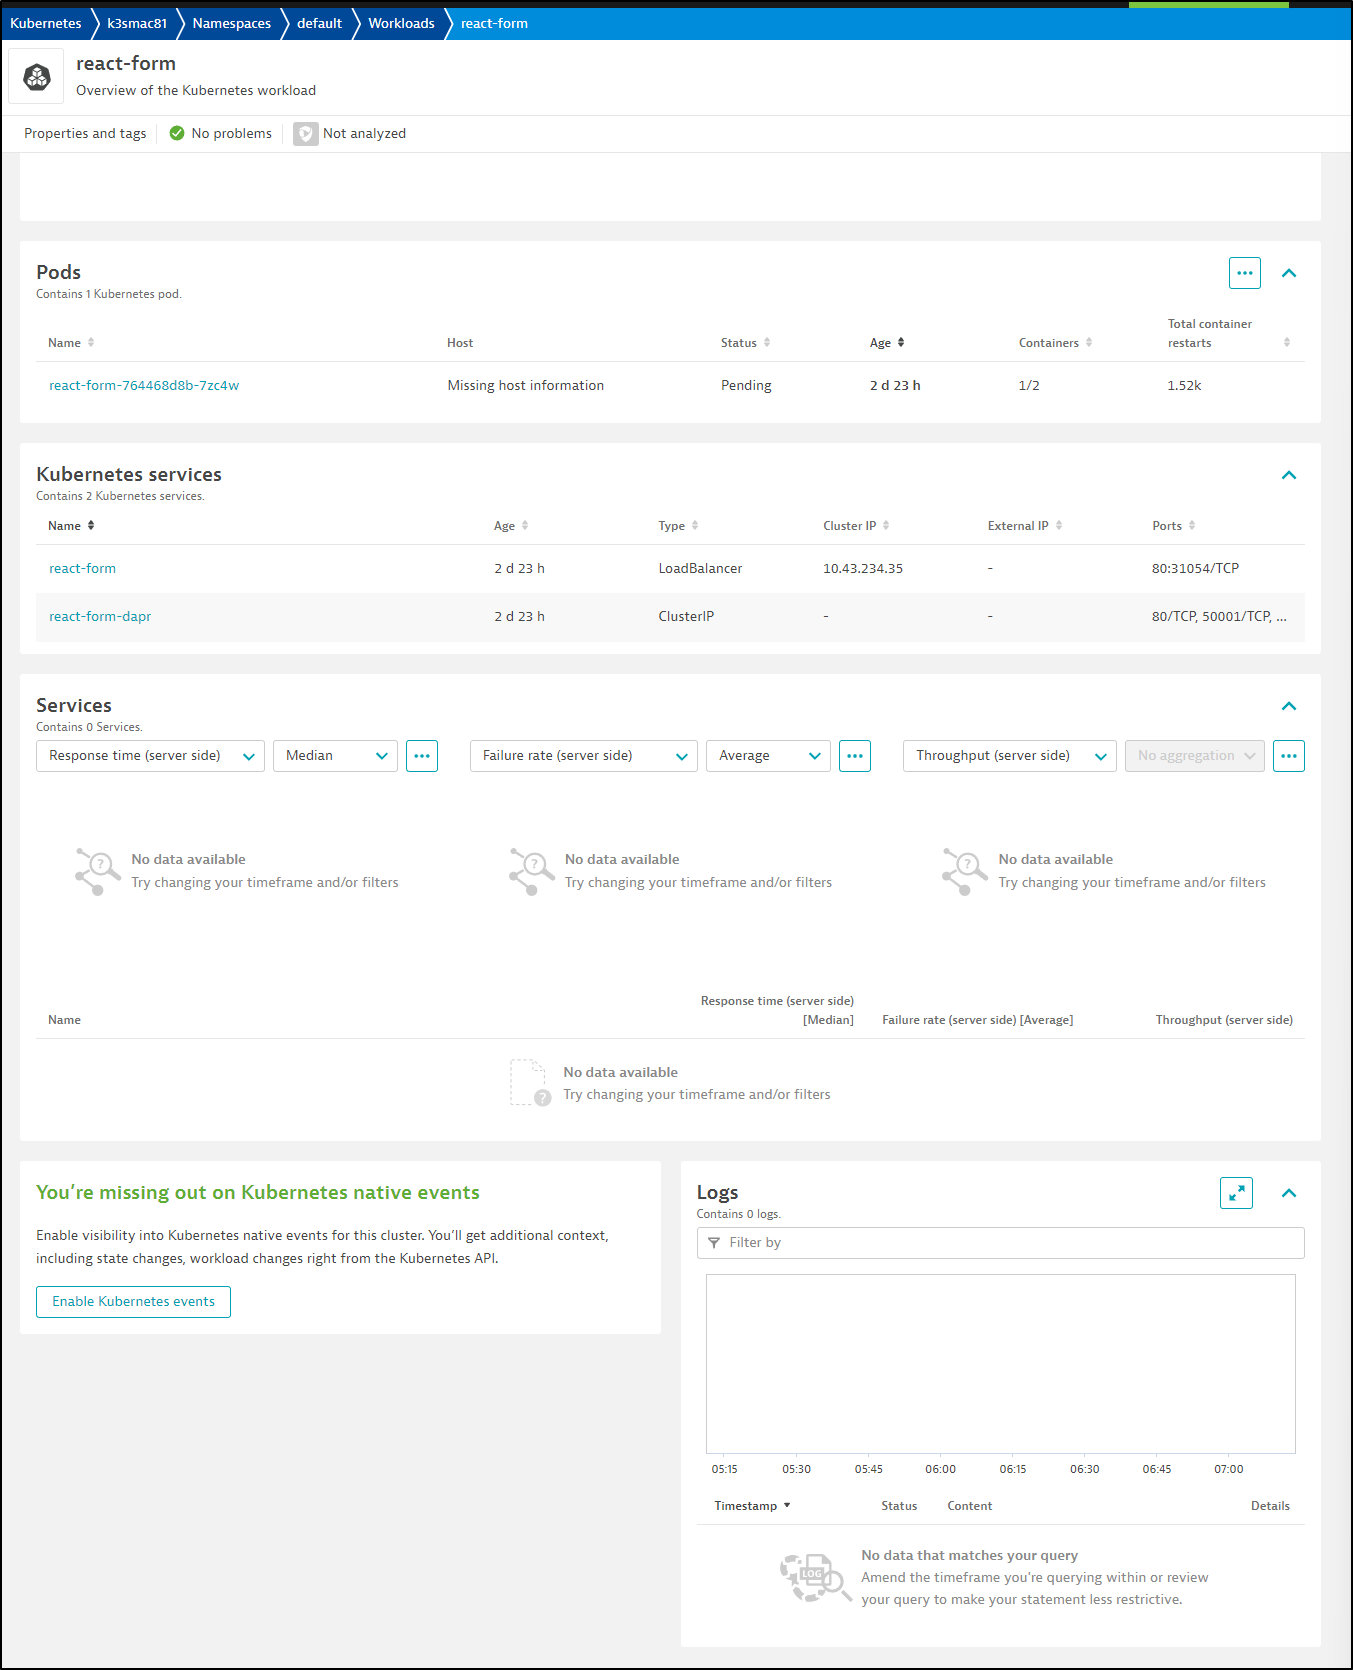
Picking react-form I see some basic details but nothing clueing me in to why it fails
I noticed that button on the bottom left about “enable Kubernetes events”. I clicked that next.
I saw three toggles set to off that I went and enabled
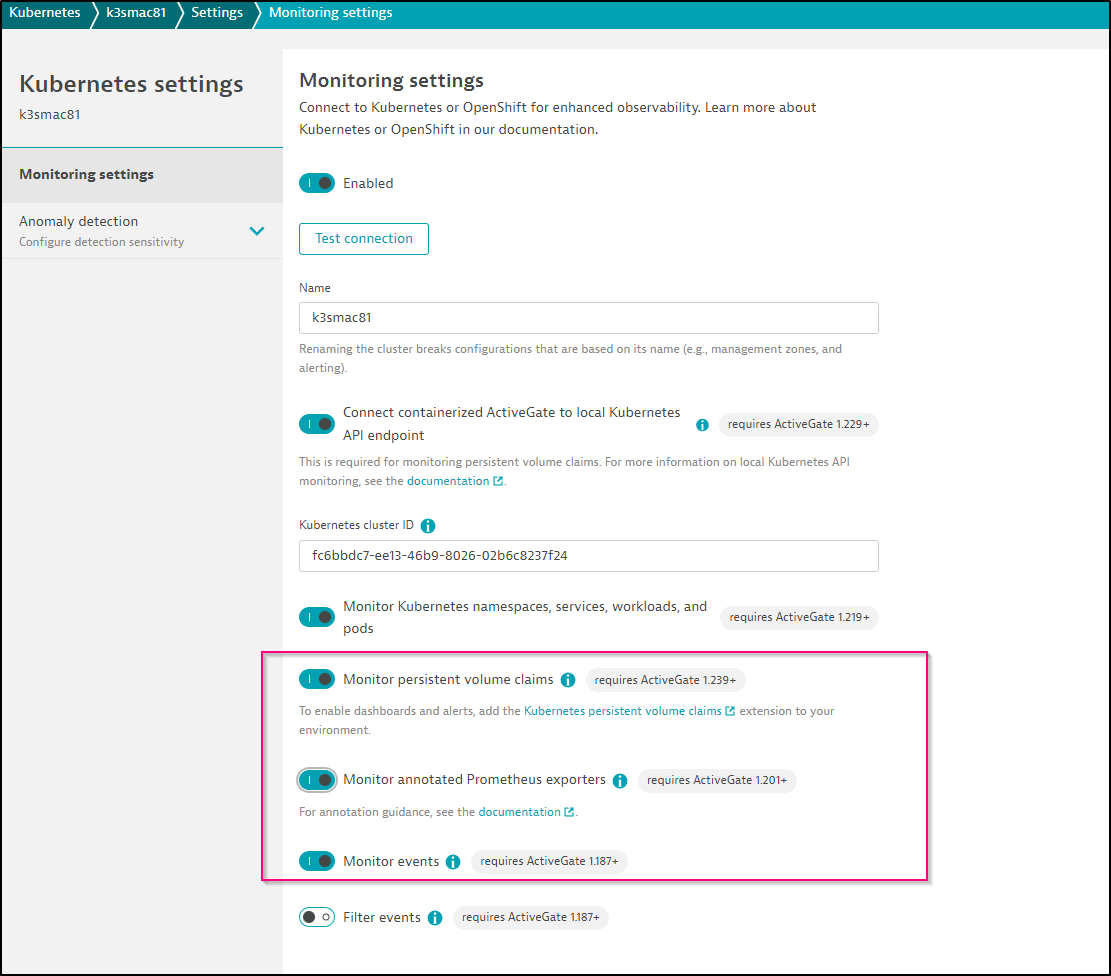
Don’t forget to save settings. On a large monitor, I nearly missed the dialogue which is at the far lower left.

Just to be safe, I rotated the failing pods after I made the settings change
$ kubectl delete pod react-form-764468d8b-7zc4w && kubectl delete pod node-subscriber-6d99bd4bd7-brbd7 && kubectl delete pod python-subscriber-79986596f9-t4zpk
pod "react-form-764468d8b-7zc4w" deleted
pod "node-subscriber-6d99bd4bd7-brbd7" deleted
pod "python-subscriber-79986596f9-t4zpk" deleted
While I don’t see details under the actual react form workload, I do now see Failed Events in the Kubernetes Infrastructure dashboard
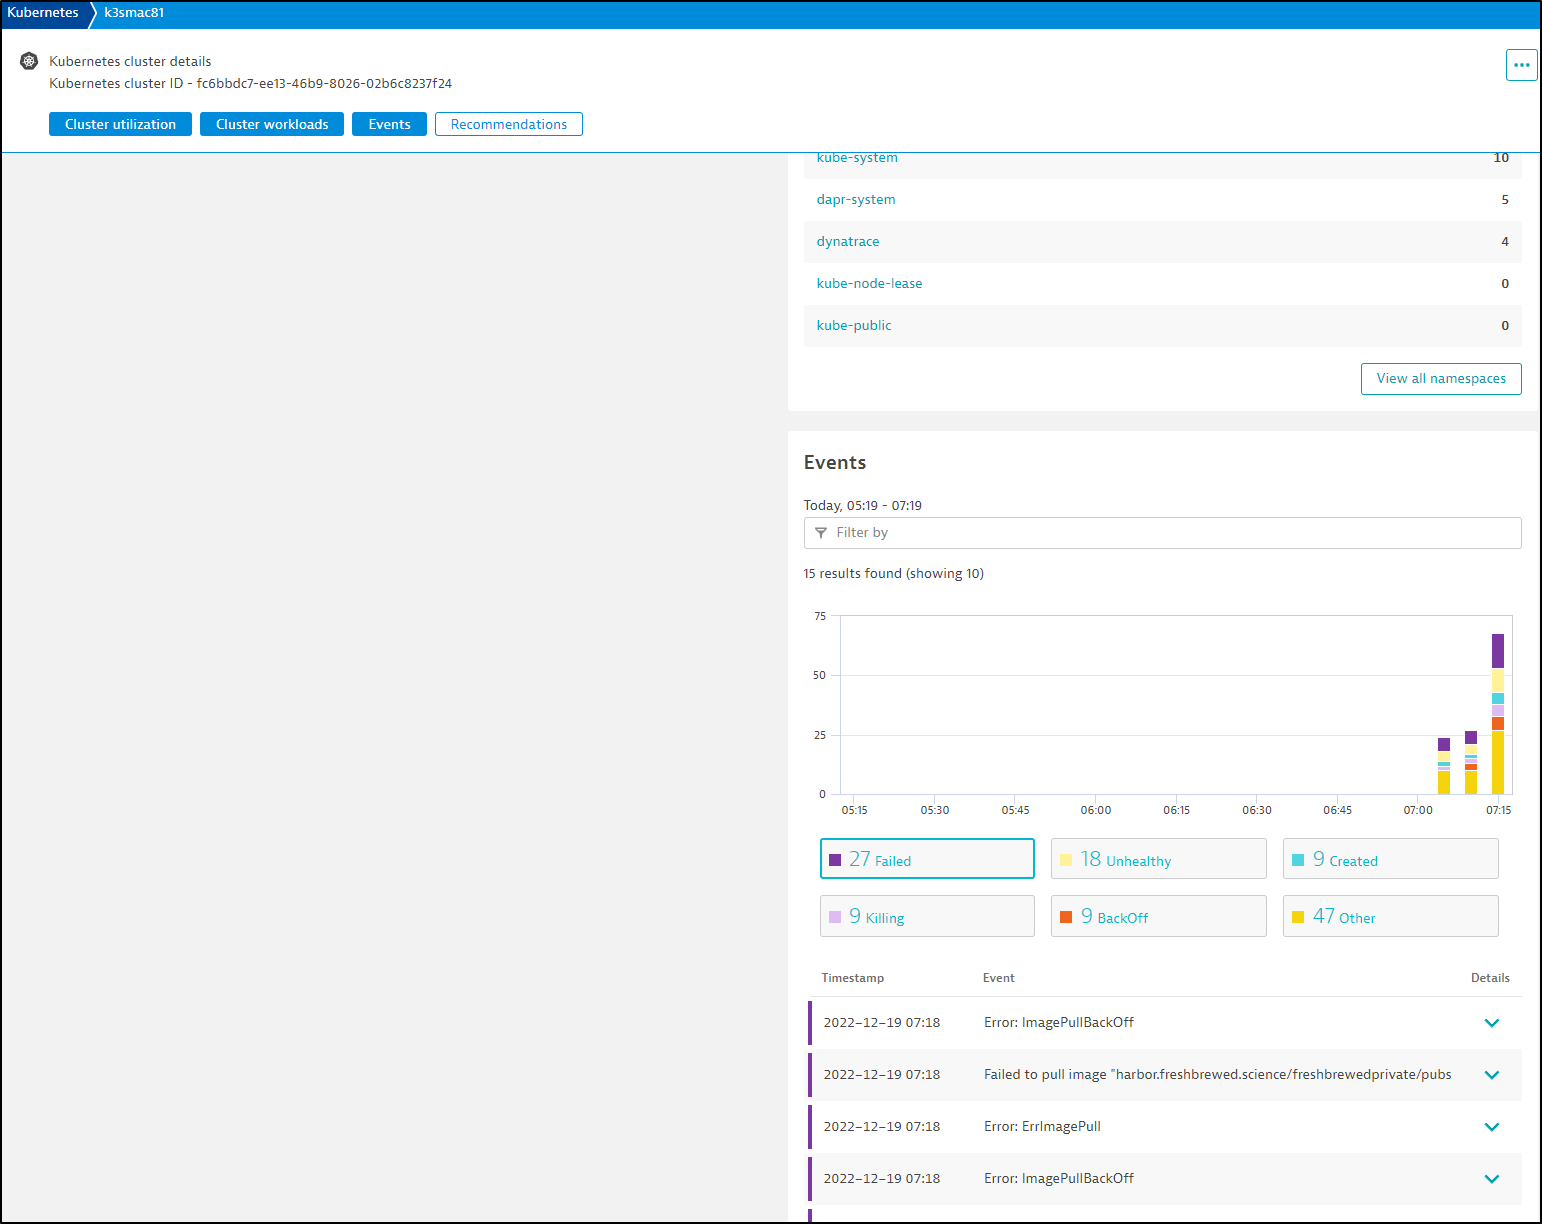
The details show me some information
If I go to Kubernetes and describe pod, it becomes pretty clear my container pull failure comes from a 401 unauthorized - either my Harbor Reg is absent or errant
$ kubectl describe pod react-form-764468d8b-jhzxs | tail -n15
Events:
  Type     Reason     Age                    From               Message
  ----     ------     ----                   ----               -------
  Normal   Scheduled  6m39s                  default-scheduler  Successfully assigned default/react-form-764468d8b-jhzxs to builder-macbookpro2
  Normal   Created    6m35s                  kubelet            Created container daprd
  Normal   Started    6m35s                  kubelet            Started container daprd
  Normal   Pulling    6m23s (x2 over 6m37s)  kubelet            Pulling image "harbor.freshbrewed.science/freshbrewedprivate/pubsub-react-form:gcp4"
  Warning  Failed     6m22s (x2 over 6m36s)  kubelet            Failed to pull image "harbor.freshbrewed.science/freshbrewedprivate/pubsub-react-form:gcp4": rpc error: code = Unknown desc = failed to pull and unpack image "harbor.freshbrewed.science/freshbrewedprivate/pubsub-react-form:gcp4": failed to resolve reference "harbor.freshbrewed.science/freshbrewedprivate/pubsub-react-form:gcp4": pulling from host harbor.freshbrewed.science failed with status code [manifests gcp4]: 401 Unauthorized
  Warning  Failed     6m22s (x2 over 6m36s)  kubelet            Error: ErrImagePull
  Warning  Unhealthy  6m20s (x3 over 6m32s)  kubelet            Liveness probe failed: HTTP probe failed with statuscode: 500
  Warning  Unhealthy  6m20s (x5 over 6m32s)  kubelet            Readiness probe failed: HTTP probe failed with statuscode: 500
  Normal   Killing    6m20s                  kubelet            Container daprd failed liveness probe, will be restarted
  Warning  Failed     6m18s (x3 over 6m34s)  kubelet            Error: ImagePullBackOff
  Normal   Pulled     6m18s (x2 over 6m36s)  kubelet            Container image "docker.io/daprio/daprd:1.9.5" already present on machine
  Normal   BackOff    95s (x38 over 6m34s)   kubelet            Back-off pulling image "harbor.freshbrewed.science/freshbrewedprivate/pubsub-react-form:gcp4"
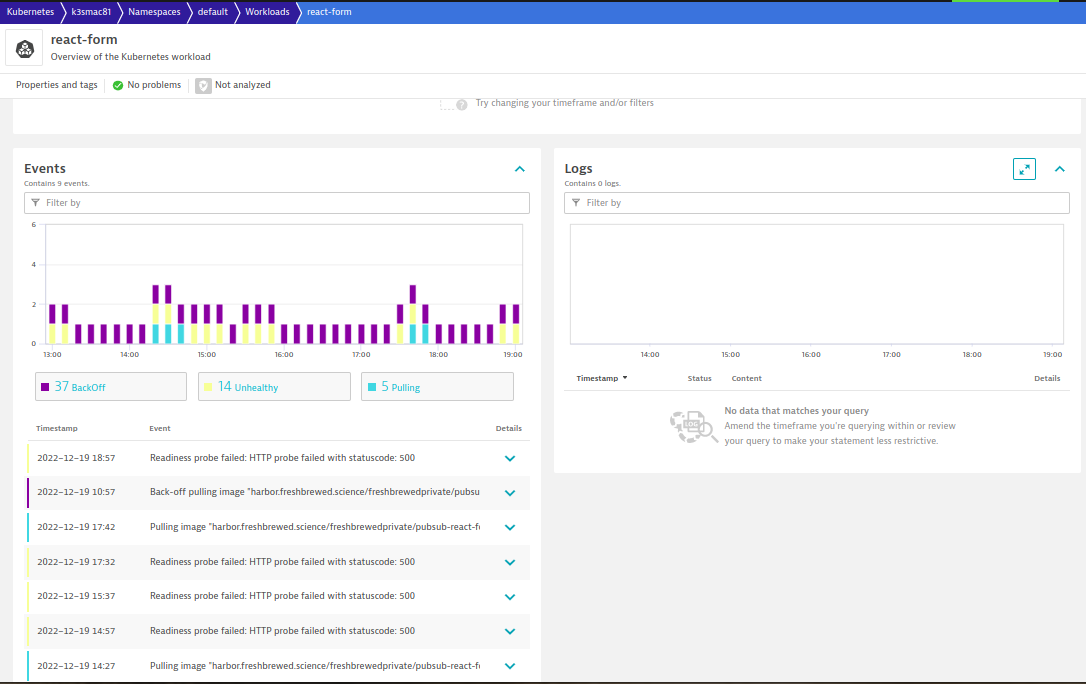
I waited for several hours and came back to see if we would see new details about failed pods
If I go to the react form, we can see events now (but not logs)
I used the calculator app a bit and checked logs
$ kubectl logs calculator-front-end-6694bbfdf-rp769
Defaulted container "calculator-front-end" out of: calculator-front-end, daprd

> react-docker-app@1.0.0 start
> node server.js

Listening on port 8080!
subtract app** 1
subtract app** 2
subtract app** 1
subtract app** 2
subtract app** 1
subtract app** 2
subtract app** 1
subtract app** 2
subtract app** 1
subtract app** 2
subtract app** 1
subtract app** 2
subtract app** 1
subtract app** 2
subtract app** 1
subtract app** 2
subtract app** 1
subtract app** 2
subtract app** 1
subtract app** 2
subtract app** 1
subtract app** 2
subtract app** 1
subtract app** 2
subtract app** 1
subtract app** 2
subtract app** 1
subtract app** 2
subtract app** 1
subtract app** 2
subtract app** 1
subtract app** 2
subtract app** 1
subtract app** 2
subtract app** 1
subtract app** 2
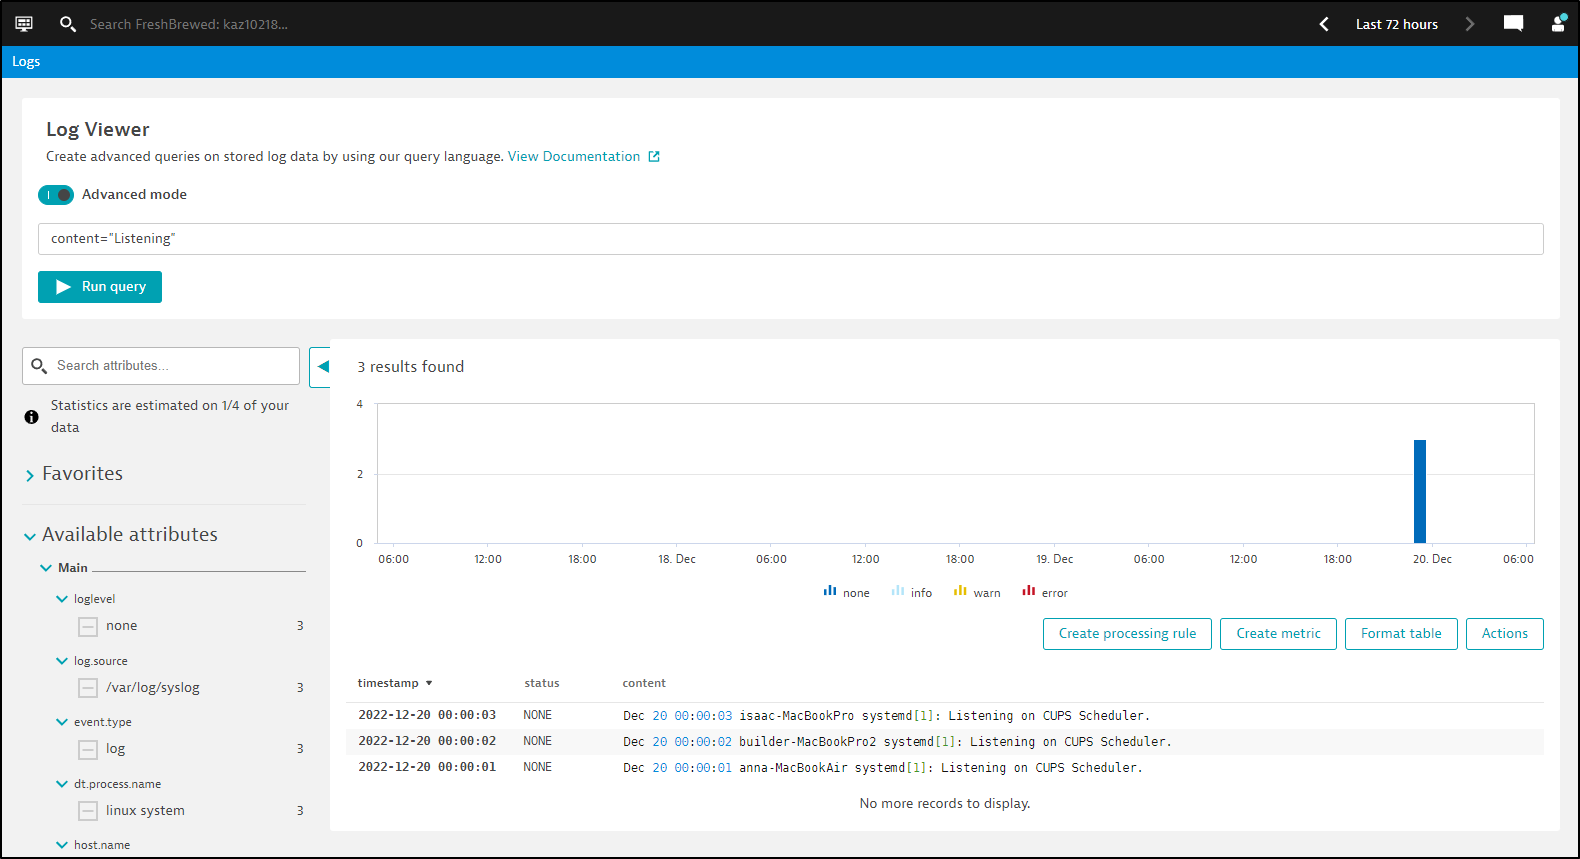
I then looked to Dynatrace to see if the logs would be there
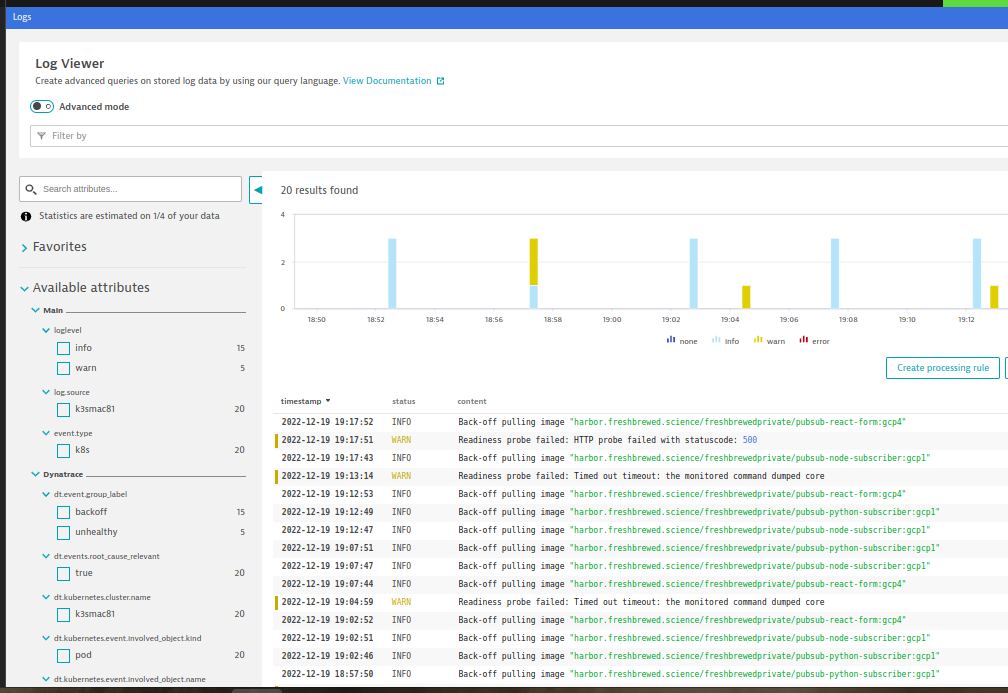
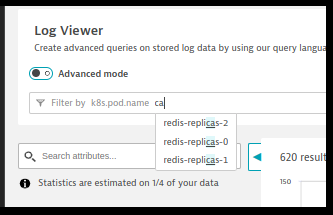
I’ve even checked for all logs for the last 24h and there was no calculator shown in pod.name
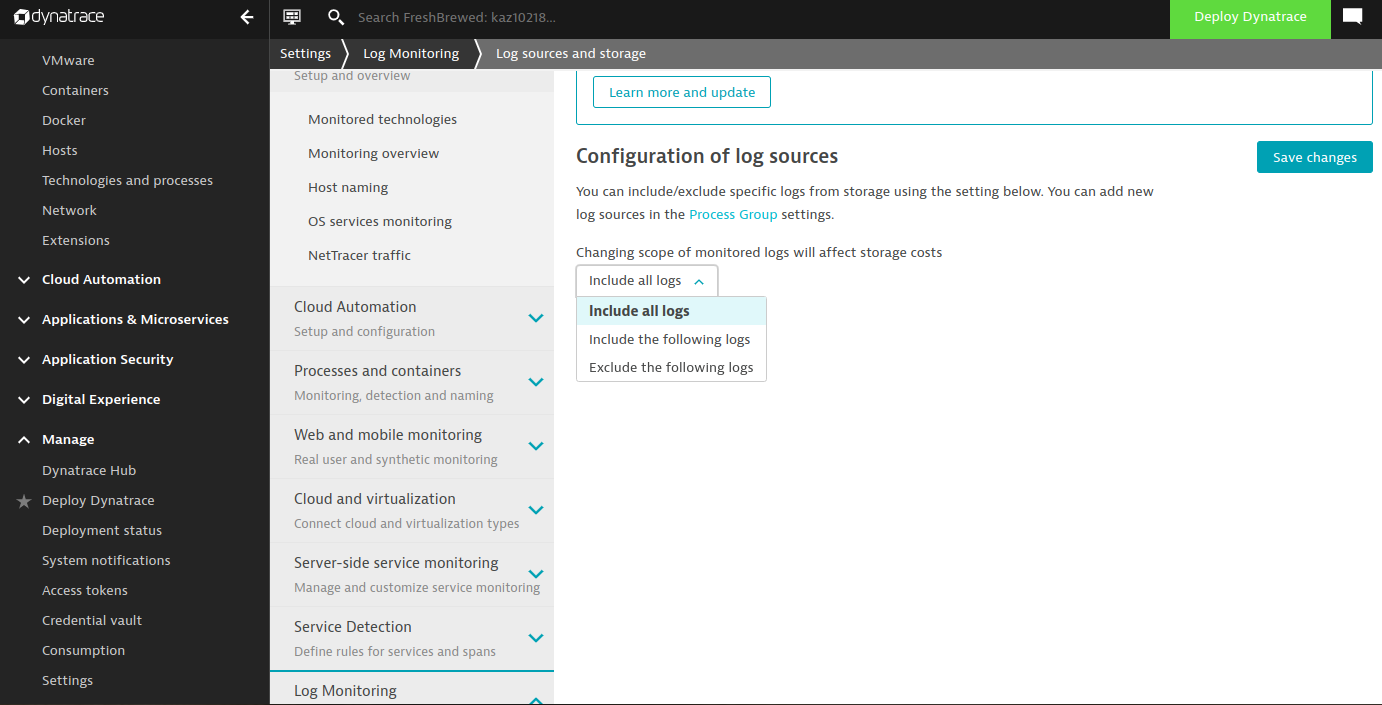
I tried setting Monitoring to ALL logs
I cycled the pod again and saw some events show up in the Logs for the former and new pod
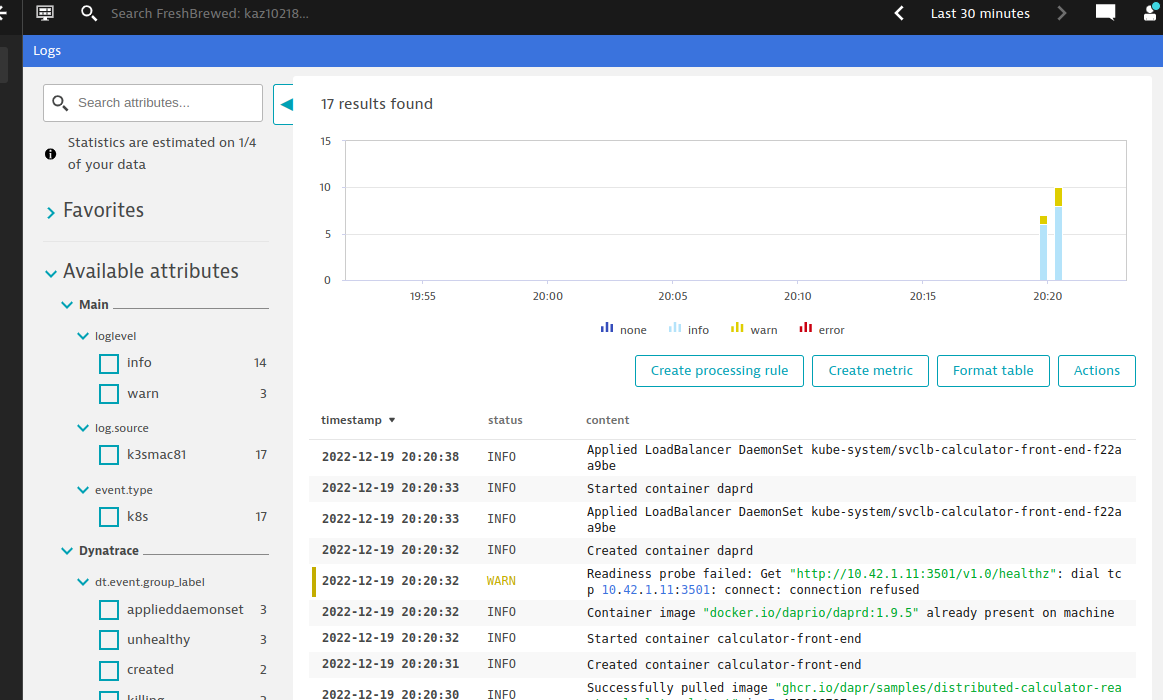
However, this did not include the logs I expected, which I could pull by querying for logs from the new pod
$ kubectl logs calculator-front-end-6694bbfdf-vmd88
Defaulted container "calculator-front-end" out of: calculator-front-end, daprd

> react-docker-app@1.0.0 start
> node server.js

Listening on port 8080!
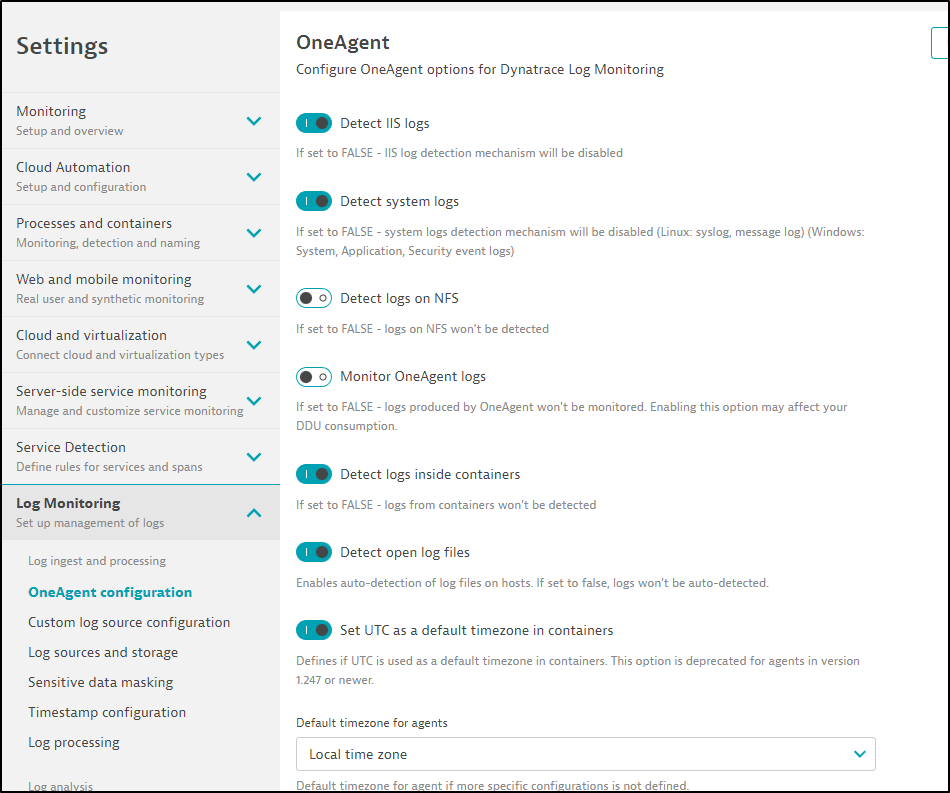
I came back the next day and searched again, still no finding the pod logs
I did double check that OneAgent was set to log enabled
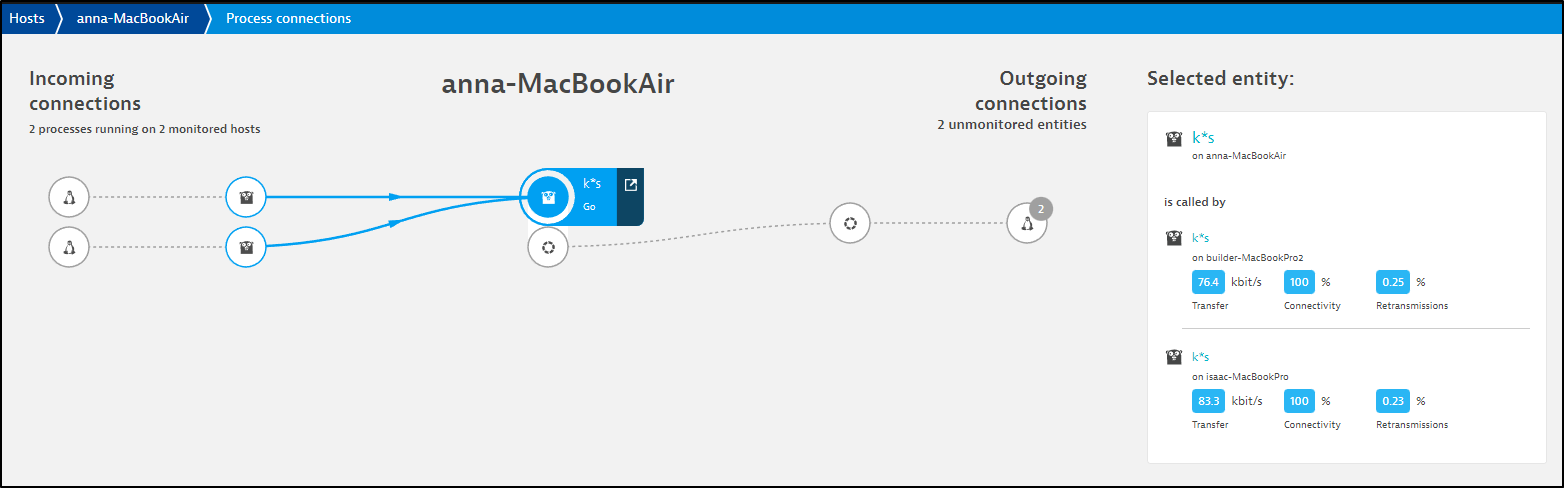
Network
The OneAgent can capture more than just basic Kubernetes Metrics. We can pull some network stats, even without adding the OneAgent on the hosts themselves.
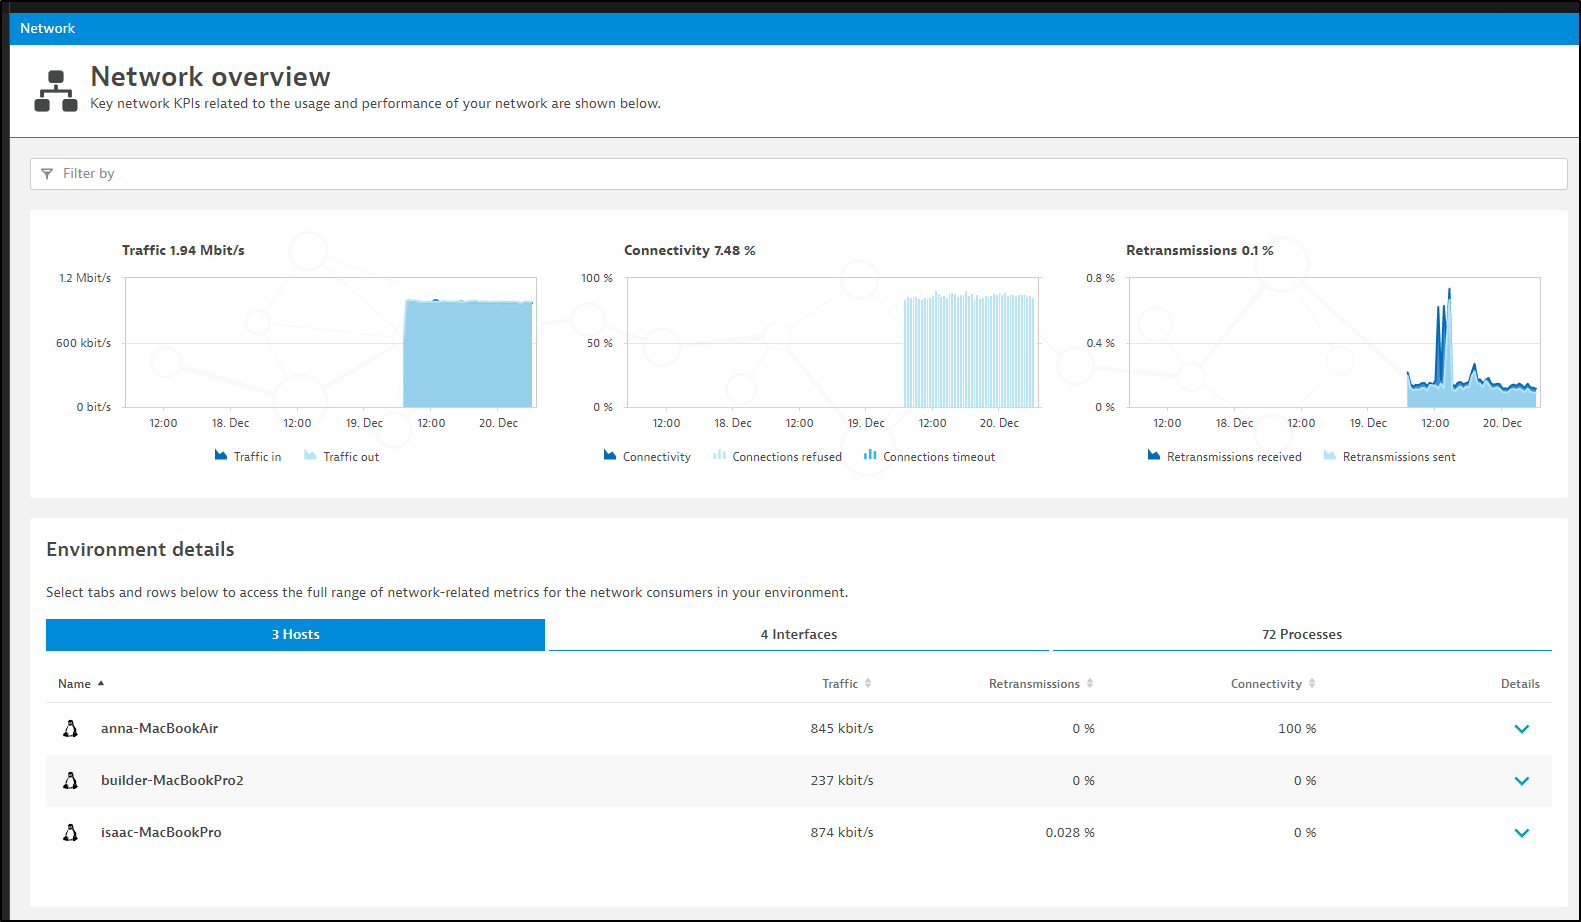
We can see most of the traffic is served between nodes. This is likely because this is a disconnected cluster
Services
We can see Dynatrace has started to capture some microservice details even before I’ve setup trace capturing
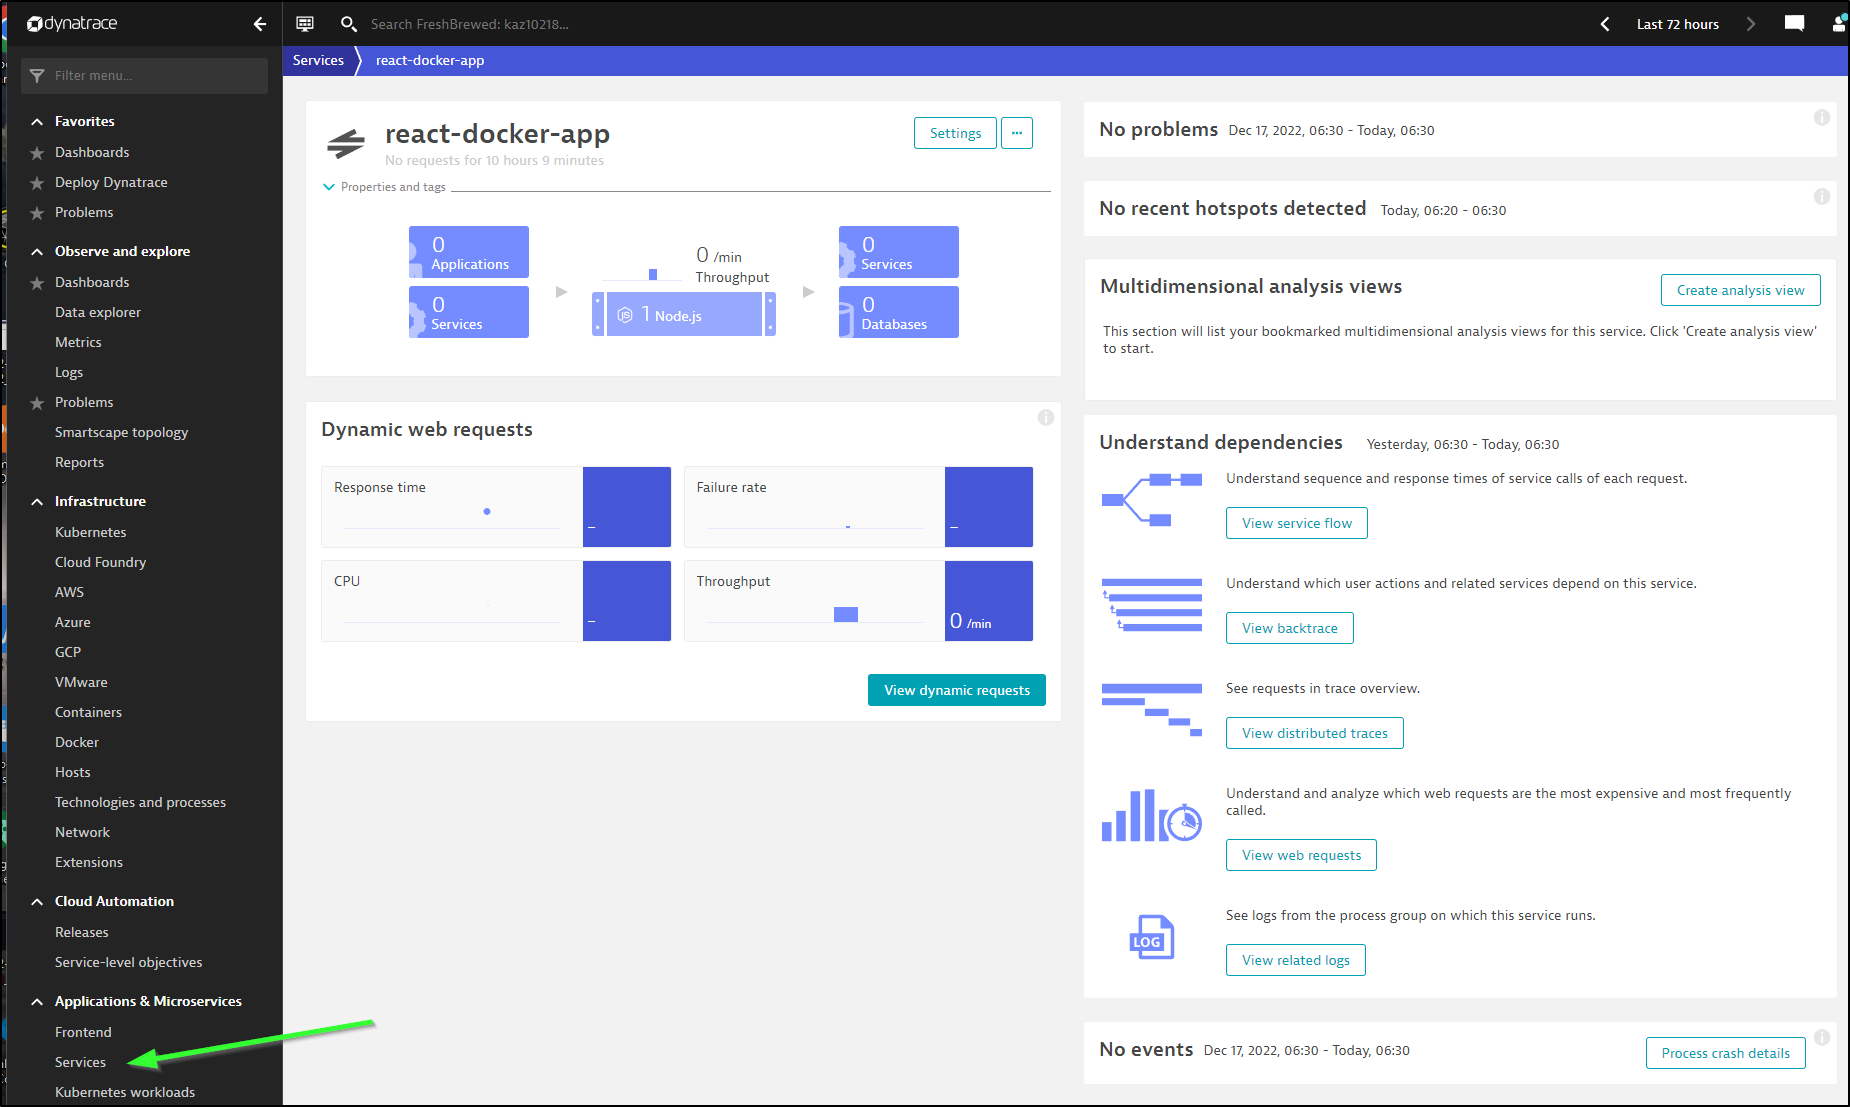
I can dig into the details to see more information about the NodeJS process.
I find this fascinating and a rather unique feature of Dynatrace - that it can get details seemingly by magic.
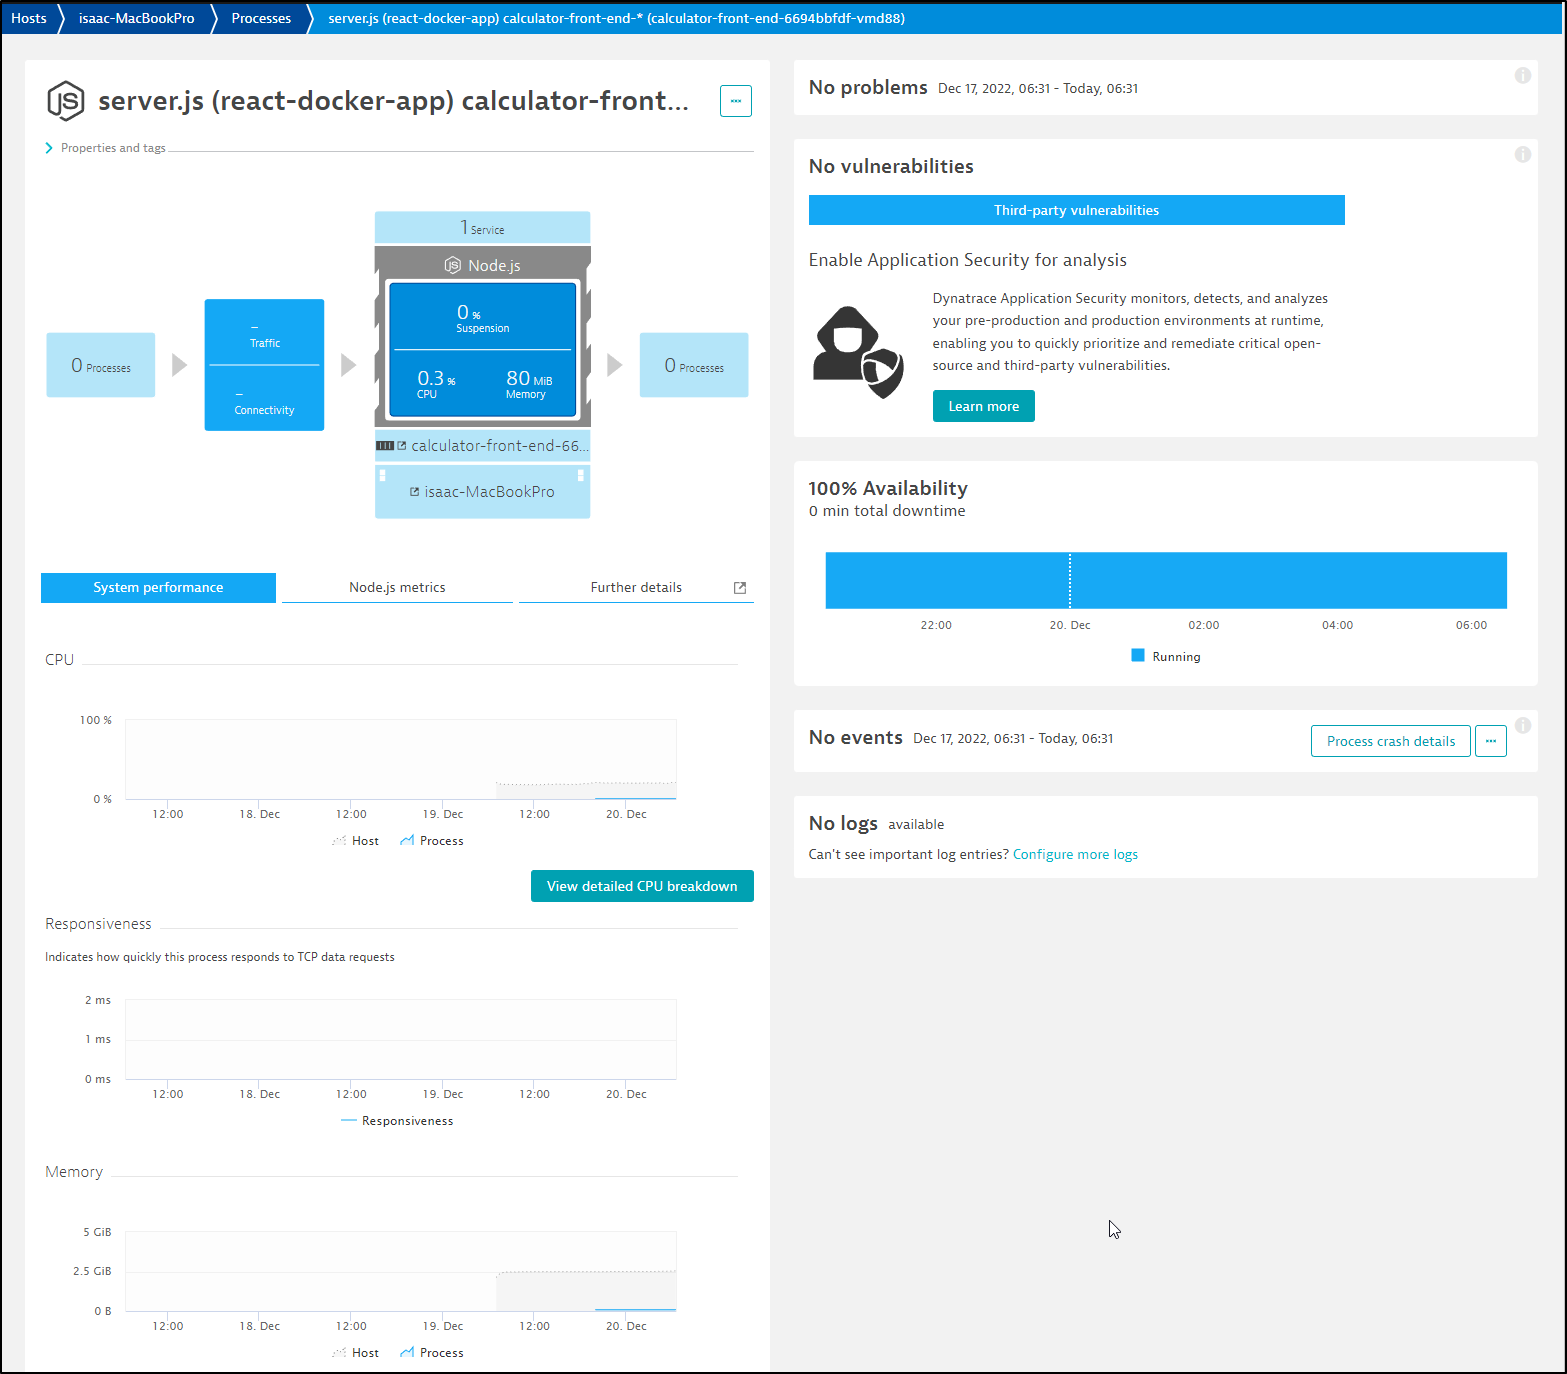
If I follow that page onto the “Calculator-Front-End” container, we can see details about the front-end service
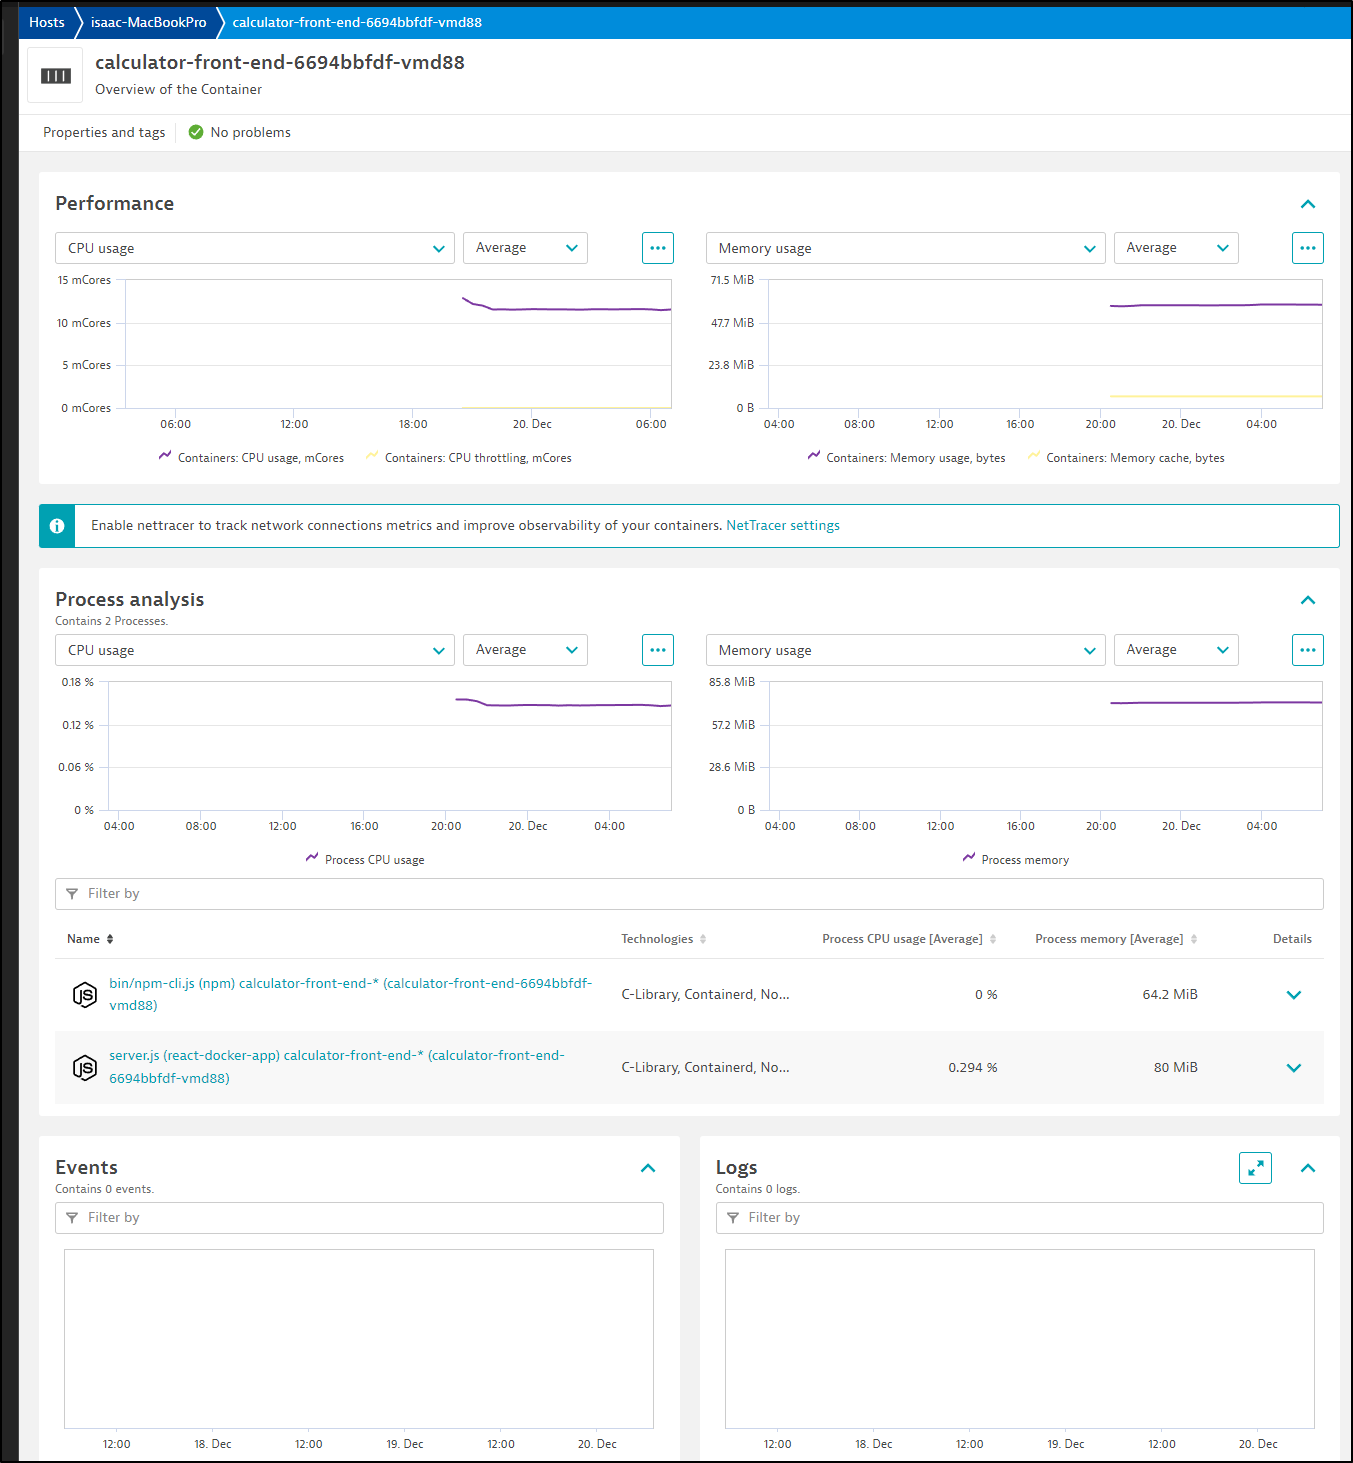
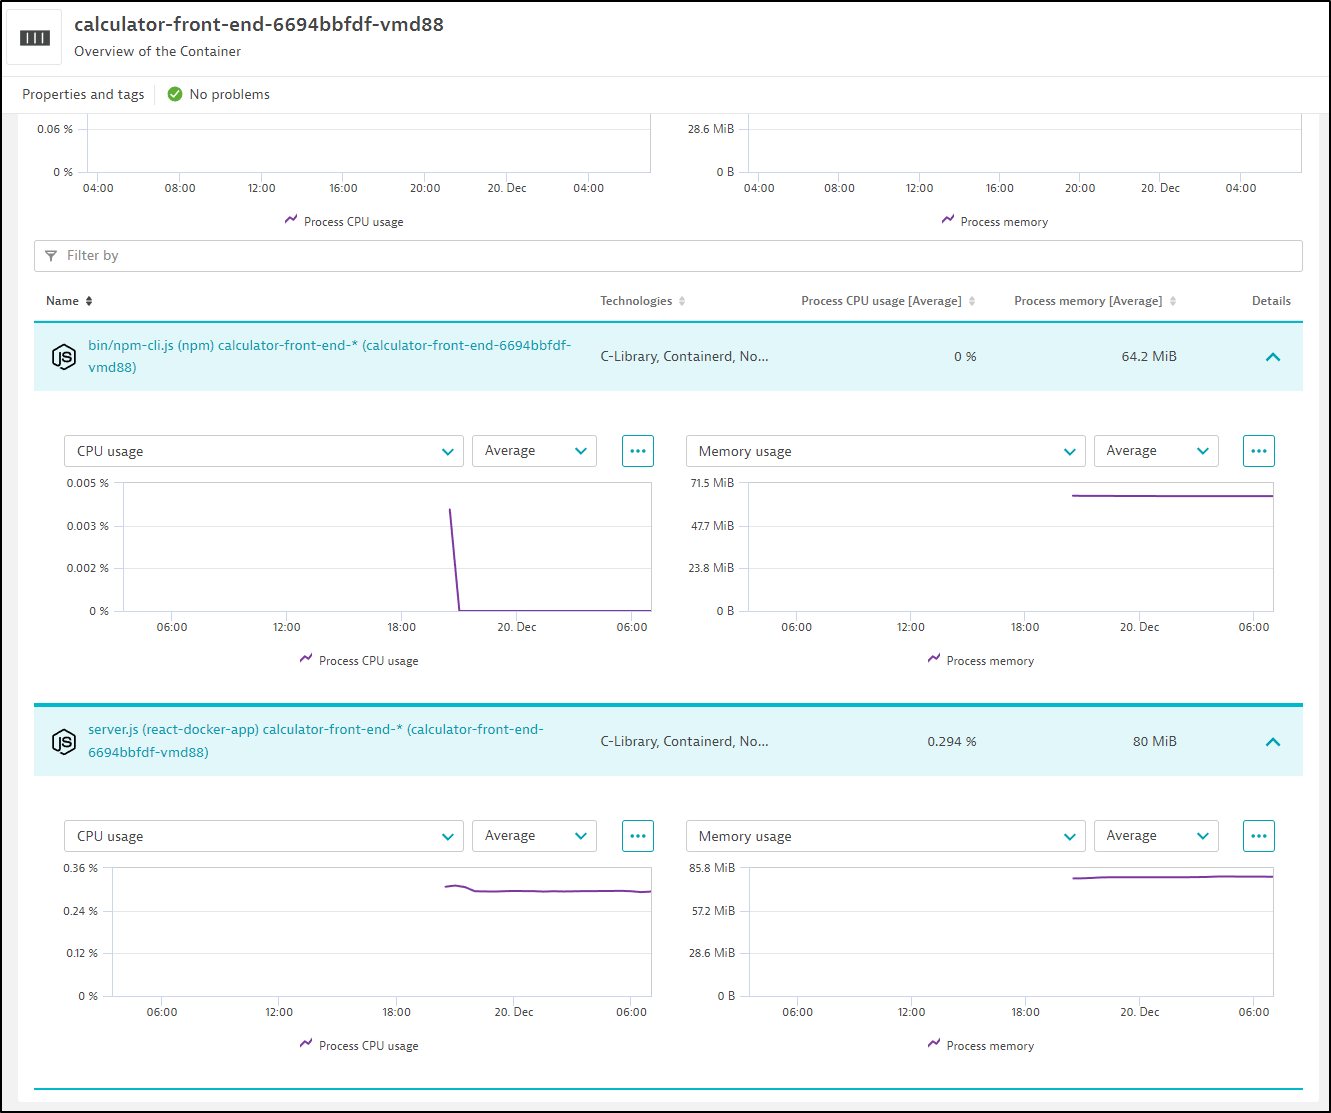
This includes details about even the processes in the container
Traces
Before I even setup OTel tracing, I can see it pulled some trace information already
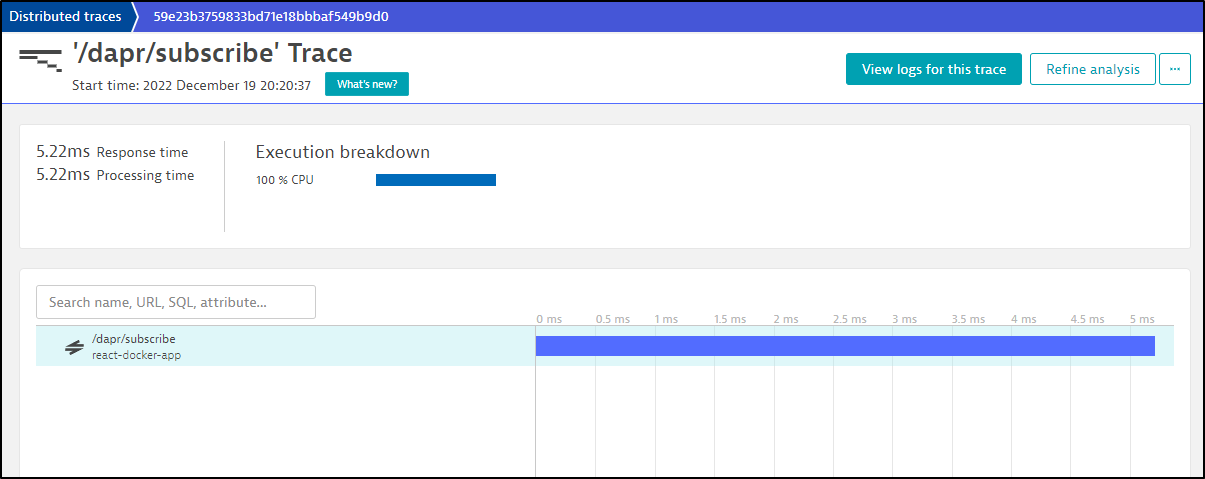
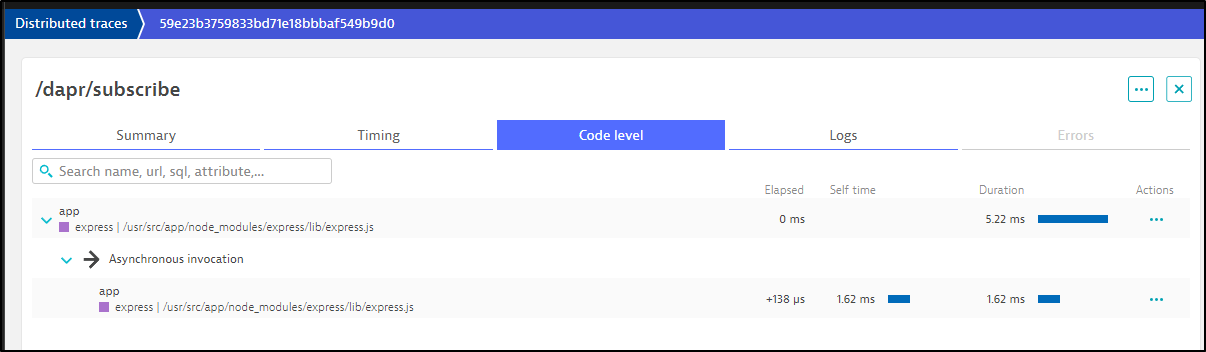
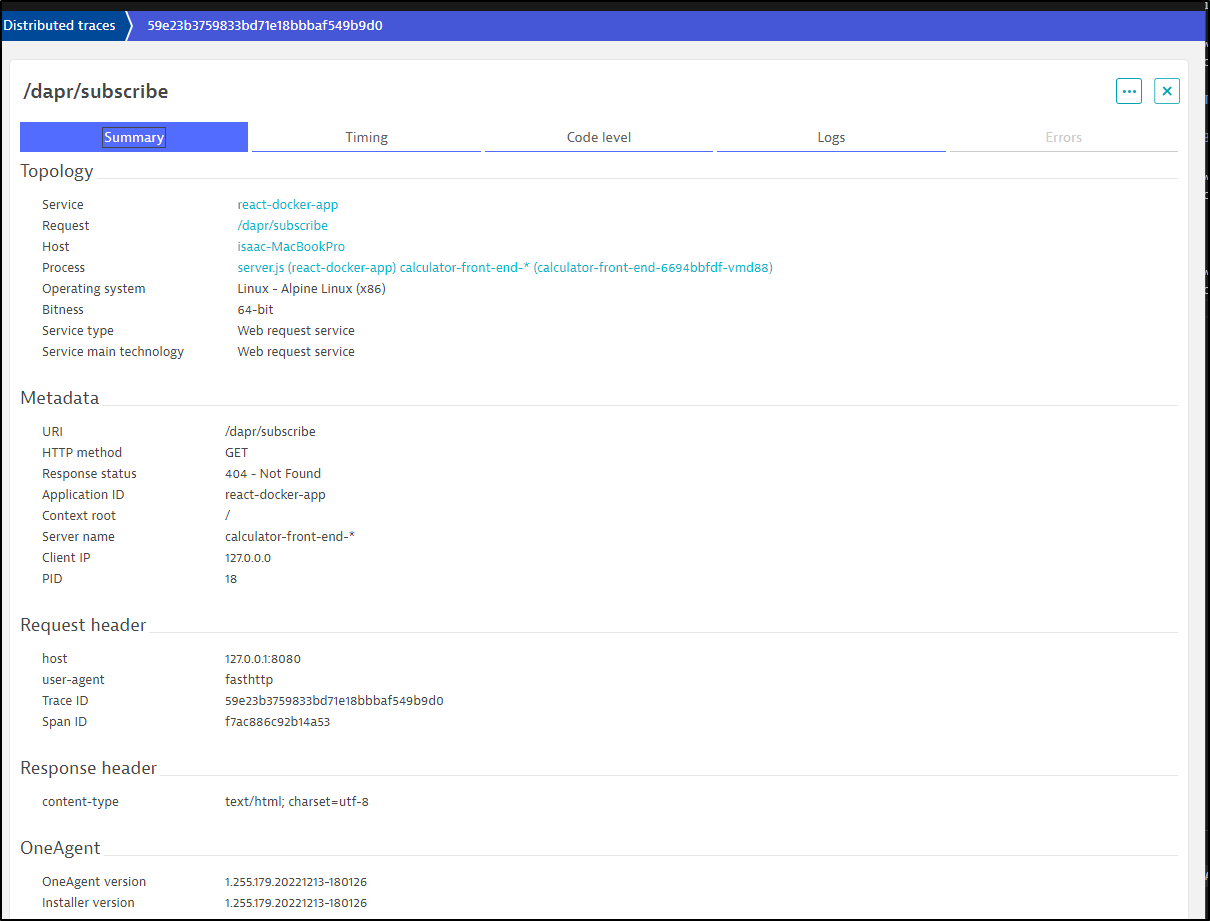
We can see the details for the Dapr subscribe process
The details gathered include the host, OS, response and more. If we captured logs related to the trace (we didn’t), we could get those as well
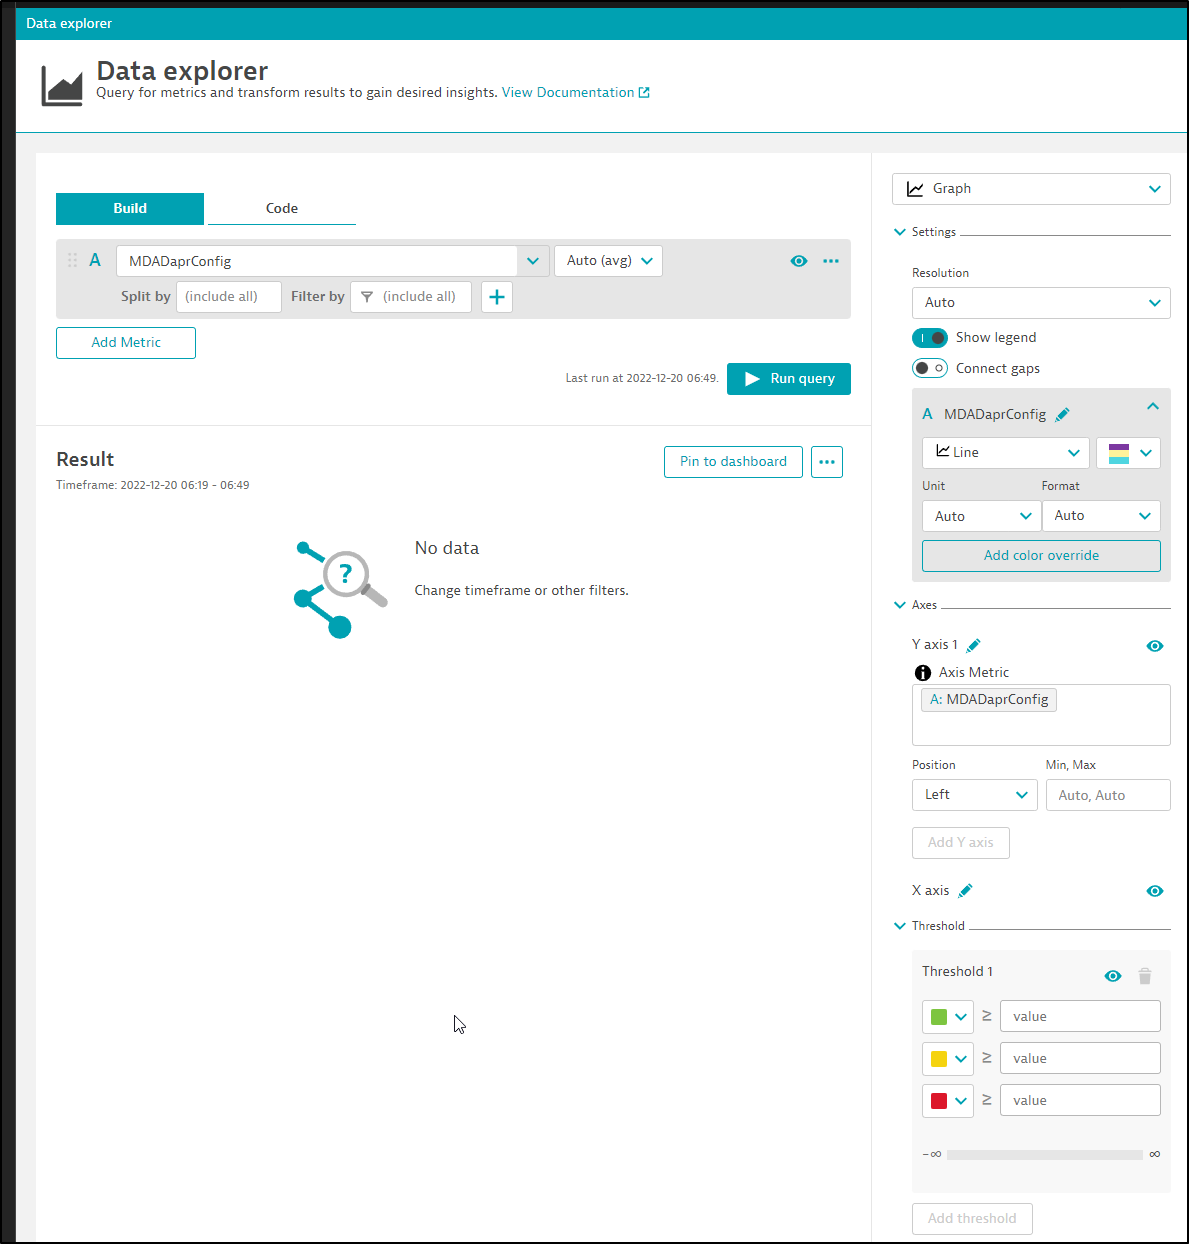
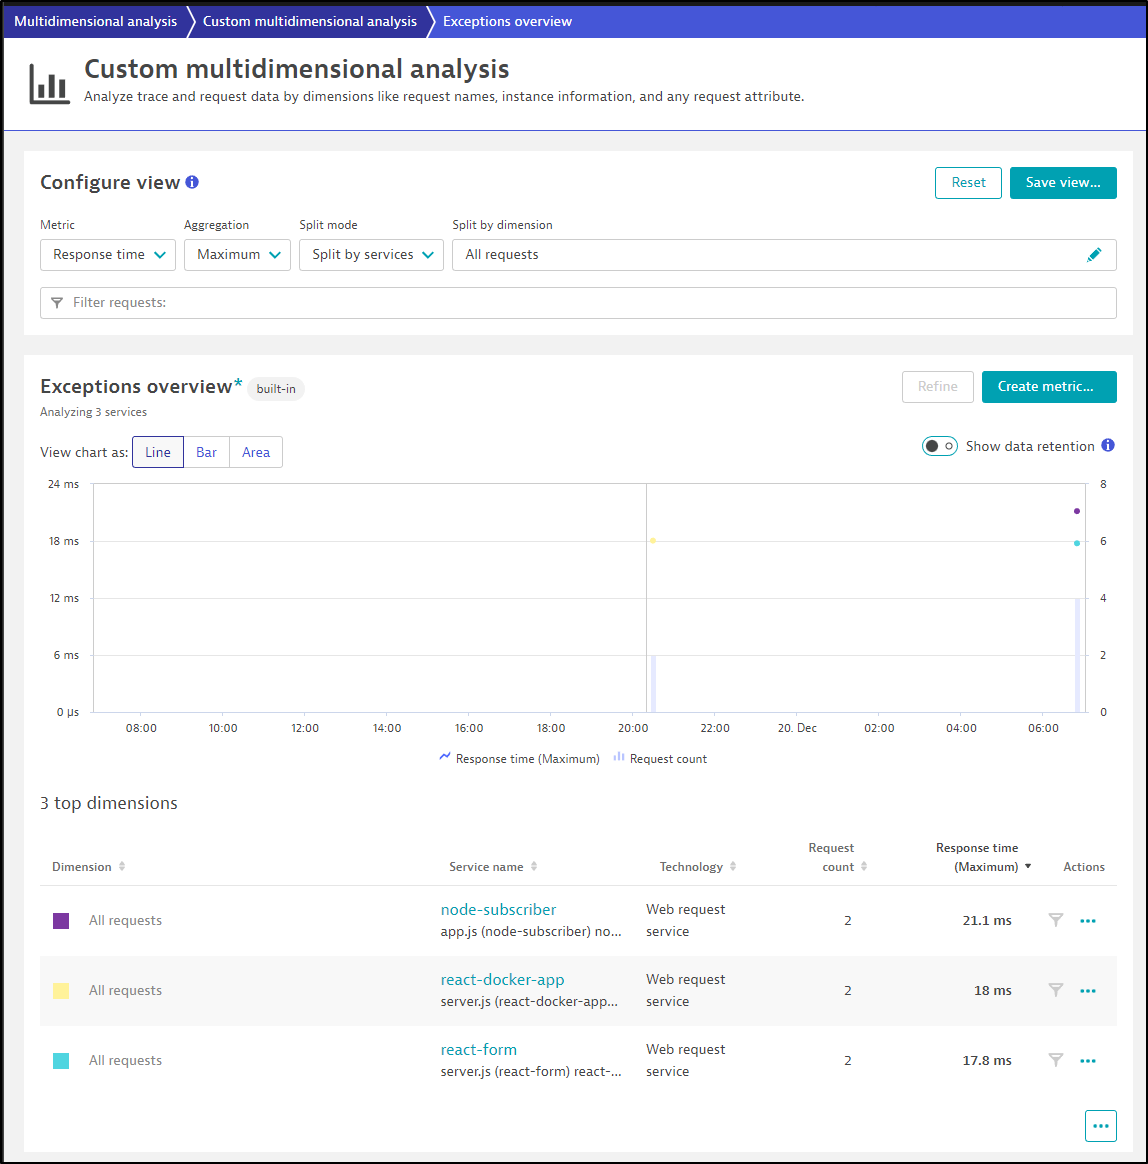
We can also turn the multi-dimensional analysis into a metric. This allows us to build rather complex reporting models on our trace data
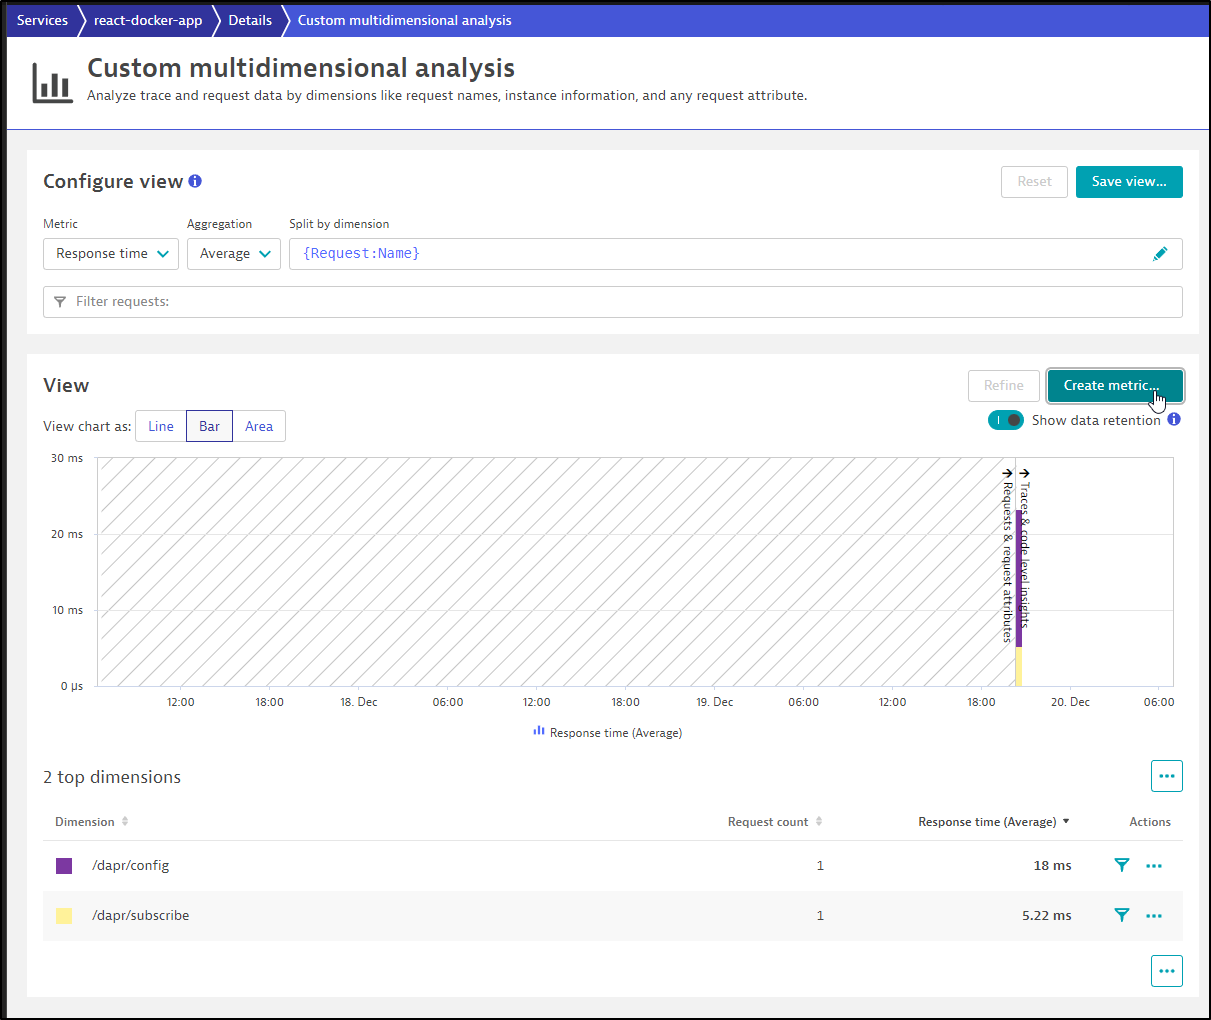
Give it a name
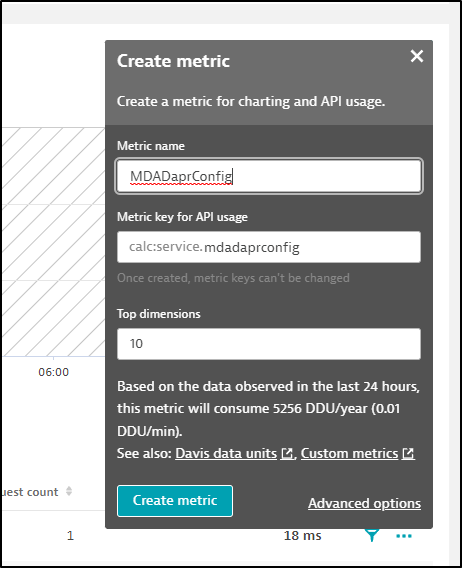
We could use it in a graph, if it had data
Metrics
Reports on Metrics are in a few places.
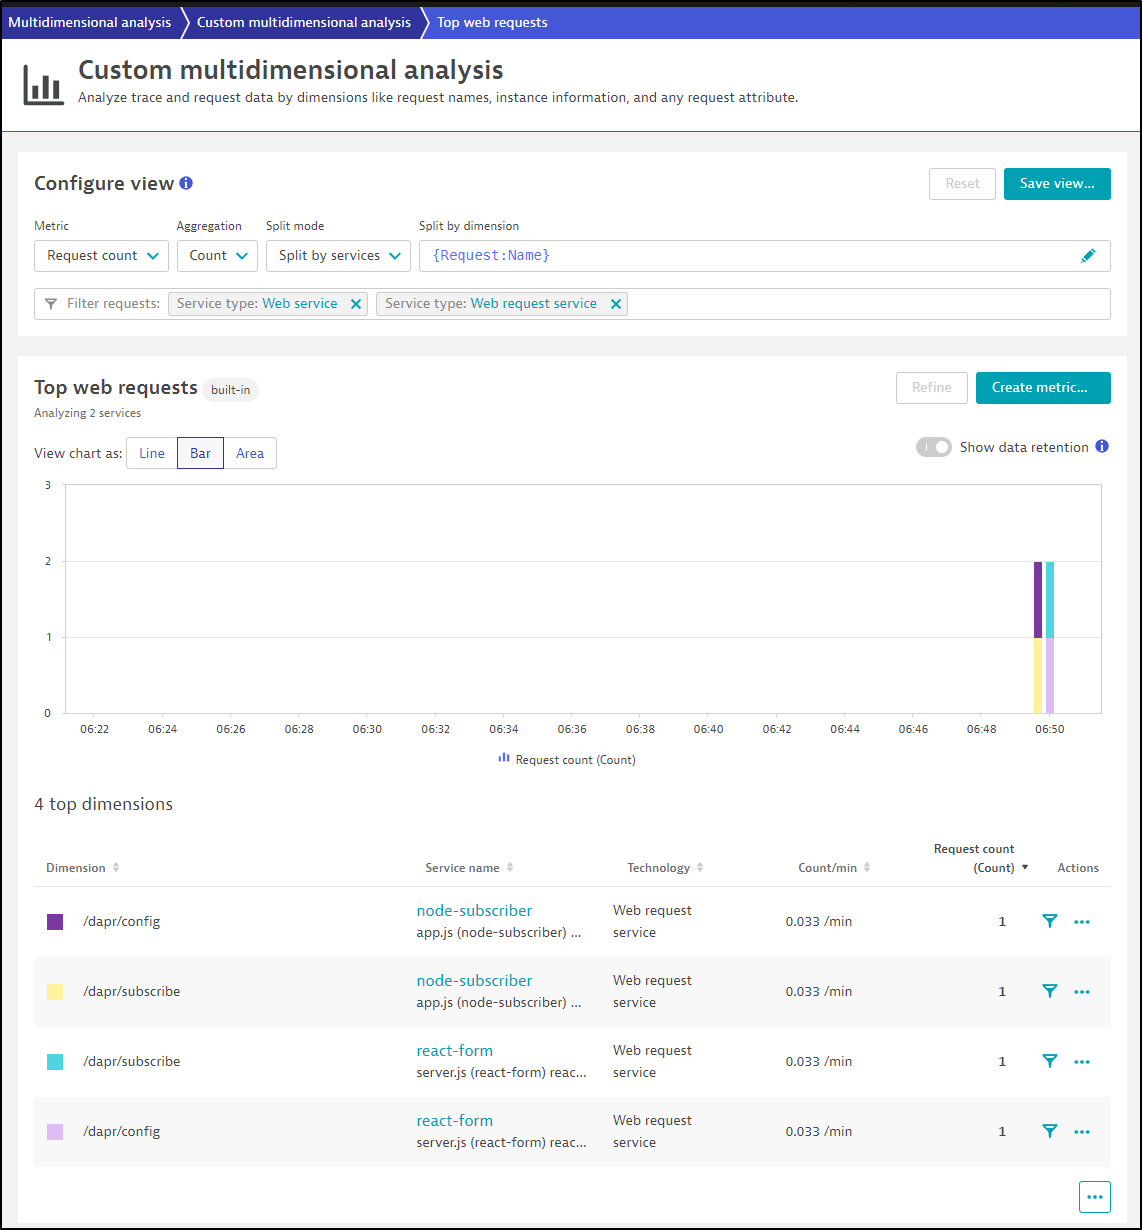
First, Let’s look at “Applications & Microservices/Multidimensional analysis”.
Here, for instance, we can view our top web requests
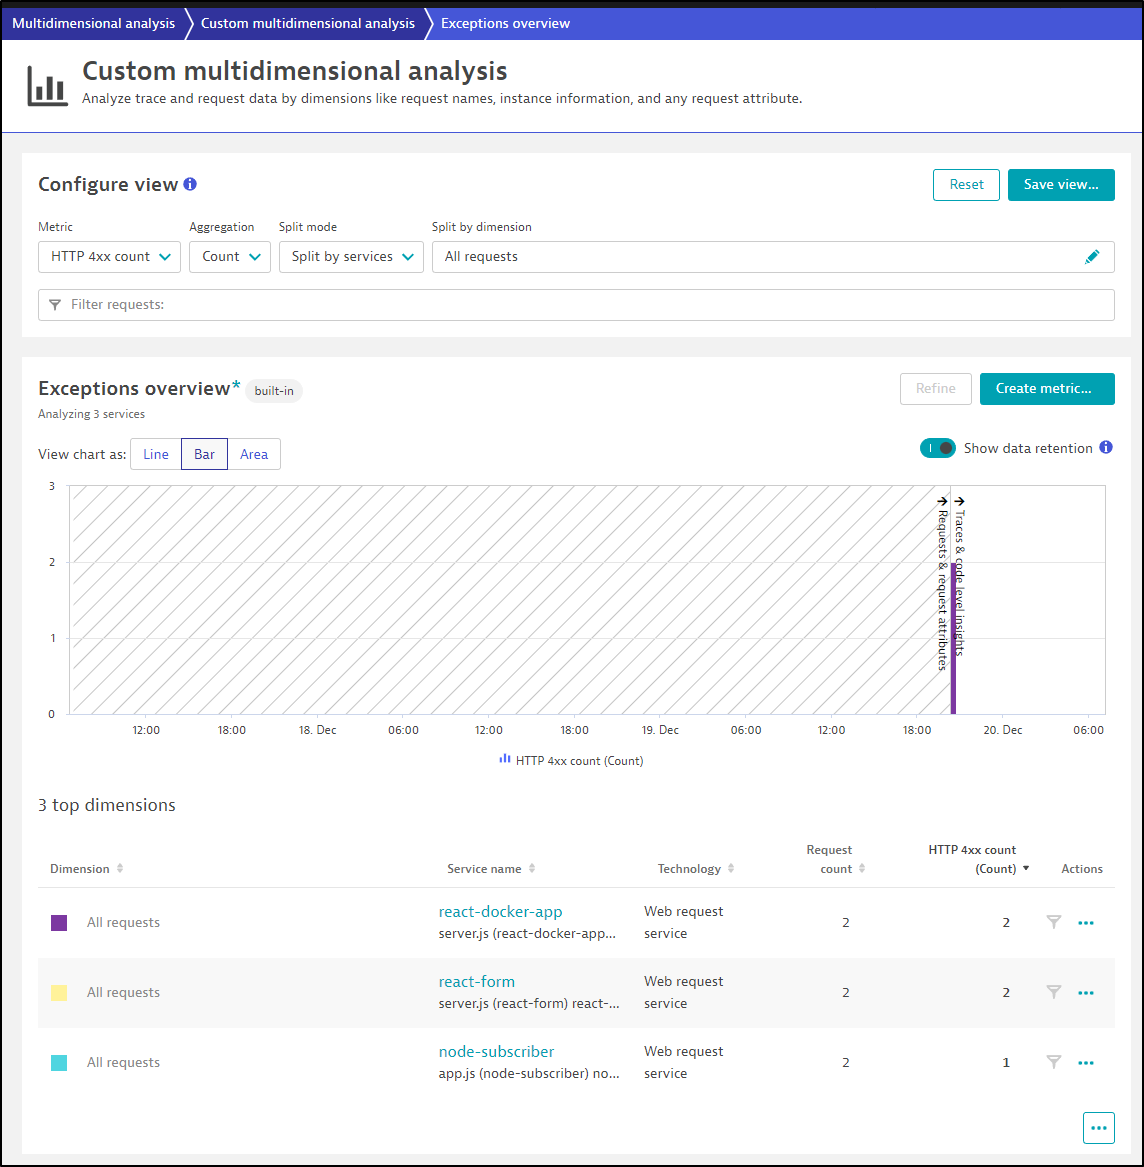
Or perhaps break down the top 4xx counts by service
or Maximum response time by service (do we have any lollygaggers)
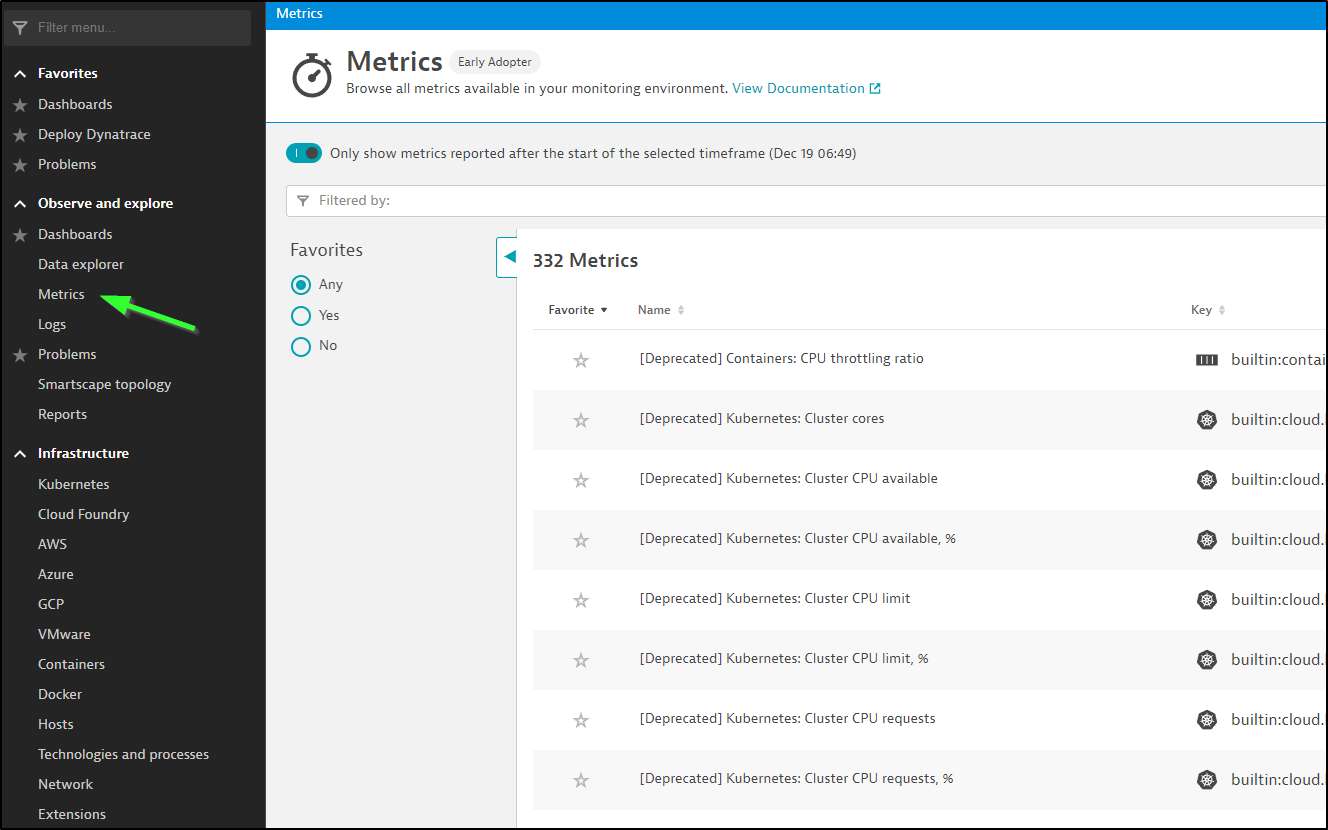
If I move over to metrics, I can see 332 collected metrics already (including Deprecated)
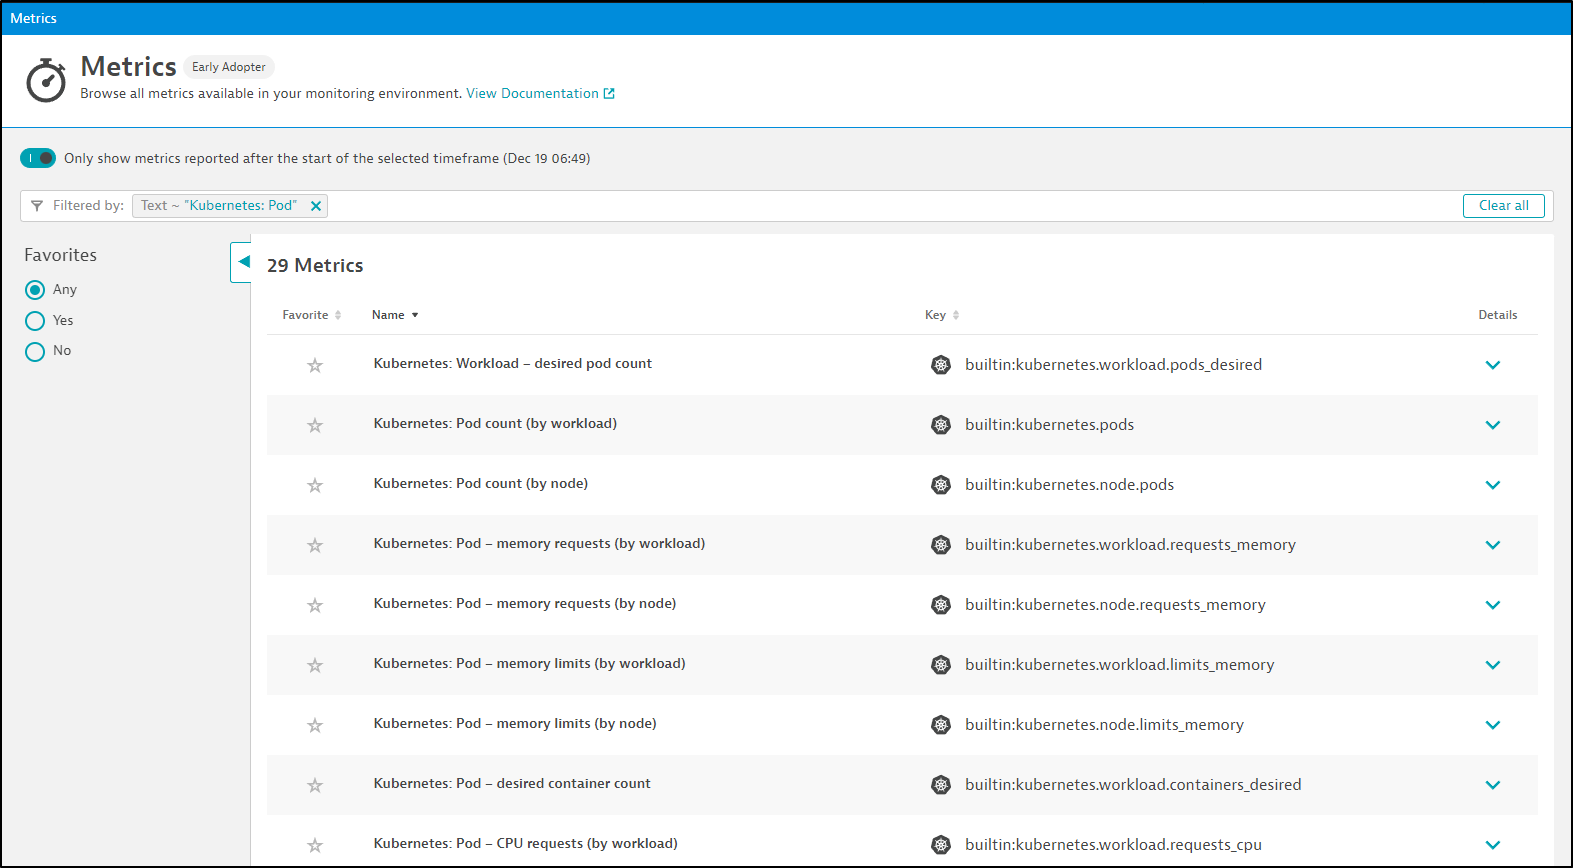
We can search by a Metric name, for instance, all metrics related to Kubernetes Pods
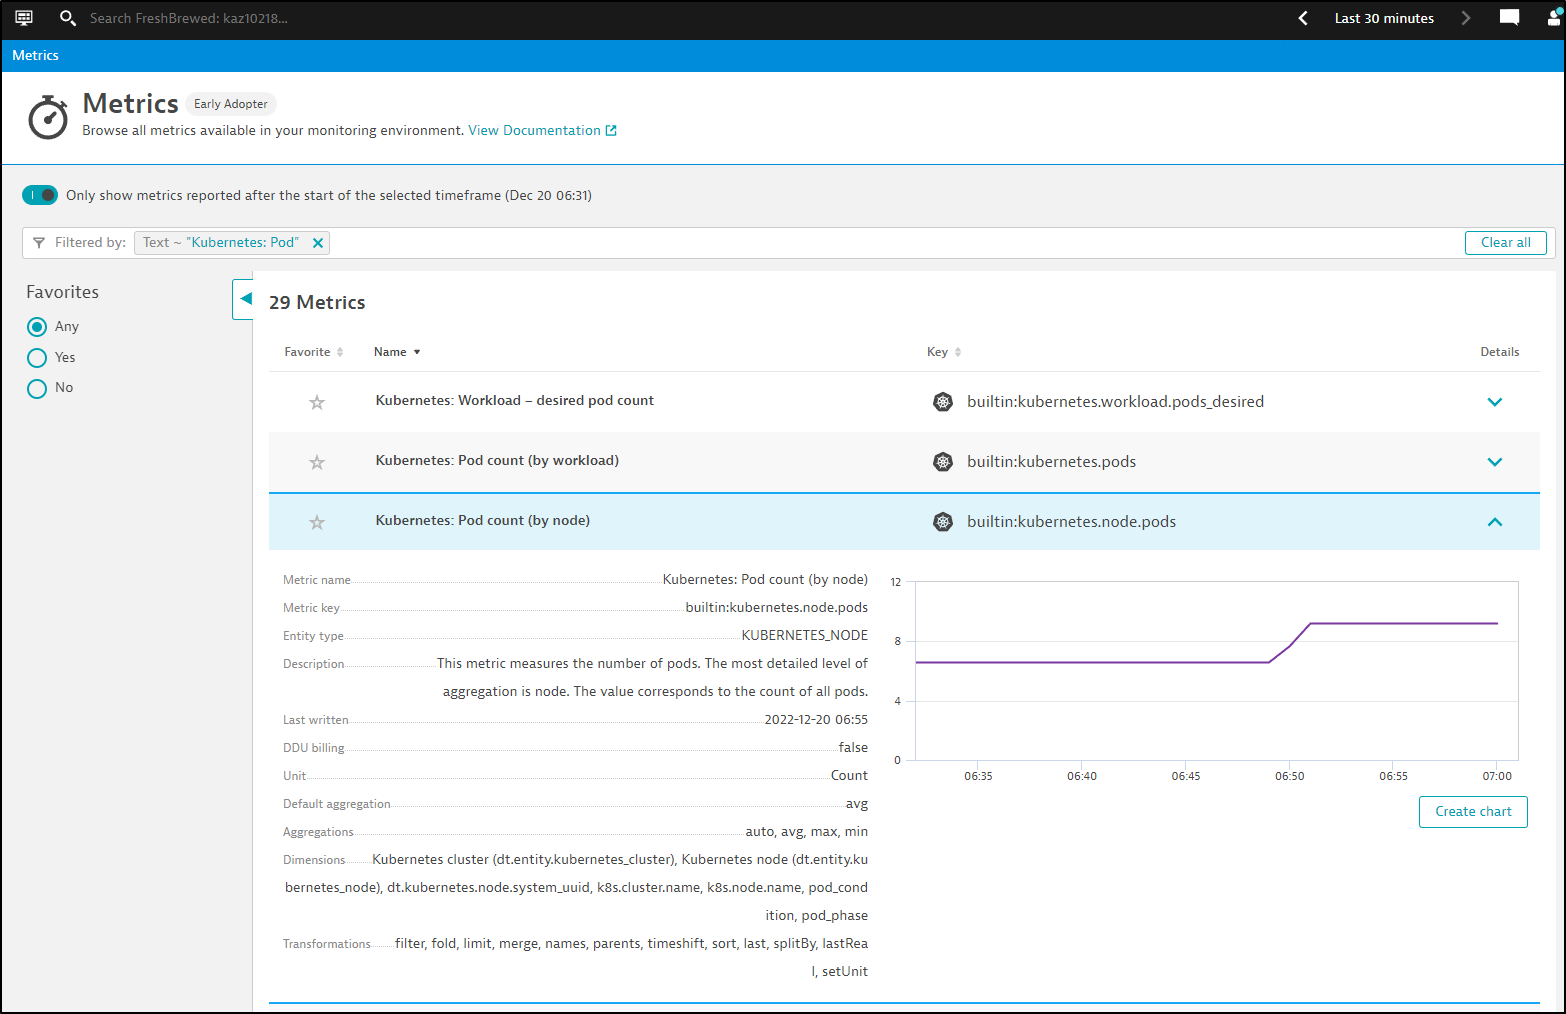
We can expand a metric to see details about the metric like the type or dimensions. The graph shown is in relation to the time window selected in the upper right.
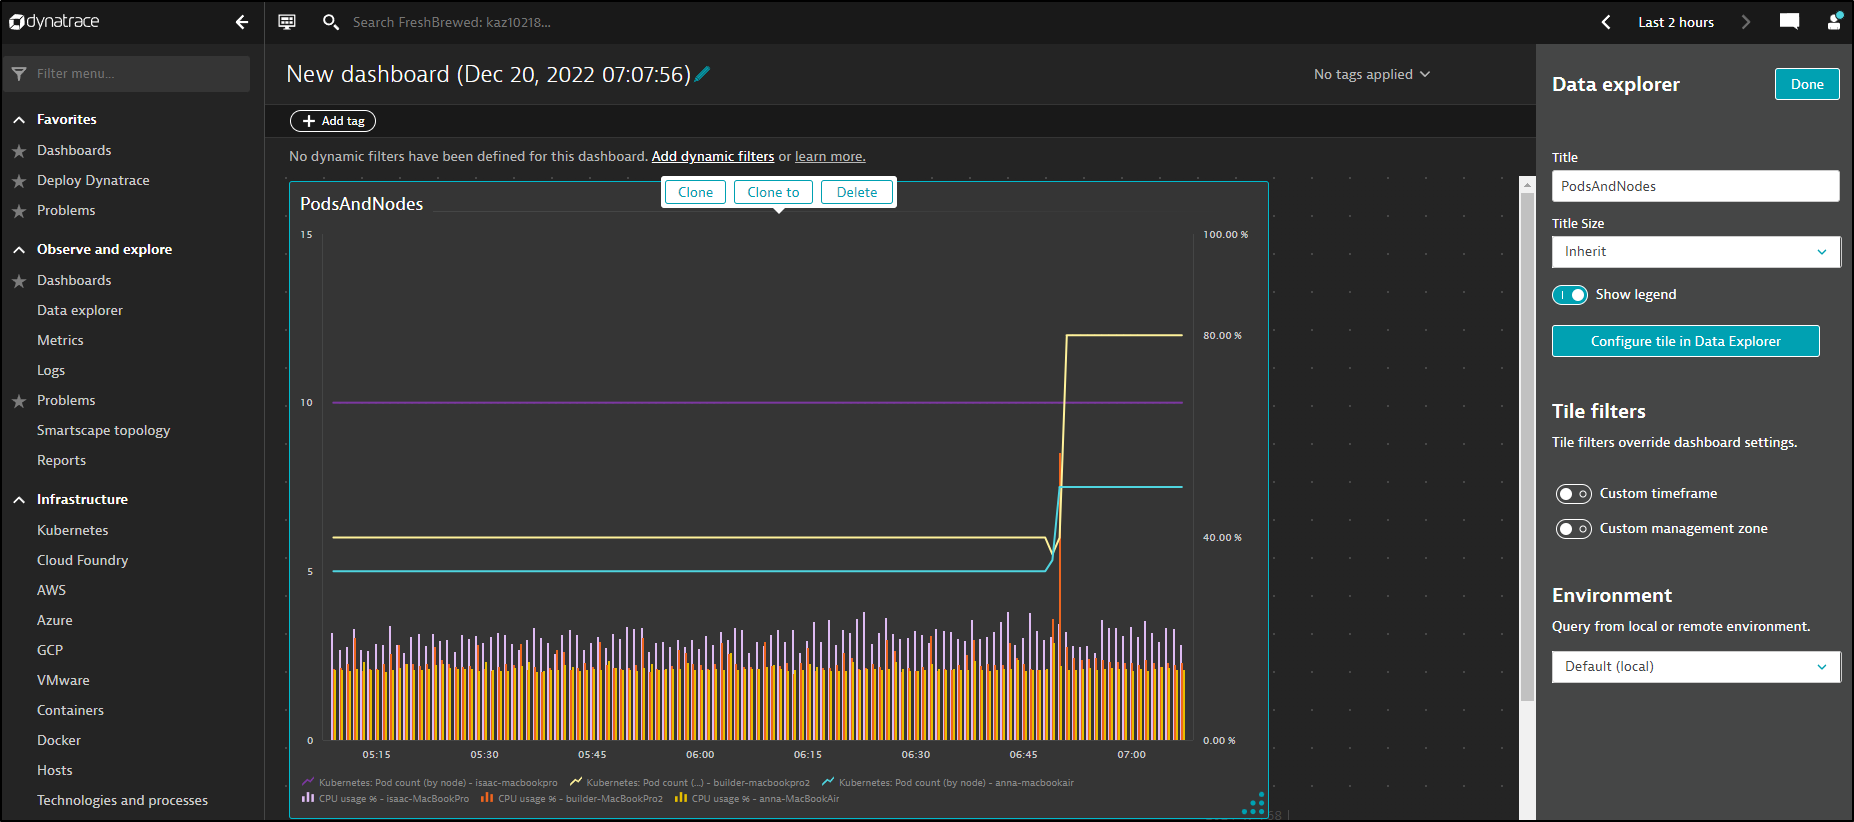
Let’s create a rather basic graph. The Pod count by Kubernetes Node over time
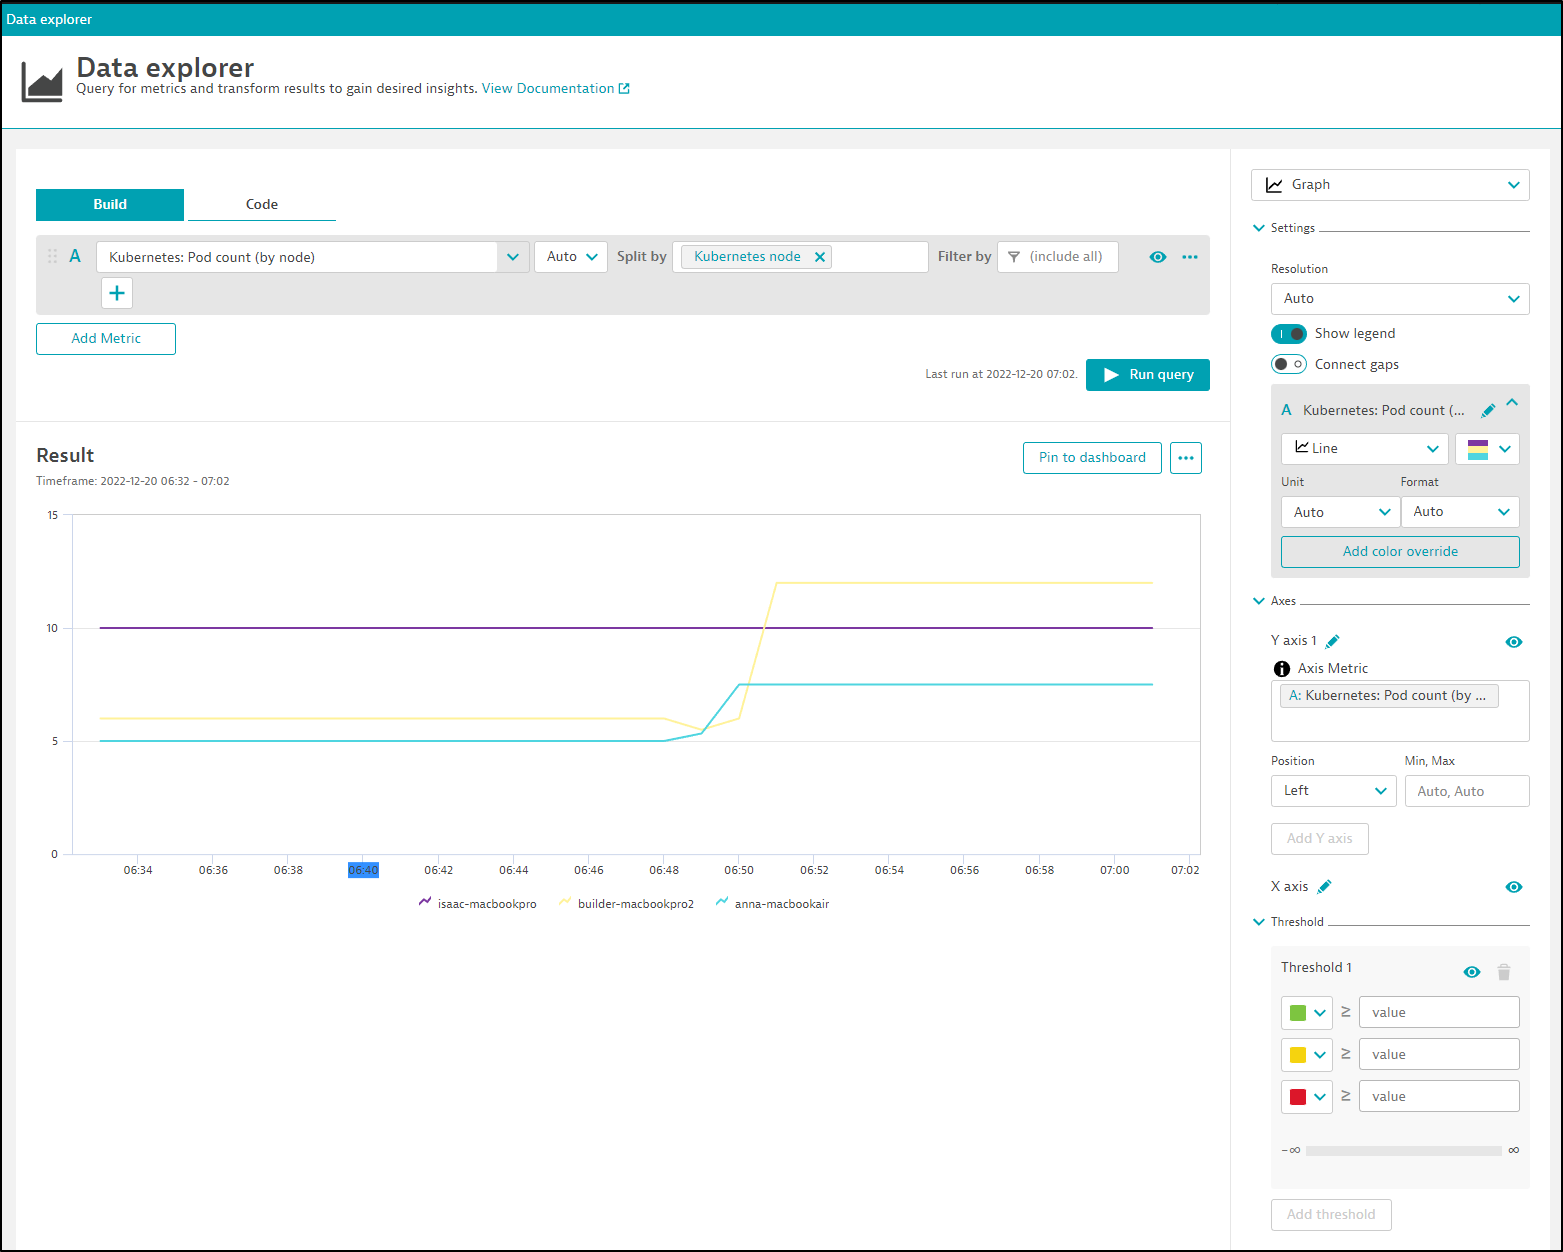
I can then add another metric to overlay, like CPU usage
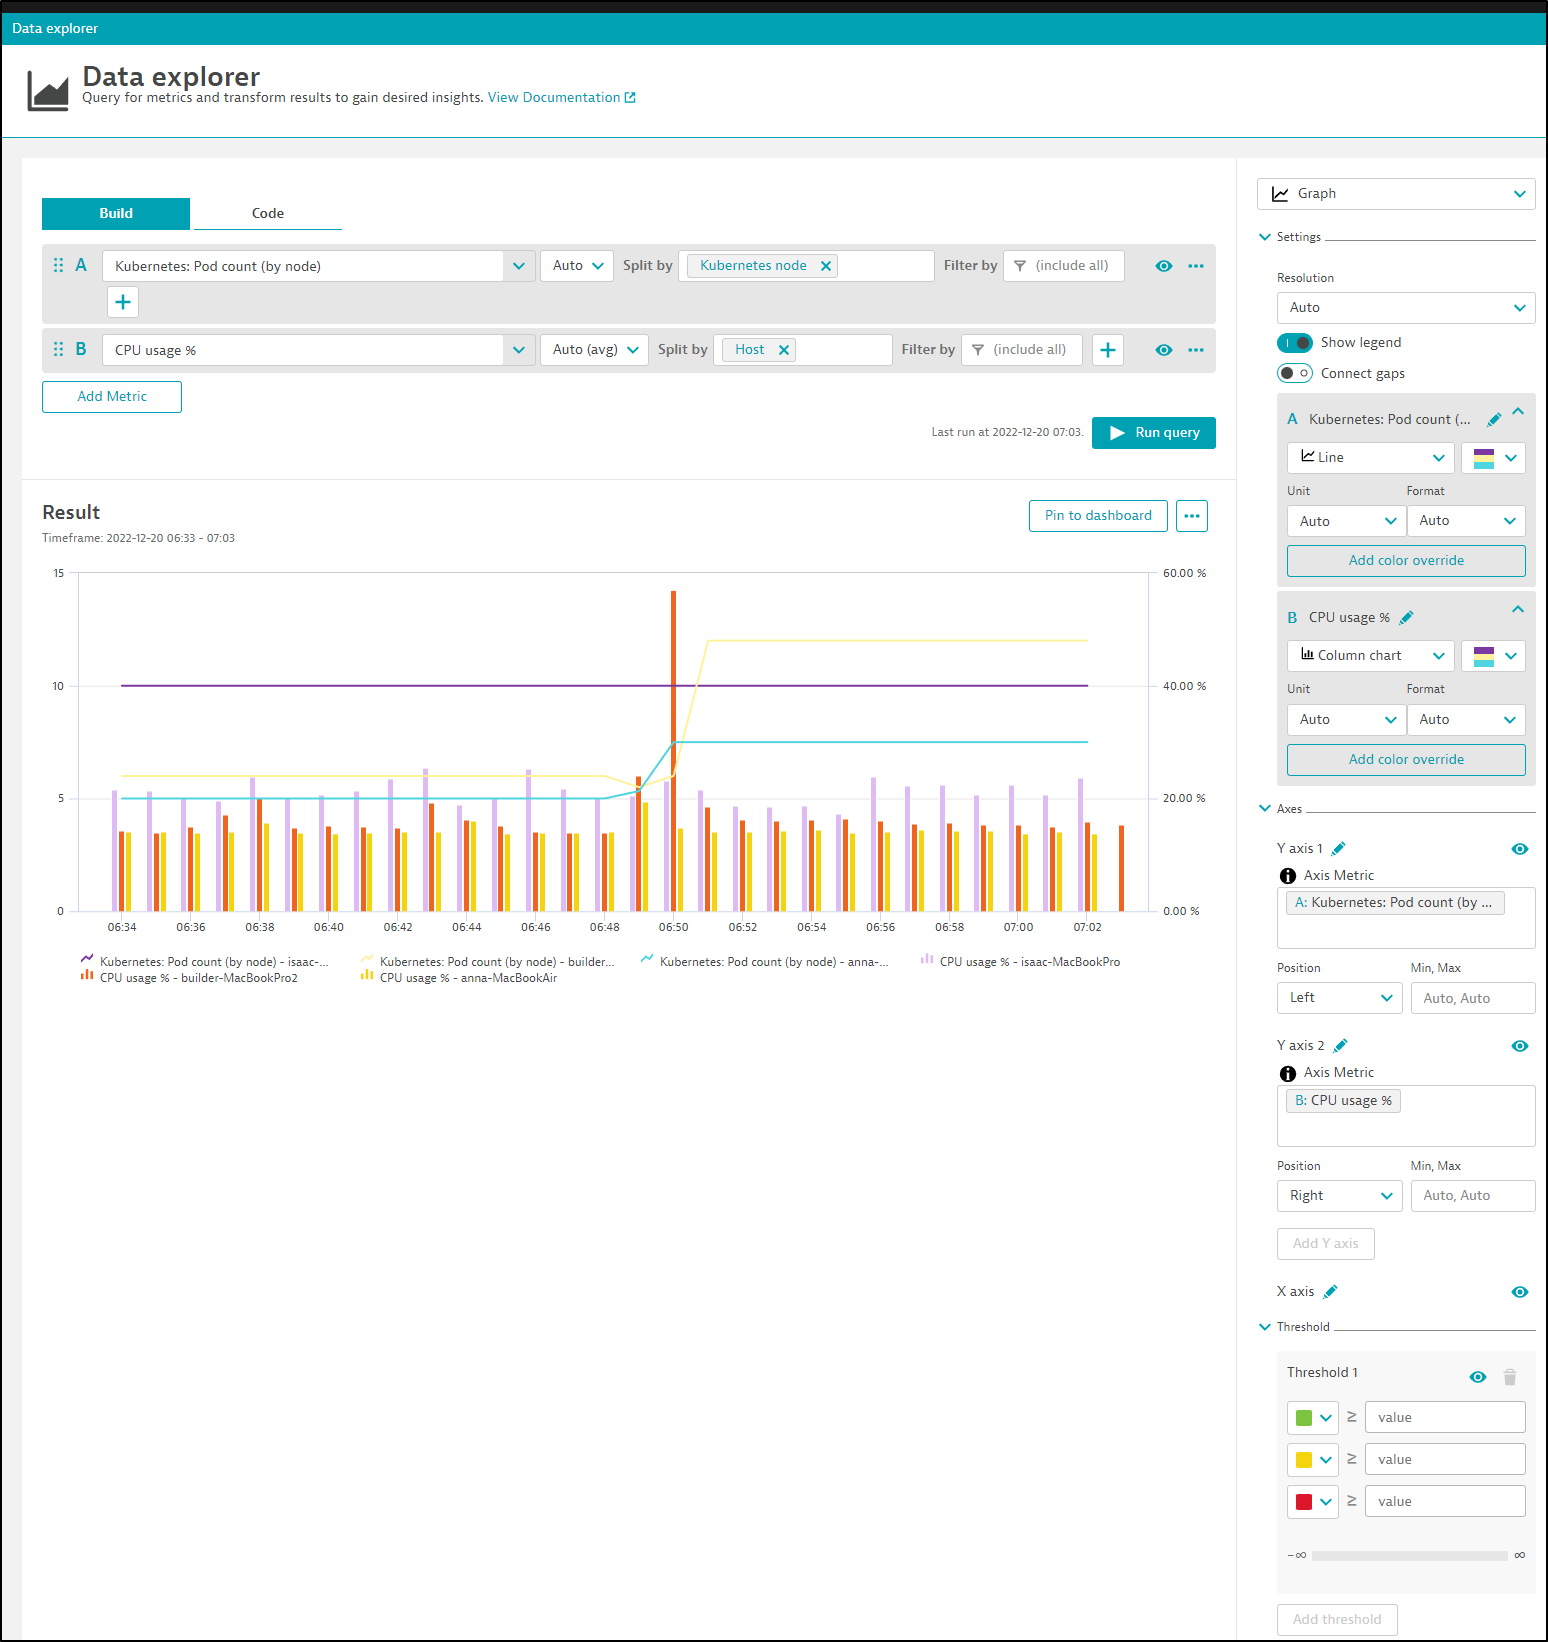
This is really slick, in my opinion. We can see it properly set the Y dimension to make sense; the left-hand size is 0 to 15 (pods) and the right is 0 to 60% CPU.
We can see clearly a rise in pod counts (when i fixed my imagePullSecret) 15m ago caused a resultant spike in CPU on MacBookPro2.
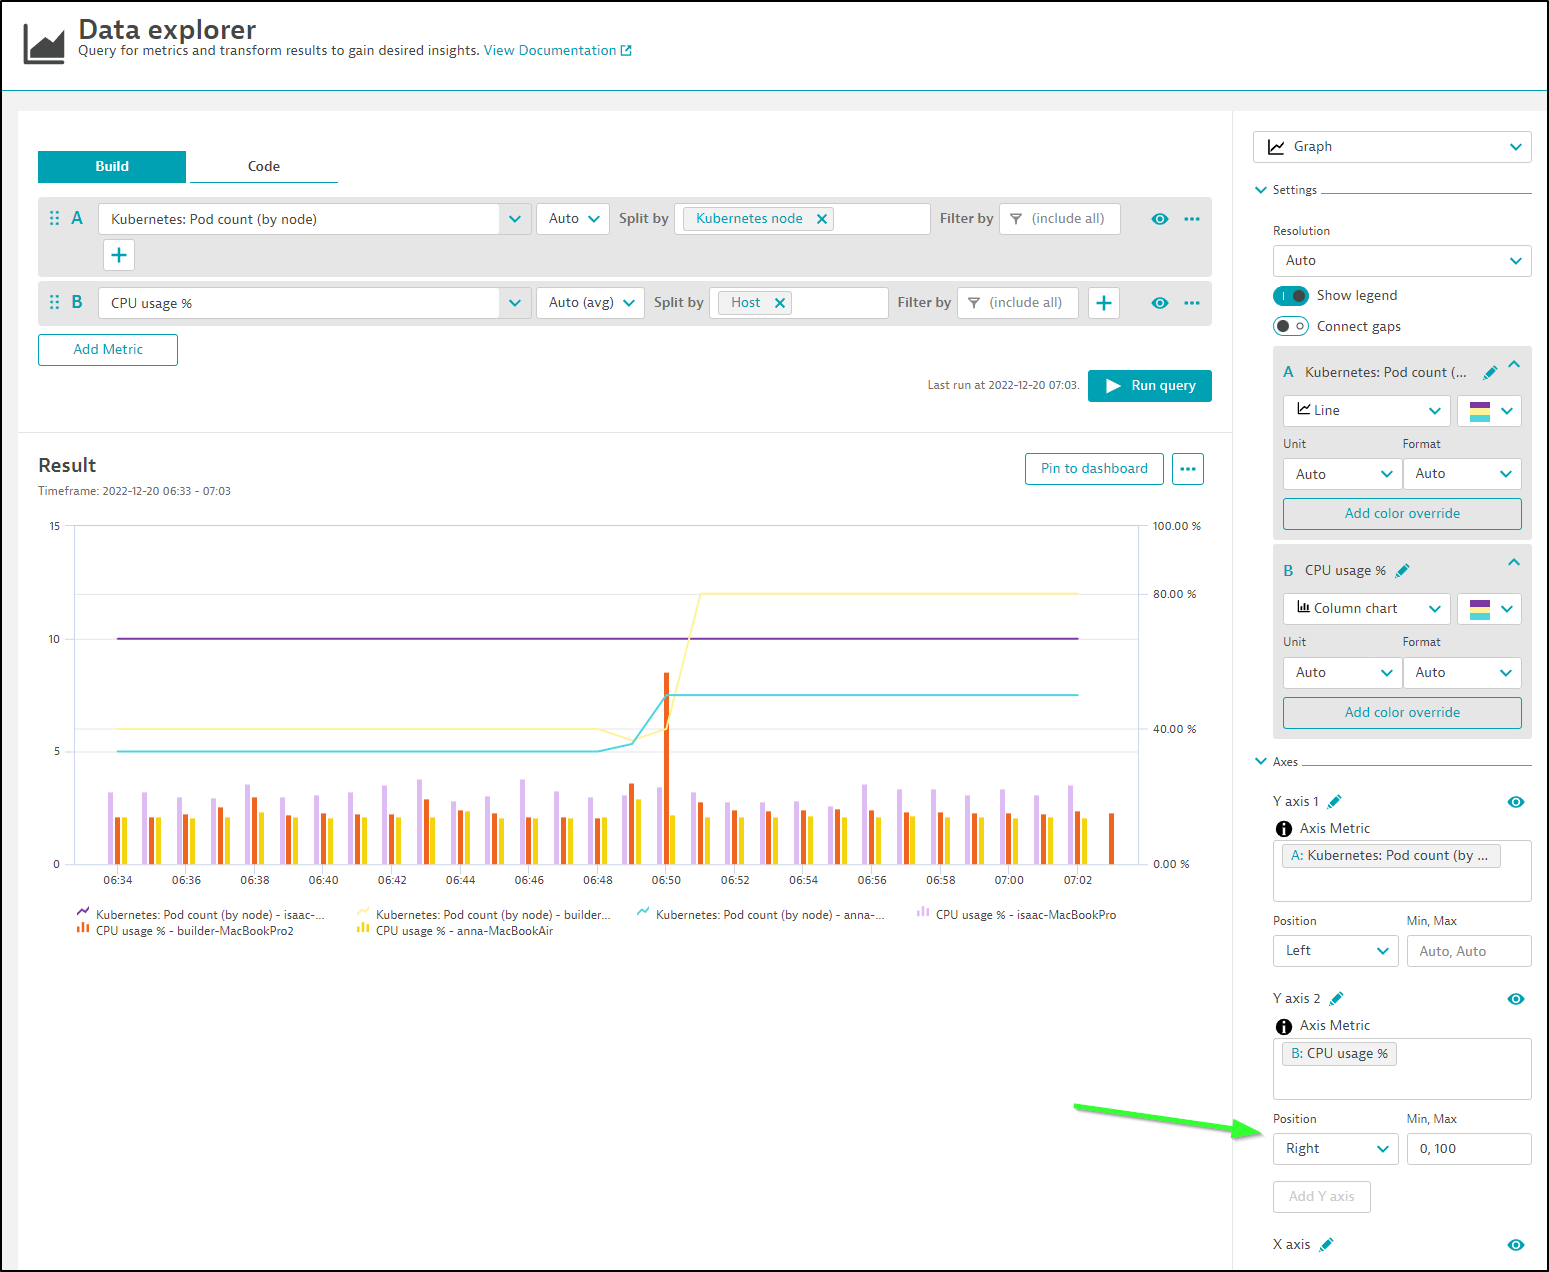
I realized having a upper bound of “60%” CPU seems a bit odd, so I changed the min, max just on that axis and re-ran the query
If I wanted, I could then pin to a new or existing dashboard
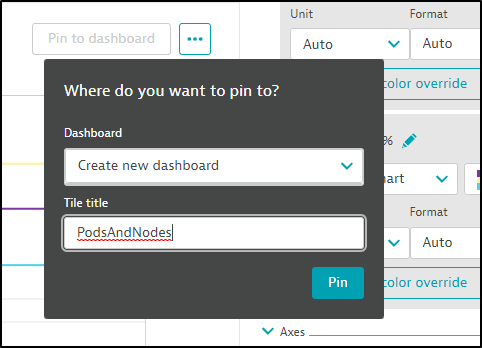
then view it
Open Telemetry (Otel)
Let’s take a moment to install the Otel collector
$ helm repo add open-telemetry https://open-telemetry.github.io/opentelemetry-helm-charts
"open-telemetry" has been added to your repositories

$ helm repo update
Hang tight while we grab the latest from your chart repositories...ility/deploy$
...Successfully got an update from the "longhorn" chart repository
...Successfully got an update from the "kuma" chart repository
...Successfully got an update from the "azure-samples" chart repository
...Successfully got an update from the "confluentinc" chart repository
...Successfully got an update from the "adwerx" chart repository
...Successfully got an update from the "uptime-kuma" chart repository
...Successfully got an update from the "novum-rgi-helm" chart repository
...Successfully got an update from the "dapr" chart repository
...Successfully got an update from the "actions-runner-controller" chart repository
...Successfully got an update from the "open-telemetry" chart repository
...Successfully got an update from the "sumologic" chart repository
...Successfully got an update from the "rhcharts" chart repository
...Successfully got an update from the "myharbor" chart repository
...Successfully got an update from the "kubecost" chart repository
...Successfully got an update from the "lifen-charts" chart repository
...Successfully got an update from the "sonarqube" chart repository
...Successfully got an update from the "nginx-stable" chart repository
...Successfully got an update from the "epsagon" chart repository
...Successfully got an update from the "hashicorp" chart repository
...Successfully got an update from the "datadog" chart repository
...Successfully got an update from the "argo-cd" chart repository
...Successfully got an update from the "harbor" chart repository
...Successfully got an update from the "rook-release" chart repository
...Successfully got an update from the "incubator" chart repository
...Successfully got an update from the "crossplane-stable" chart repository
...Successfully got an update from the "rancher-latest" chart repository
...Successfully got an update from the "newrelic" chart repository
...Successfully got an update from the "gitlab" chart repository
...Successfully got an update from the "bitnami" chart repository
Update Complete. ⎈Happy Helming!⎈
We have to deploy either as ‘deployment’ or ‘daemonset’ mode
$ helm install my-opentelemetry-collector open-telemetry/opentelemetry-collector --set mode=deployment
NAME: my-opentelemetry-collector
LAST DEPLOYED: Tue Dec 20 16:04:35 2022
NAMESPACE: default
STATUS: deployed
REVISION: 1
TEST SUITE: None
NOTES:
We can see the service is now running
$ kubectl get svc my-opentelemetry-collector
NAME                         TYPE        CLUSTER-IP      EXTERNAL-IP   PORT(S)                                                   AGE
my-opentelemetry-collector   ClusterIP   10.43.217.118   <none>        6831/UDP,14250/TCP,14268/TCP,4317/TCP,4318/TCP,9411/TCP   2m48s
You can see the service listens on all the common endpoints for traces.
The configuration of Otel is done through the configmap
$ kubectl get cm my-opentelemetry-collector -o yaml
apiVersion: v1
data:
  relay: |
    exporters:
      logging: {}
    extensions:
      health_check: {}
      memory_ballast:
        size_in_percentage: 40
    processors:
      batch: {}
      memory_limiter:
        check_interval: 5s
        limit_percentage: 80
        spike_limit_percentage: 25
    receivers:
      jaeger:
        protocols:
          grpc:
            endpoint: 0.0.0.0:14250
          thrift_compact:
            endpoint: 0.0.0.0:6831
          thrift_http:
            endpoint: 0.0.0.0:14268
      otlp:
        protocols:
          grpc:
            endpoint: 0.0.0.0:4317
          http:
            endpoint: 0.0.0.0:4318
      prometheus:
        config:
          scrape_configs:
          - job_name: opentelemetry-collector
            scrape_interval: 10s
            static_configs:
            - targets:
              - ${MY_POD_IP}:8888
      zipkin:
        endpoint: 0.0.0.0:9411
    service:
      extensions:
      - health_check
      - memory_ballast
      pipelines:
        logs:
          exporters:
          - logging
          processors:
          - memory_limiter
          - batch
          receivers:
          - otlp
        metrics:
          exporters:
          - logging
          processors:
          - memory_limiter
          - batch
          receivers:
          - otlp
          - prometheus
        traces:
          exporters:
          - logging
          processors:
          - memory_limiter
          - batch
          receivers:
          - otlp
          - jaeger
          - zipkin
      telemetry:
        metrics:
          address: 0.0.0.0:8888
kind: ConfigMap
metadata:
  annotations:
    meta.helm.sh/release-name: my-opentelemetry-collector
    meta.helm.sh/release-namespace: default
  creationTimestamp: "2022-12-20T22:04:37Z"
  labels:
    app.kubernetes.io/instance: my-opentelemetry-collector
    app.kubernetes.io/managed-by: Helm
    app.kubernetes.io/name: opentelemetry-collector
    app.kubernetes.io/version: 0.67.0
    helm.sh/chart: opentelemetry-collector-0.43.2
  name: my-opentelemetry-collector
  namespace: default
  resourceVersion: "1035428"
  uid: 8705739a-fa51-4257-90c4-c3a7a0e50c5f
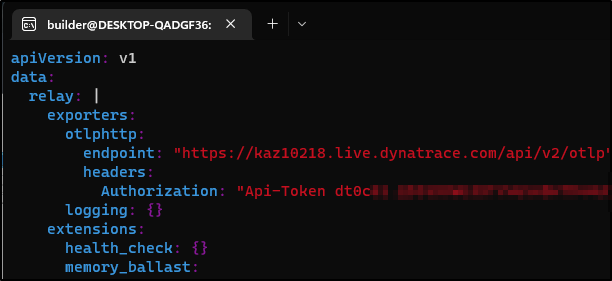
As we can see from the documentation, we can then use either the otlphttp exporter
receivers:
  otlp:
    protocols:
      grpc:
      http:
exporters:
  otlphttp:
    endpoint: "https://{your-environment-id}.live.dynatrace.com/api/v2/otlp"
    headers:
      Authorization: "Api-Token <API_TOKEN>"
service:
  pipelines:
    traces:
      receivers: [otlp]
      processors: []
      exporters: [otlphttp]
    metrics:
      receivers: [otlp]
      processors: []
      exporters: [otlphttp]
or Dynatrace exporter
receivers:
  otlp:
    protocols:
      grpc:
      http:
exporters:
  dynatrace:
    endpoint: "https://{your-environment-id}.live.dynatrace.com/api/v2/metrics/ingest"
    api_token: "<API_TOKEN>"
service:
  pipelines:
    metrics:
      receivers: [otlp]
      processors: []
      exporters: [dynatrace]
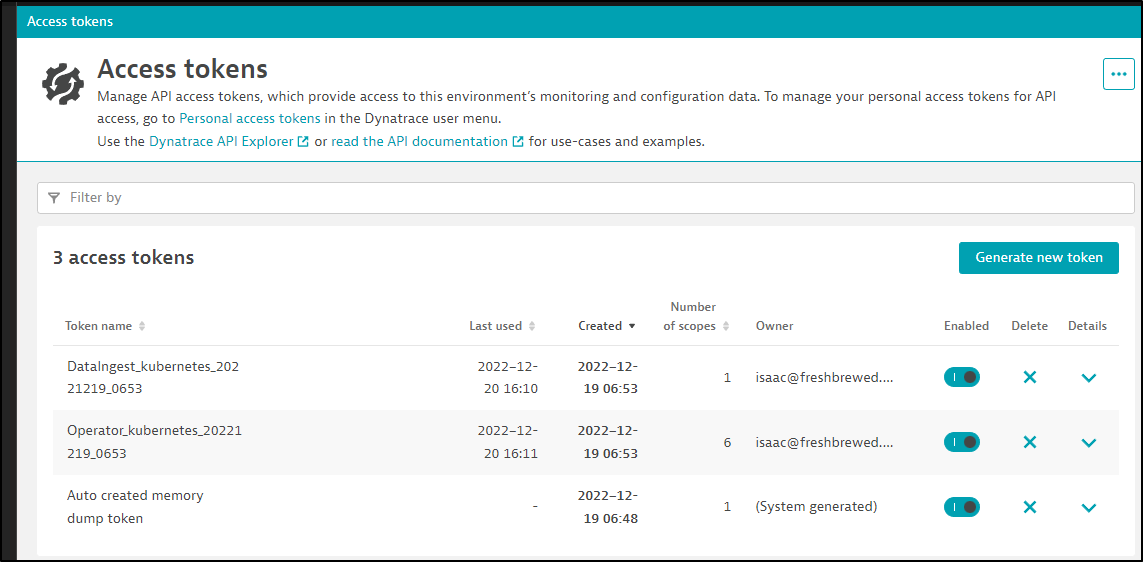
In either case, we need an API token. We can get one from “Manage/Access Tokens”
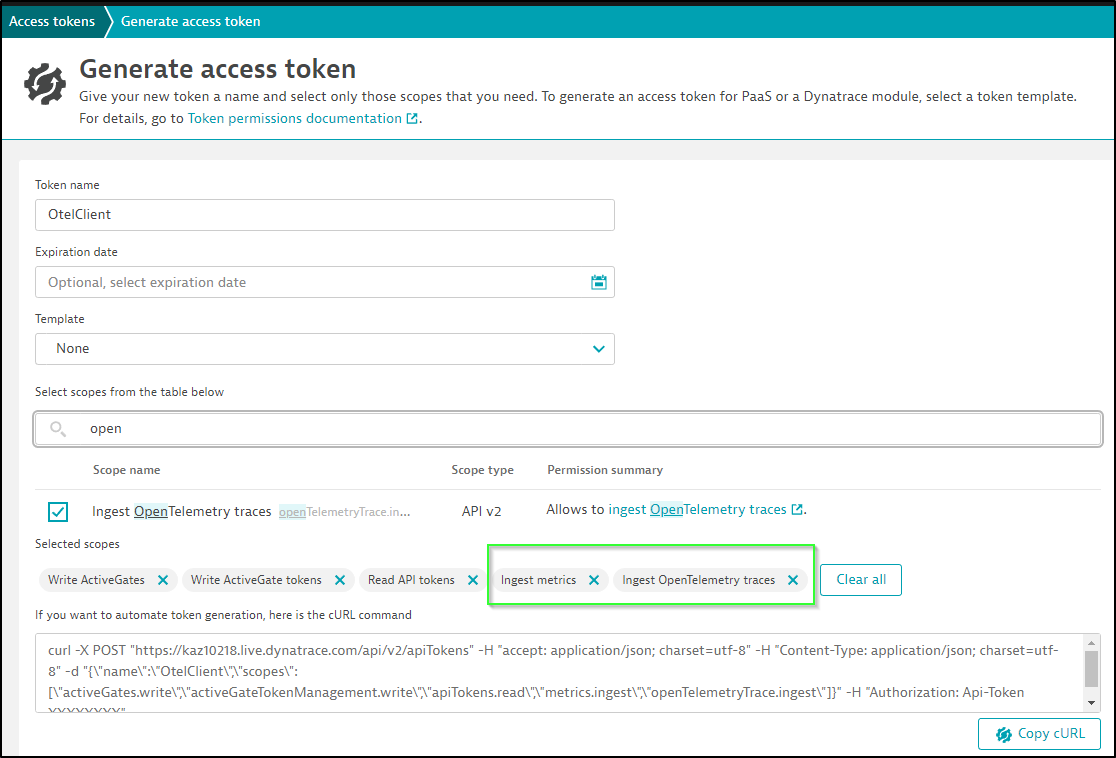
It needs to have “Ingest Metrics” and “Ingest OpenTelemetry traces” scopes
Then copy the generated token
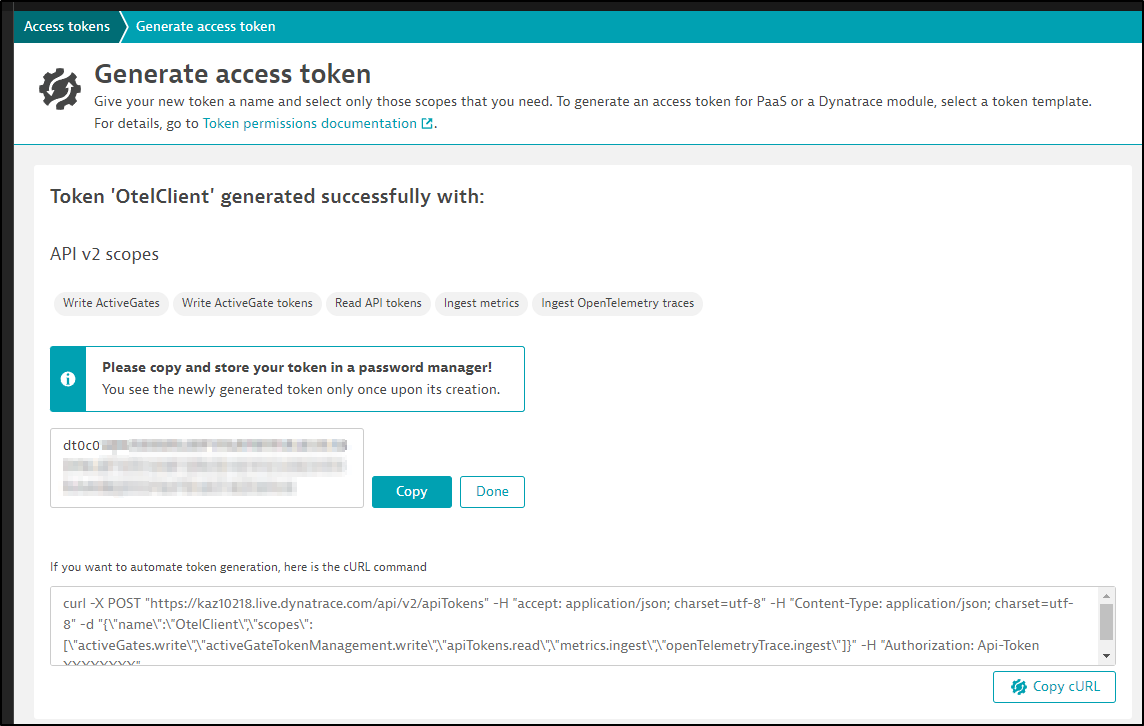
which we’ll use in the Otel config
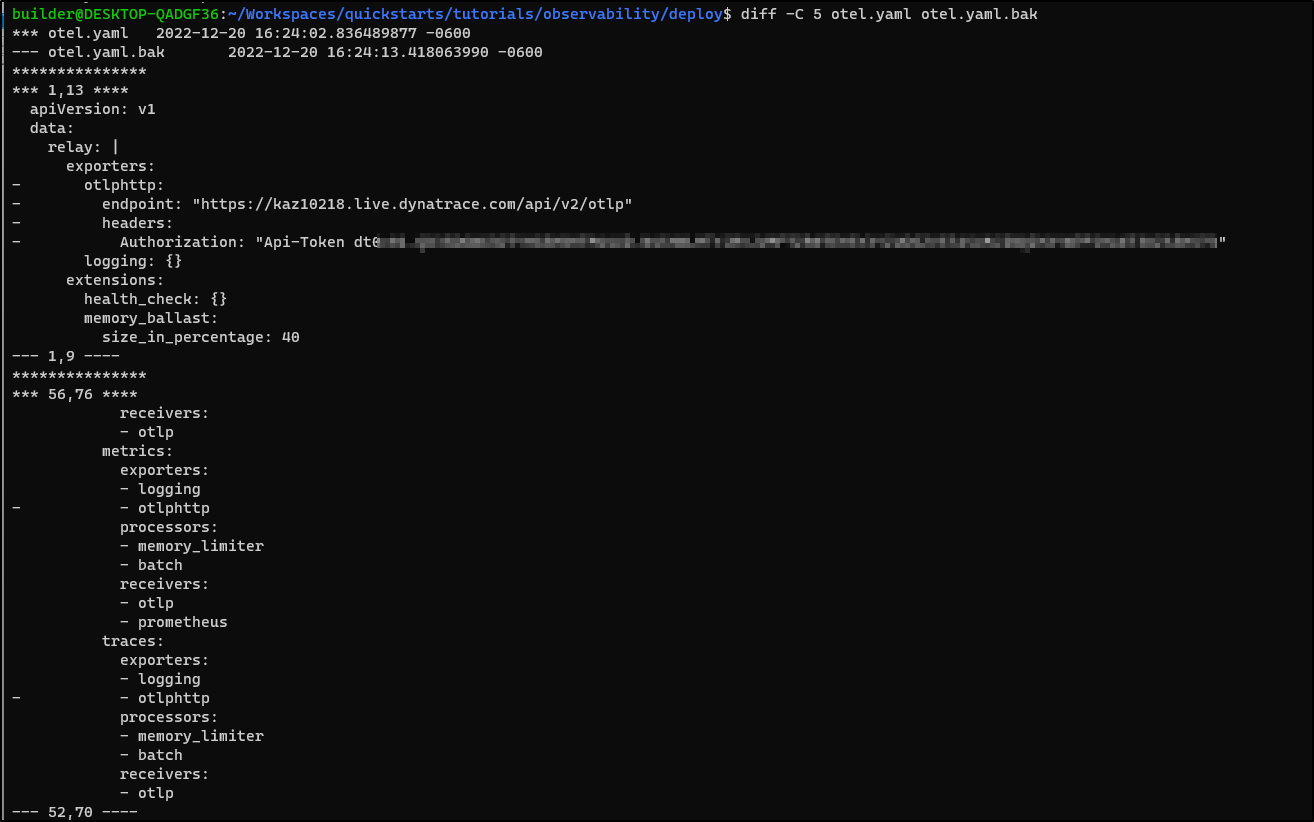
make sure to add otlphttp exporters to metrics and traces as well if you want to use it
Before we move on to using it, we should check our appconfig configuration from Dapr
$ kubectl get configuration appconfig -o yaml
apiVersion: dapr.io/v1alpha1
kind: Configuration
metadata:
  annotations:
    kubectl.kubernetes.io/last-applied-configuration: |
      {"apiVersion":"dapr.io/v1alpha1","kind":"Configuration","metadata":{"annotations":{},"name":"appconfig","namespace":"default"},"spec":{"tracing":{"samplingRate":"1","zipkin":{"endpointAddress":"http://zipkin.default.svc.cluster.local:9411/api/v2/spans"}}}}
  creationTimestamp: "2022-12-16T13:29:43Z"
  generation: 1
  name: appconfig
  namespace: default
  resourceVersion: "7623"
  uid: 583db3d5-1aae-4903-9207-a585e4b44c8a
spec:
  metric:
    enabled: true
  tracing:
    samplingRate: "1"
    zipkin:
      endpointAddress: http://zipkin.default.svc.cluster.local:9411/api/v2/spans
Right now, Dapr.io is sending traces to the zipkin service. Instead, we need to use the otel collector
$ diff dapr.appconfig.yaml dapr.appconfig.yaml.bak
19c19
<       endpointAddress: http://my-opentelemetry-collector.default.svc.cluster.local:9411
---
>       endpointAddress: http://zipkin.default.svc.cluster.local:9411/api/v2/spans
I’ll rotate the pods to see if it works
$ kubectl get pods
NAME                                          READY   STATUS    RESTARTS   AGE
redis-master-0                                1/1     Running   0          4d9h
redis-replicas-0                              1/1     Running   0          4d9h
redis-replicas-1                              1/1     Running   0          4d9h
redis-replicas-2                              1/1     Running   0          4d9h
zipkin-57797dd5db-mjl9v                       1/1     Running   0          47h
react-form-764468d8b-kmr8q                    2/2     Running   0          9h
my-opentelemetry-collector-57b55c8dfb-tnf4t   1/1     Running   0          32m
python-subscriber-79986596f9-6s59d            2/2     Running   0          3m24s
pythonapp-7c9b7f7966-z5lsn                    2/2     Running   0          3m24s
nodeapp-679885bdf8-m7bbc                      2/2     Running   0          3m24s
node-subscriber-6d99bd4bd7-gl6dp              2/2     Running   0          3m24s
csharp-subscriber-66b7c5bcbc-dp4hk            2/2     Running   0          3m24s
addapp-76dbf95c88-95p59                       2/2     Running   0          75s
multiplyapp-bdbdf4b5-9zt45                    2/2     Running   0          75s
subtractapp-6c449d8cb9-w7589                  2/2     Running   0          75s
calculator-front-end-6694bbfdf-28s6j          2/2     Running   0          62s
divideapp-585848cf4d-cv8zk                    2/2     Running   0          33s
I port-forward to calculator to generate some traces
$ kubectl port-forward svc/calculator-front-end 8000:80
Forwarding from 127.0.0.1:8000 -> 8080
Forwarding from [::1]:8000 -> 8080
Handling connection for 8000
Handling connection for 8000
Handling connection for 8000
Handling connection for 8000
Handling connection for 8000
Handling connection for 8000
Handling connection for 8000
Handling connection for 8000
Handling connection for 8000
I can see the Otel collector is receiving content
$ kubectl logs my-opentelemetry-collector-57b55c8dfb-tnf4t | tail -n10
2022-12-20T22:38:33.694Z        info    TracesExporter  {"kind": "exporter", "data_type": "traces", "name": "logging", "#spans": 29}
2022-12-20T22:38:33.895Z        info    TracesExporter  {"kind": "exporter", "data_type": "traces", "name": "logging", "#spans": 1}
2022-12-20T22:38:37.109Z        info    TracesExporter  {"kind": "exporter", "data_type": "traces", "name": "logging", "#spans": 1}
2022-12-20T22:38:38.313Z        info    TracesExporter  {"kind": "exporter", "data_type": "traces", "name": "logging", "#spans": 1}
2022-12-20T22:38:38.714Z        info    TracesExporter  {"kind": "exporter", "data_type": "traces", "name": "logging", "#spans": 16}
2022-12-20T22:38:42.125Z        info    MetricsExporter {"kind": "exporter", "data_type": "metrics", "name": "logging", "#metrics": 31}
2022-12-20T22:38:52.164Z        info    MetricsExporter {"kind": "exporter", "data_type": "metrics", "name": "logging", "#metrics": 31}
2022-12-20T22:39:02.204Z        info    MetricsExporter {"kind": "exporter", "data_type": "metrics", "name": "logging", "#metrics": 31}
2022-12-20T22:39:12.243Z        info    MetricsExporter {"kind": "exporter", "data_type": "metrics", "name": "logging", "#metrics": 31}
2022-12-20T22:39:22.081Z        info    MetricsExporter {"kind": "exporter", "data_type": "metrics", "name": "logging", "#metrics": 31}
I immediately saw them reflected in Dynatrace
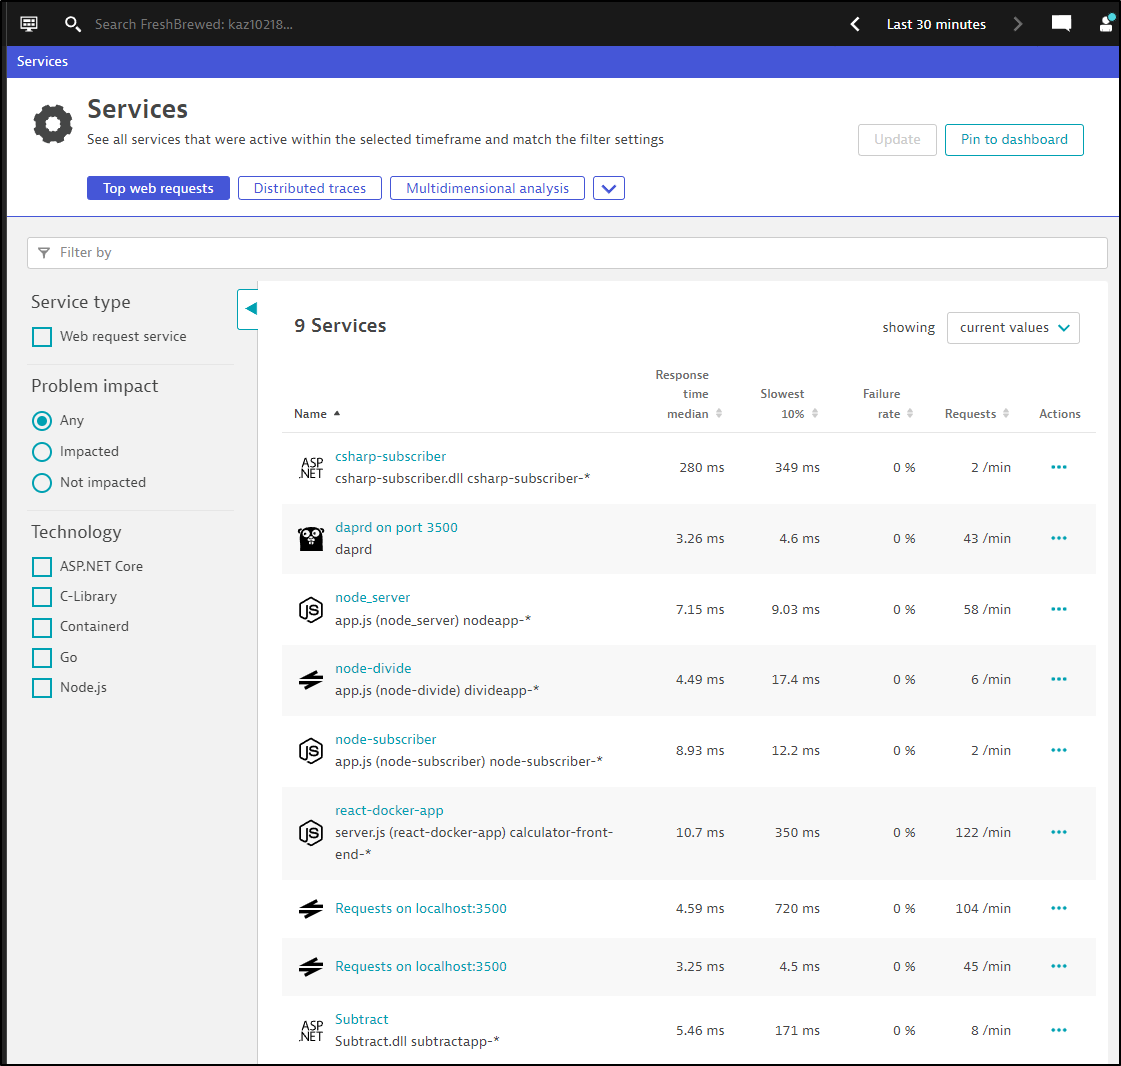
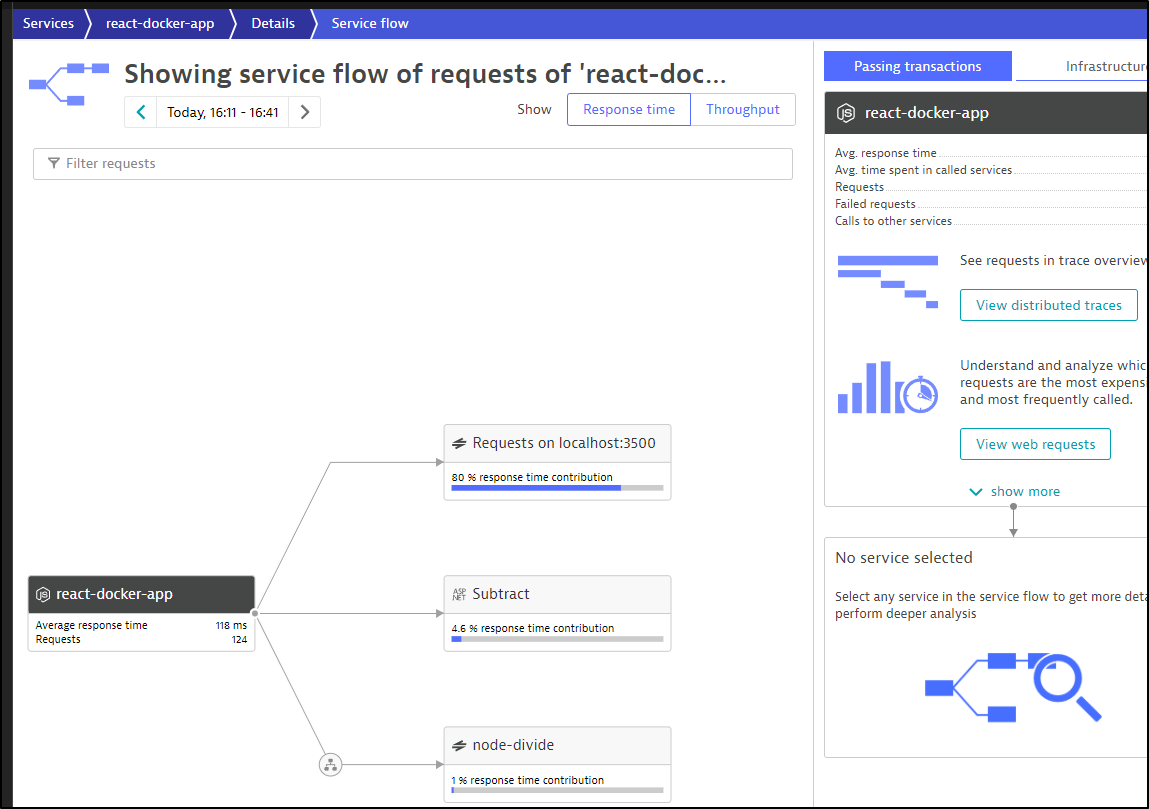
If I view the “Service Flow”, I can see how some of traces relate
I checked my “Frontend” Services and saw that there is now “My web application” listed
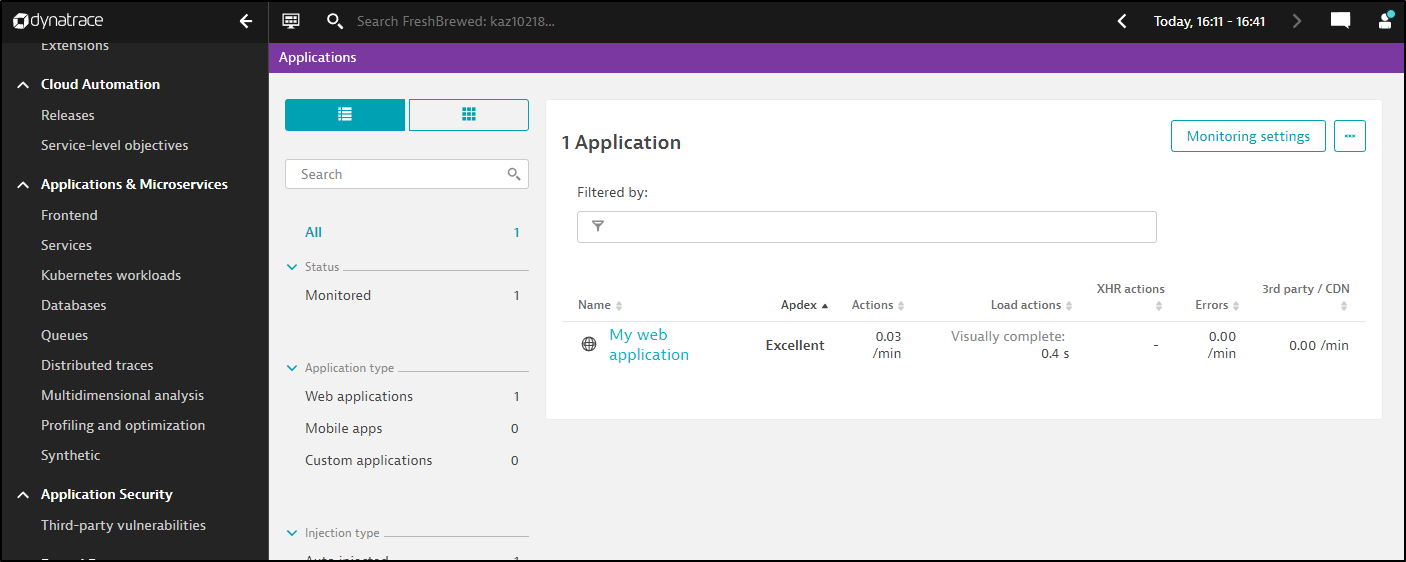
From there, I can see some details about “My web application”
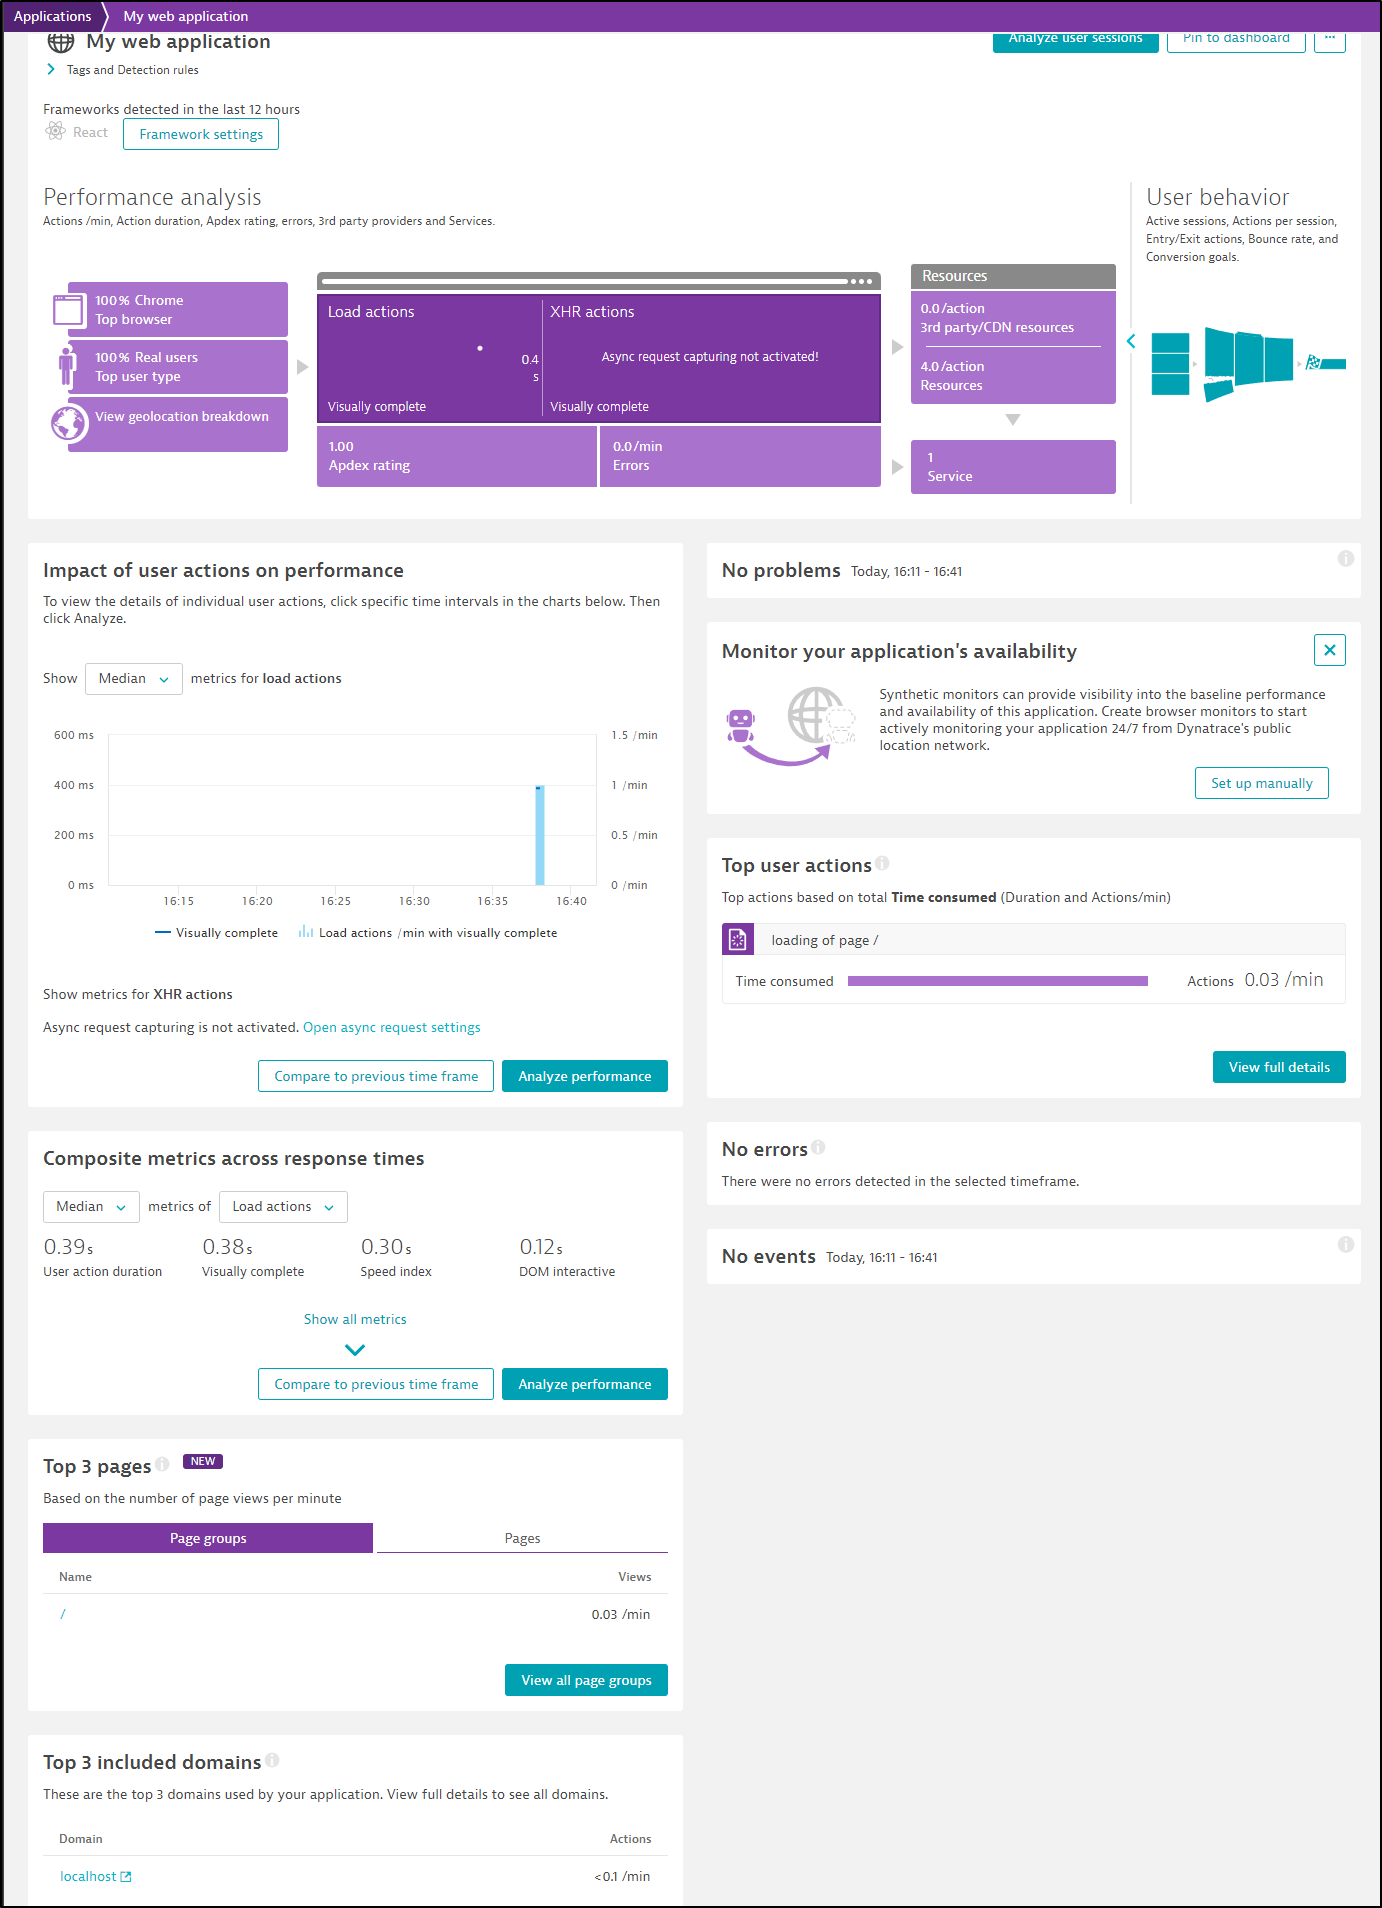
I can view metrics about hosts, pages and XHR actions.
Summary
We covered signing up for Dynatrace then installing into a fresh on-prem K3s cluster. We looked at the various monitoring options we get out of the box from the K8s collector; services, metrics and traces. We then wrapped up by setting up the Open Telemetry collector with Dapr and directing zipkin traces to the zipkin otel Dynatrace endpoint.
In our next post later this week we’ll focus on Serverless monitoring (e.g. Azure Functions, GCP Cloud Run, AWS Lambdas, etc), Agentless (Javascript/web-based), monitoring of Hosts (Infrastructure) and then how we remove the agent from Kubernetes which was one of our tests we set out to check at the start.
In the final post next week, we’ll cover production clusters, profiling and optimization, alerting, the mobile app, usage and some wrap up thoughts on costs and “buy now”.