

Published: May 3, 2022 by Isaac Johnson
Two years ago, I reviewed an up-and-coming observability suite, Epsagon. At the time, as a two year old company they were a hungry up-and-coming startup. While I found their product compelling, there was no free tier and the 14-day demo was a nice amuse-bouche, but not enought to get me to commit to a Pro-tier.
Since then, they have been acquired and radically changed their pricing as well as packed in more features. Let’s revisit Epsagon, what their Free tier offers and show how we can integrate it into our systems.
Pricing changes
Let’s tackle the first thing I noticed.
Back in 2020, they had a Pro plan that was either billed monthly
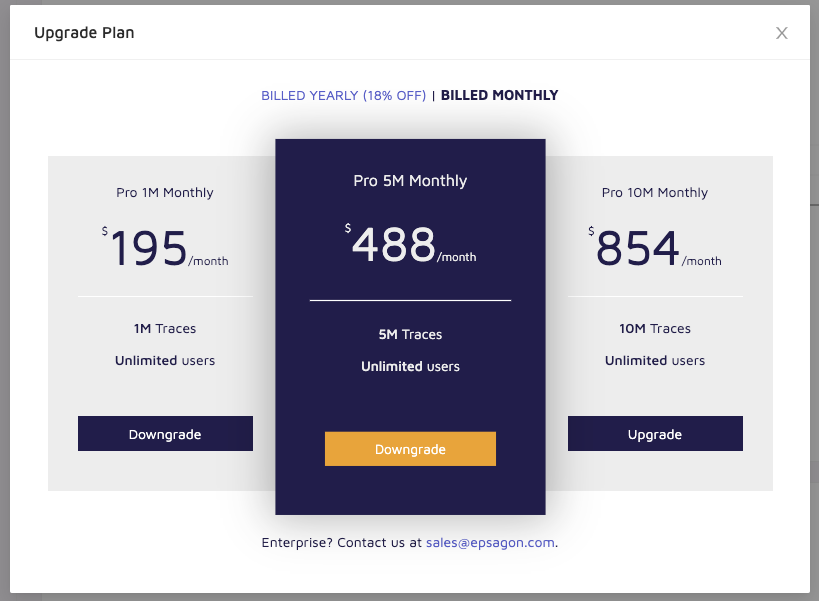
or Annually:
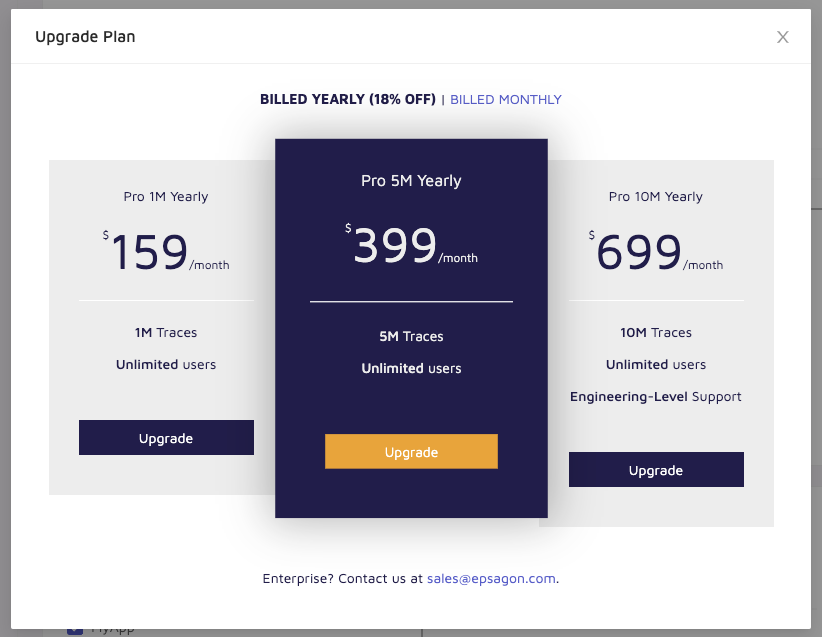
Today we see that has changed a lot:
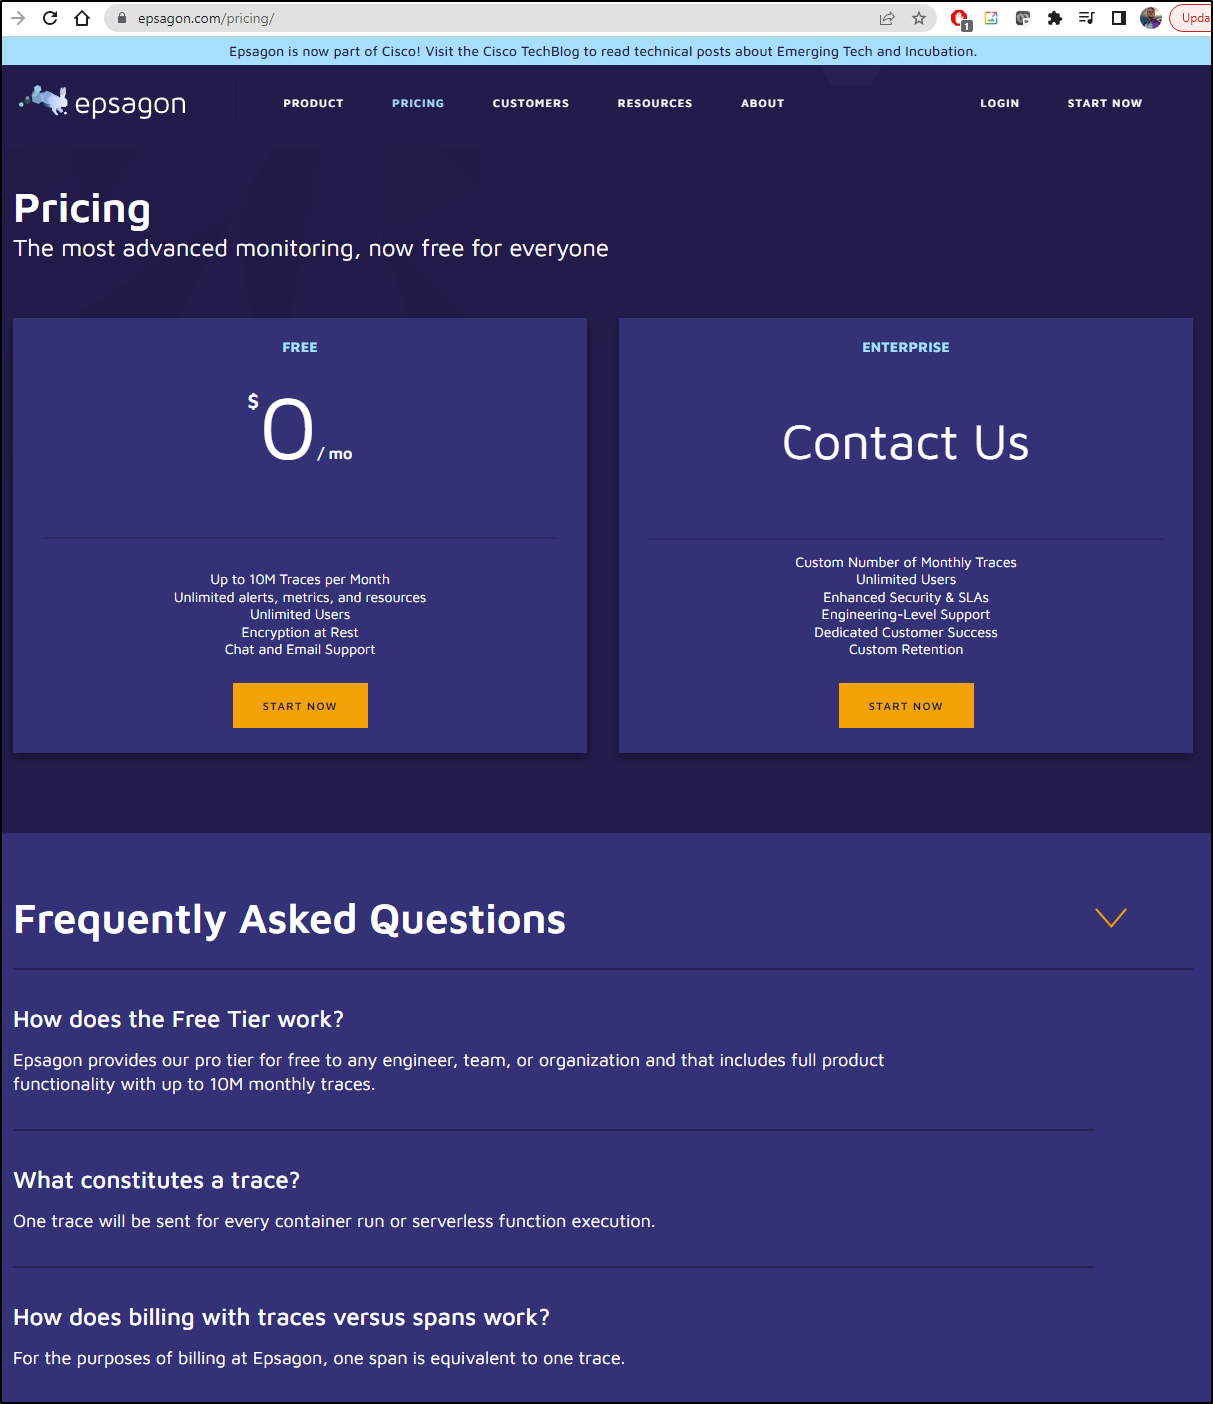
We now essentially have a free tier up to 10M traces a month. Then a negotiate-with-sales option for “Enterprise”.
I could not find any published data on the Enterprise costs. However, in the past they charged around $90/user/feature for Pro.
Company profile
Espagon was still a hot item in 2020 seeking VC funding having done multiple rounds of Series A. However, in Oct of 2021 they were acquired by Cisco for $500m. At the time, Techcrunch noted that this had followed the recent Cisco acquisition of AppDynamics (which it had bought for $3.7b).
However, post-acquisition Nitzan Shapira and Ran Ribenzaft stayed on as CEO and CTO, respectively. They have around 59 employees with offices in NYC and Tel Aviv.
Since they have gone private, we don’t have insights on revenue but we do know they had raised over $30m in VC funding prior to the half a billion acquisition.
Concerns
One concern that caught my attention was a blog post by Yosef Arbiv on Ciscos Techblog site.
He talks about the Epsagon journey with Open Telemetry and noted in “Act III: Joining Cisco and the OpenTelemetry Community”
“Shortly after the first successful experiment [SDK with OTel], we had a significant change in plans — Cisco acquired Epsagon. The Epsagon product was to be deprecated gradually, and we started to work on a new Full Stack Observability product.”
So is Cisco planning to gut Epsagon for IP and focus on AppD? I guess we’ll have to see.
Signup
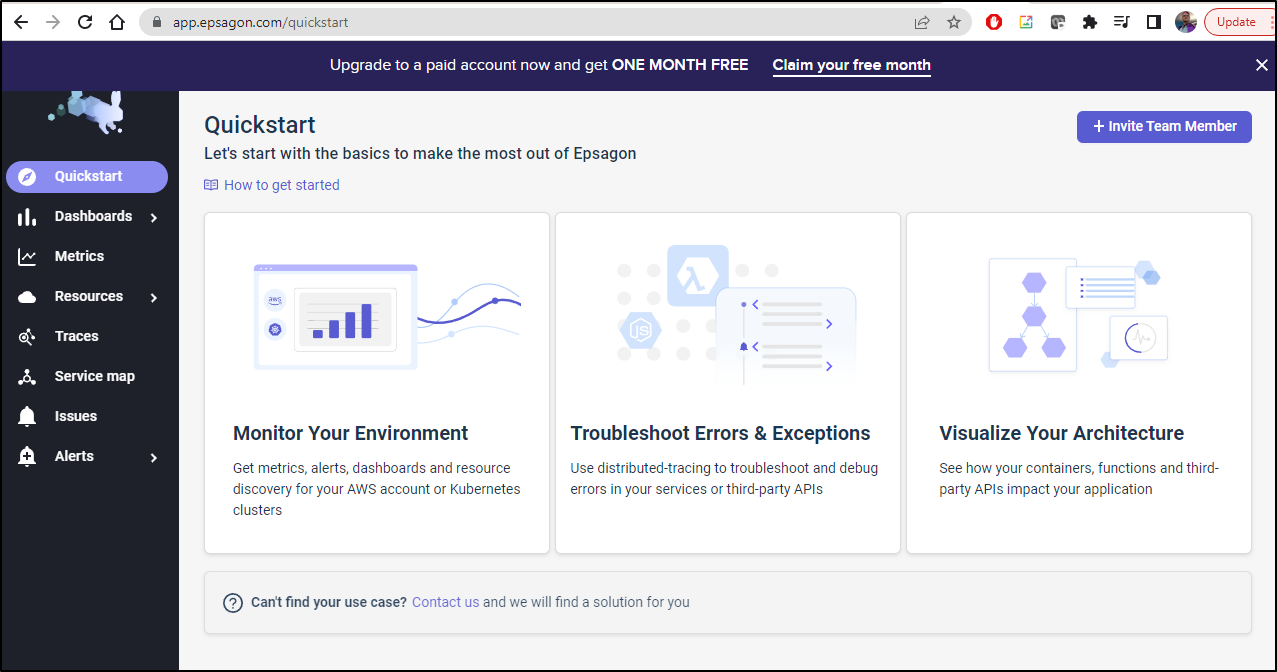
We will click “Start Now” on the homepage to get to the Sign up site.

I chose to signup with Google and it quickly loaded the Quickstart page
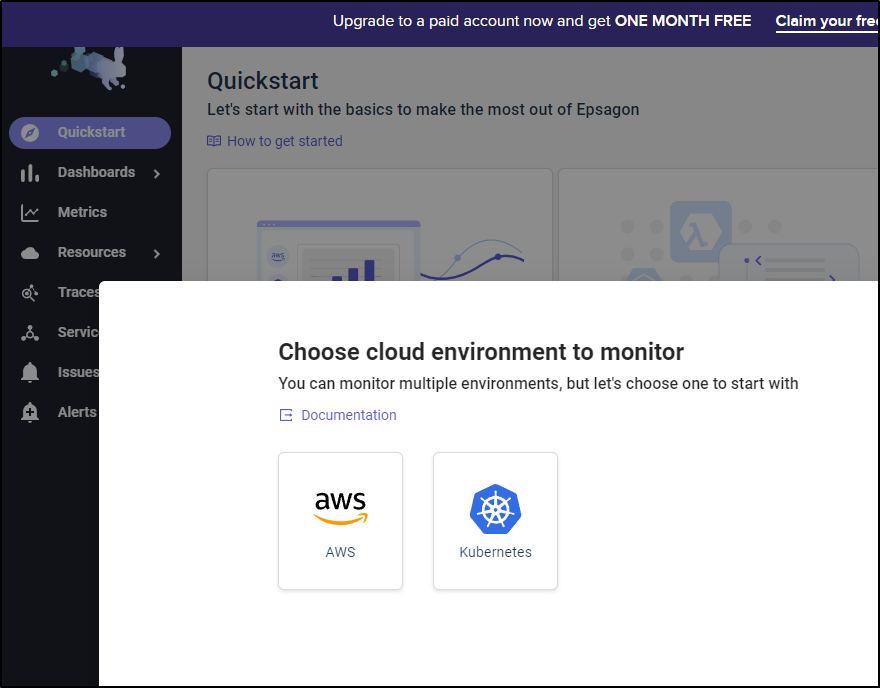
Monitoring Kubernetes
Let’s choose to monitor Kubernetes. It then asks they type of cluster, EKS or Other
I’ll give my cluster a name and it shows the helm commands with a pulsing red icon at the bottom letting me know it is awaiting a signal from their agent
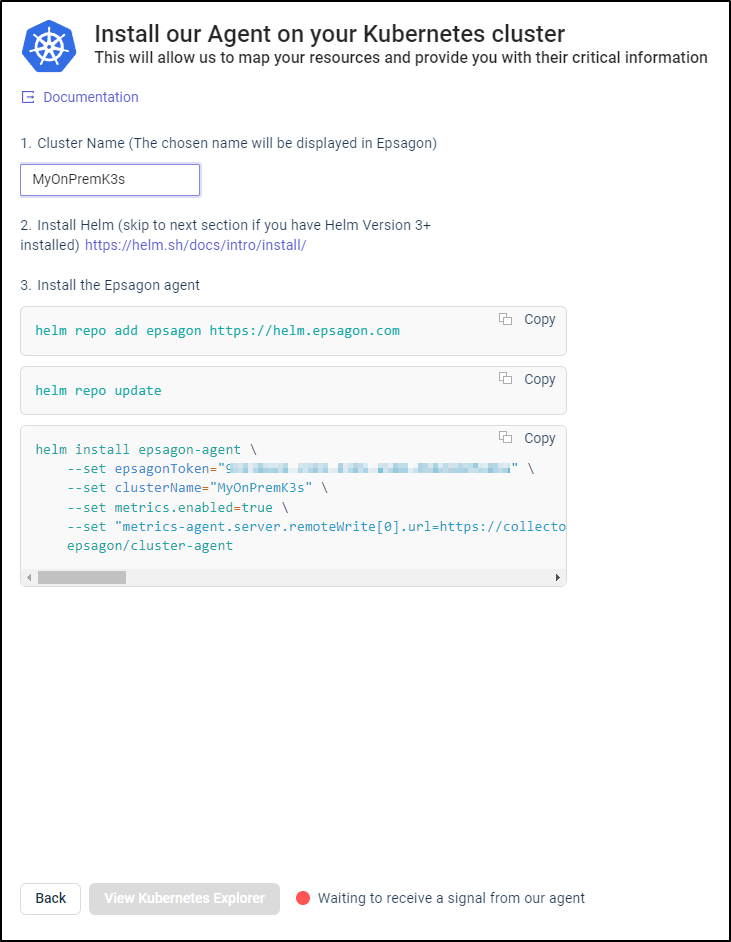
Next, I’ll install the Epsagon agent(s)
builder@DESKTOP-QADGF36:~/Workspaces/dockerWithTests2$ helm repo add epsagon https://helm.epsagon.com
"epsagon" has been added to your repositories
builder@DESKTOP-QADGF36:~/Workspaces/dockerWithTests2$ helm repo update
Hang tight while we grab the latest from your chart repositories...
...Successfully got an update from the "epsagon" chart repository
...Successfully got an update from the "azure-samples" chart repository
...Successfully got an update from the "sonarqube" chart repository
...Successfully got an update from the "uptime-kuma" chart repository
...Successfully got an update from the "dapr" chart repository
...Successfully got an update from the "kubecost" chart repository
...Successfully got an update from the "kuma" chart repository
...Successfully got an update from the "nginx-stable" chart repository
...Successfully got an update from the "sumologic" chart repository
...Successfully got an update from the "harbor" chart repository
...Successfully got an update from the "incubator" chart repository
...Successfully got an update from the "rancher-latest" chart repository
...Successfully got an update from the "newrelic" chart repository
...Successfully got an update from the "datadog" chart repository
...Successfully got an update from the "myharbor" chart repository
...Successfully got an update from the "bitnami" chart repository
Update Complete. ⎈Happy Helming!⎈
builder@DESKTOP-QADGF36:~/Workspaces/dockerWithTests2$ helm install epsagon-agent \
 --set epsagonToken="99210ee9-c982-4185-a508-db0dd40fe8ba" \
    --set clusterName="MyOnPremK3s" \
    --set metrics.enabled=true \
    --set "metrics-agent.server.remoteWrite[0].url=https://collector.epsagon.com/ingestion?99210ee9-c982-4185->     --set epsagonToken="99210ee9-c982-4185-a508-db0dd40fe8ba" \
dd40fe8b>     --set clusterName="MyOnPremK3s" \
>     --set metrics.enabled=true \
>     --set "metrics-agent.server.remoteWrite[0].url=https://collector.epsagon.com/ingestion?99210ee9-c982-4185-a508-db0dd40fe8ba,metrics-agent.server.remoteWrite[0].basic_auth.username=99210ee9-c982-4185-a508-db0dd40fe8ba,metrics-agent.server.remoteWrite[0].write_relabel_configs[0].target_label=cluster_name,metrics-agent.server.remoteWrite[0].write_relabel_configs[0].replacement=MyOnPremK3s" \
 epsagon>     epsagon/cluster-agent
NAME: epsagon-agent
LAST DEPLOYED: Fri Apr 29 06:59:04 2022
NAMESPACE: default
STATUS: deployed
REVISION: 1
TEST SUITE: None
NOTES:
Epsagon cluster agent insalled successfully!
If I see what helm installed, I can see the release;
$ helm list
NAME                    NAMESPACE       REVISION        UPDATED                                 STATUS          CHART                   APP VERSION

...snip...

epsagon-agent           default         1               2022-04-29 06:59:04.279666936 -0500 CDT deployed        cluster-agent-0.1.19    1.0.13

...snip...
This created three deployments with three pods
$ kubectl get deployments --all-namespaces | grep epsagon
default                        epsagon-agent-kube-state-metrics         1/1     1            1           2m46s
default                        epsagon-agent-cluster-agent              1/1     1            1           2m46s
default                        epsagon-agent-metrics-agent-server       1/1     1            1           2m46s

$ kubectl get pods | grep epsagon
epsagon-agent-kube-state-metrics-7cb699f7d6-6pzs4        1/1     Running                 0                  3m7s
epsagon-agent-cluster-agent-8bfb6955c-wt8wk              2/2     Running                 0                  3m7s
epsagon-agent-metrics-agent-server-55b558596b-cs7k5      2/2     Running                 0                  3m7s
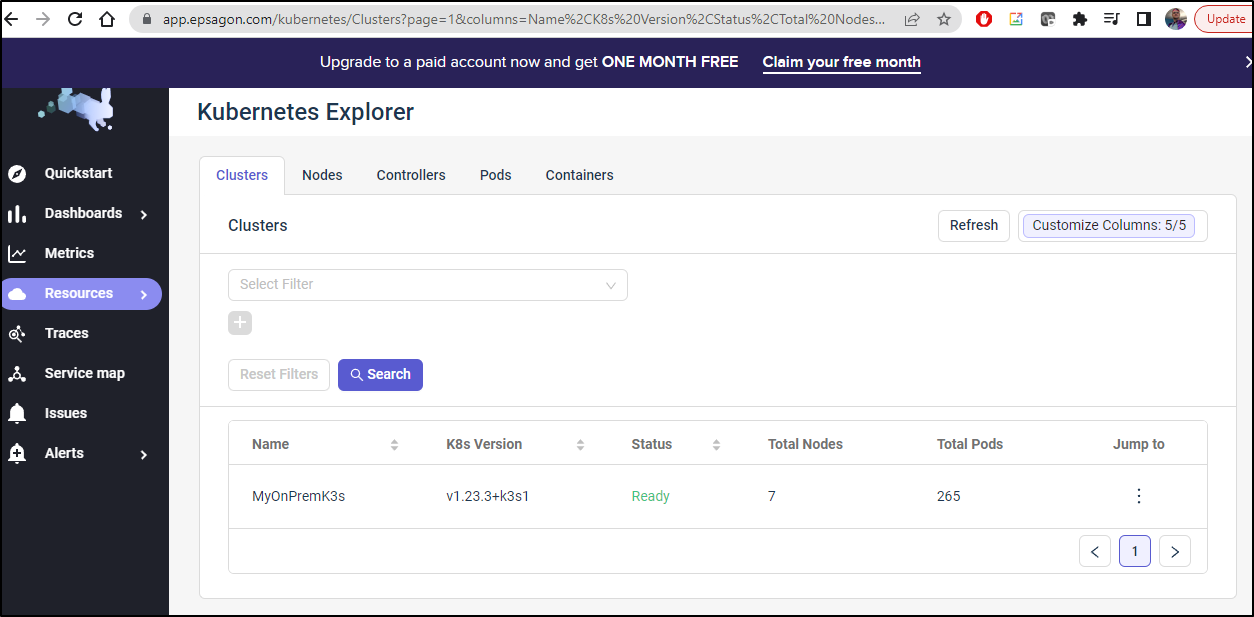
Back in Epsagon, I went to my cluster dashboard
Clicking the name of my cluster shows some general overall details
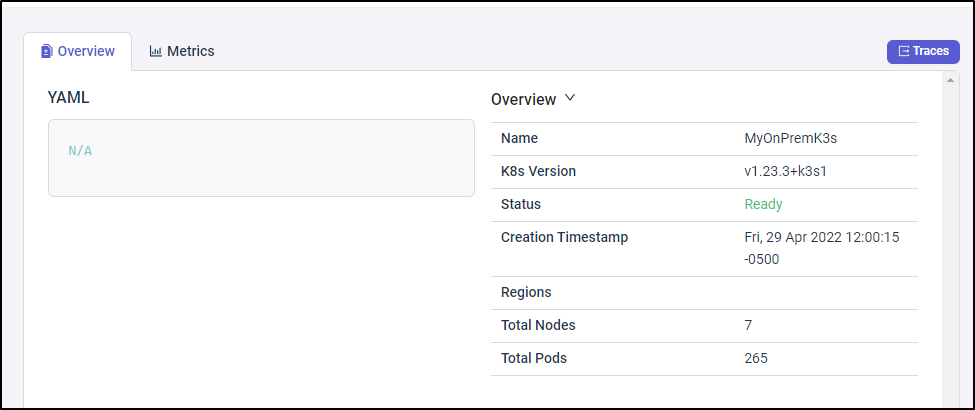
As I just launched it, I was not surprised that I did not yet see metrics
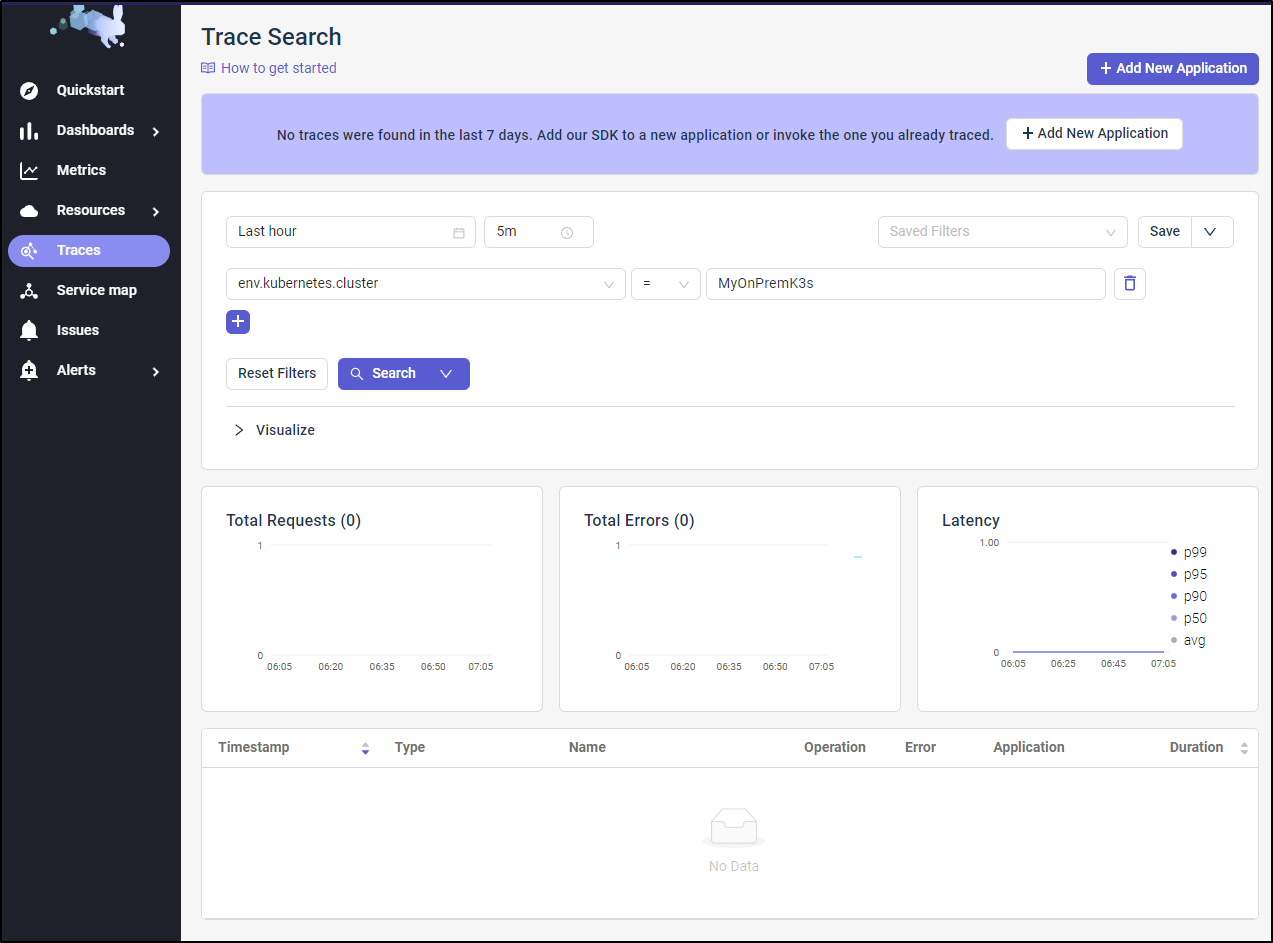
We’ll come back to that later. For now, let’s click traces and see what shows up.
Not surprisingly, we have no traces as we’ve yet to instrument code or set up an “Application”
Service Map was similarly empty
Metrics
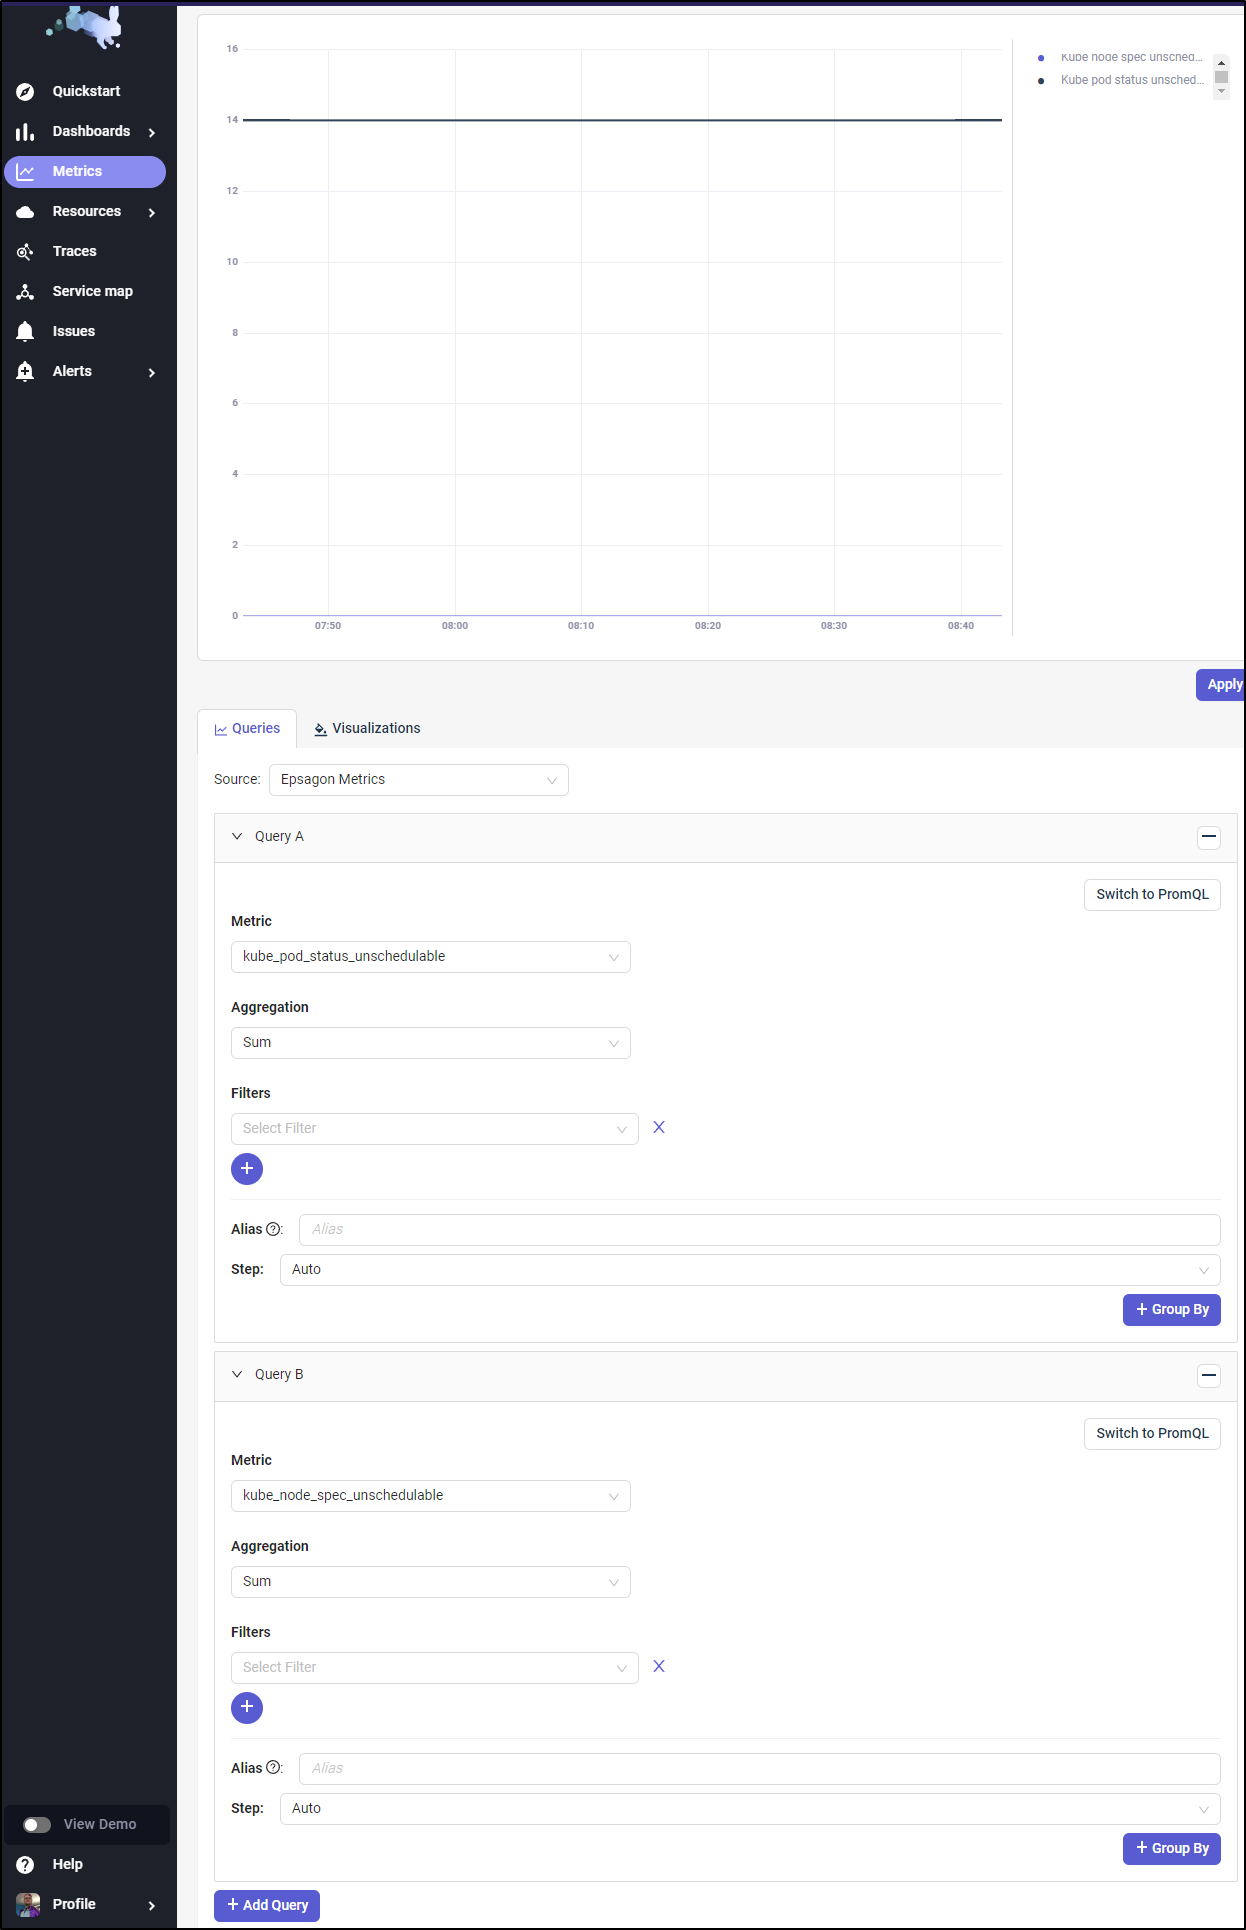
I could create metrics graphs based on any data collected. You can use their Metric Query form or switch to PromQL if preferred.
Here I queried for “kube_node_info” and “Kube_pod_status_Unschedulable”
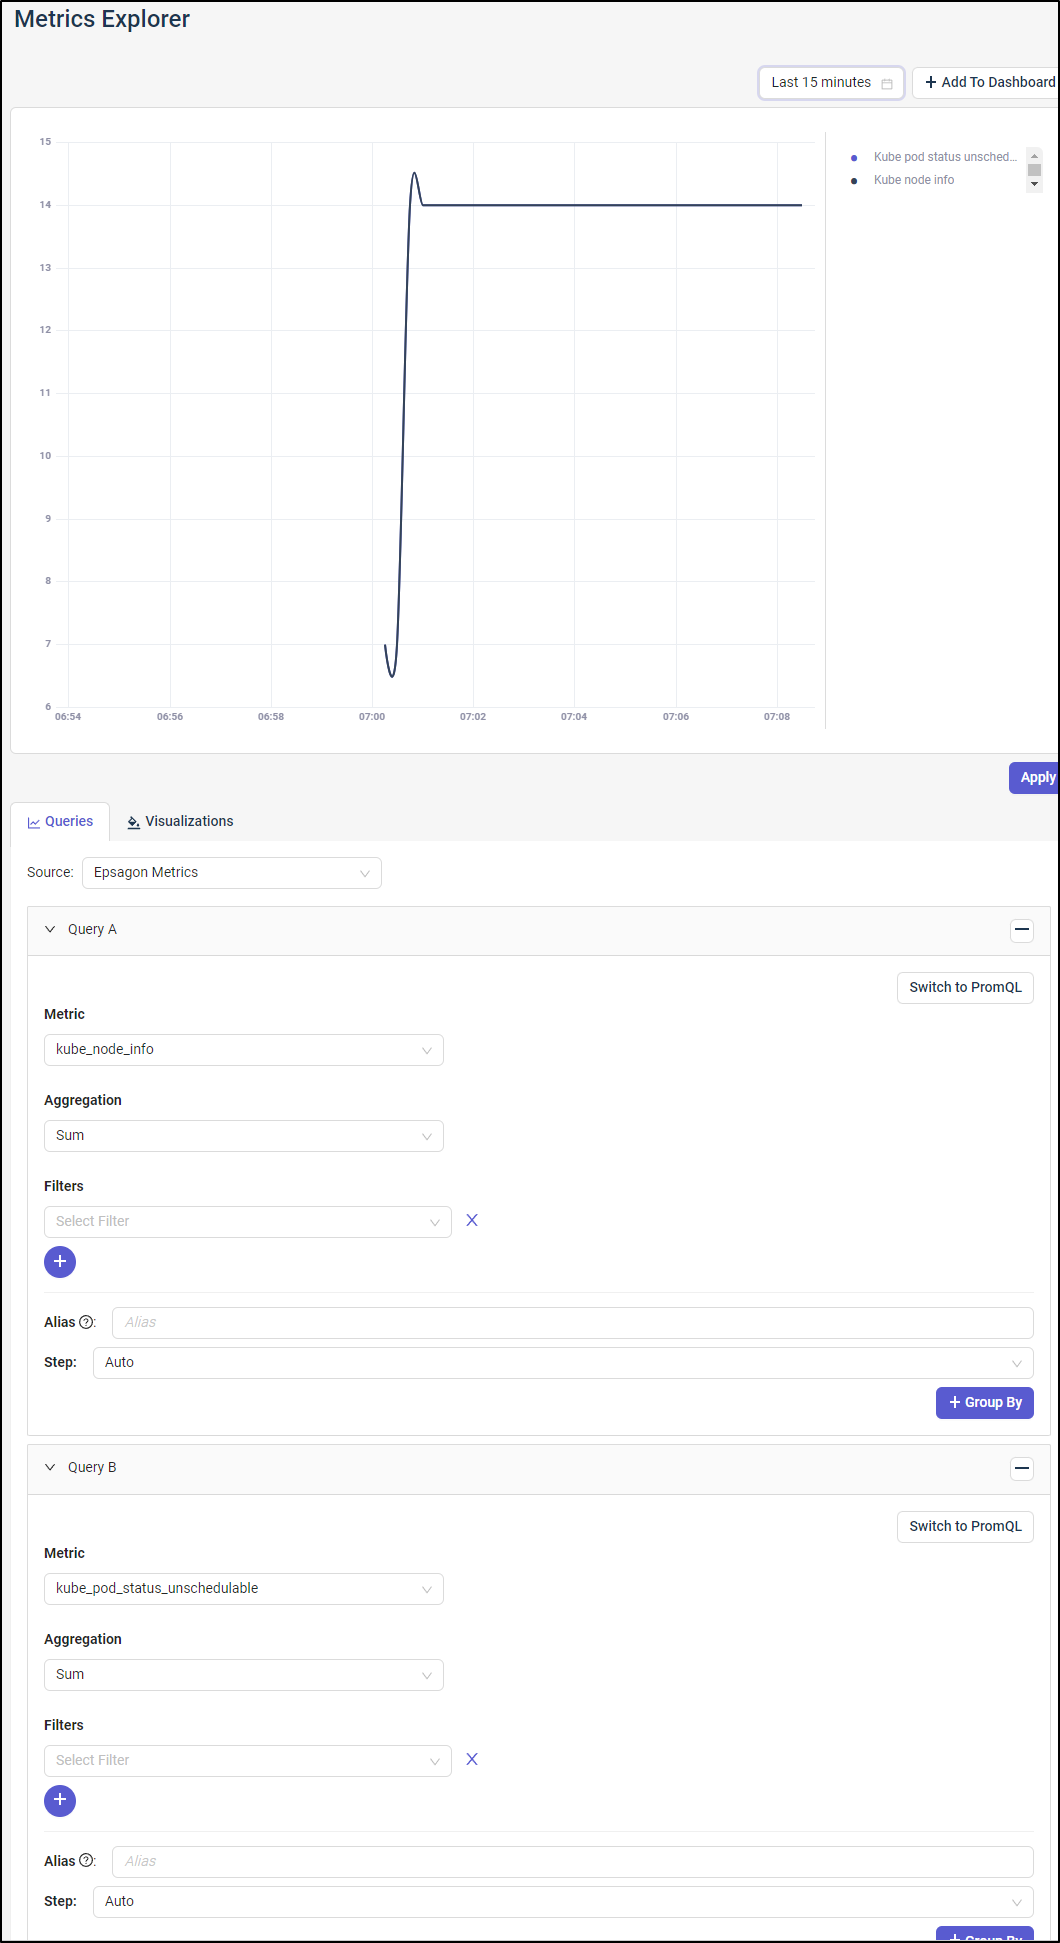
I took a moment to do some cleanup
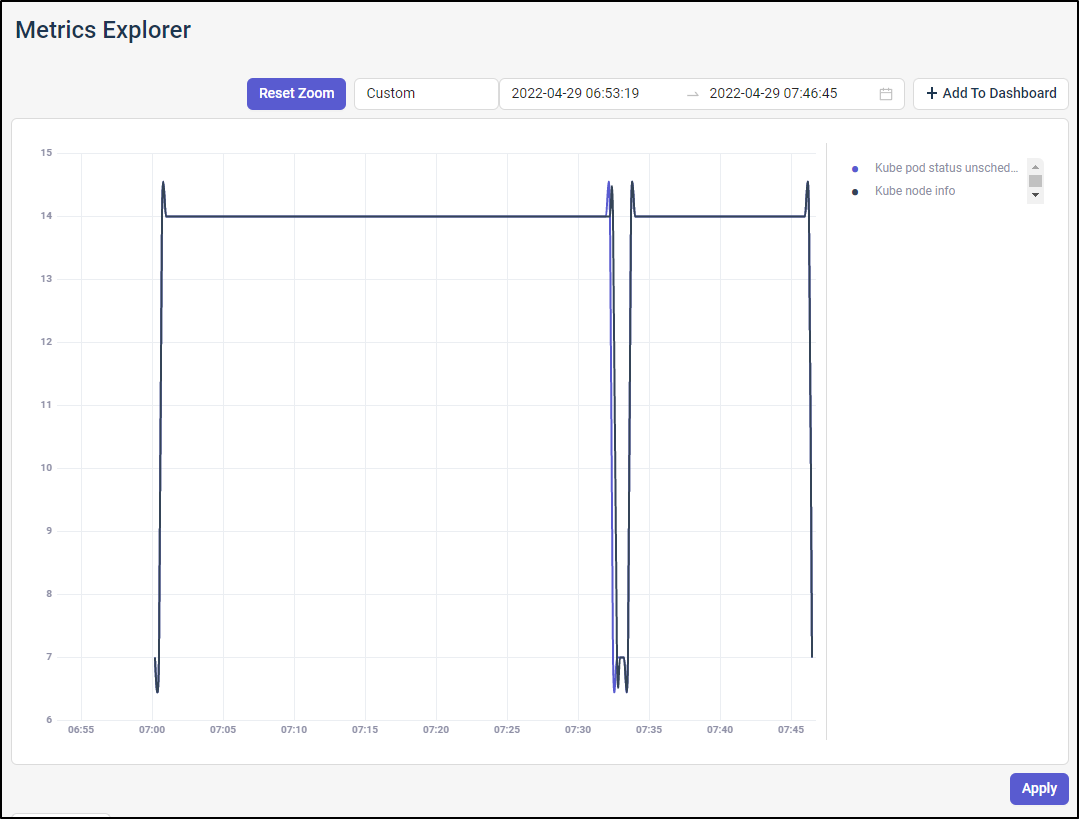
It worked for a few minutes.
If want to add such a metric to a dashboard, we have to have a dashboard first.
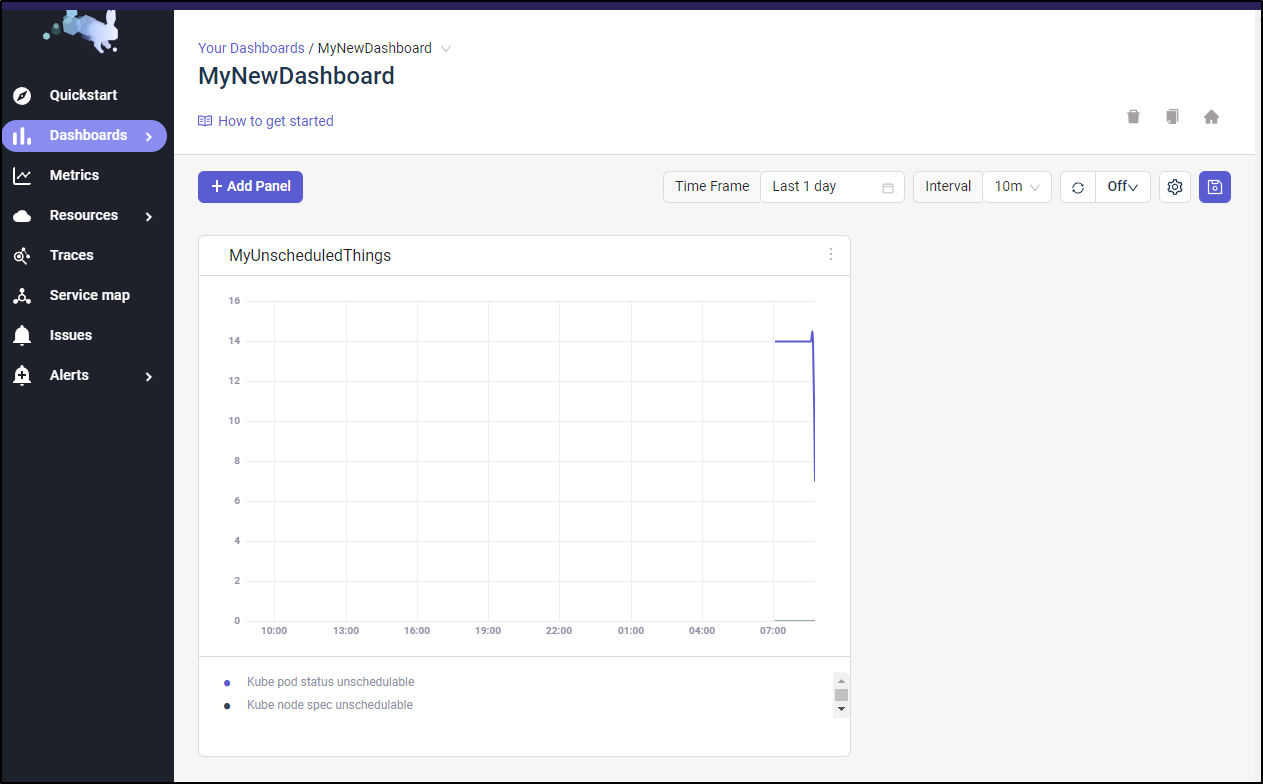
Dashboards
From Dashboards/My Dashboards, create a new Dashboard
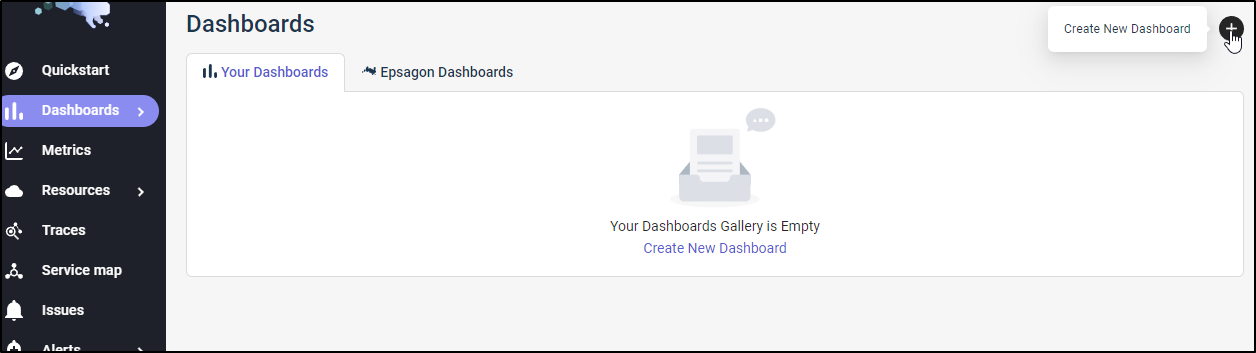
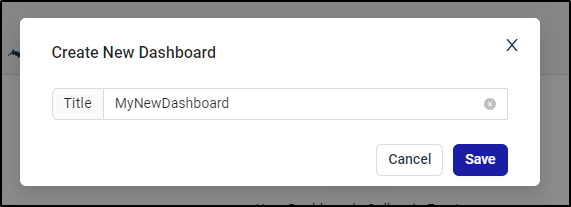
We can call it “MyNewDashboard” and save
I’ll create a new metric query on unschedulable pods and nodes
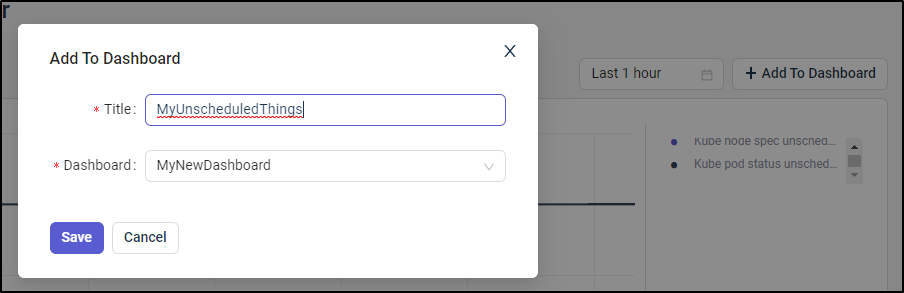
then click “+ Add To Dashboard”
Here I can put in the Panel Title and Dashboard name and save
Going back to MyNewDashboard and refreshing shows the new panel. I can click the lower right to pull the panel out to a new size (here I made it bigger)
Side note: Dapr.io
I realized the core issue with Dapr.io is even with upgrades, the helm chart holds the x509 certs that expire after 1 year.
$ kubectl logs perl-debugger-5967f99ff6-zqdtx
error: a container name must be specified for pod perl-debugger-5967f99ff6-zqdtx, choose one of: [perl-debugger daprd]
WS-C02GD09AMD6V:ansible isaac.johnson$ kubectl logs perl-debugger-5967f99ff6-zqdtx  daprd
time="2022-04-29T14:23:35.598869933Z" level=info msg="starting Dapr Runtime -- version 1.7.2 -- commit 1f8c0abfc73bb14a71435519e56b2aecb4385f01" app_id=perl-debugger instance=perl-debugger-5967f99ff6-zqdtx scope=dapr.runtime type=log ver=1.7.2
time="2022-04-29T14:23:35.598896771Z" level=info msg="log level set to: info" app_id=perl-debugger instance=perl-debugger-5967f99ff6-zqdtx scope=dapr.runtime type=log ver=1.7.2
time="2022-04-29T14:23:35.598983816Z" level=info msg="metrics server started on :9090/" app_id=perl-debugger instance=perl-debugger-5967f99ff6-zqdtx scope=dapr.metrics type=log ver=1.7.2
time="2022-04-29T14:23:35.599086346Z" level=info msg="Initializing the operator client (config: appconfig)" app_id=perl-debugger instance=perl-debugger-5967f99ff6-zqdtx scope=dapr.runtime type=log ver=1.7.2
time="2022-04-29T14:23:40.619169409Z" level=fatal msg="error loading configuration: rpc error: code = Unavailable desc = connection error: desc = \"transport: authentication handshake failed: x509: certificate has expired or is not yet valid: current time 2022-04-29T14:23:38Z is after 2022-04-02T13:37:45Z\"" app_id=perl-debugger instance=perl-debugger-5967f99ff6-zqdtx scope=dapr.runtime type=log ver=1.7.2
It seems this is a known issue. We can use the dapr CLI to force an update
$ dapr mtls renew-certificate -k --valid-until 365 --restart
⌛  Starting certificate rotation
ℹ️  generating fresh certificates
ℹ️  Updating certifcates in your Kubernetes cluster
ℹ️  Dapr control plane version 1.7.2 detected in namespace default
✅  Certificate rotation is successful! Your new certicate is valid through Sat, 29 Apr 2023 14:24:40 UTC
ℹ️  Restarting deploy/dapr-sentry..
ℹ️  Restarting deploy/dapr-operator..
ℹ️  Restarting statefulsets/dapr-placement-server..
✅  All control plane services have restarted successfully!
So I first upgraded via helm
kubectl replace -f https://raw.githubusercontent.com/dapr/dapr/v1.7.2/charts/dapr/crds/components.yaml
kubectl replace -f https://raw.githubusercontent.com/dapr/dapr/v1.7.2/charts/dapr/crds/configuration.yaml
kubectl replace -f https://raw.githubusercontent.com/dapr/dapr/v1.7.2/charts/dapr/crds/subscription.yaml

helm repo update

helm upgrade dapr dapr/dapr --version 1.7.2 --namespace dapr-system --wait
Kubernetes observability
Under Nodes, we can get details on the cluster’s nodes such as version and which are the master.
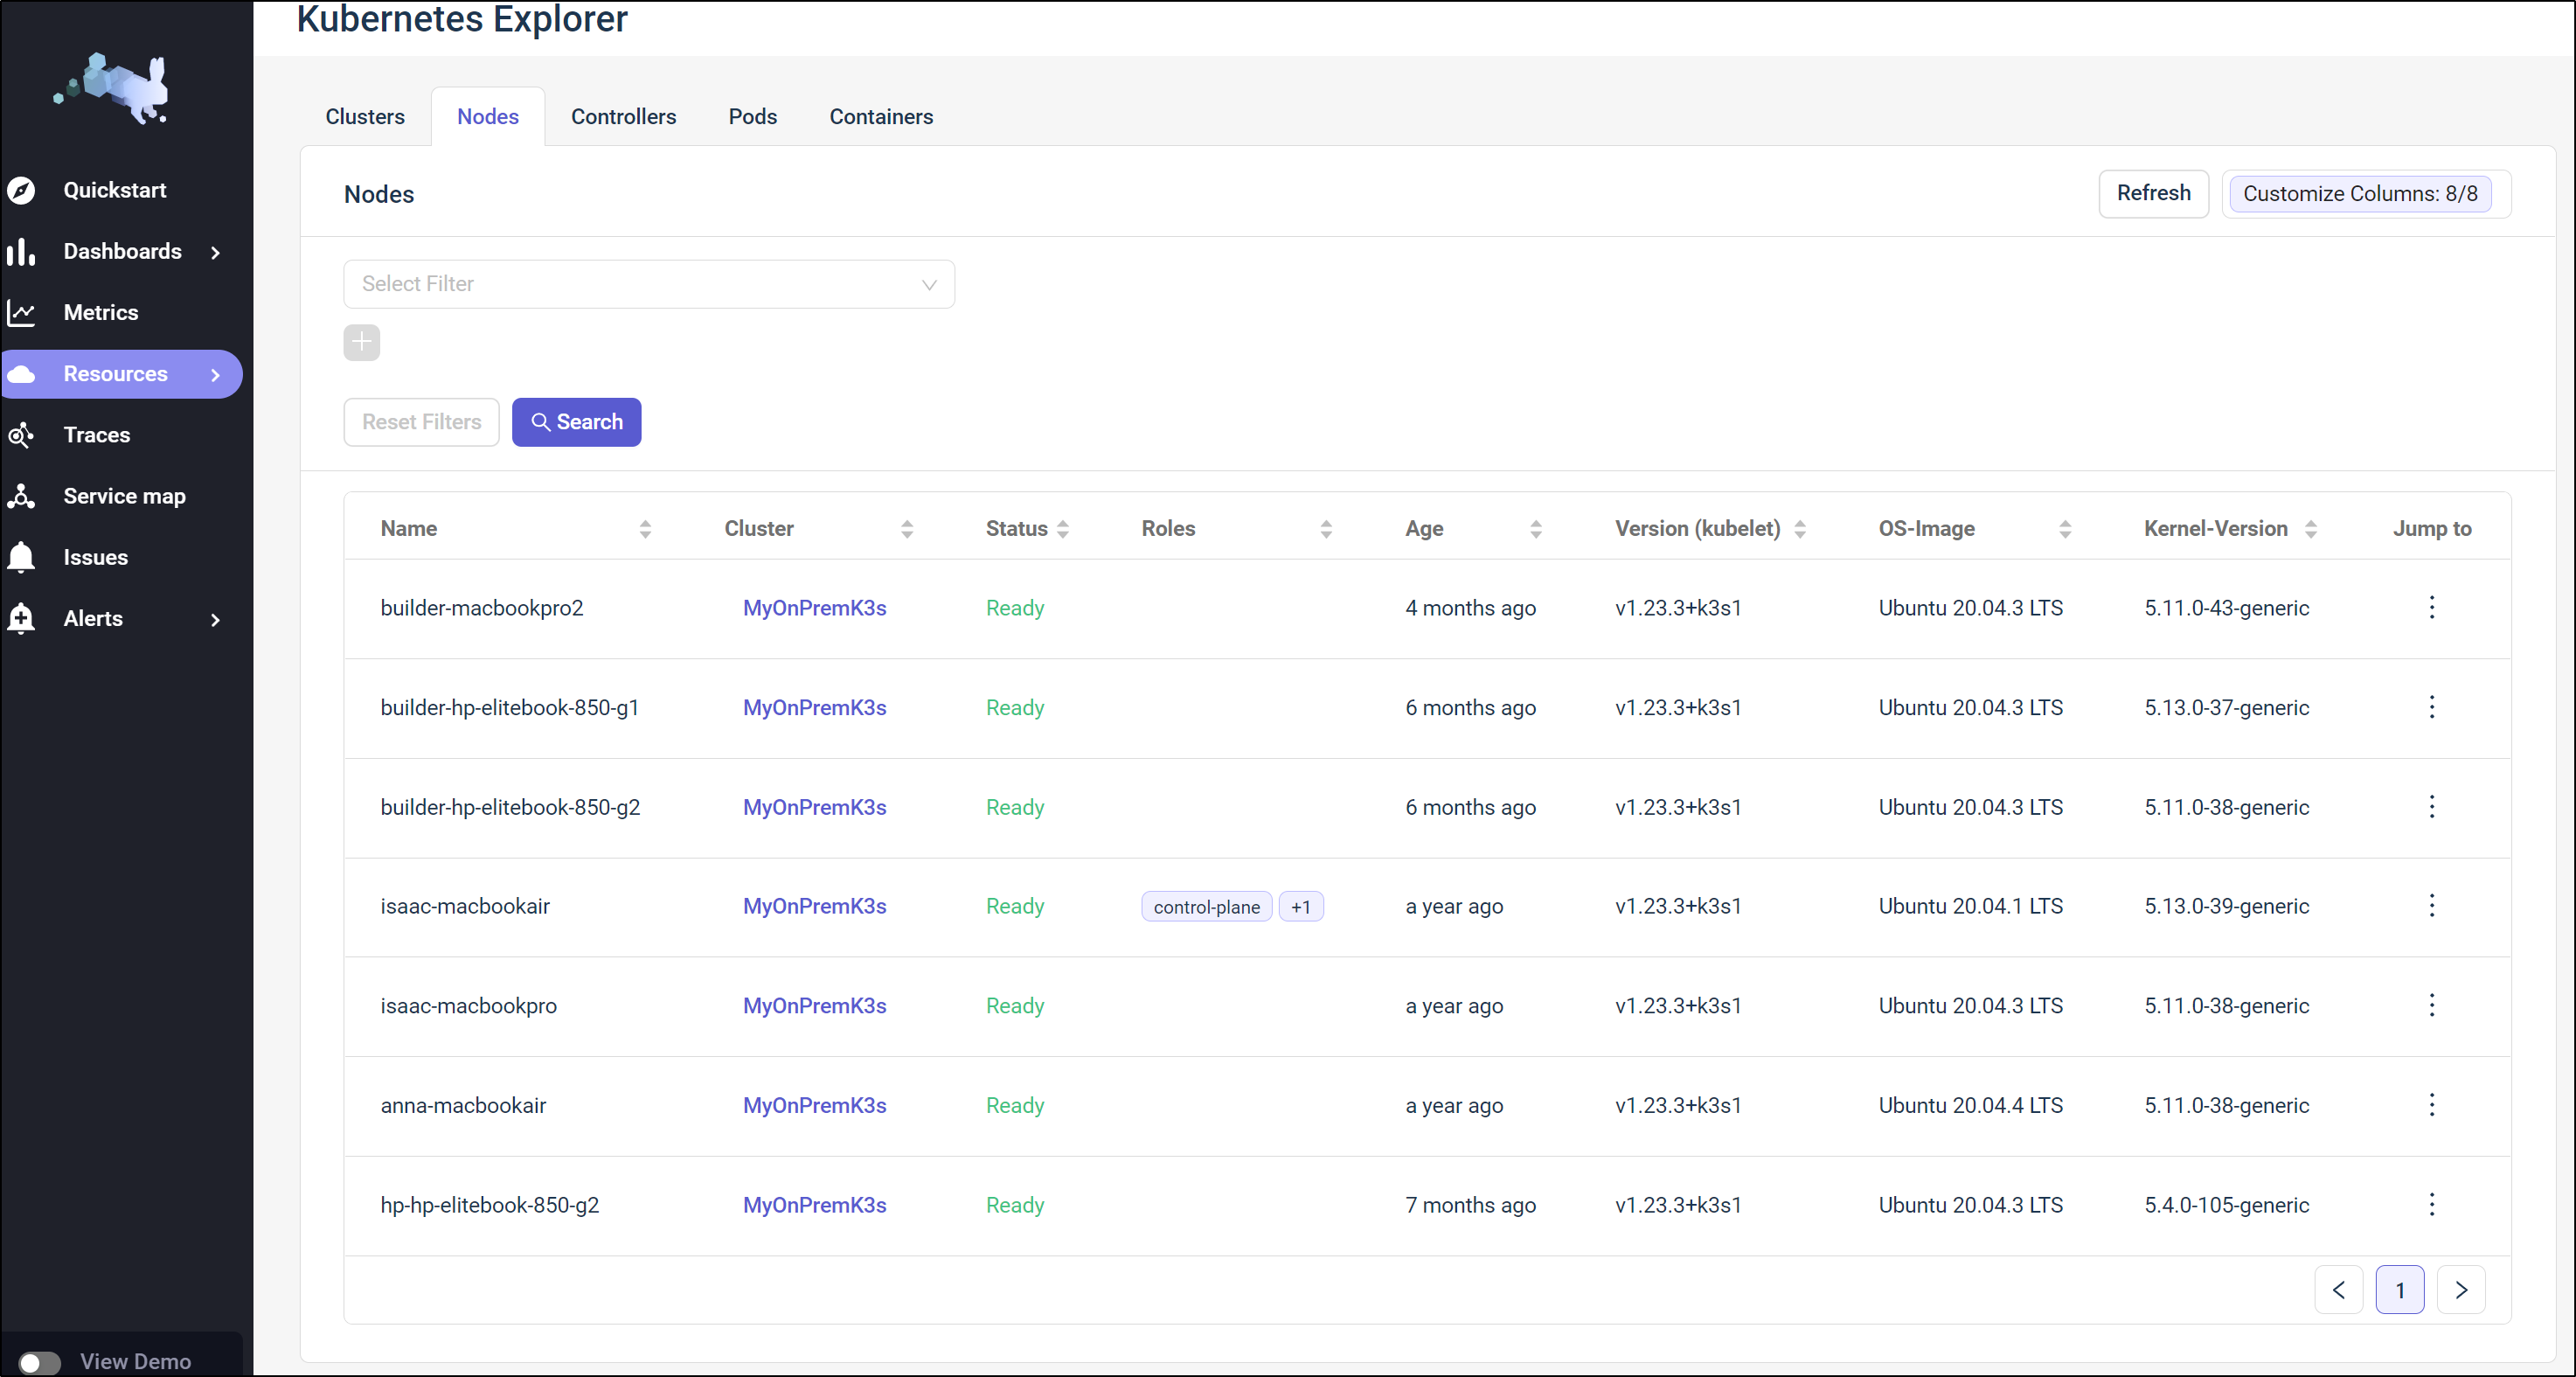
The 3 dots at the end let us jump to various details
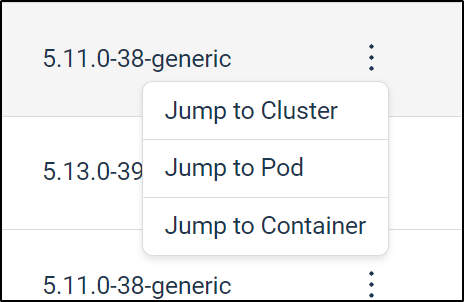
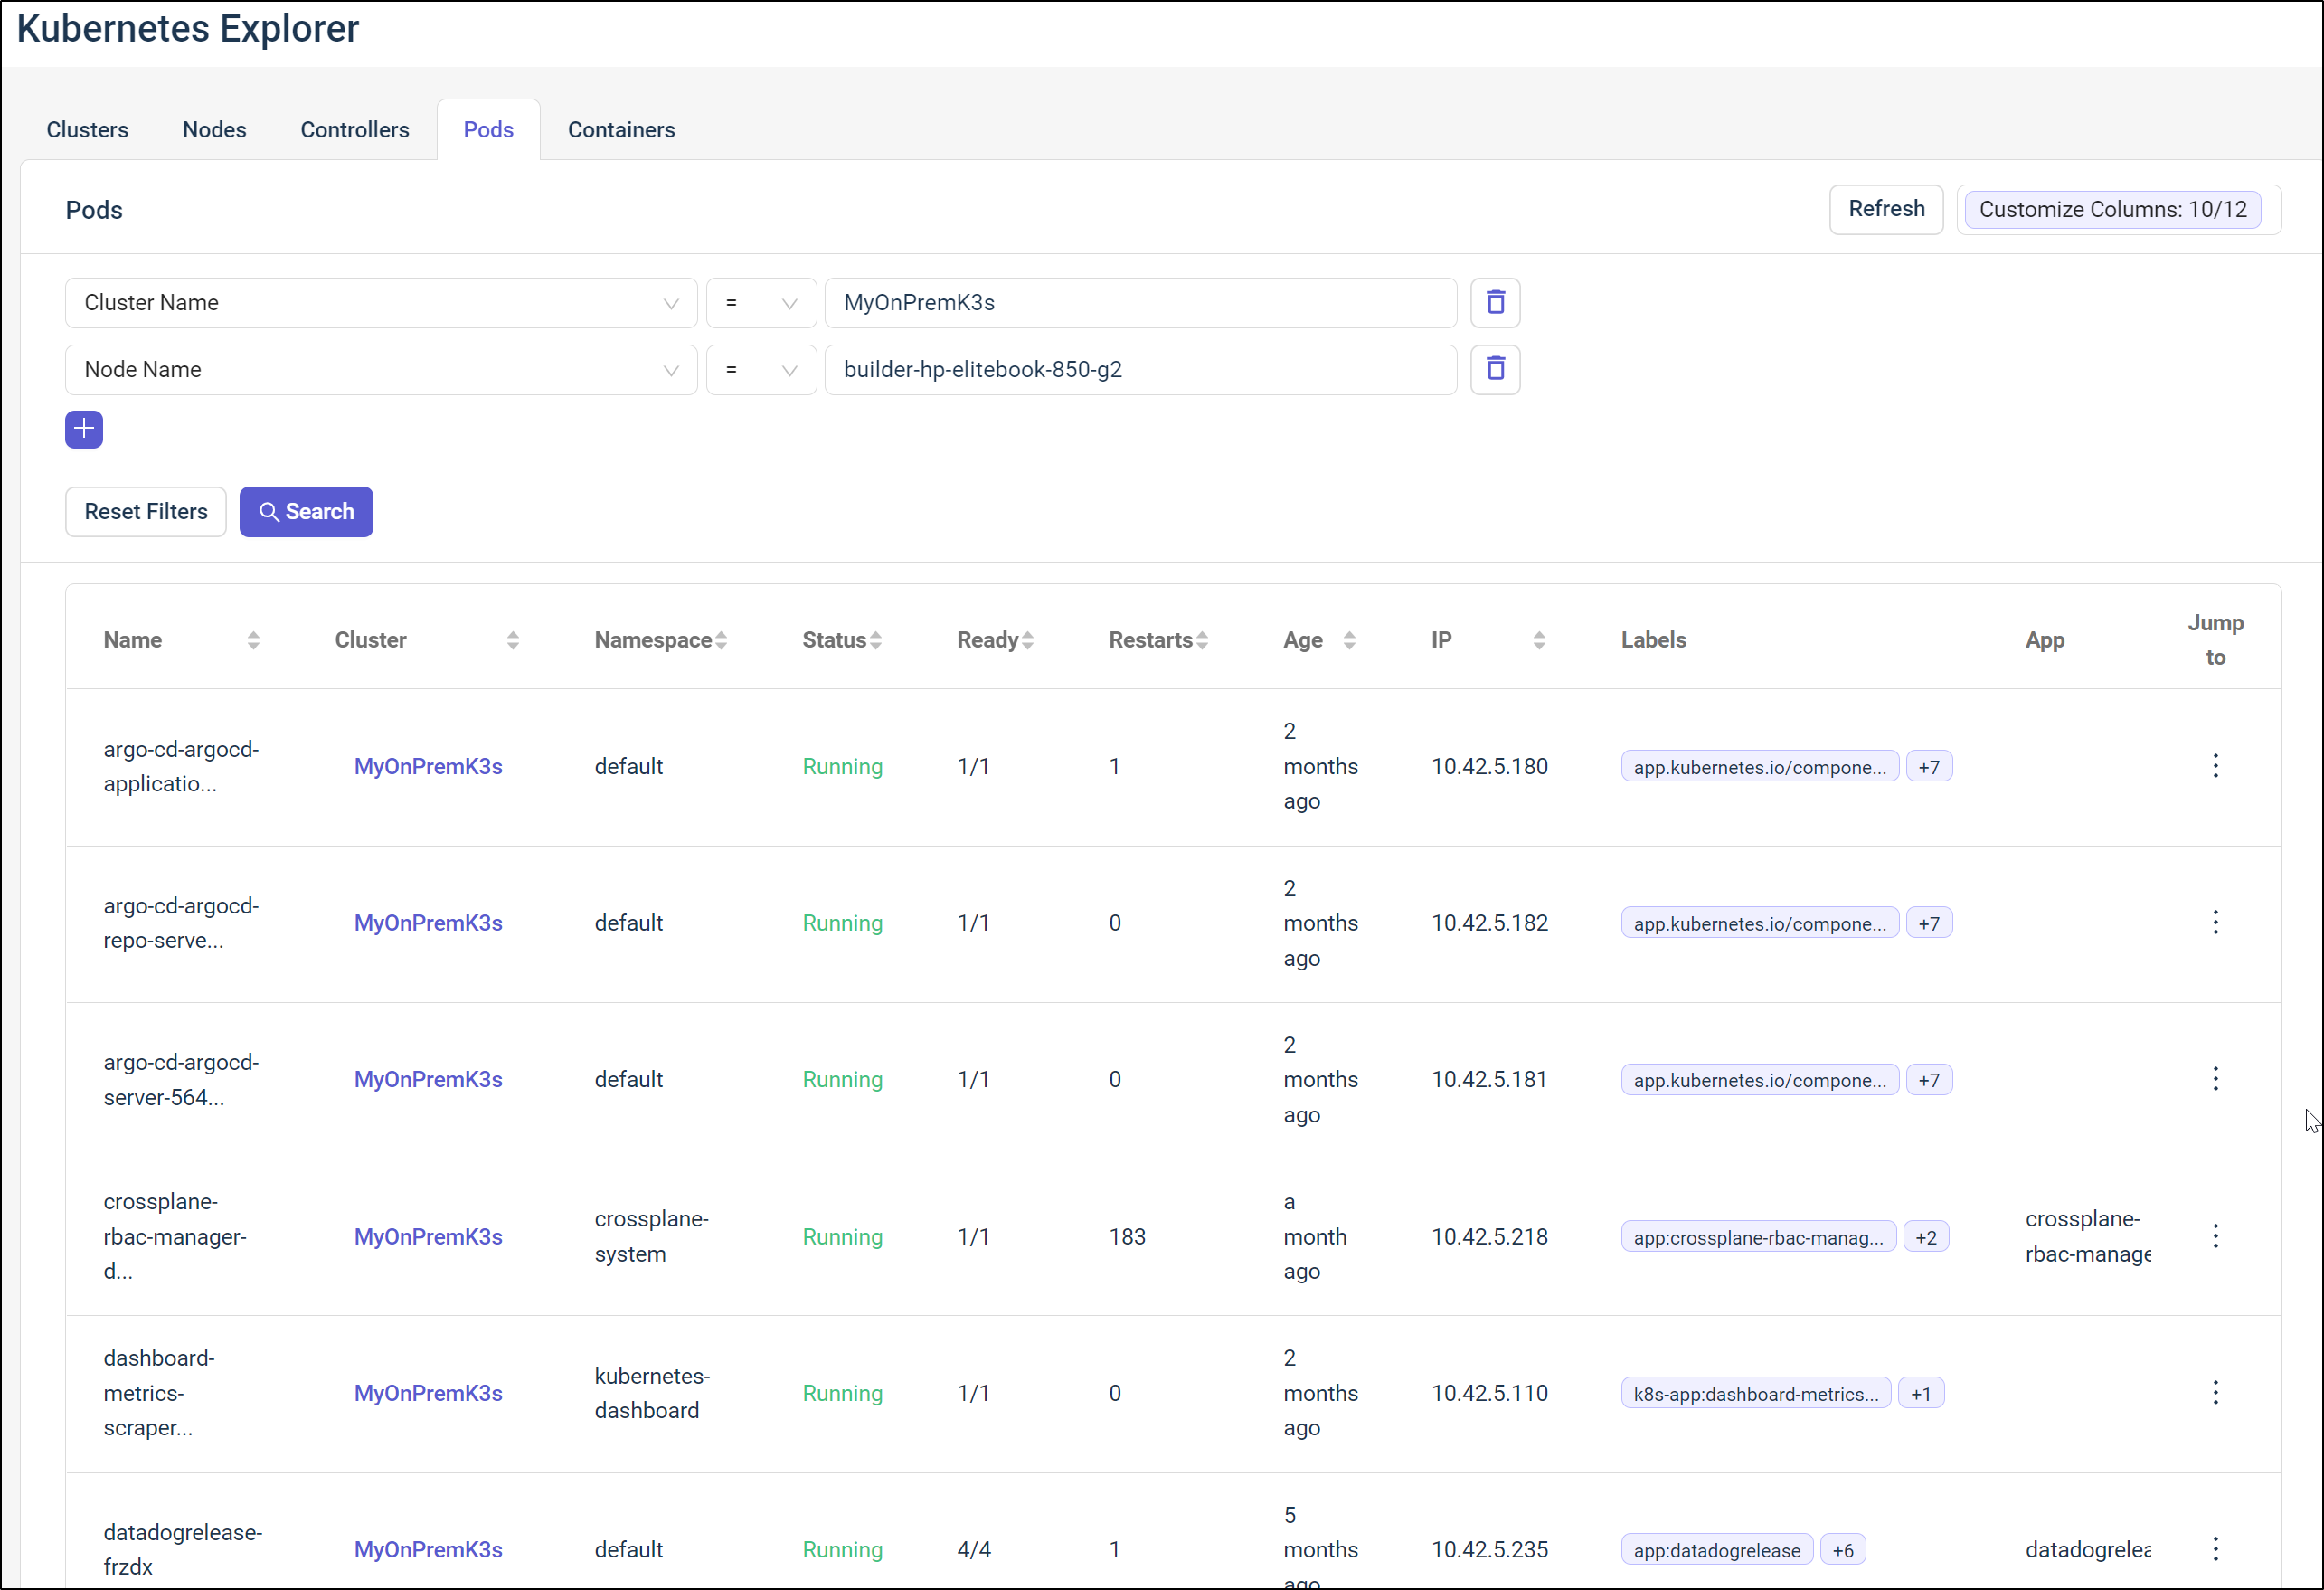
Say I choose to Jump To Pods from there on a node, we can see the Pods associate with that particular node
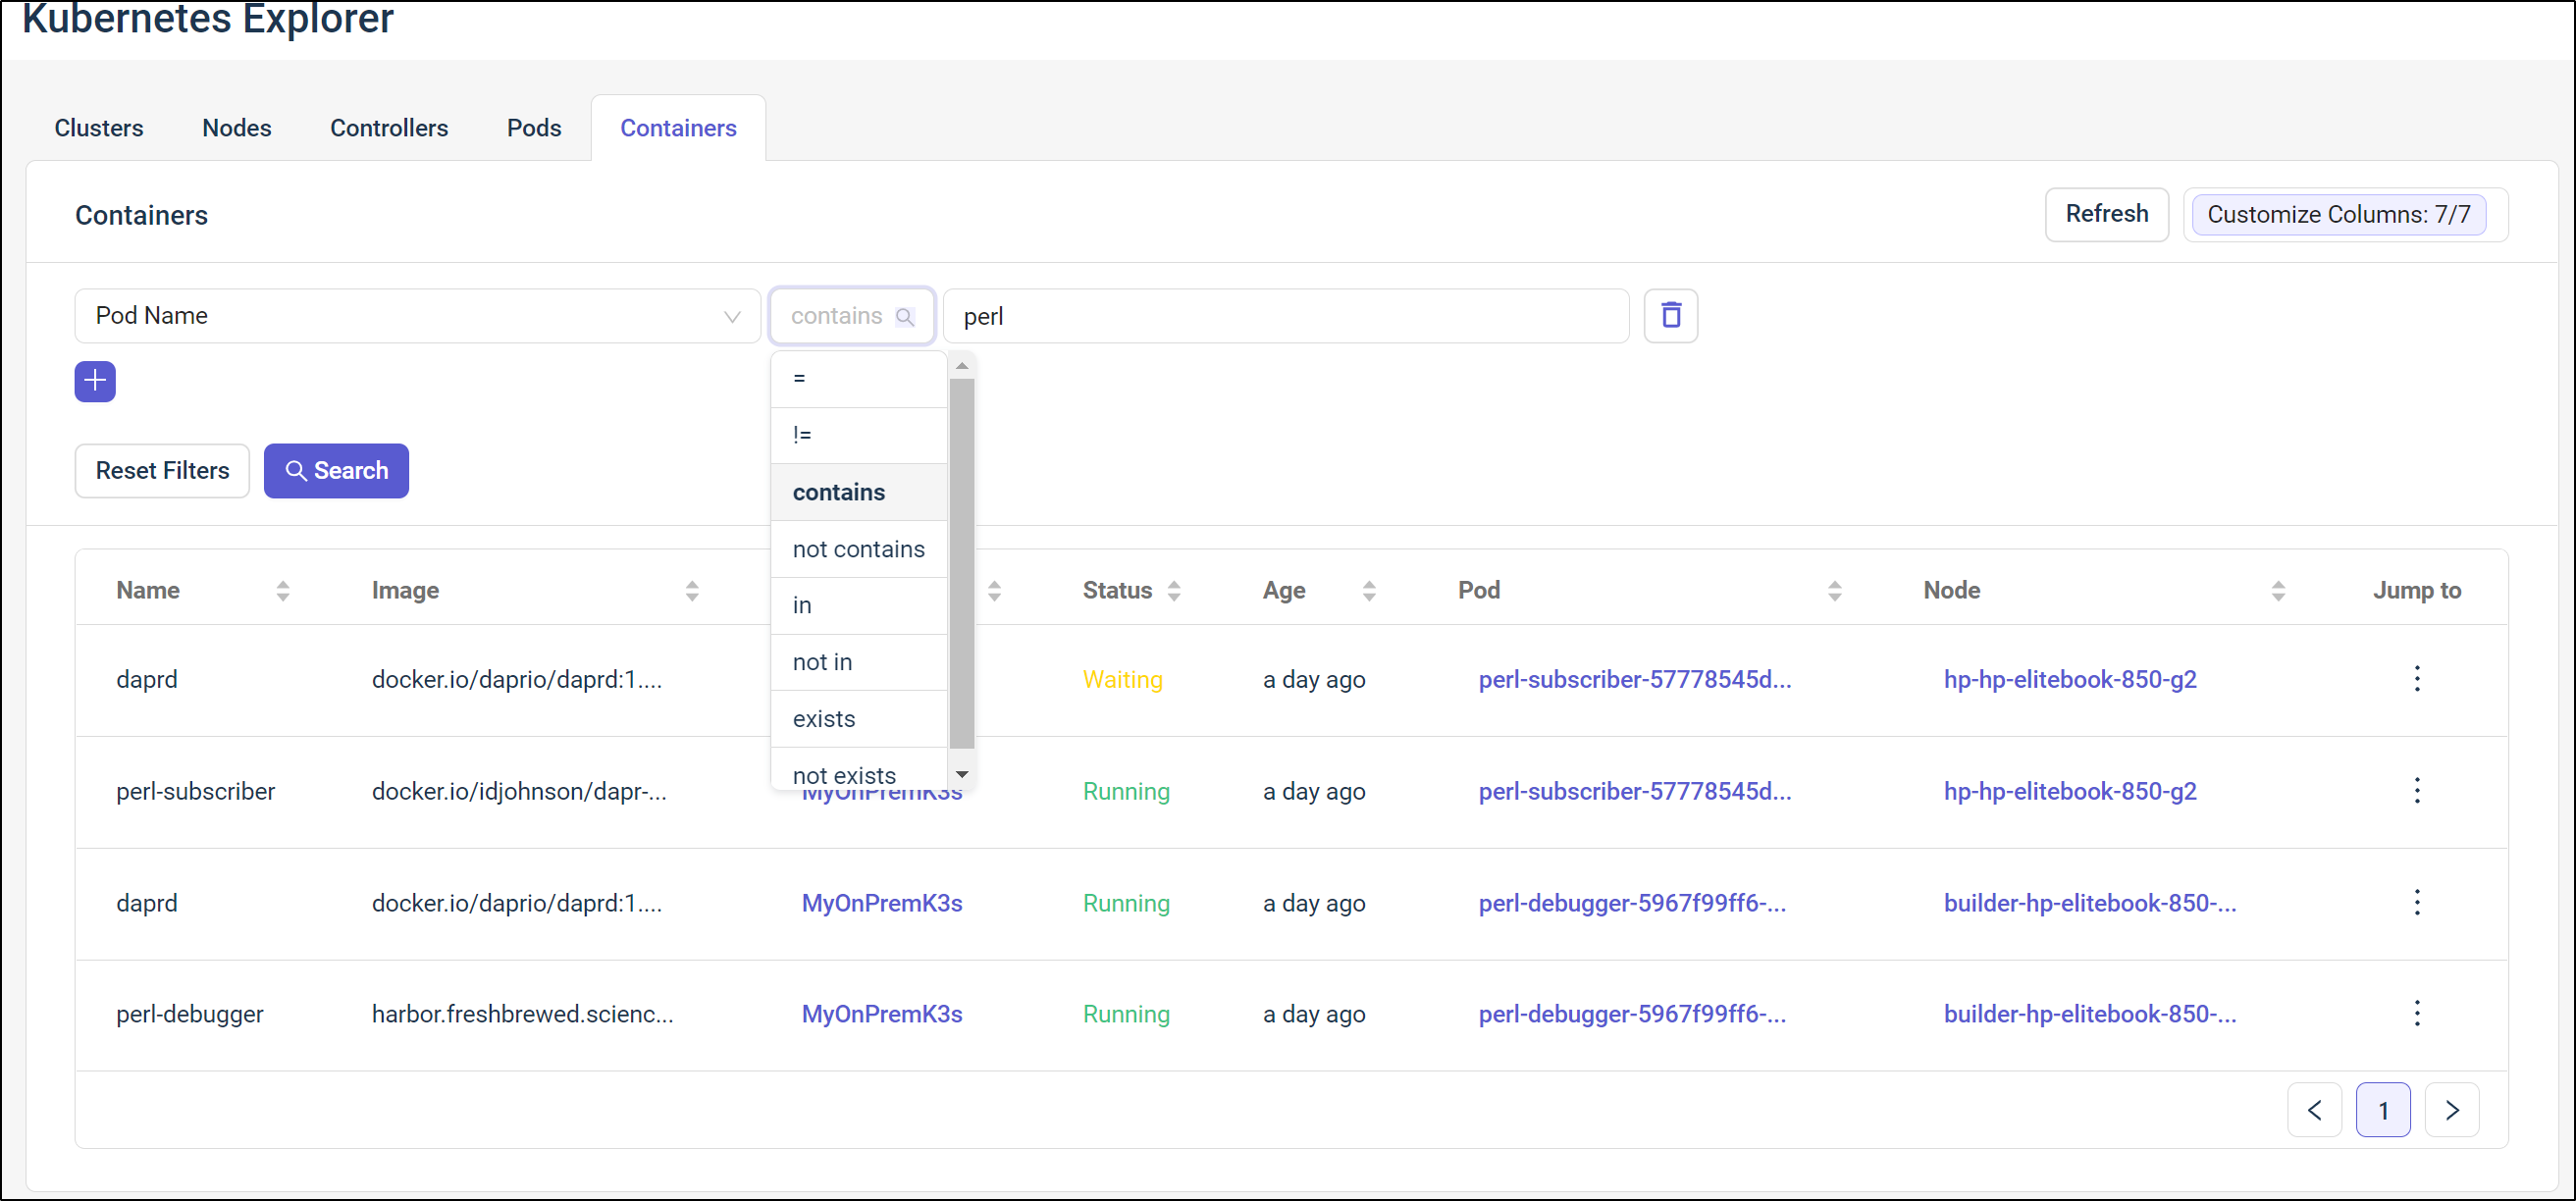
I found the search ability on Containers to be pretty useful. Here I searched for containers related to perl. I have two perl related pods and each are Dapr.io orchestrated. So as we would expect, 4 containers are shown in the results
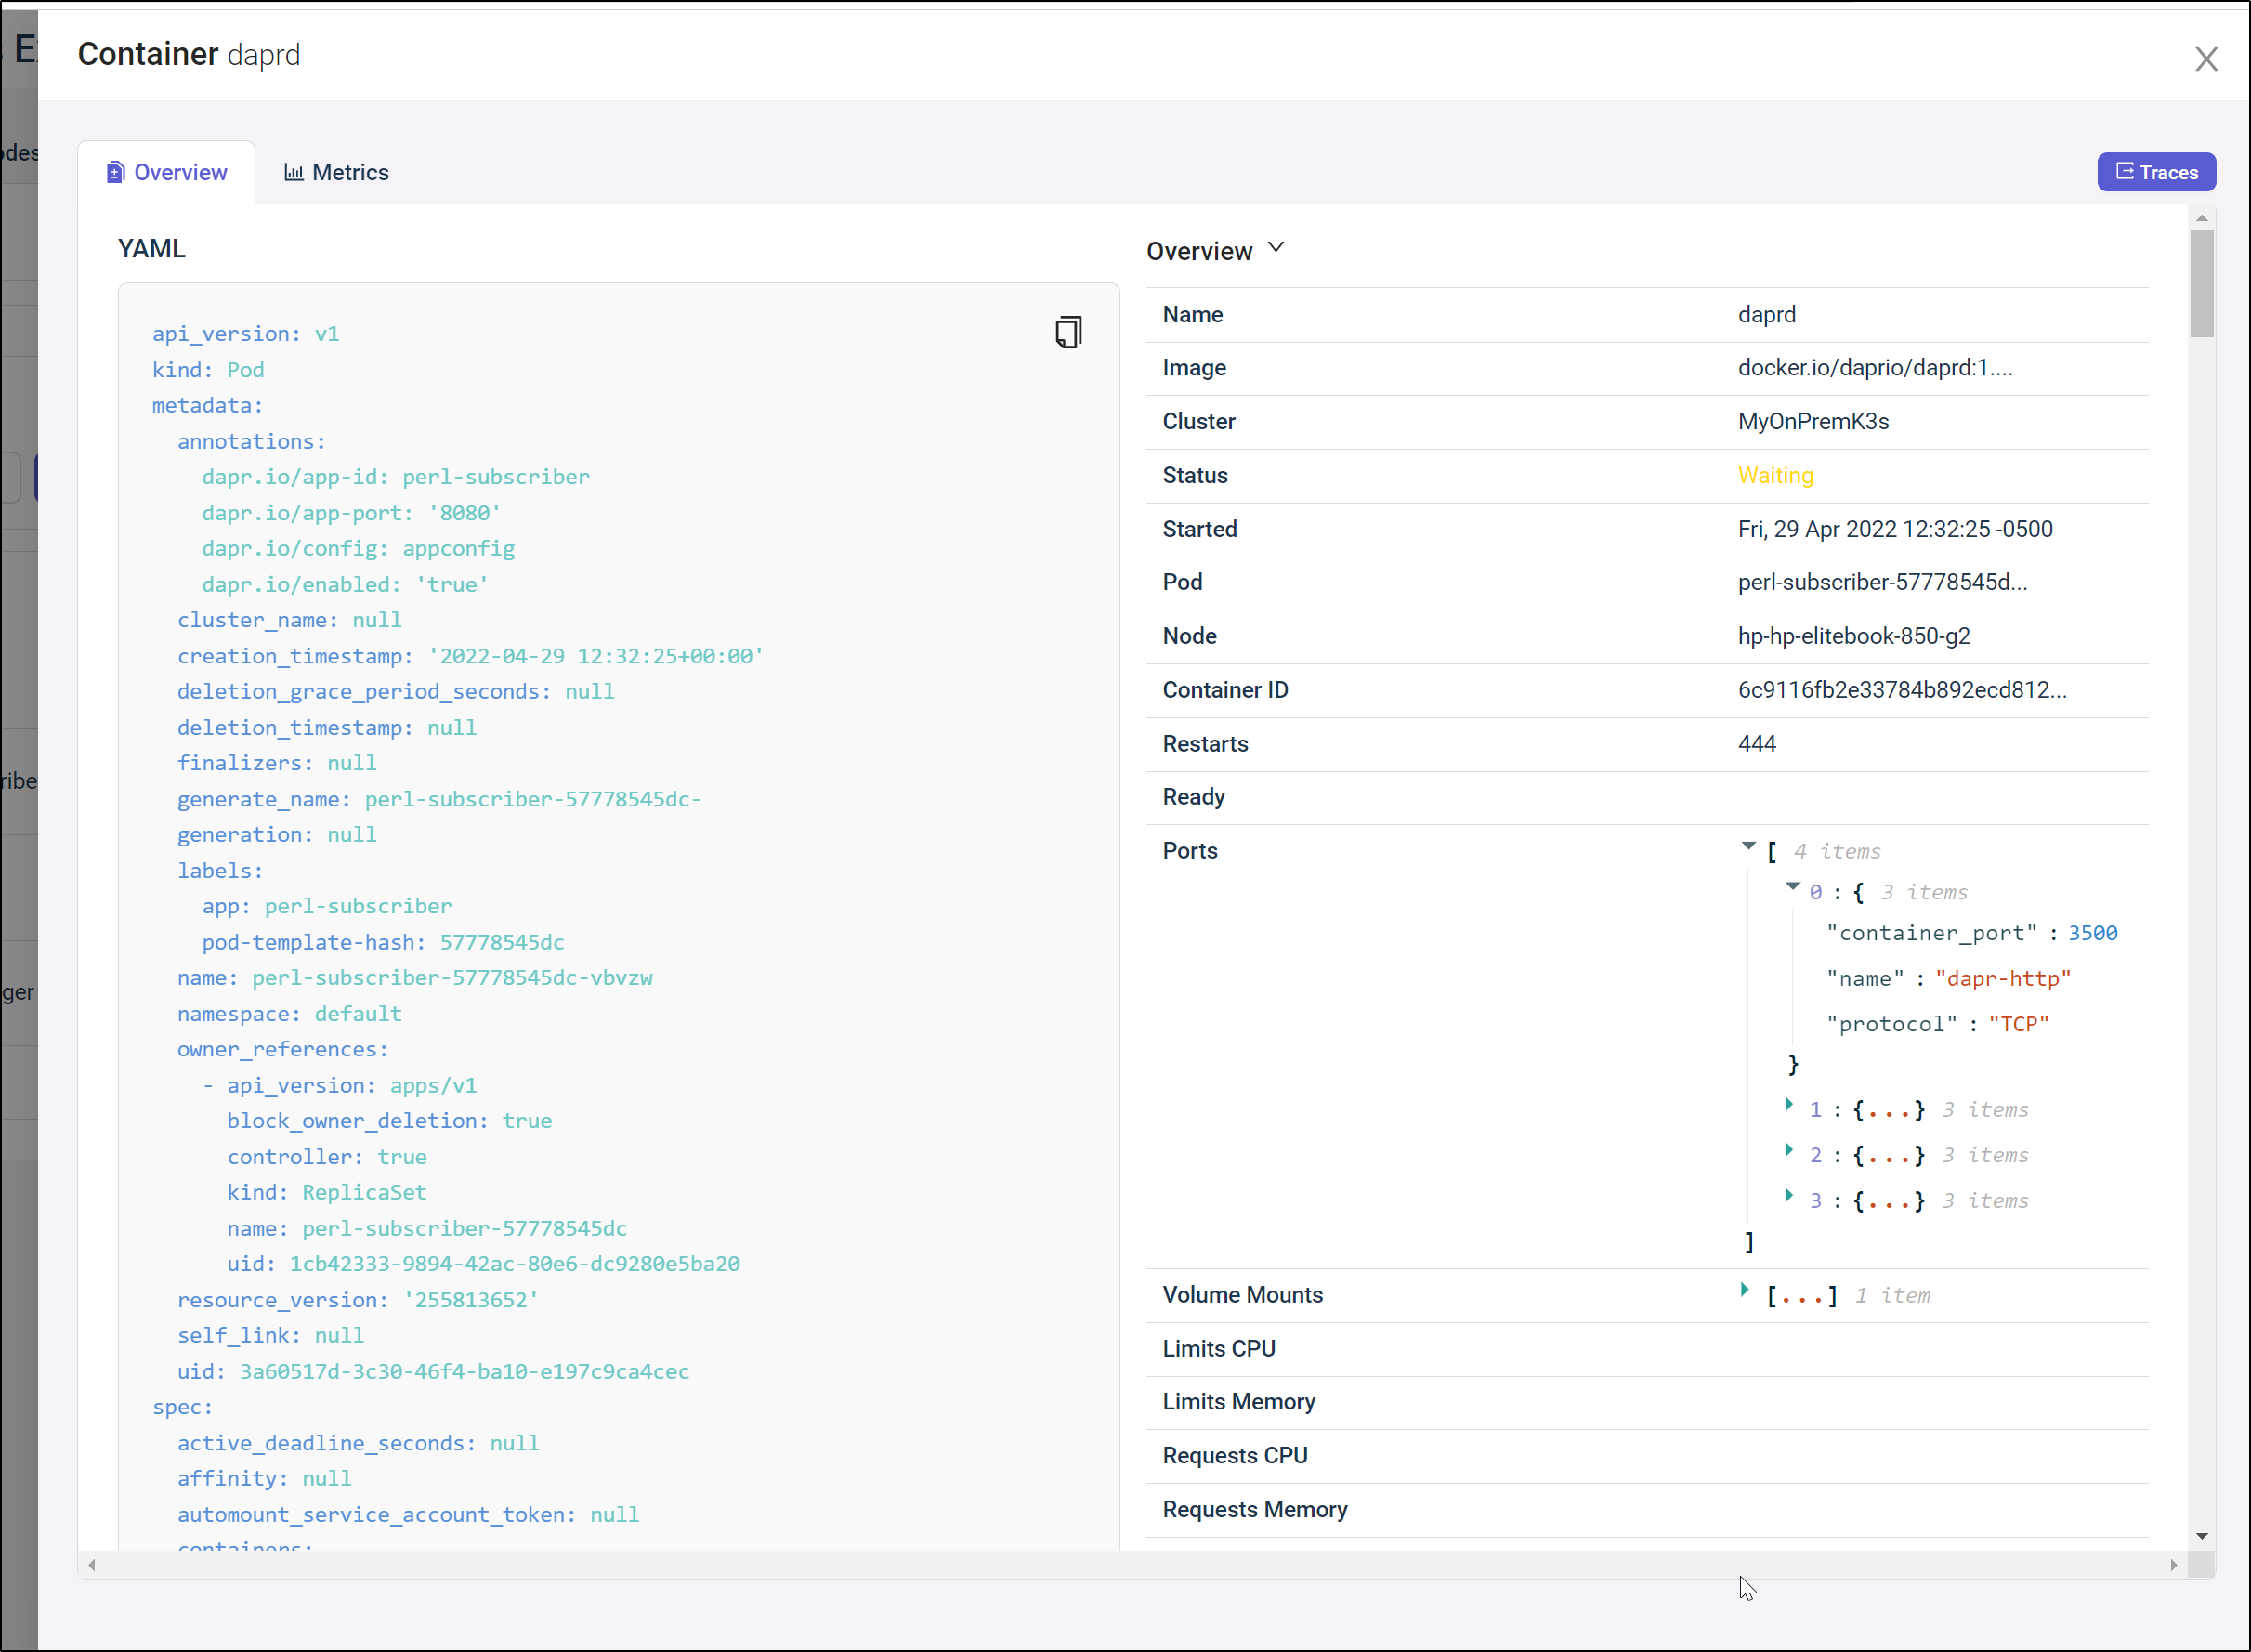
If I pick a container, say the one that is waiting in our results, we can get details such as the YAML and ports it is using
We can see the kind of Metrics collected
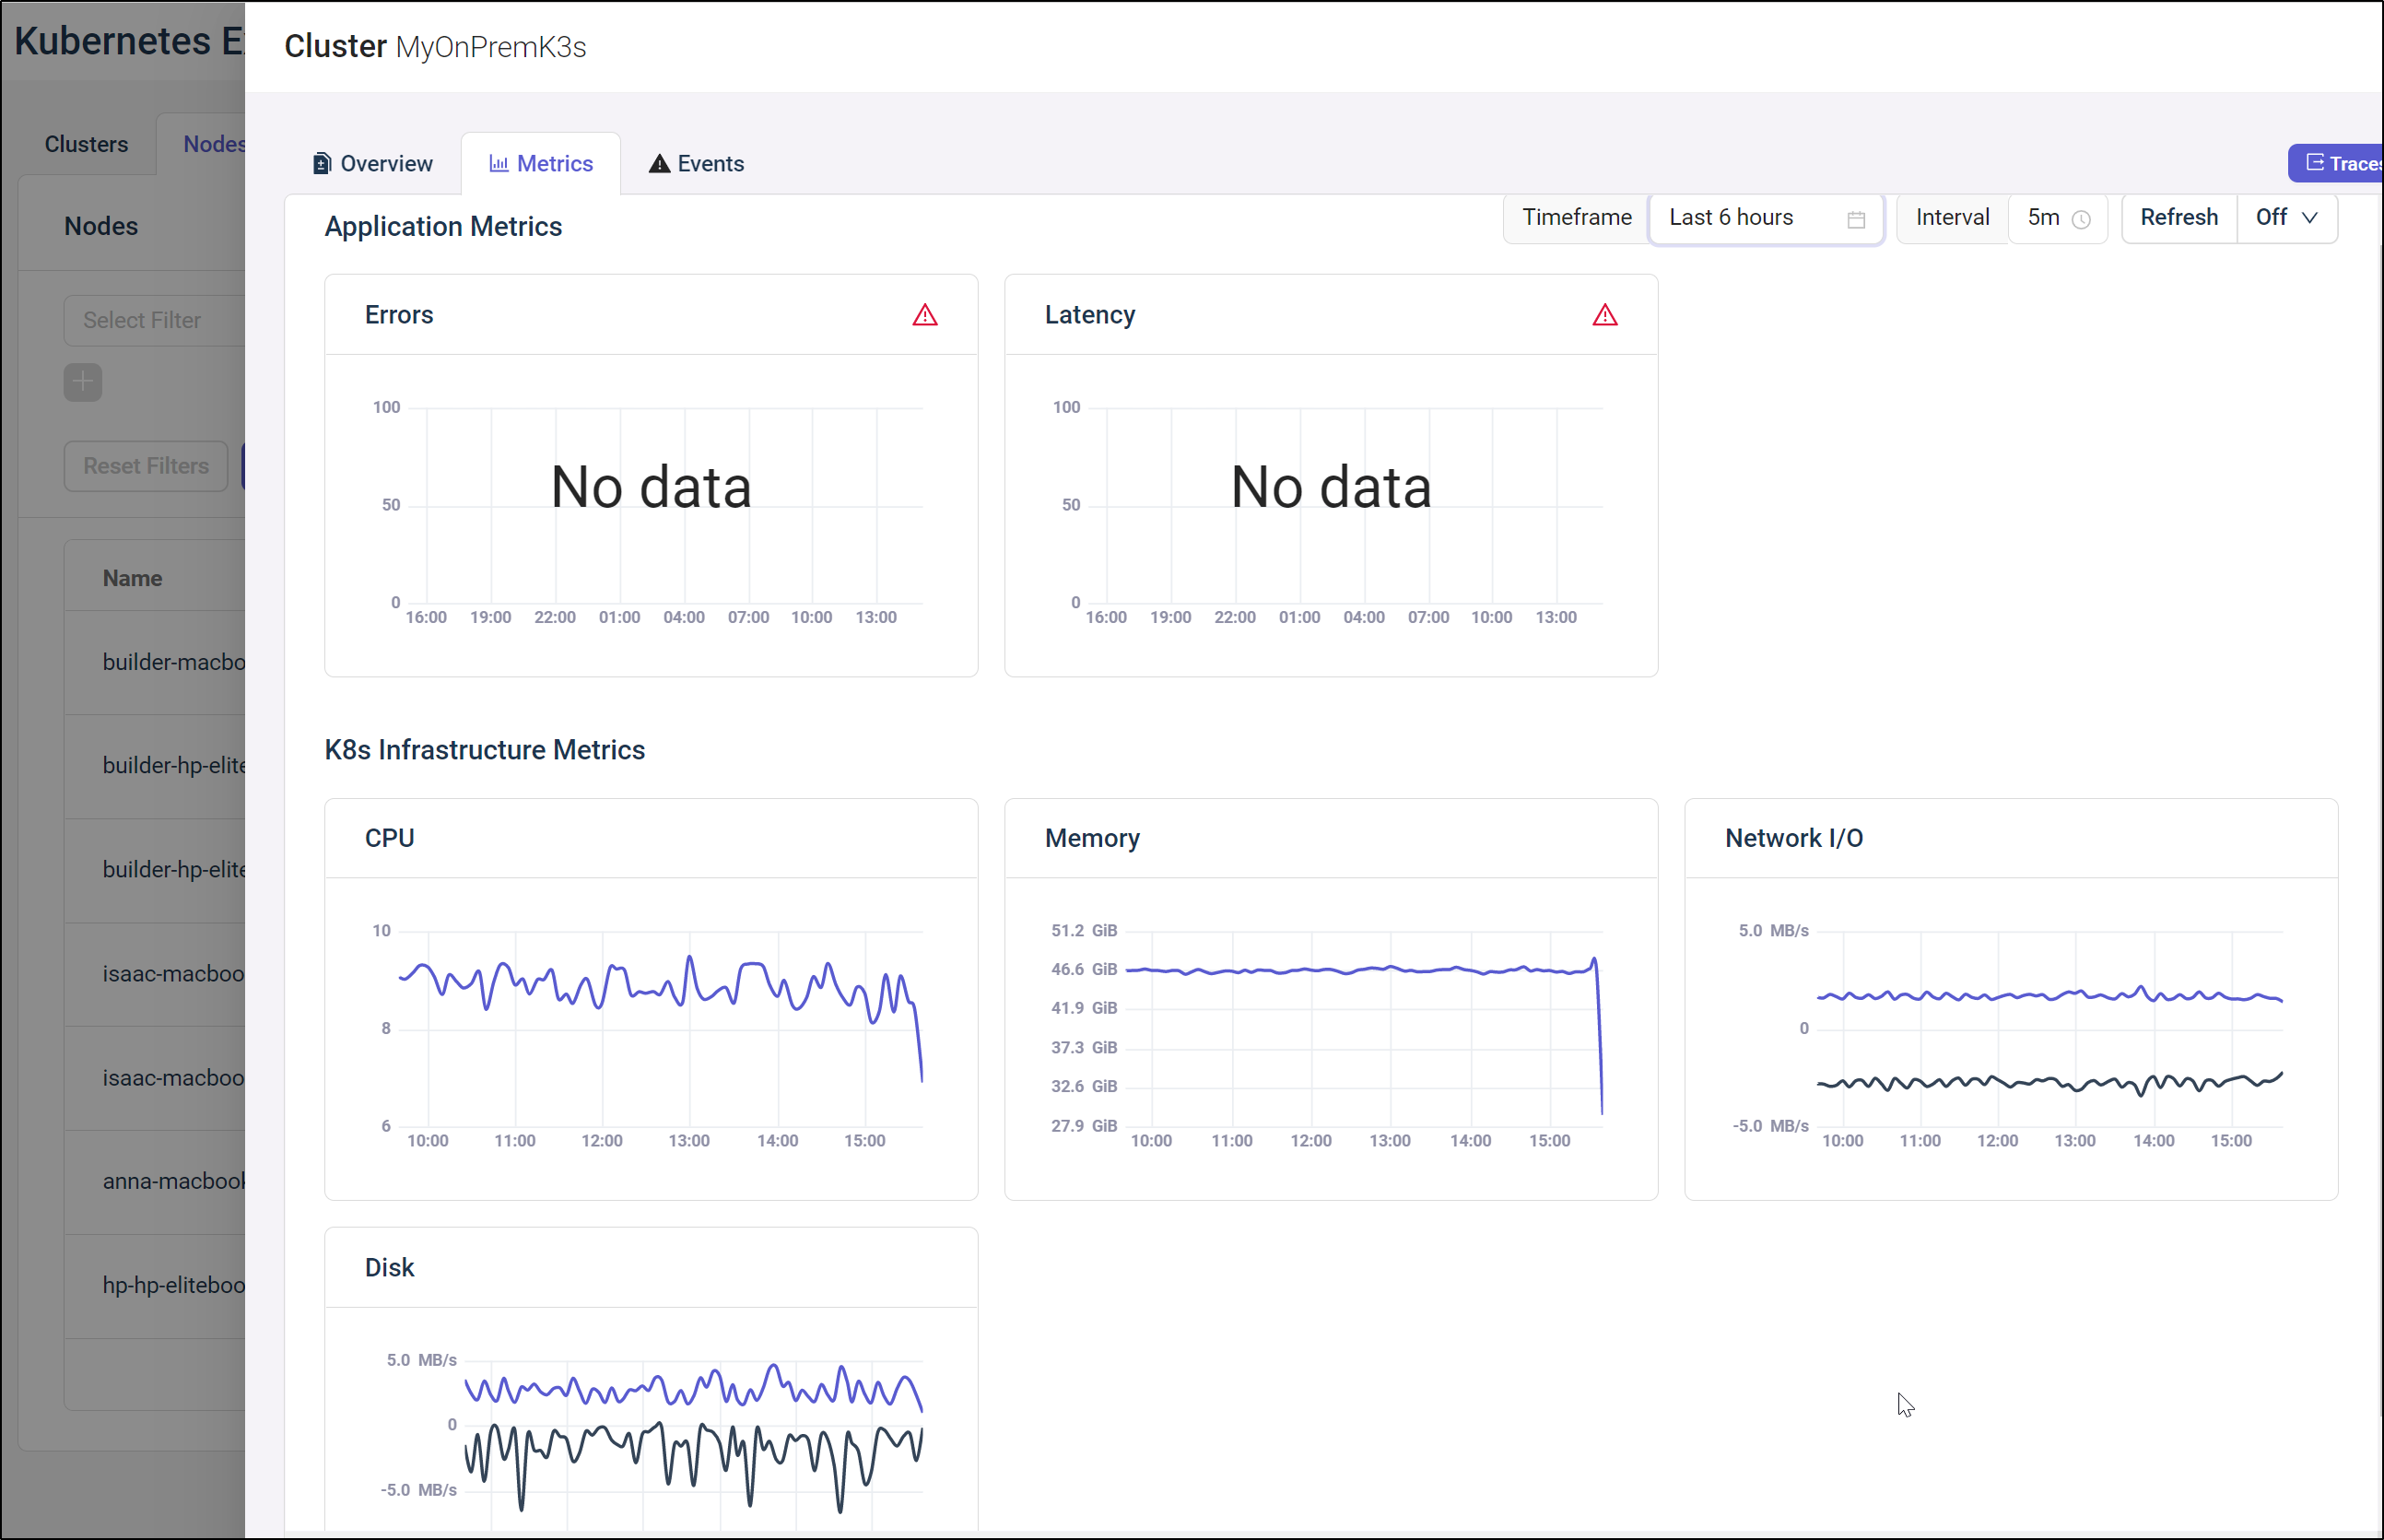
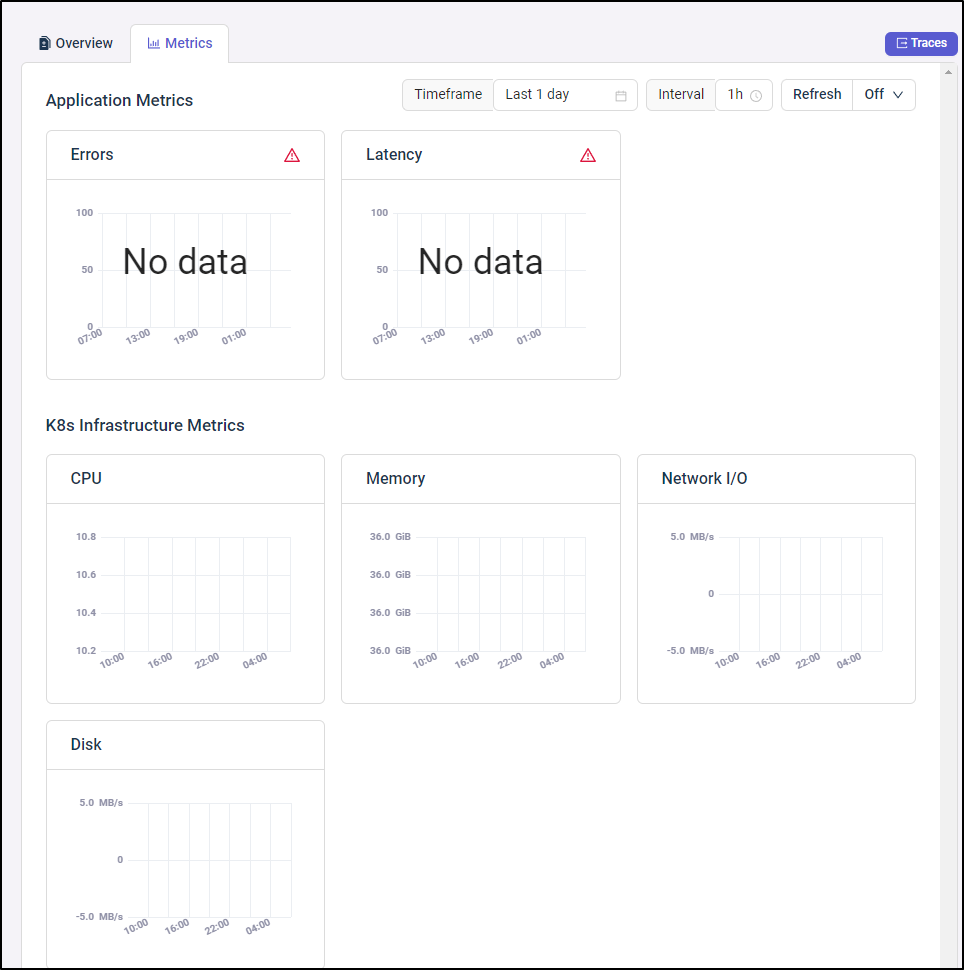
As I mentioned earlier, we would come back to the Kubernetes Cluster Metrics after some time had passed.
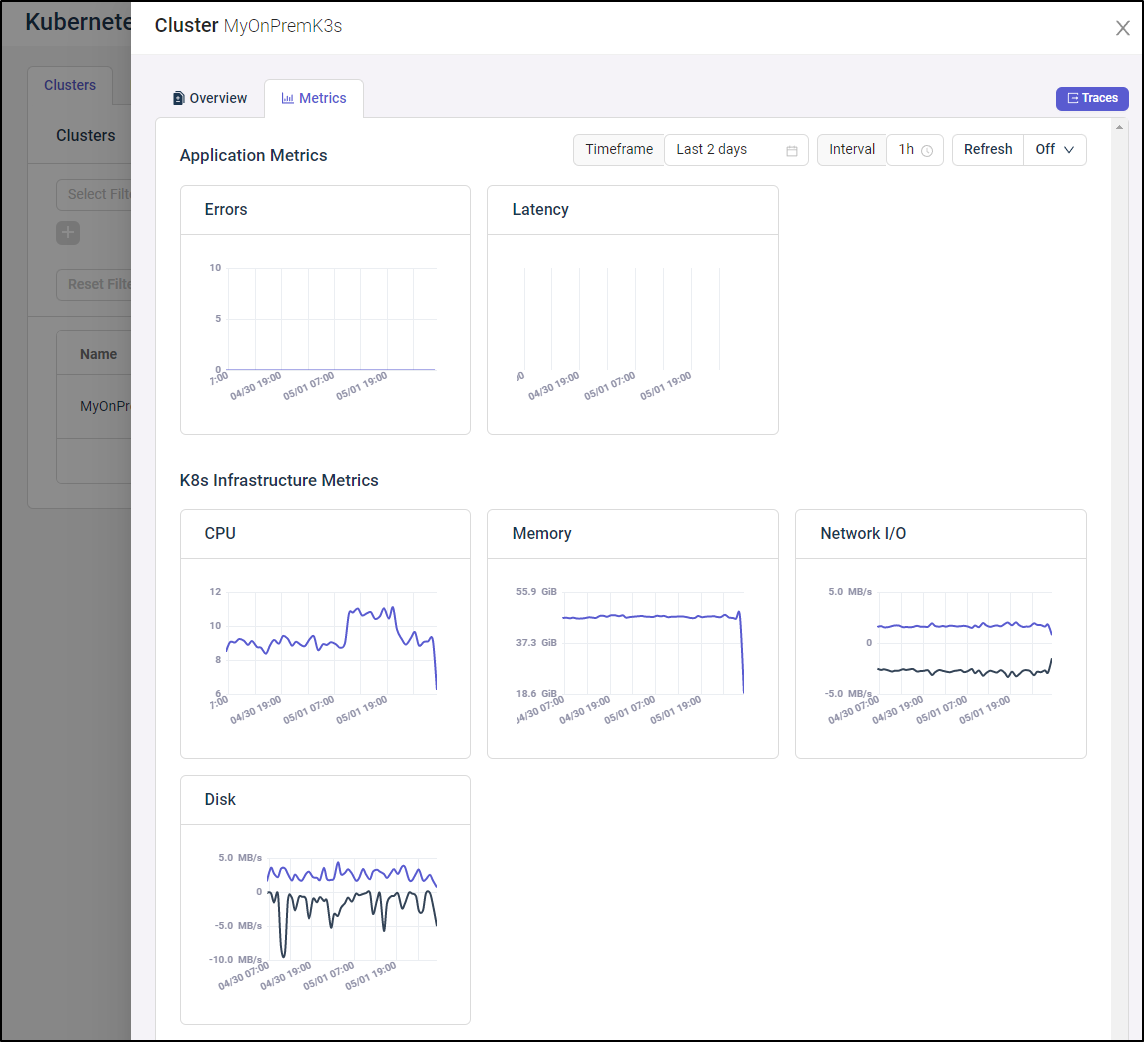
After several days, I came back and indeed, the CPU, Memory, Network and Disk metrcis were populated, as were the empty (but rightfully so) Application Metrics
Alerts
Let’s create an alert on the metrics we have collected so far
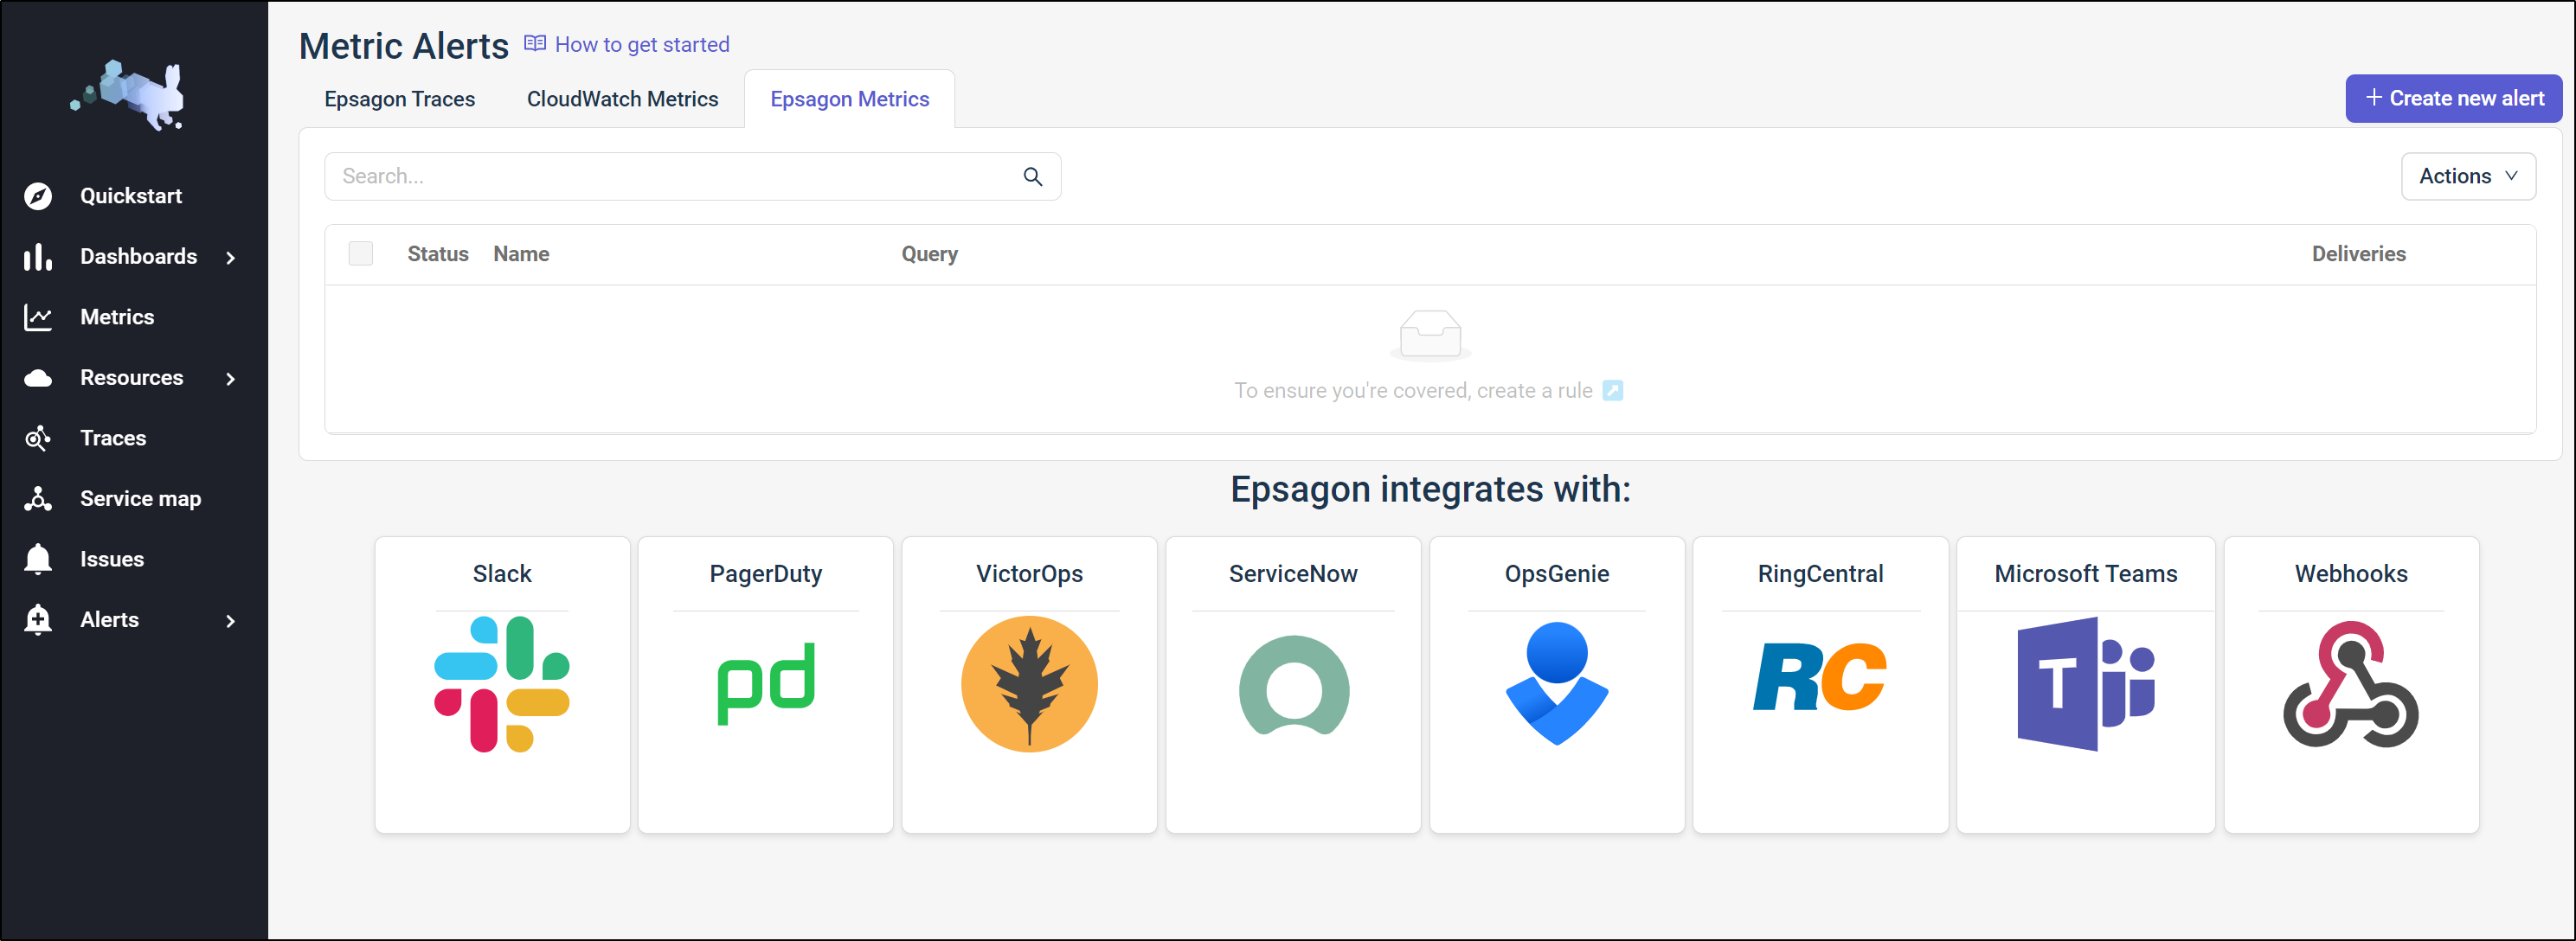
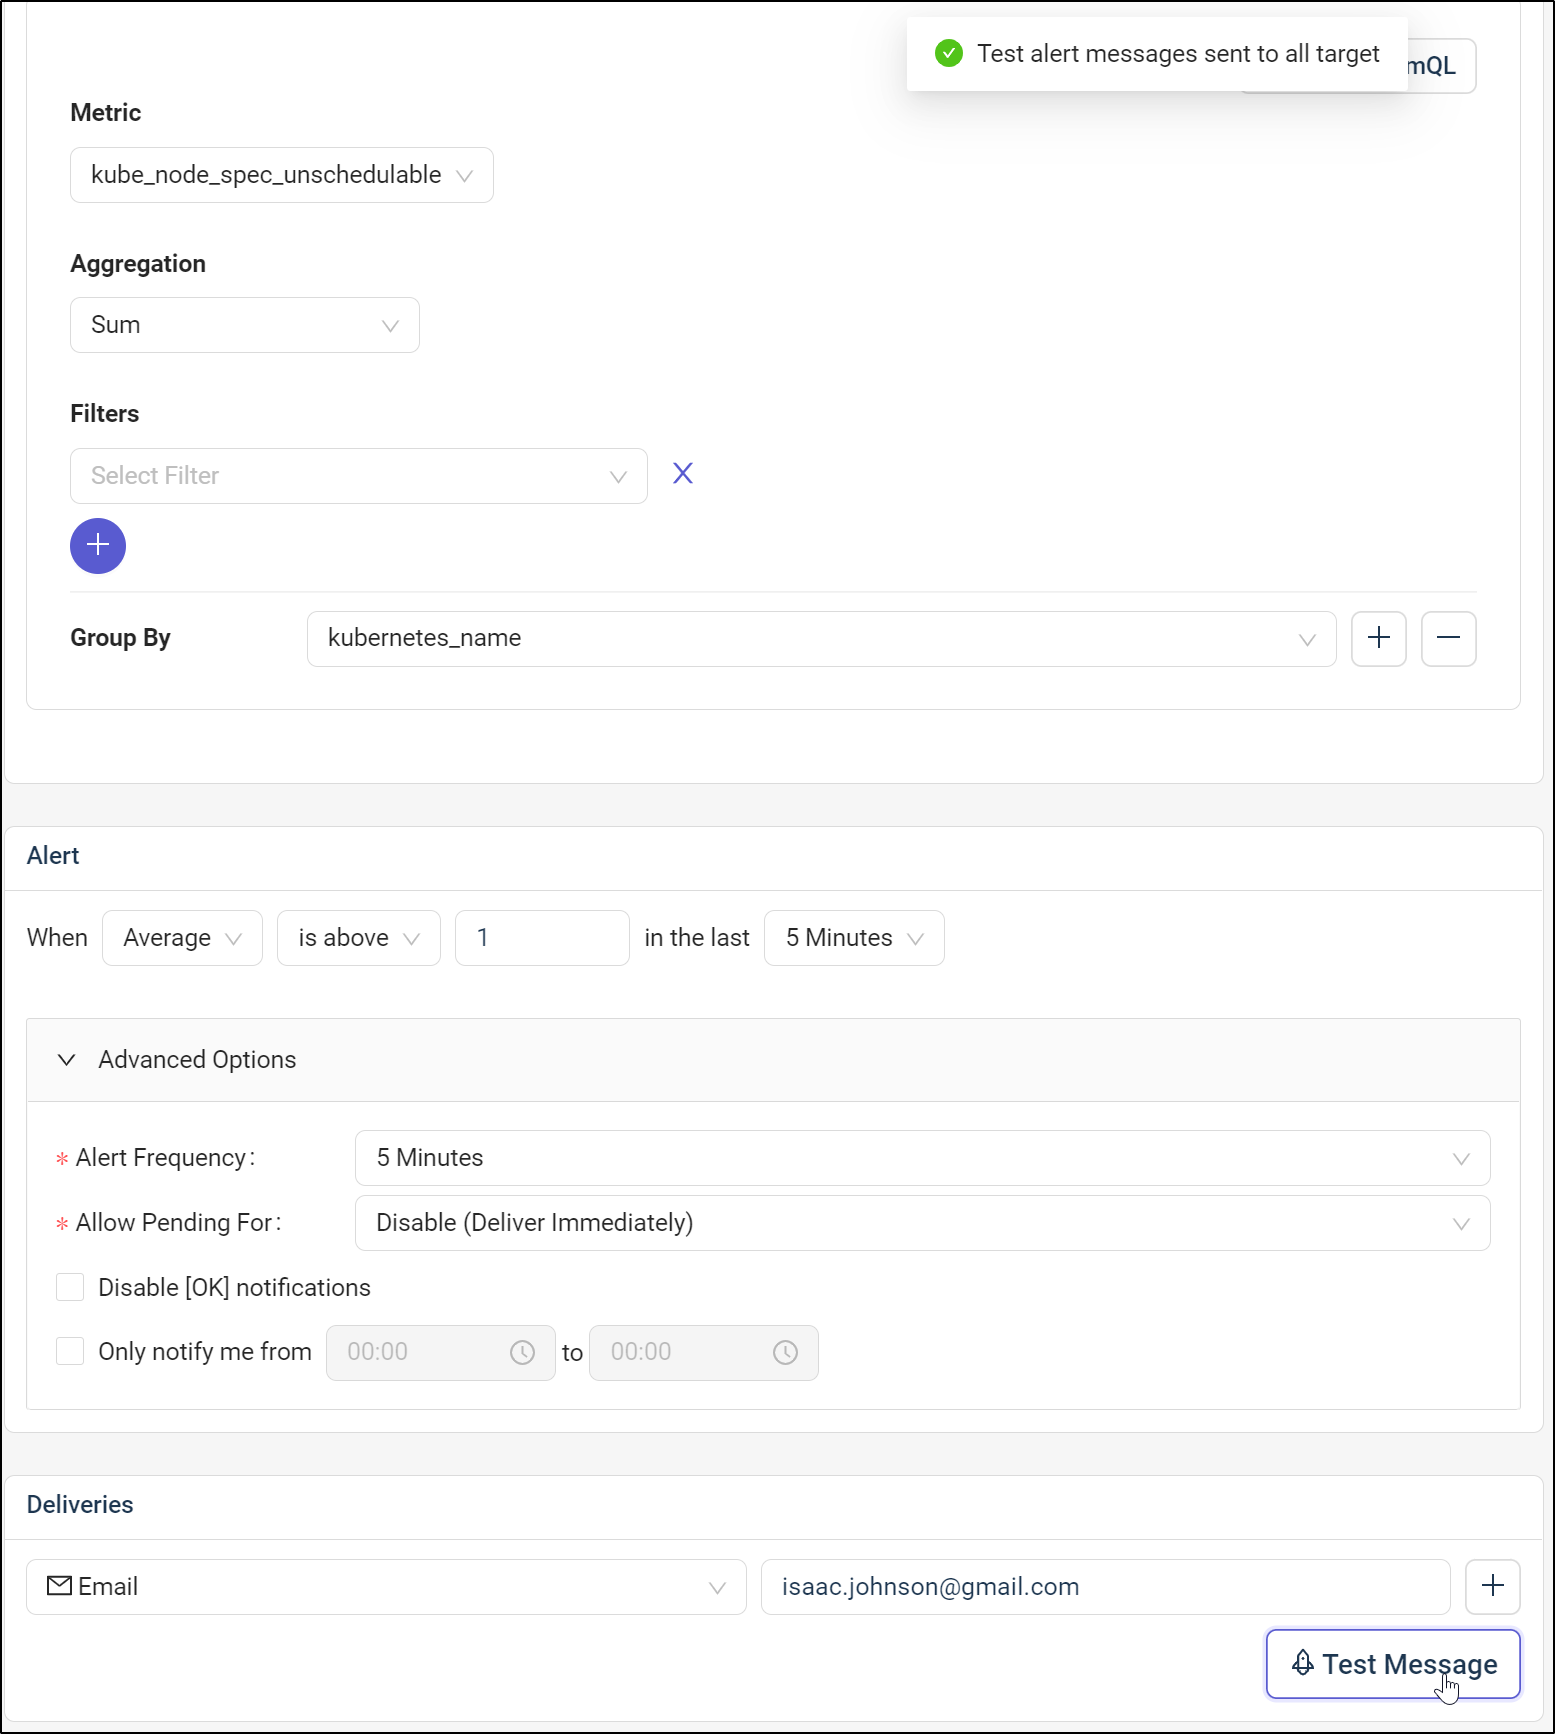
We’ll give it a name
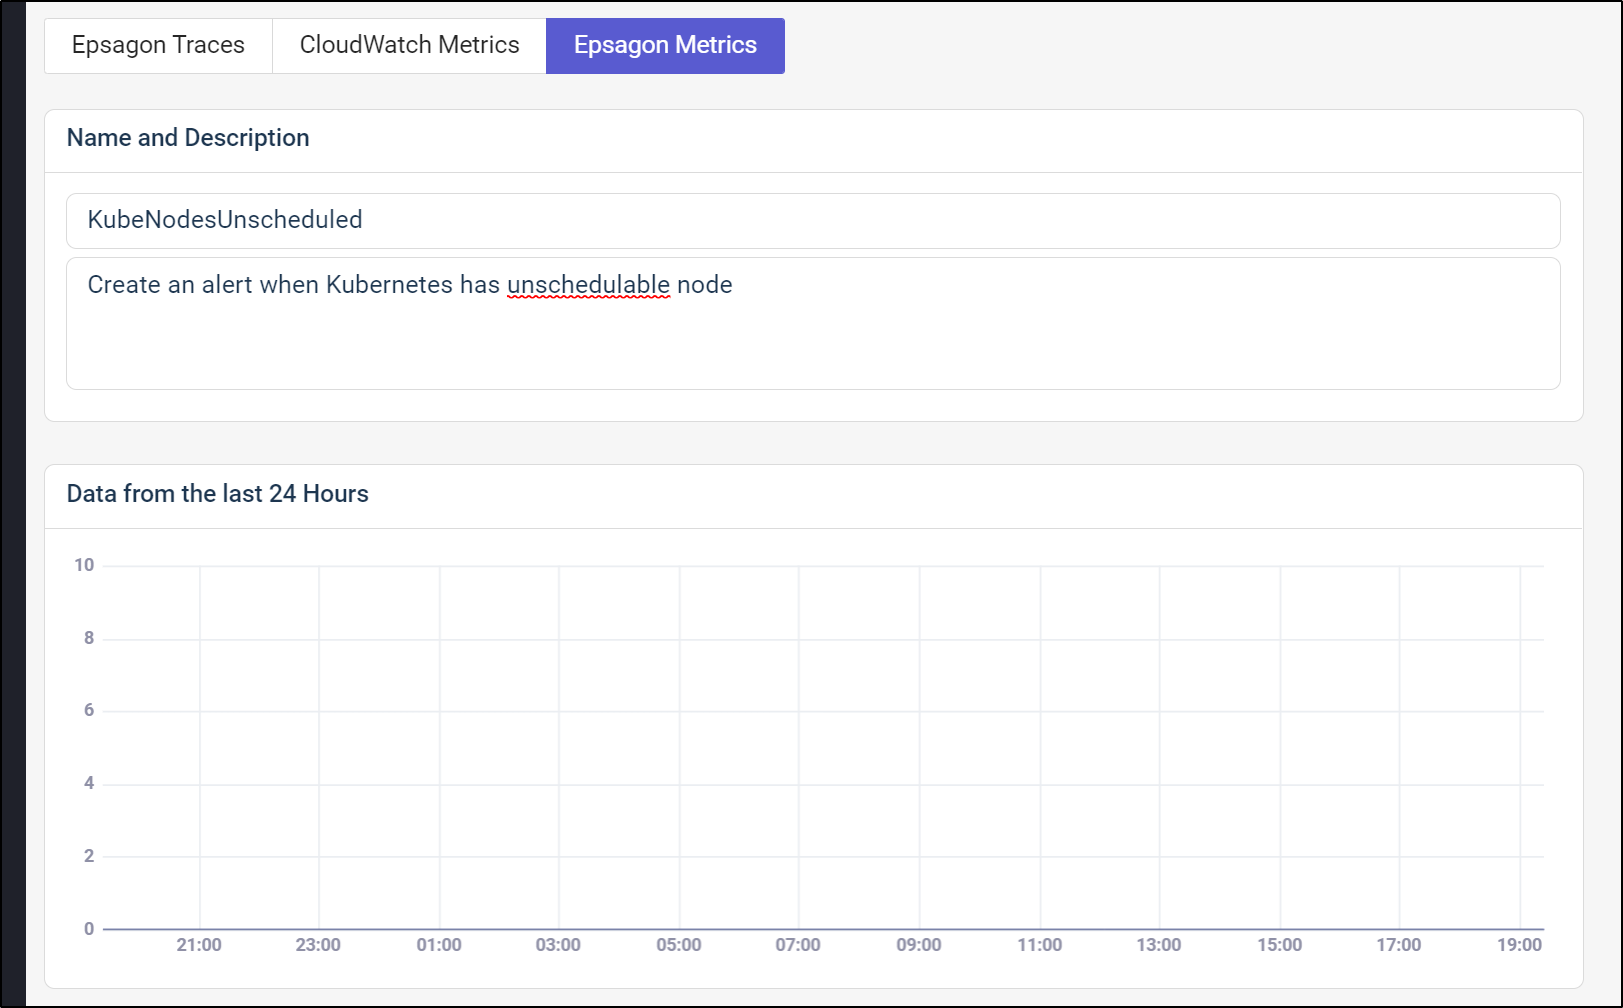
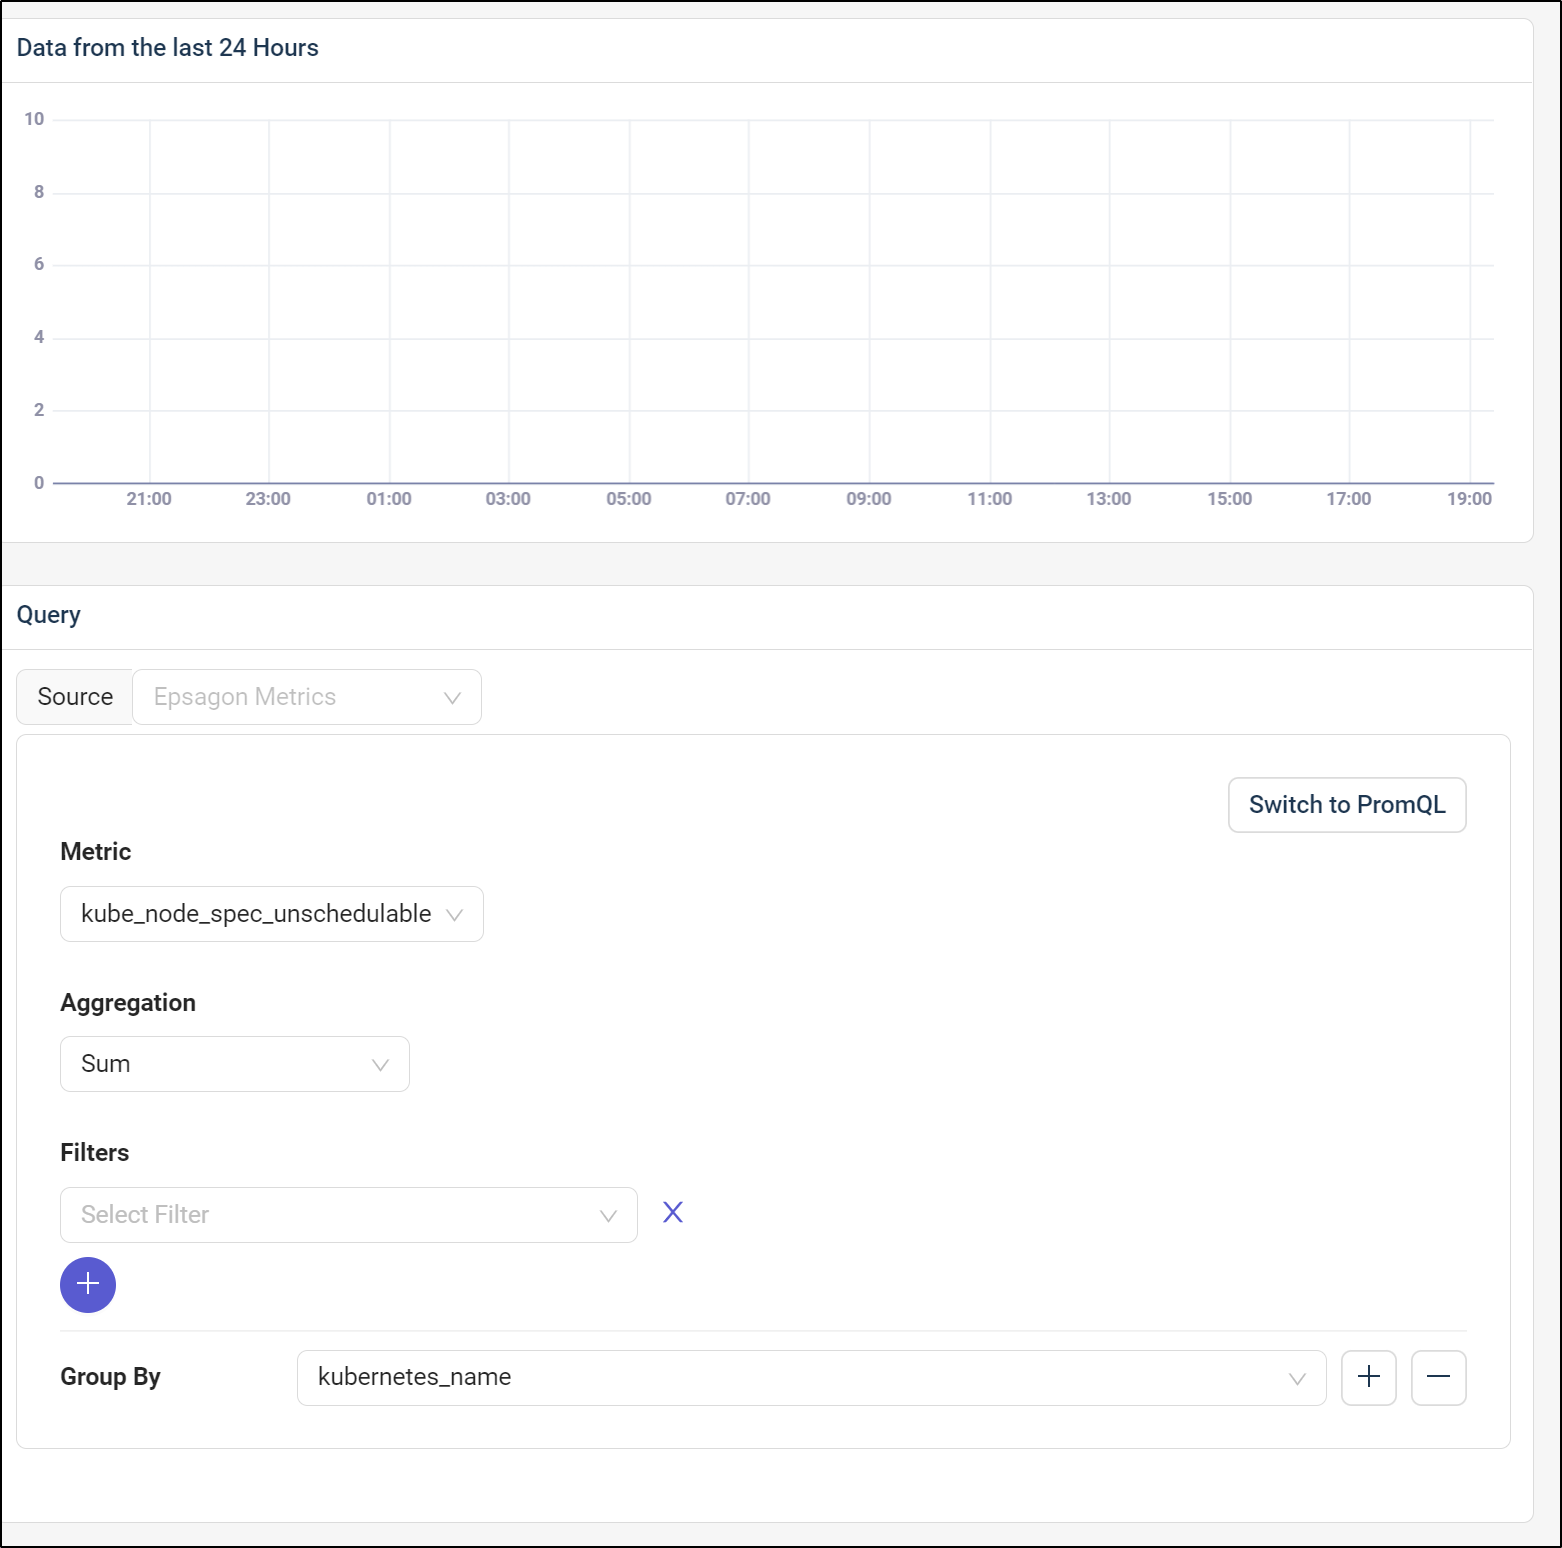
then we can use the kube_node_spec_unschedulable metric
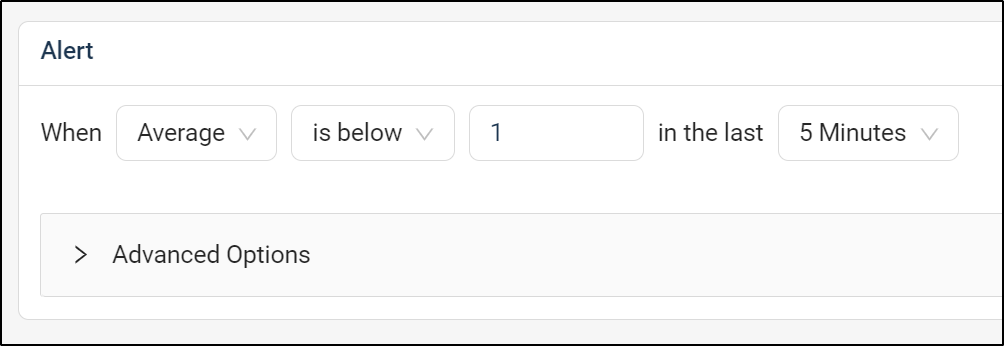
We can then define our alert frequency
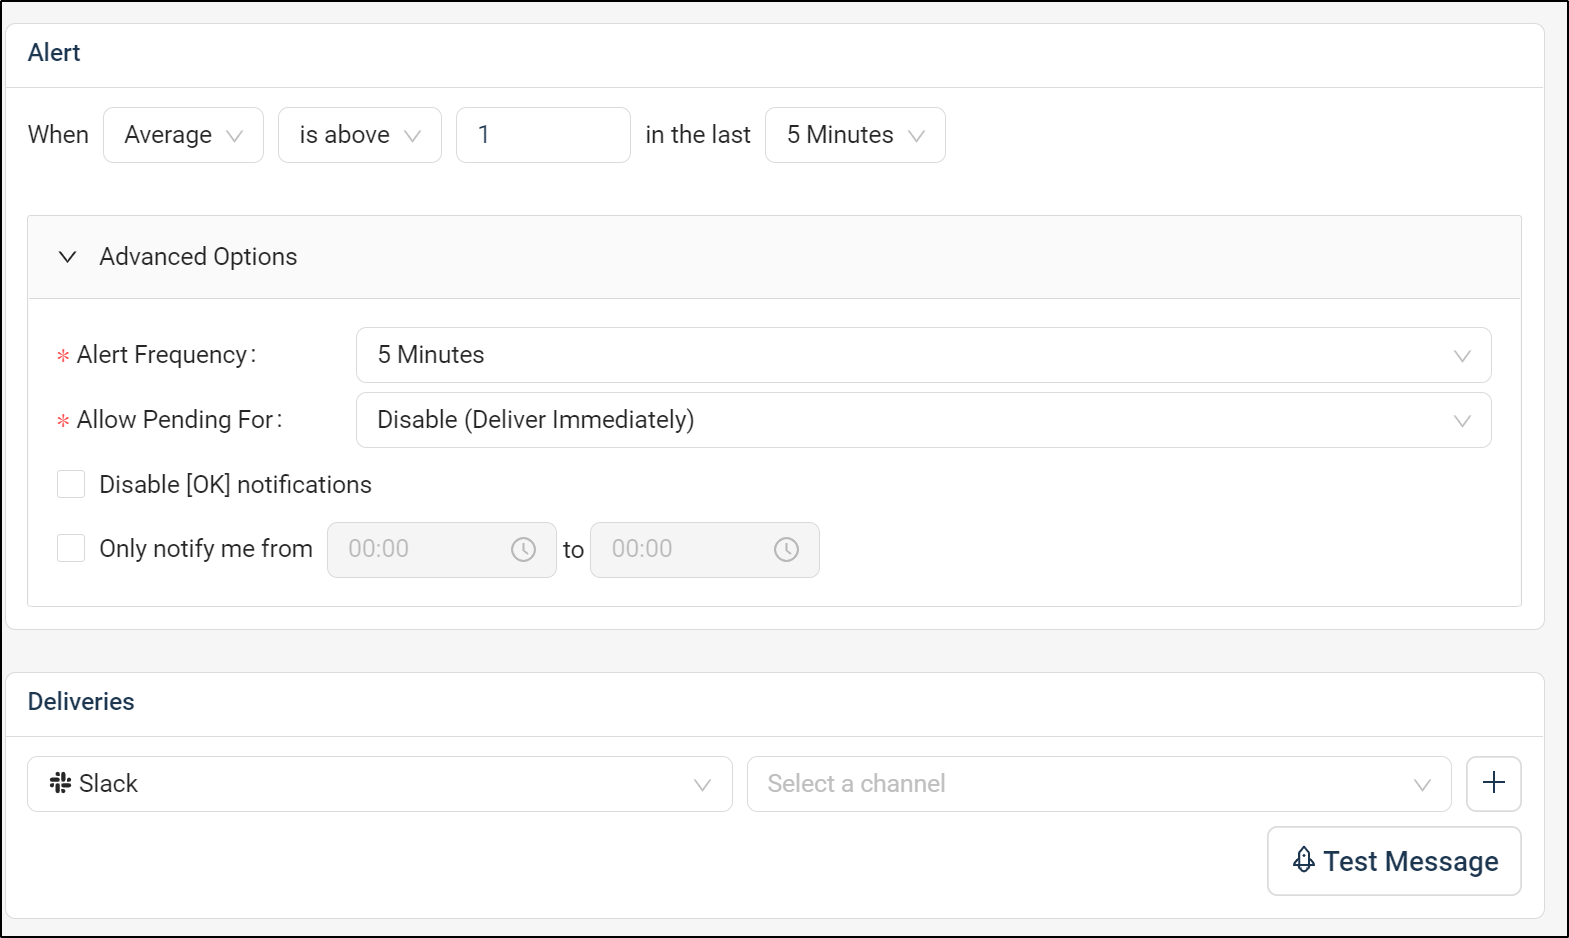
For ease, I’ll set an email target and click test to test it
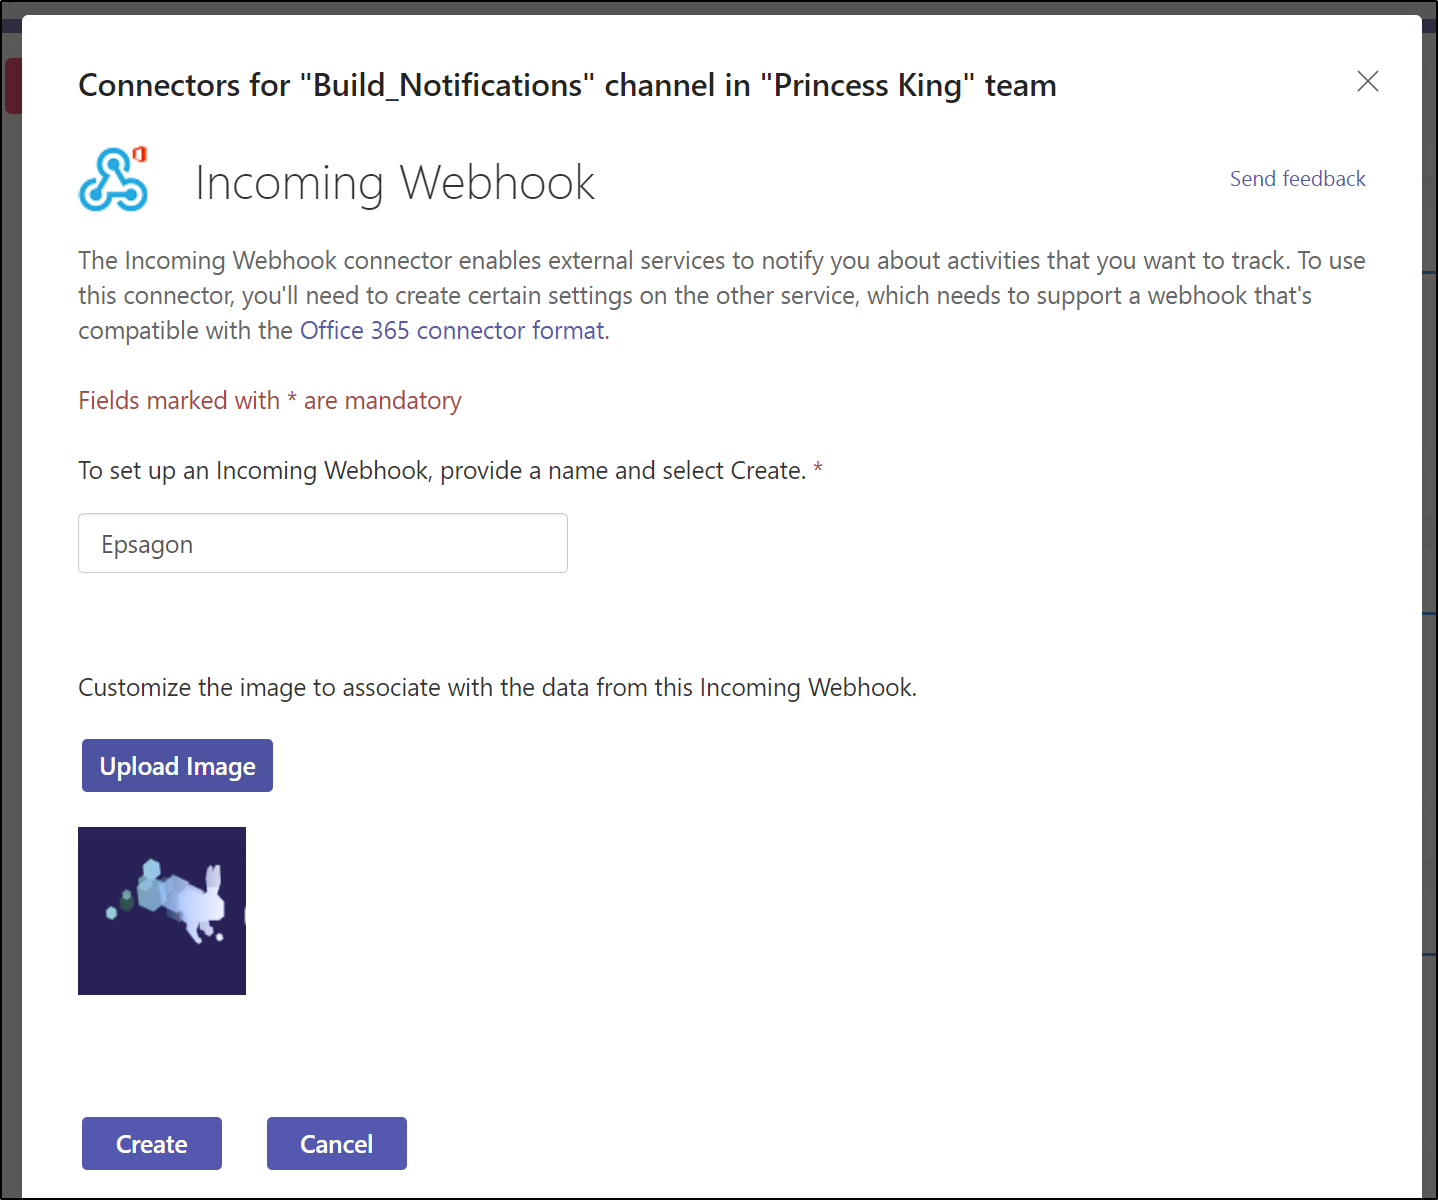
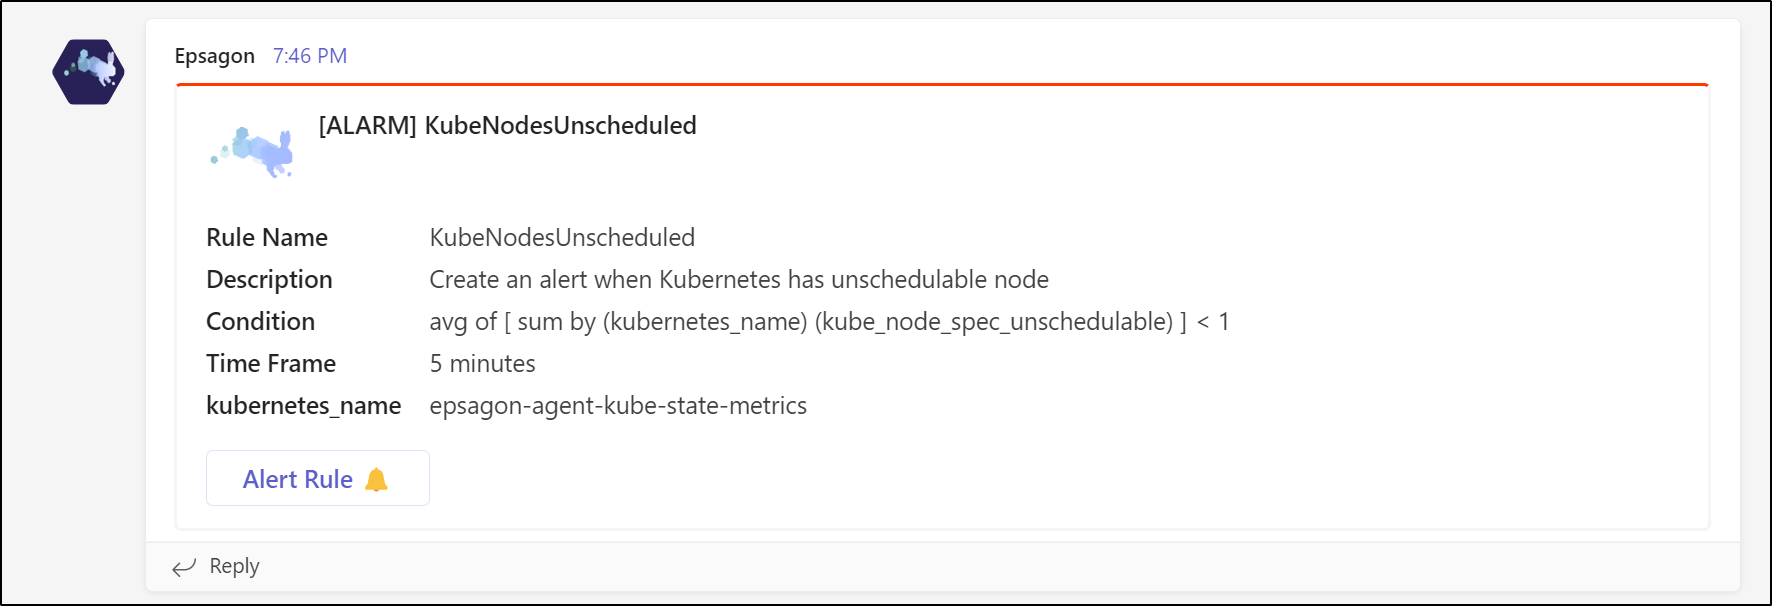
since that didn’t come in, I decided to set up a Teams webhook
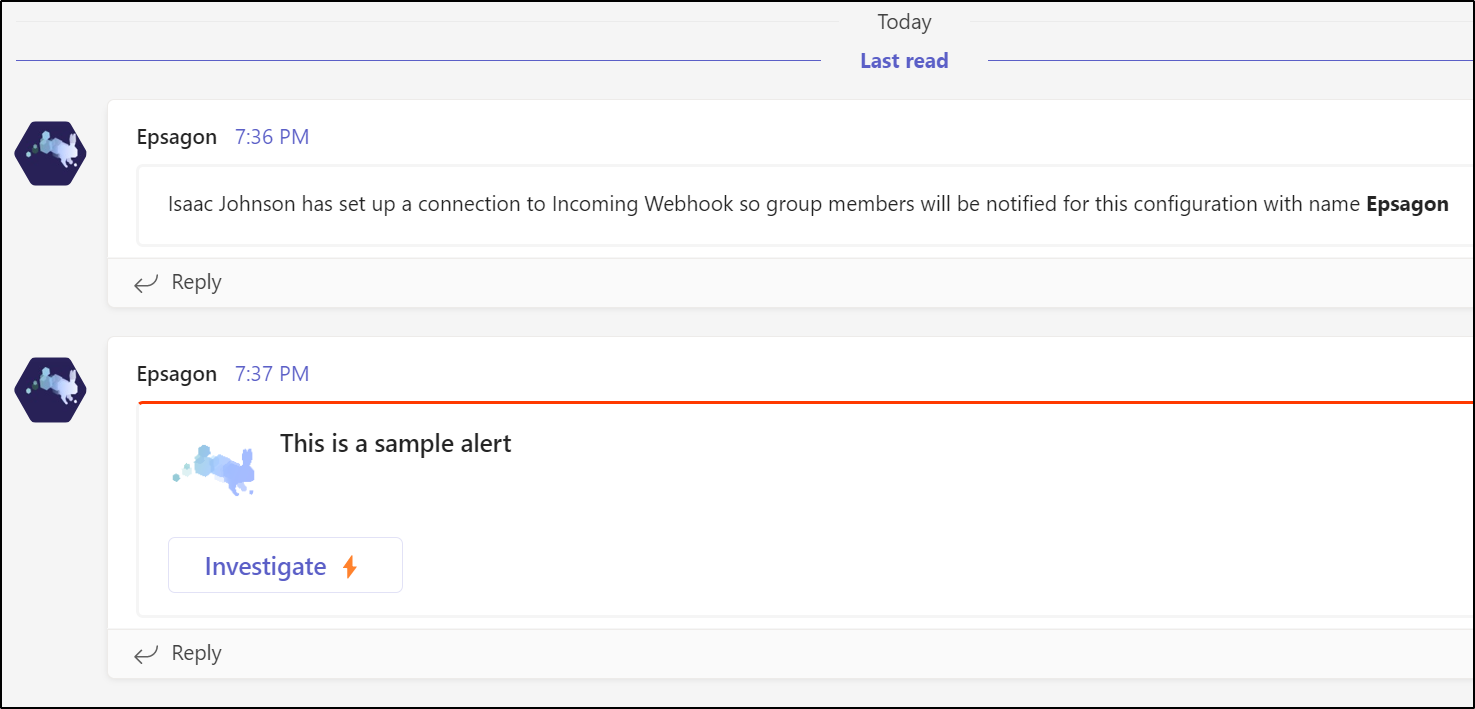
We can test it in the notifications
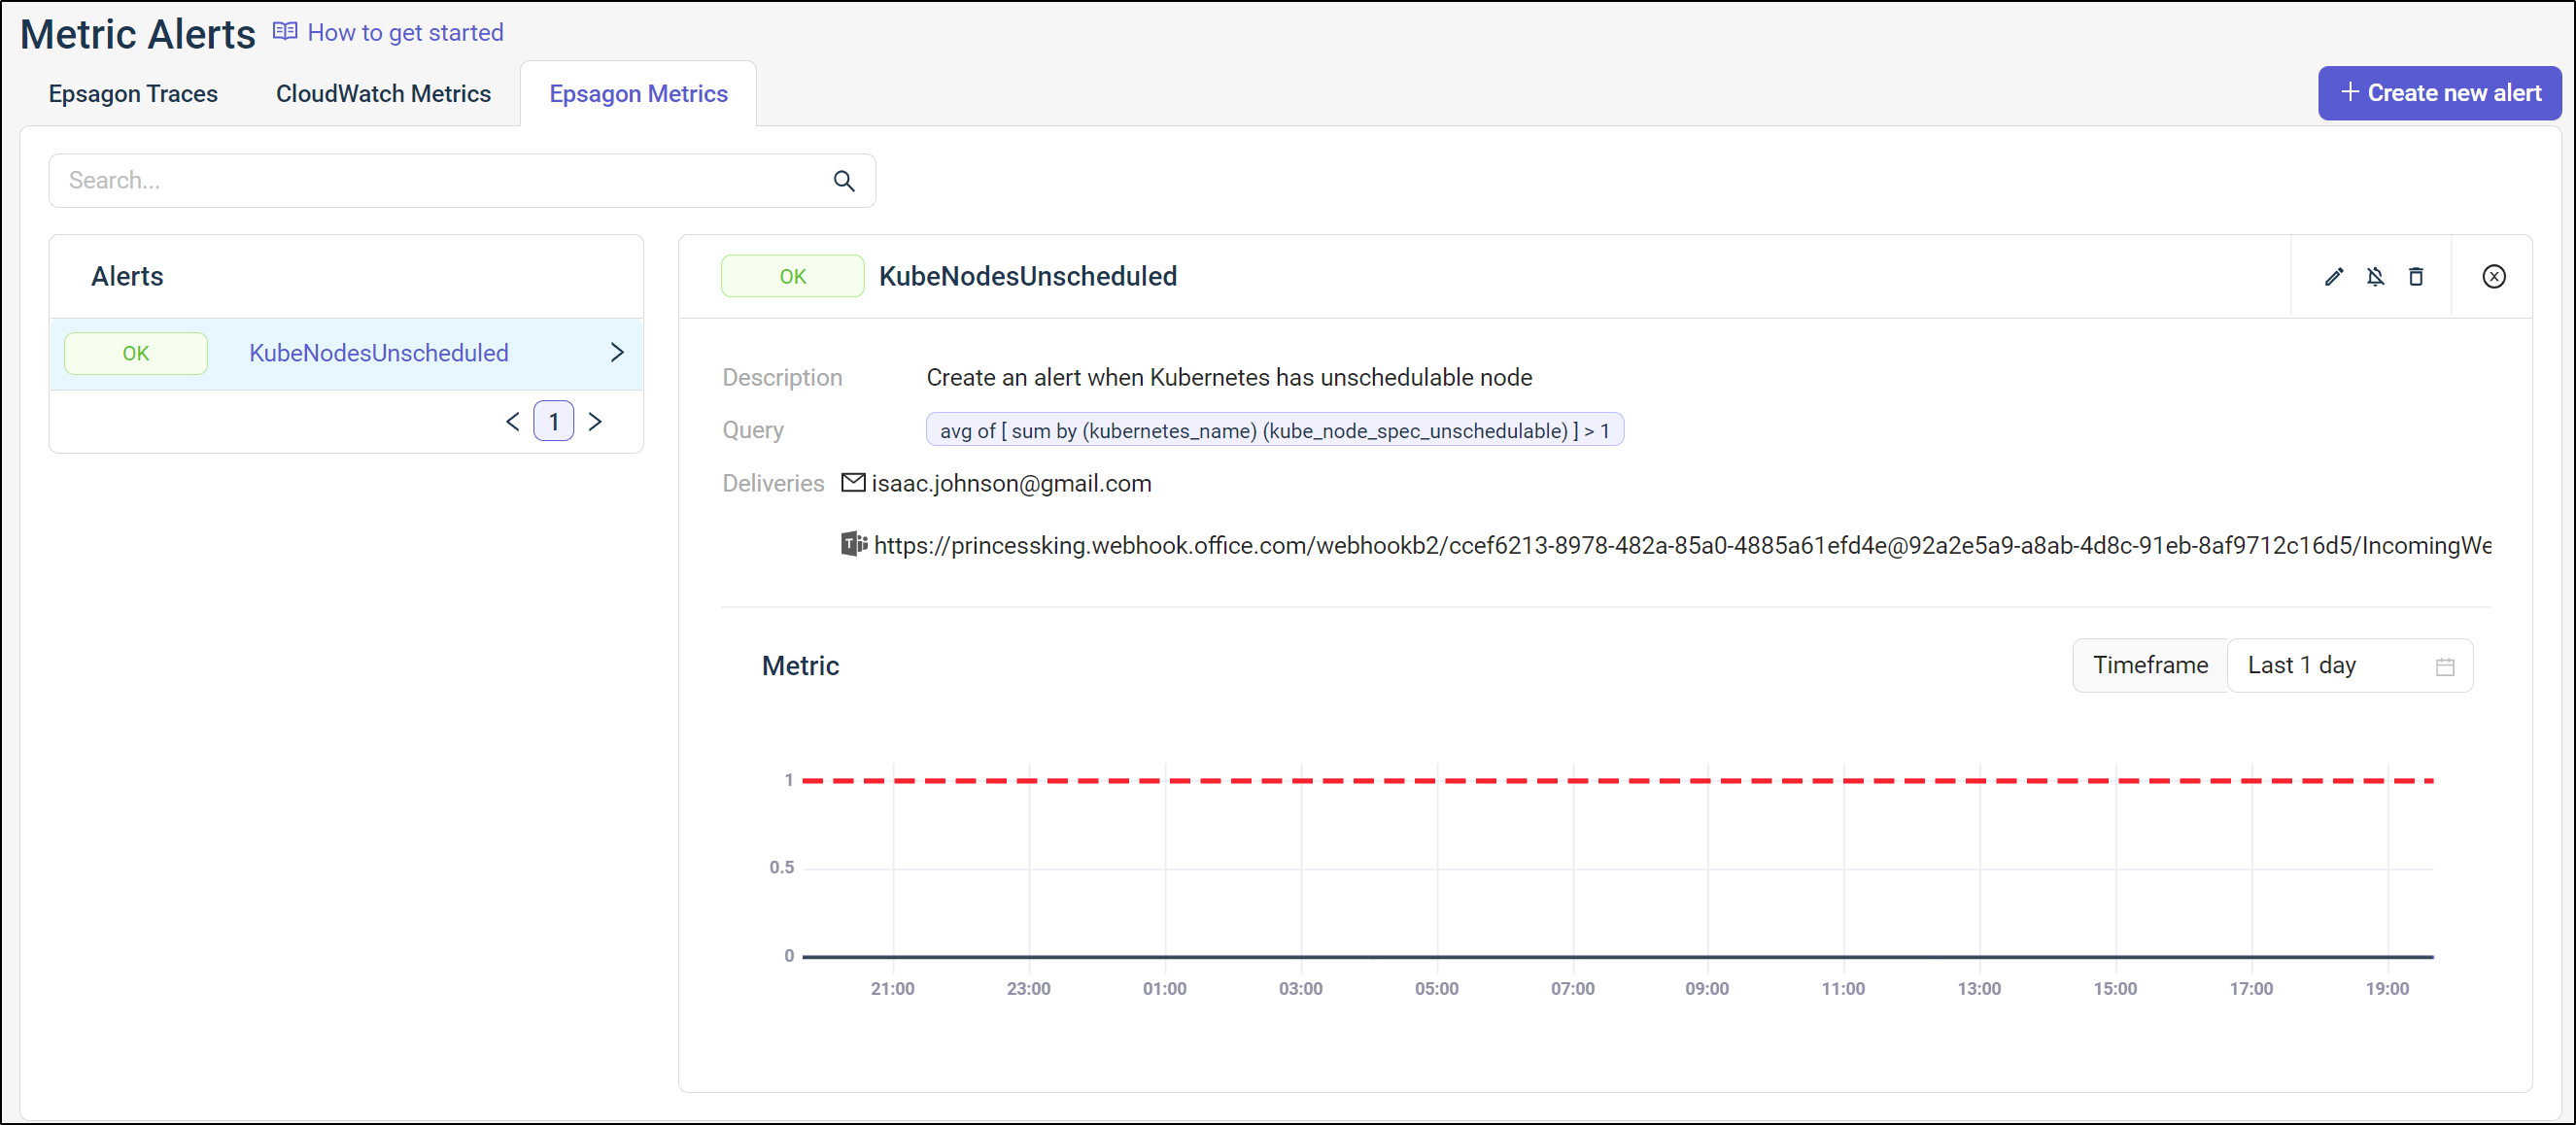
Once saved, we can see it in the listed
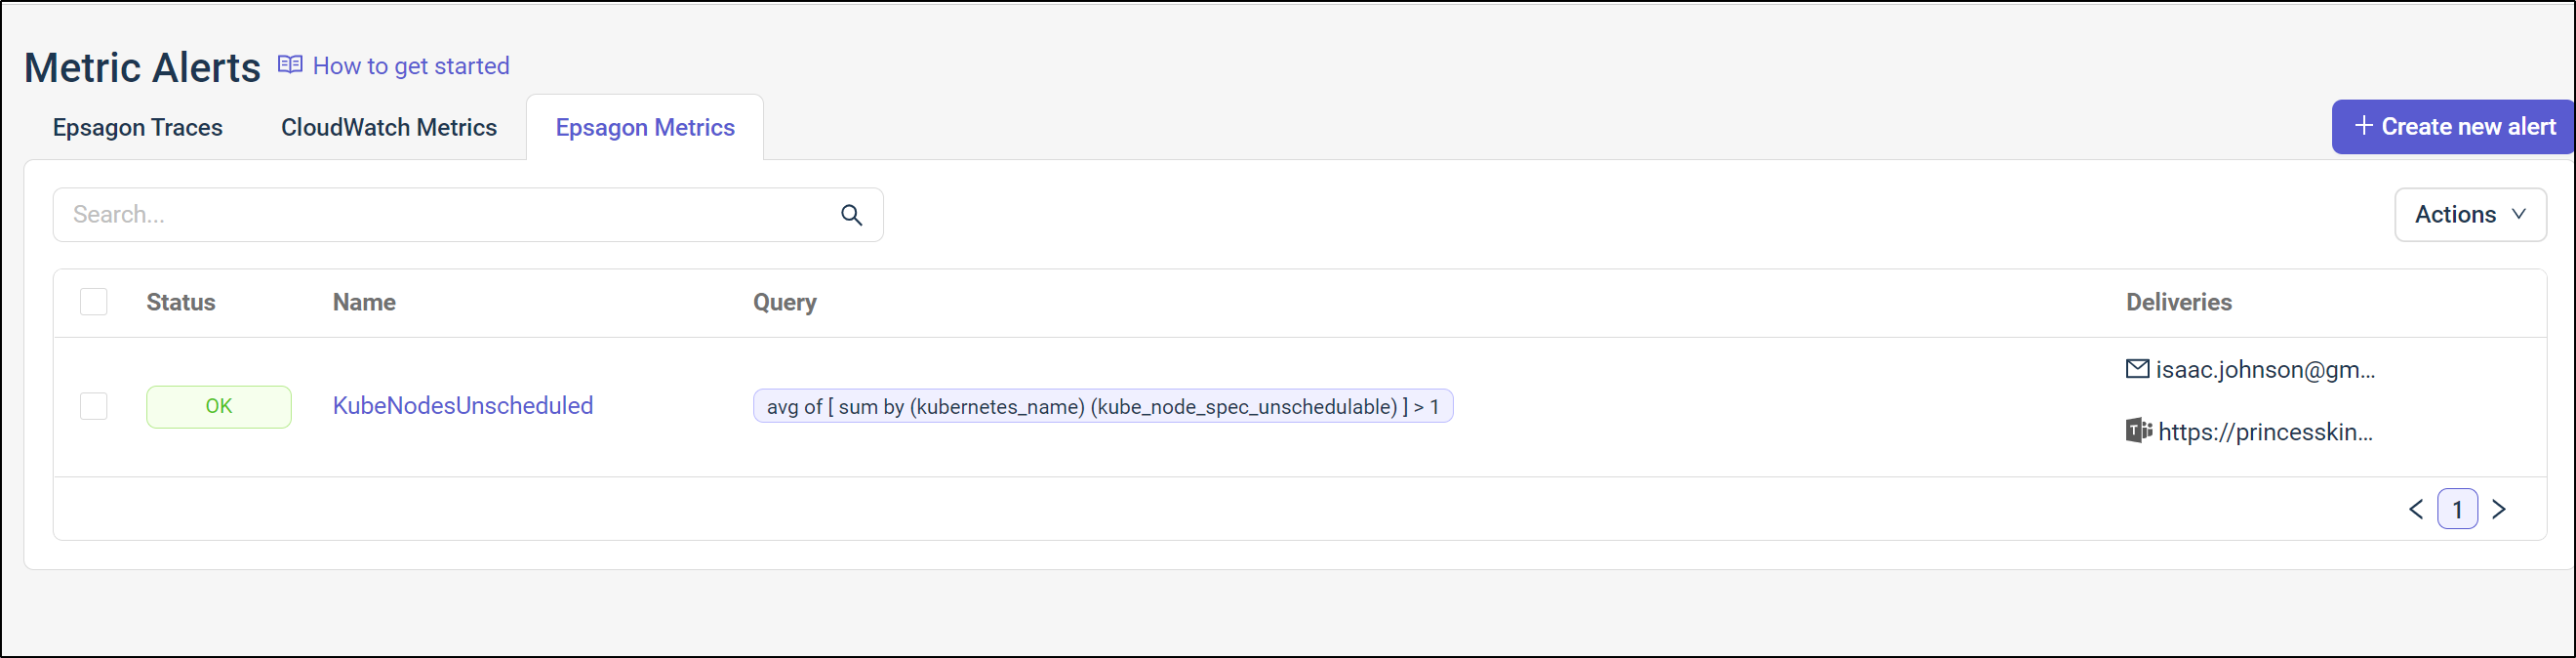
And we can see details
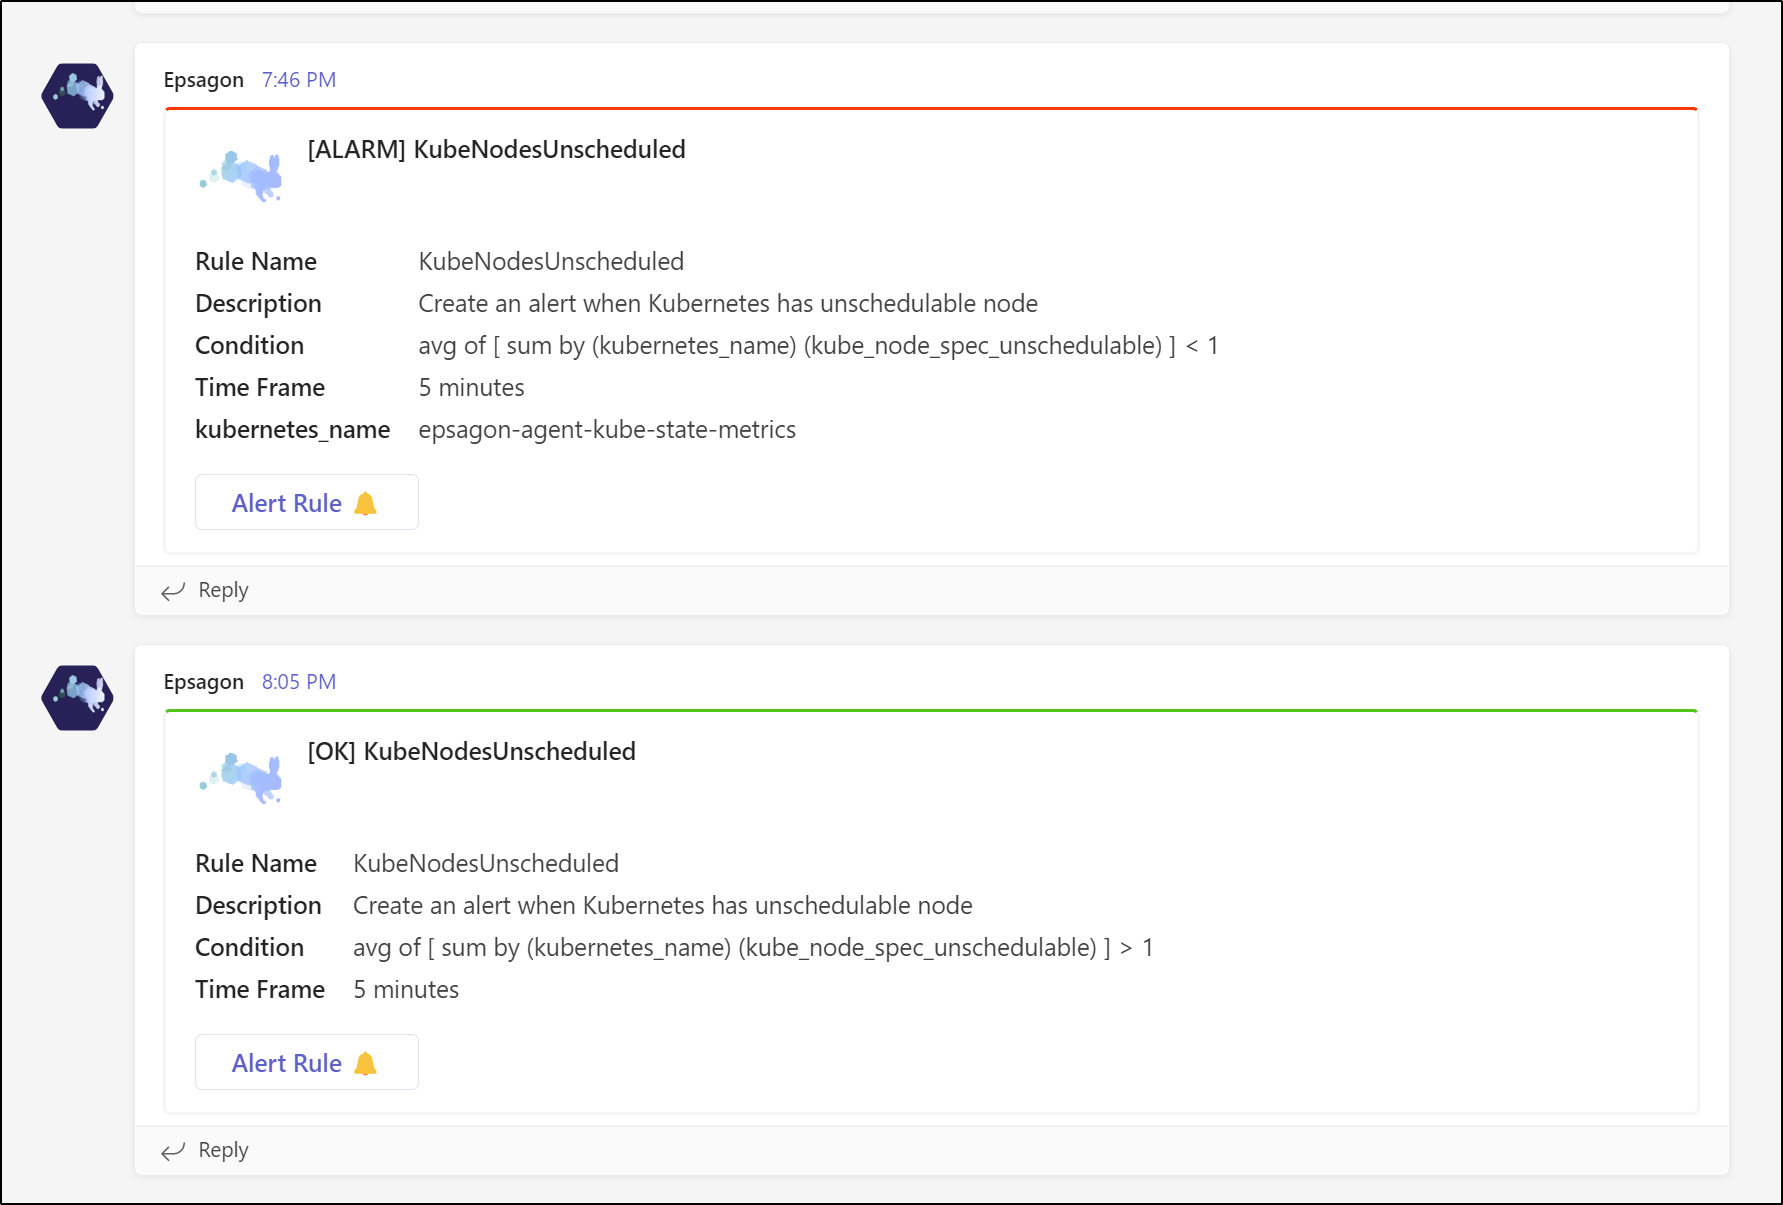
To test it in action, I’ll change the check to force a fail by looking for less than 1 unschedulable
And we can now see the triggered alert
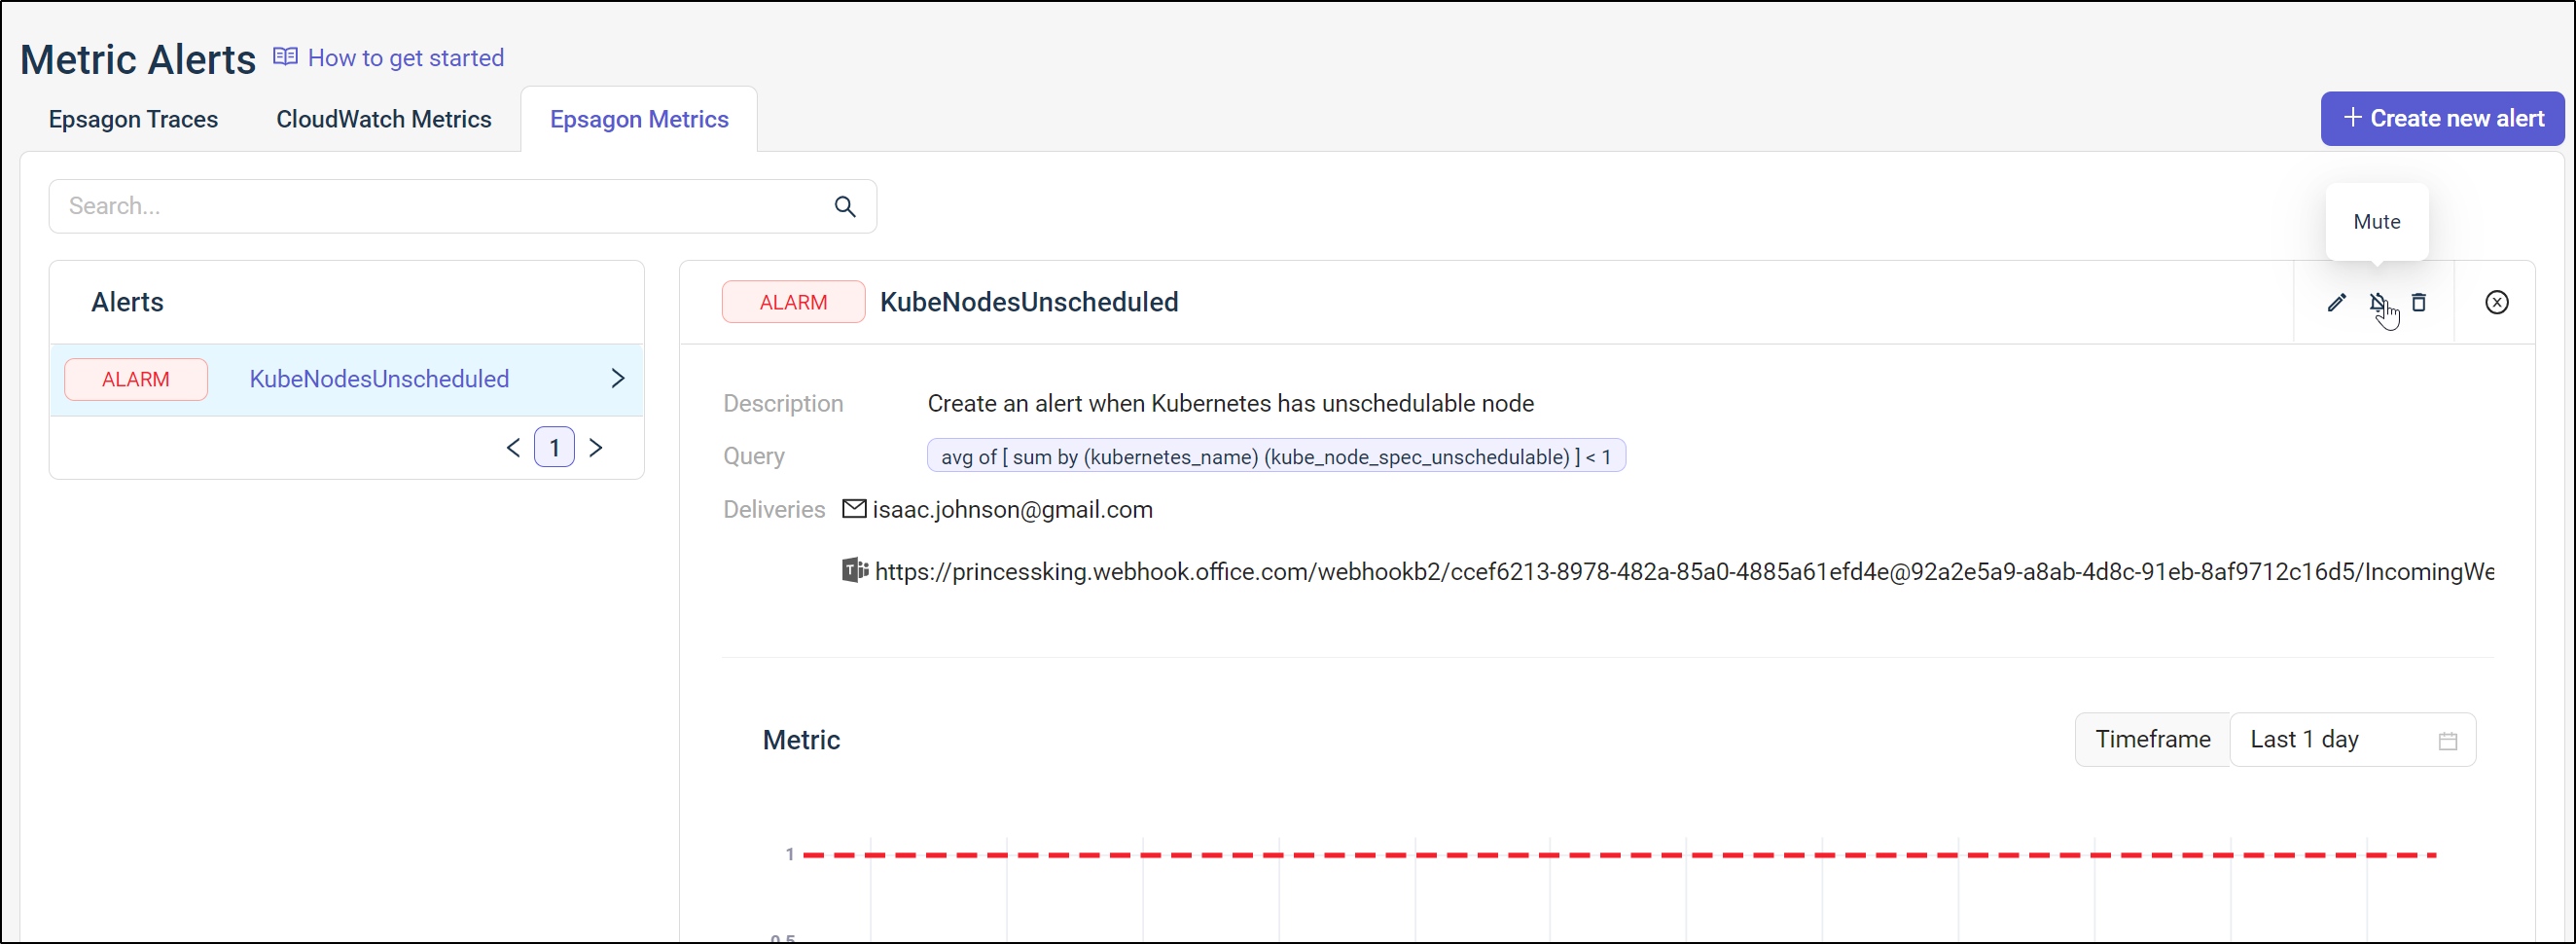
We can both see the alert is in an alarm state now but also we can mute it here as well
I then updated the alert to be what it should be (a condition of unschedulable above 1 for over 5min)
And soon we see the alert move to a good state
Instrumenting
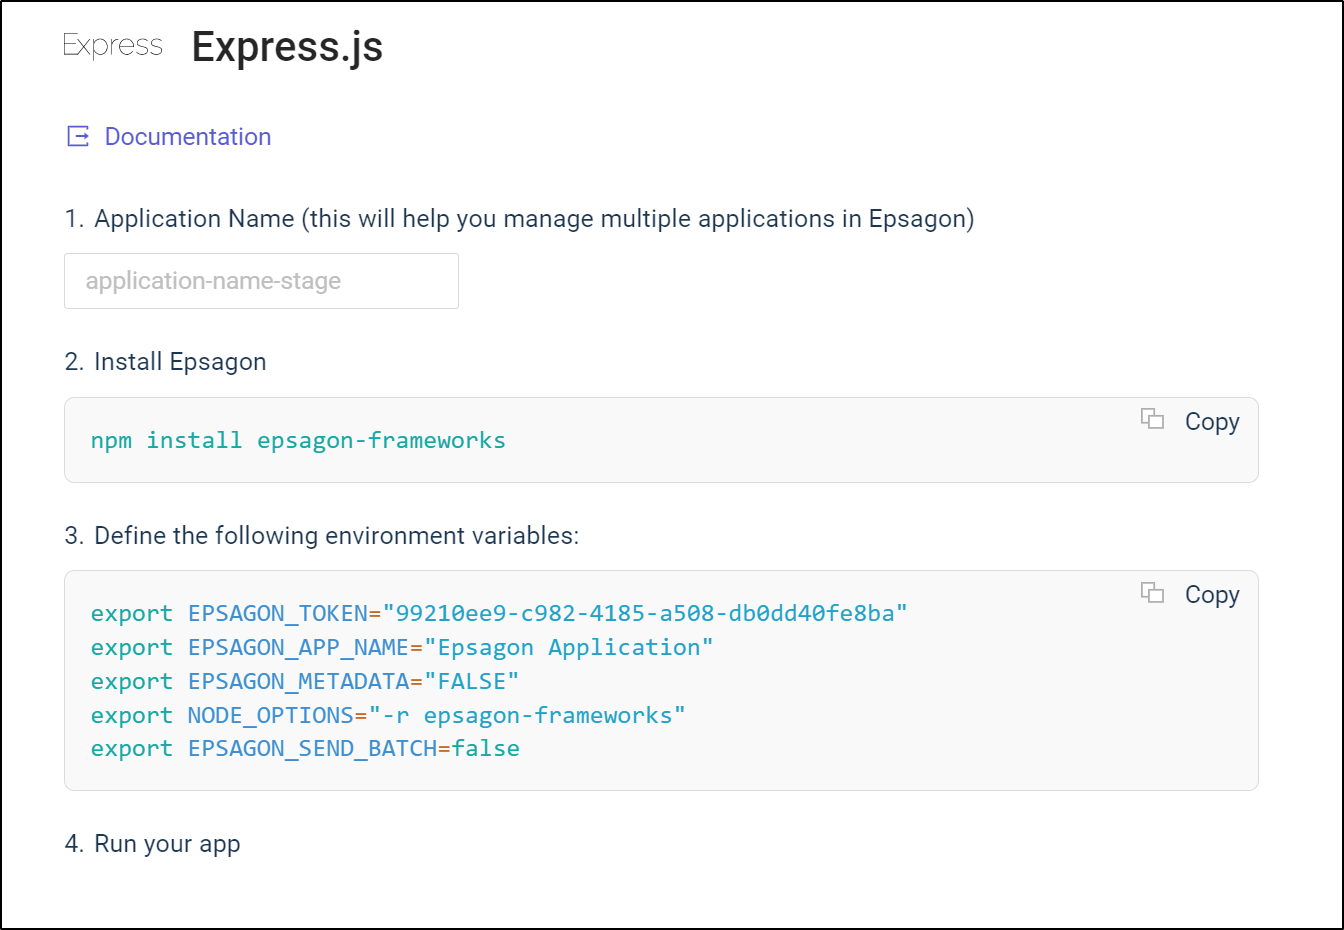
Let’s create an app and instrument it. Since we are using Express in Node.JS, let’s pick that
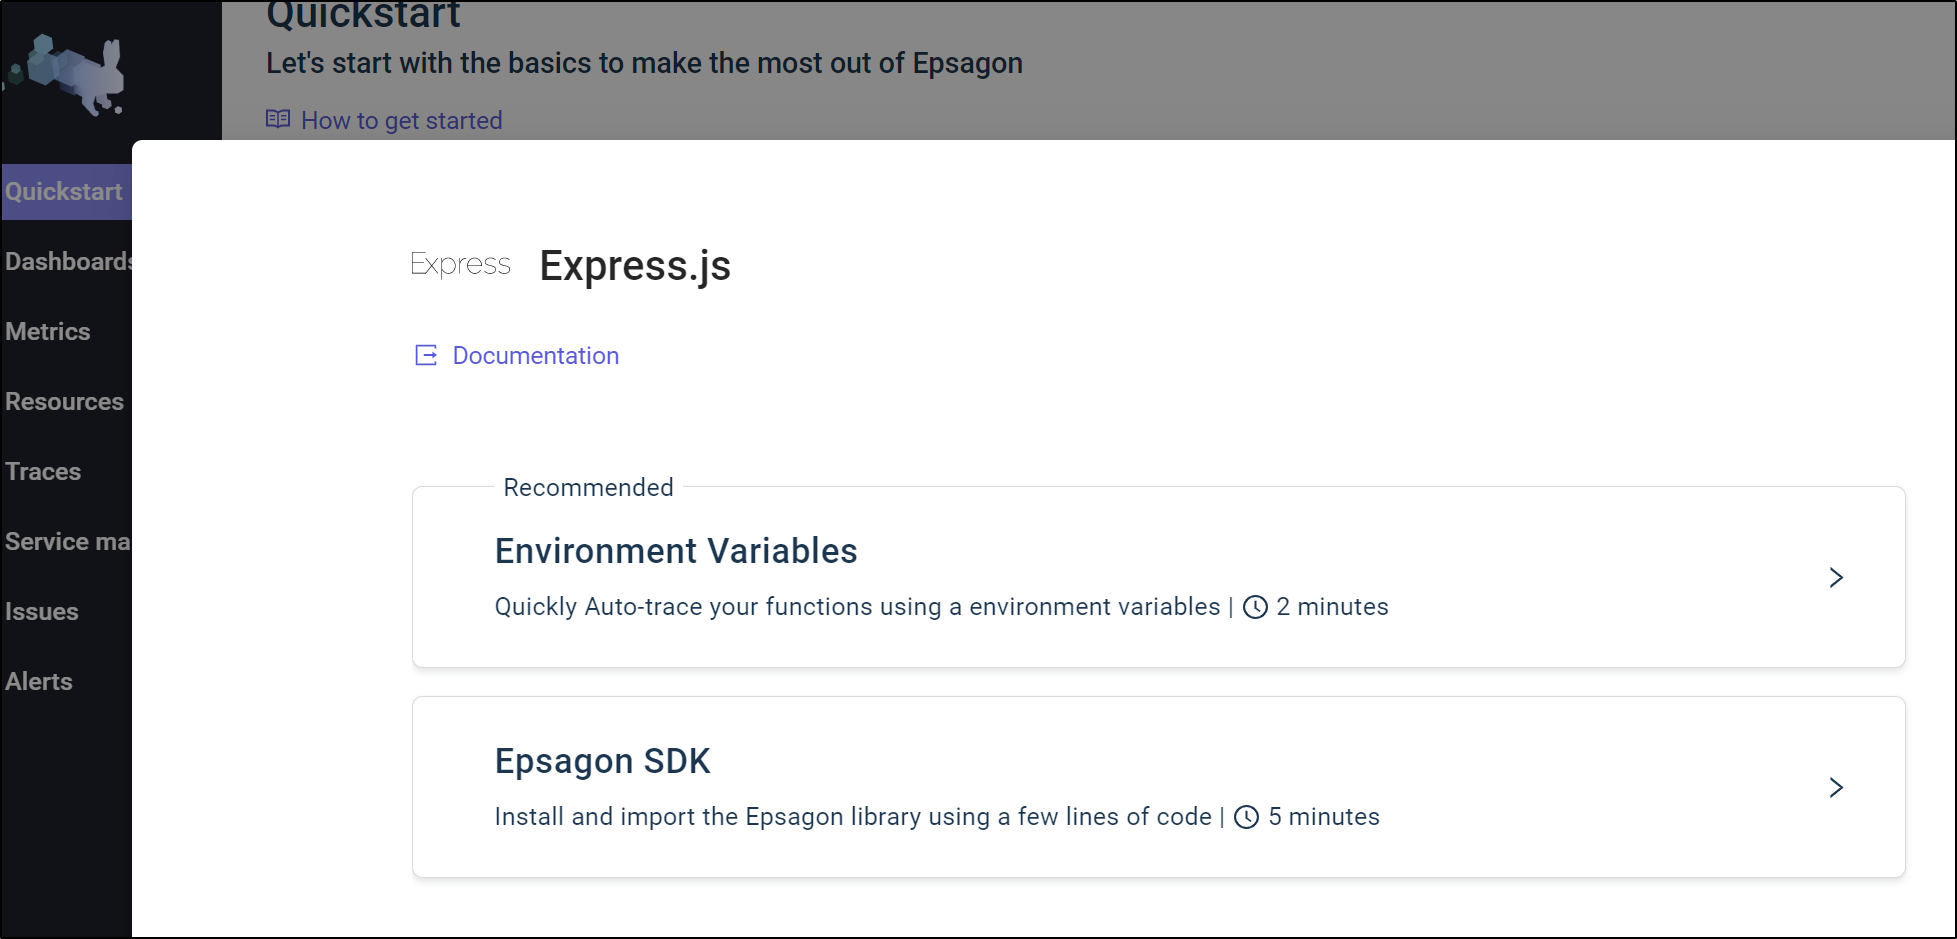
We can pick either in code or via Environment variables
I tried running through Nodemon and outside of it. But regardless, I saw no traces
builder@DESKTOP-72D2D9T:~/Workspaces/dockerWithTests2$ npm start

> nodewithtests@1.0.0 start
> nodemon --inspect=0.0.0.0:9229 server.js

[nodemon] 2.0.15
[nodemon] to restart at any time, enter `rs`
[nodemon] watching path(s): *.*
[nodemon] watching extensions: js,mjs,json
[nodemon] starting `node --inspect=0.0.0.0:9229 server.js`
Debugger listening on ws://0.0.0.0:9229/0c8a8279-c206-4330-a1f7-30f10ffd385f
For help, see: https://nodejs.org/en/docs/inspector
Example app listening on port 3000
^C
builder@DESKTOP-72D2D9T:~/Workspaces/dockerWithTests2$ node server.js
Example app listening on port 3000
I also tried converting the express app to a cjs file and yanking out the module syntax.
still no go
~/Workspaces/dockerWithTests2$ node server.cjs
Example app listening on port 3000
I eventually settled on a calculator demo and in doing so, managed to get some form of traces going
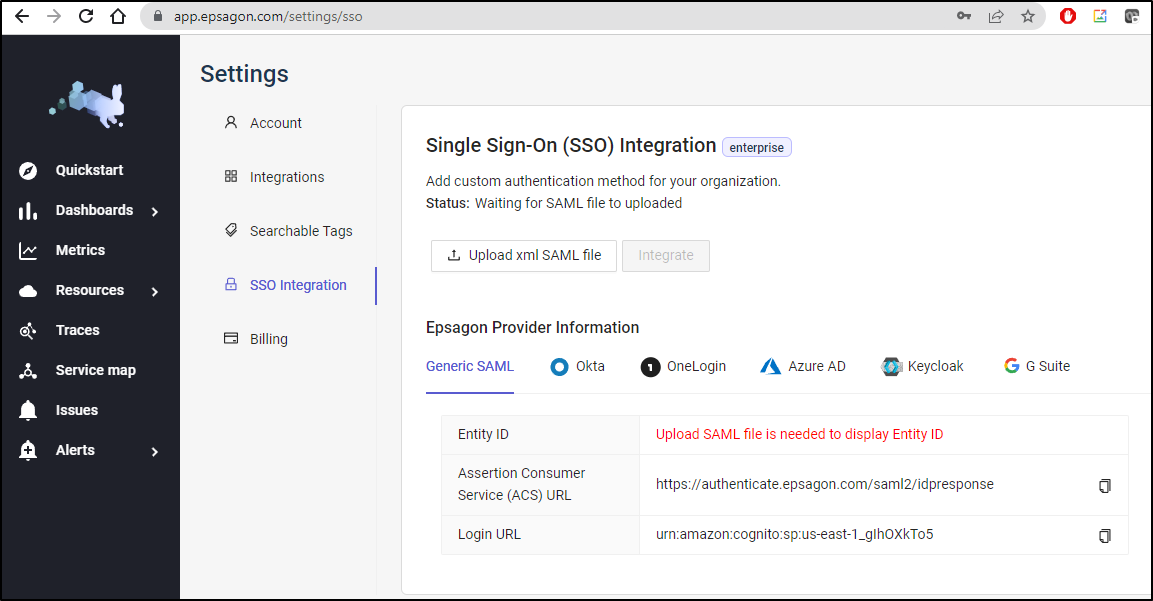
SSO
They recently rolled out SSO. I swear the option on the login page appeared during the course of writing this blog. I do not recall seeing it a week ago when I started.
We can setup SSO in the Settings page:
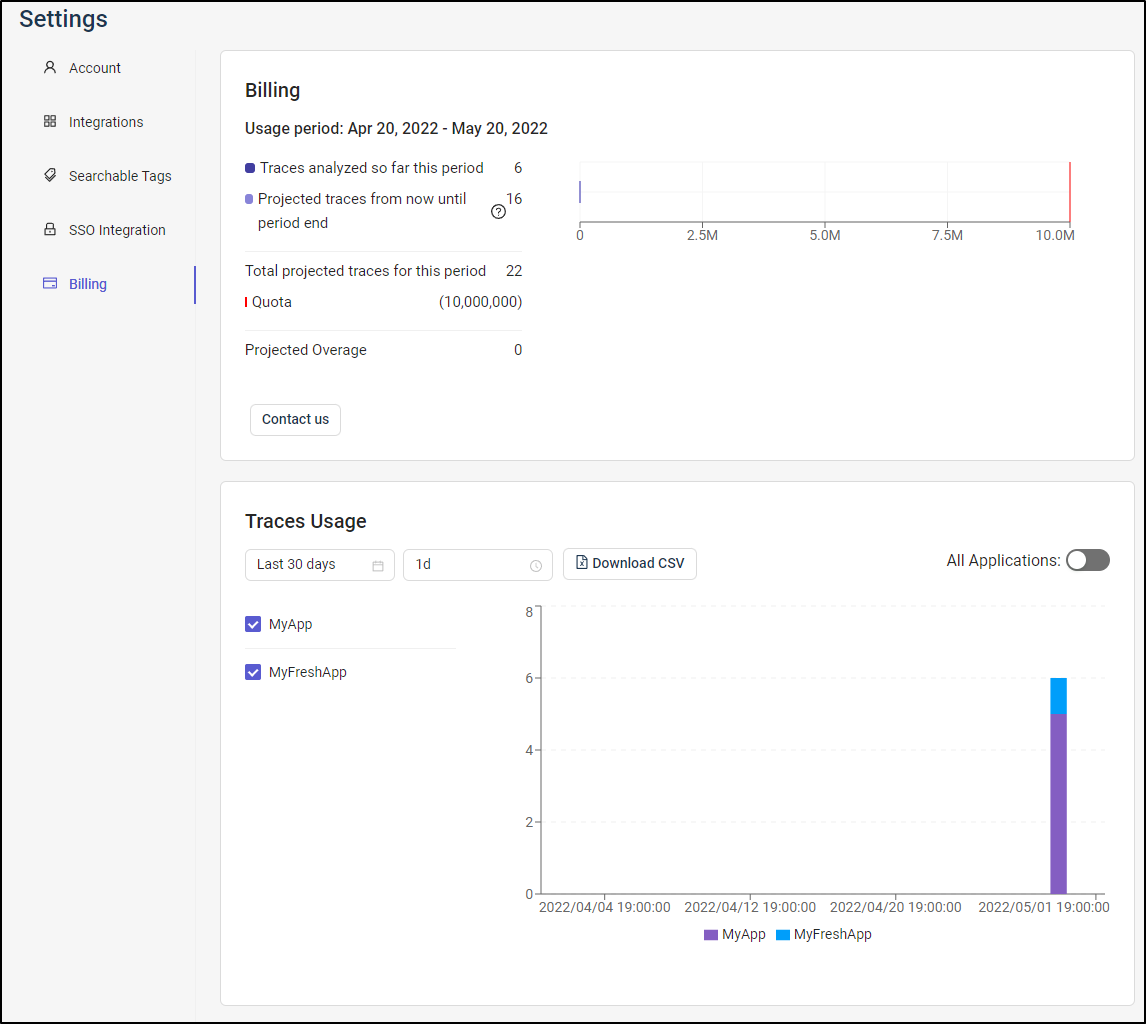
Billing
We can see current usage in the billing. This could be useful in determining if one is in need of a paid license.
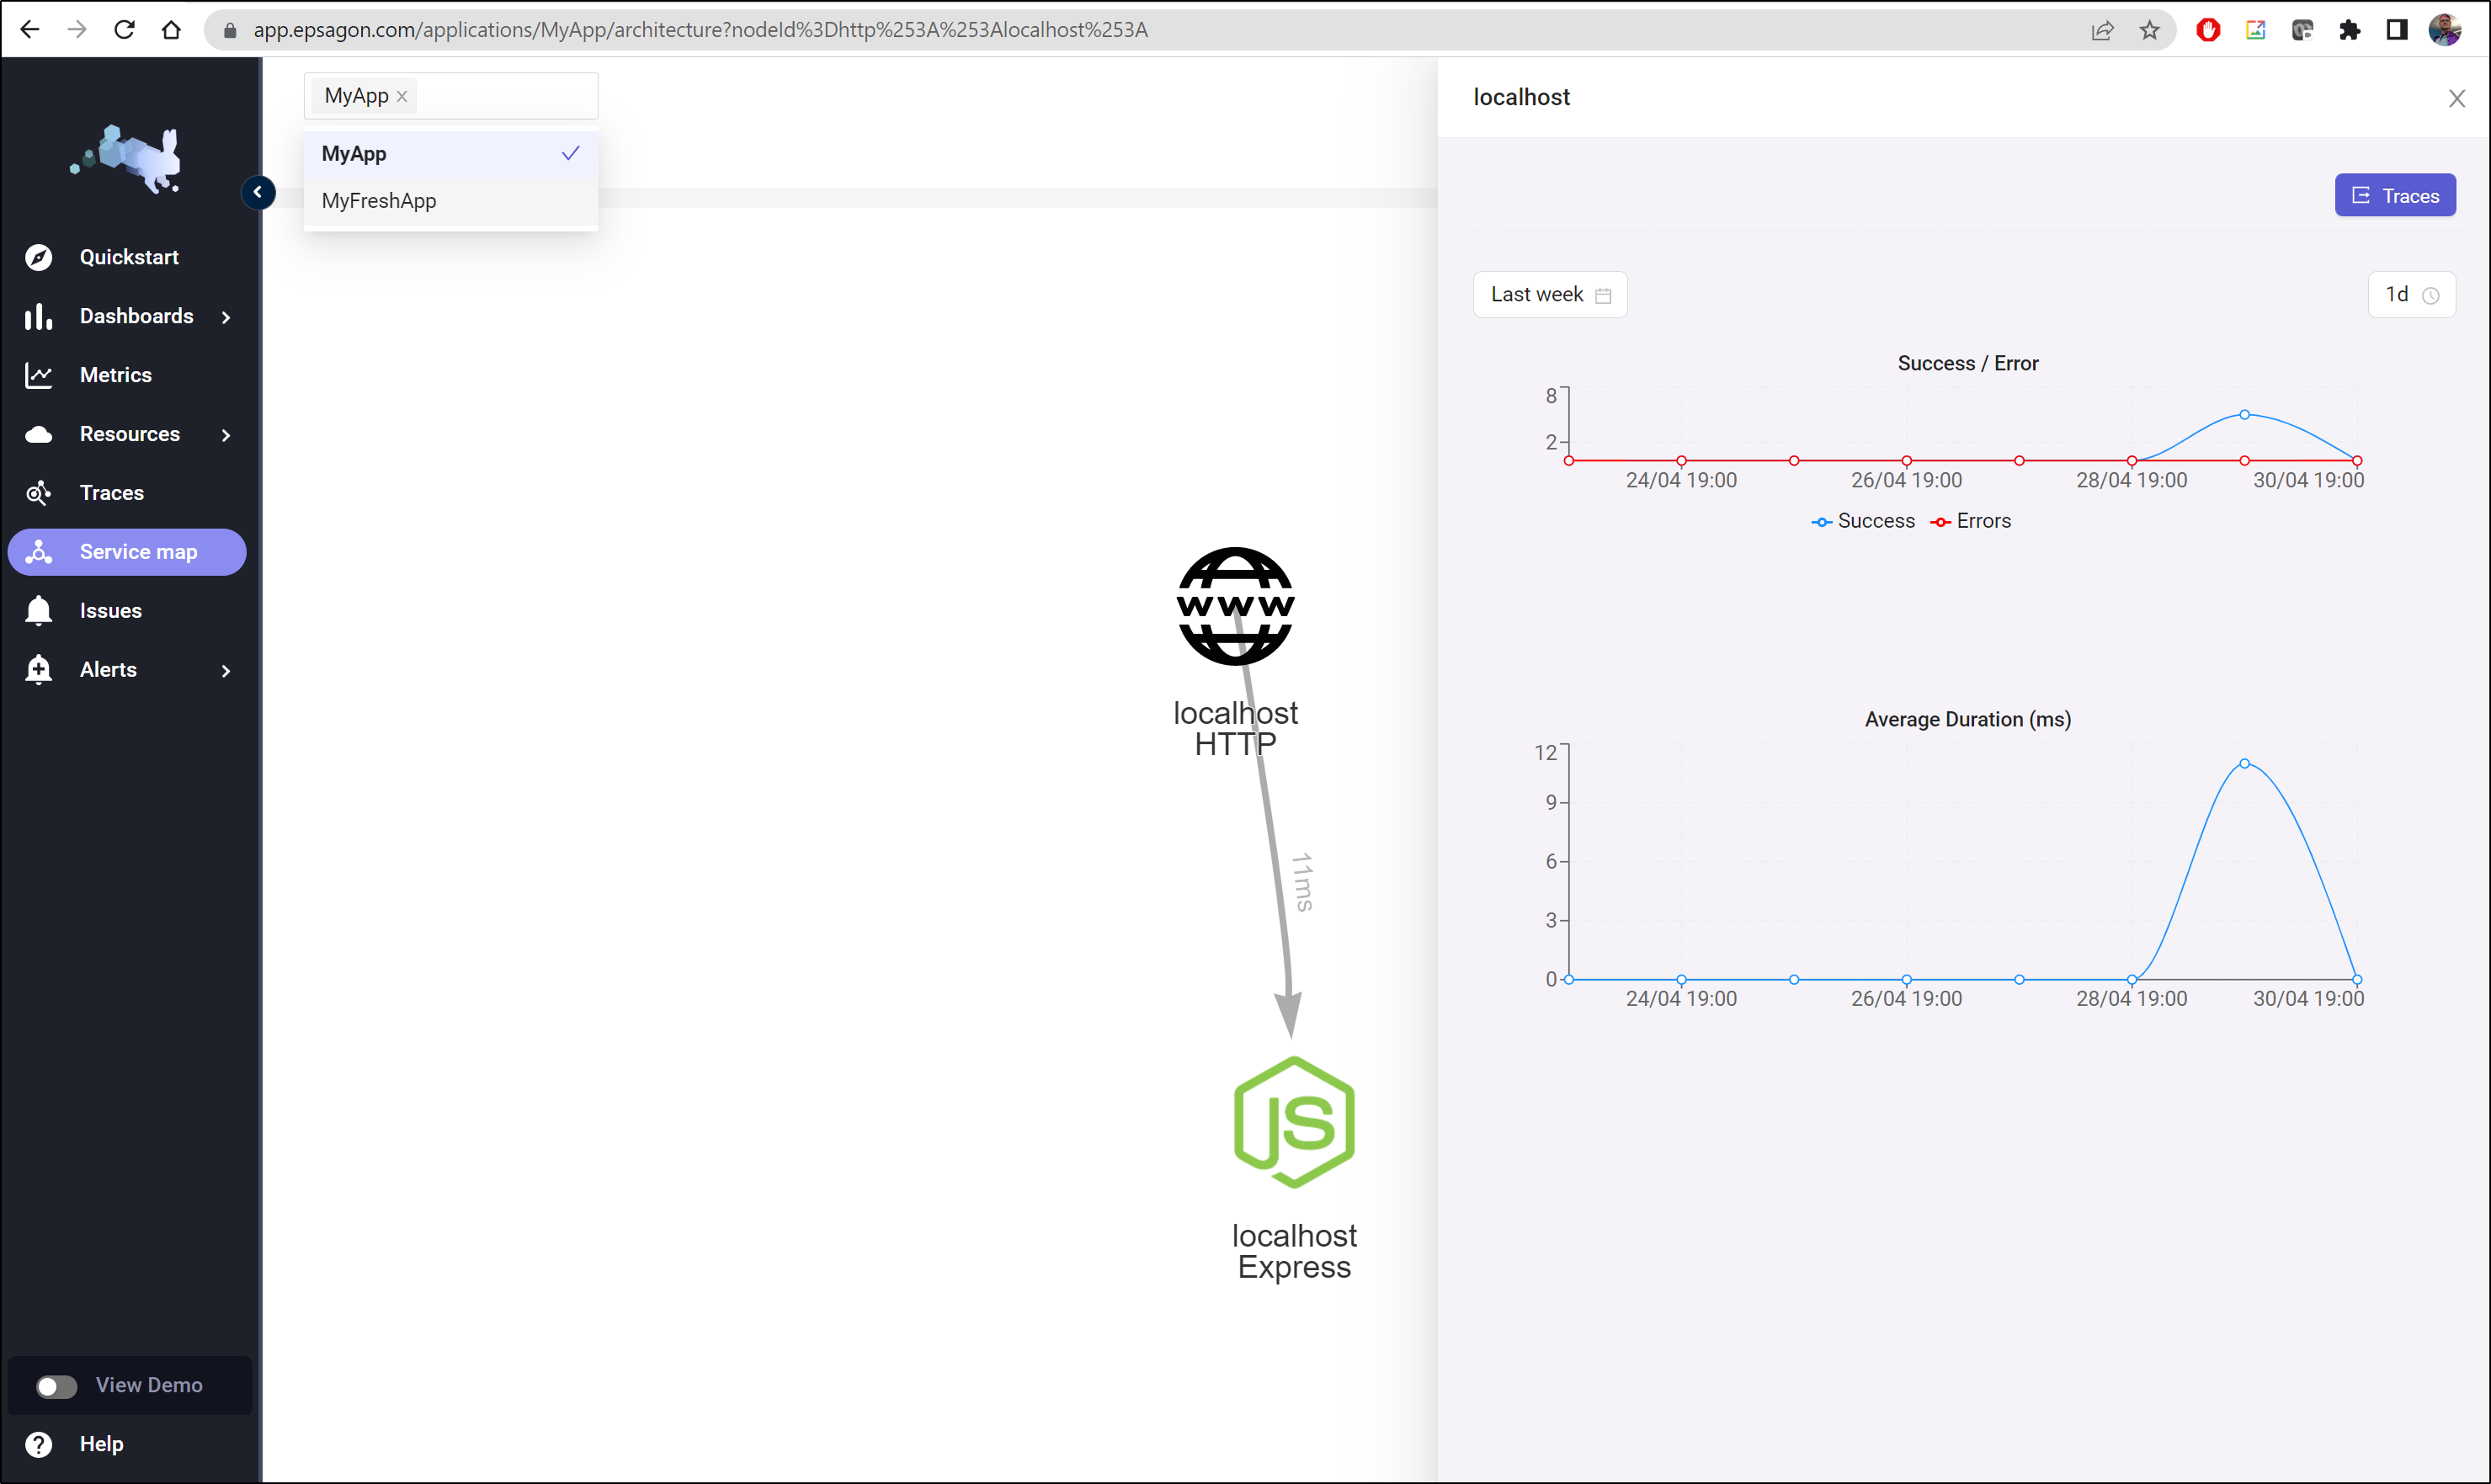
Traces
Here we can see a couple of apps and their service map details
We can move over to Traces for a report of traces
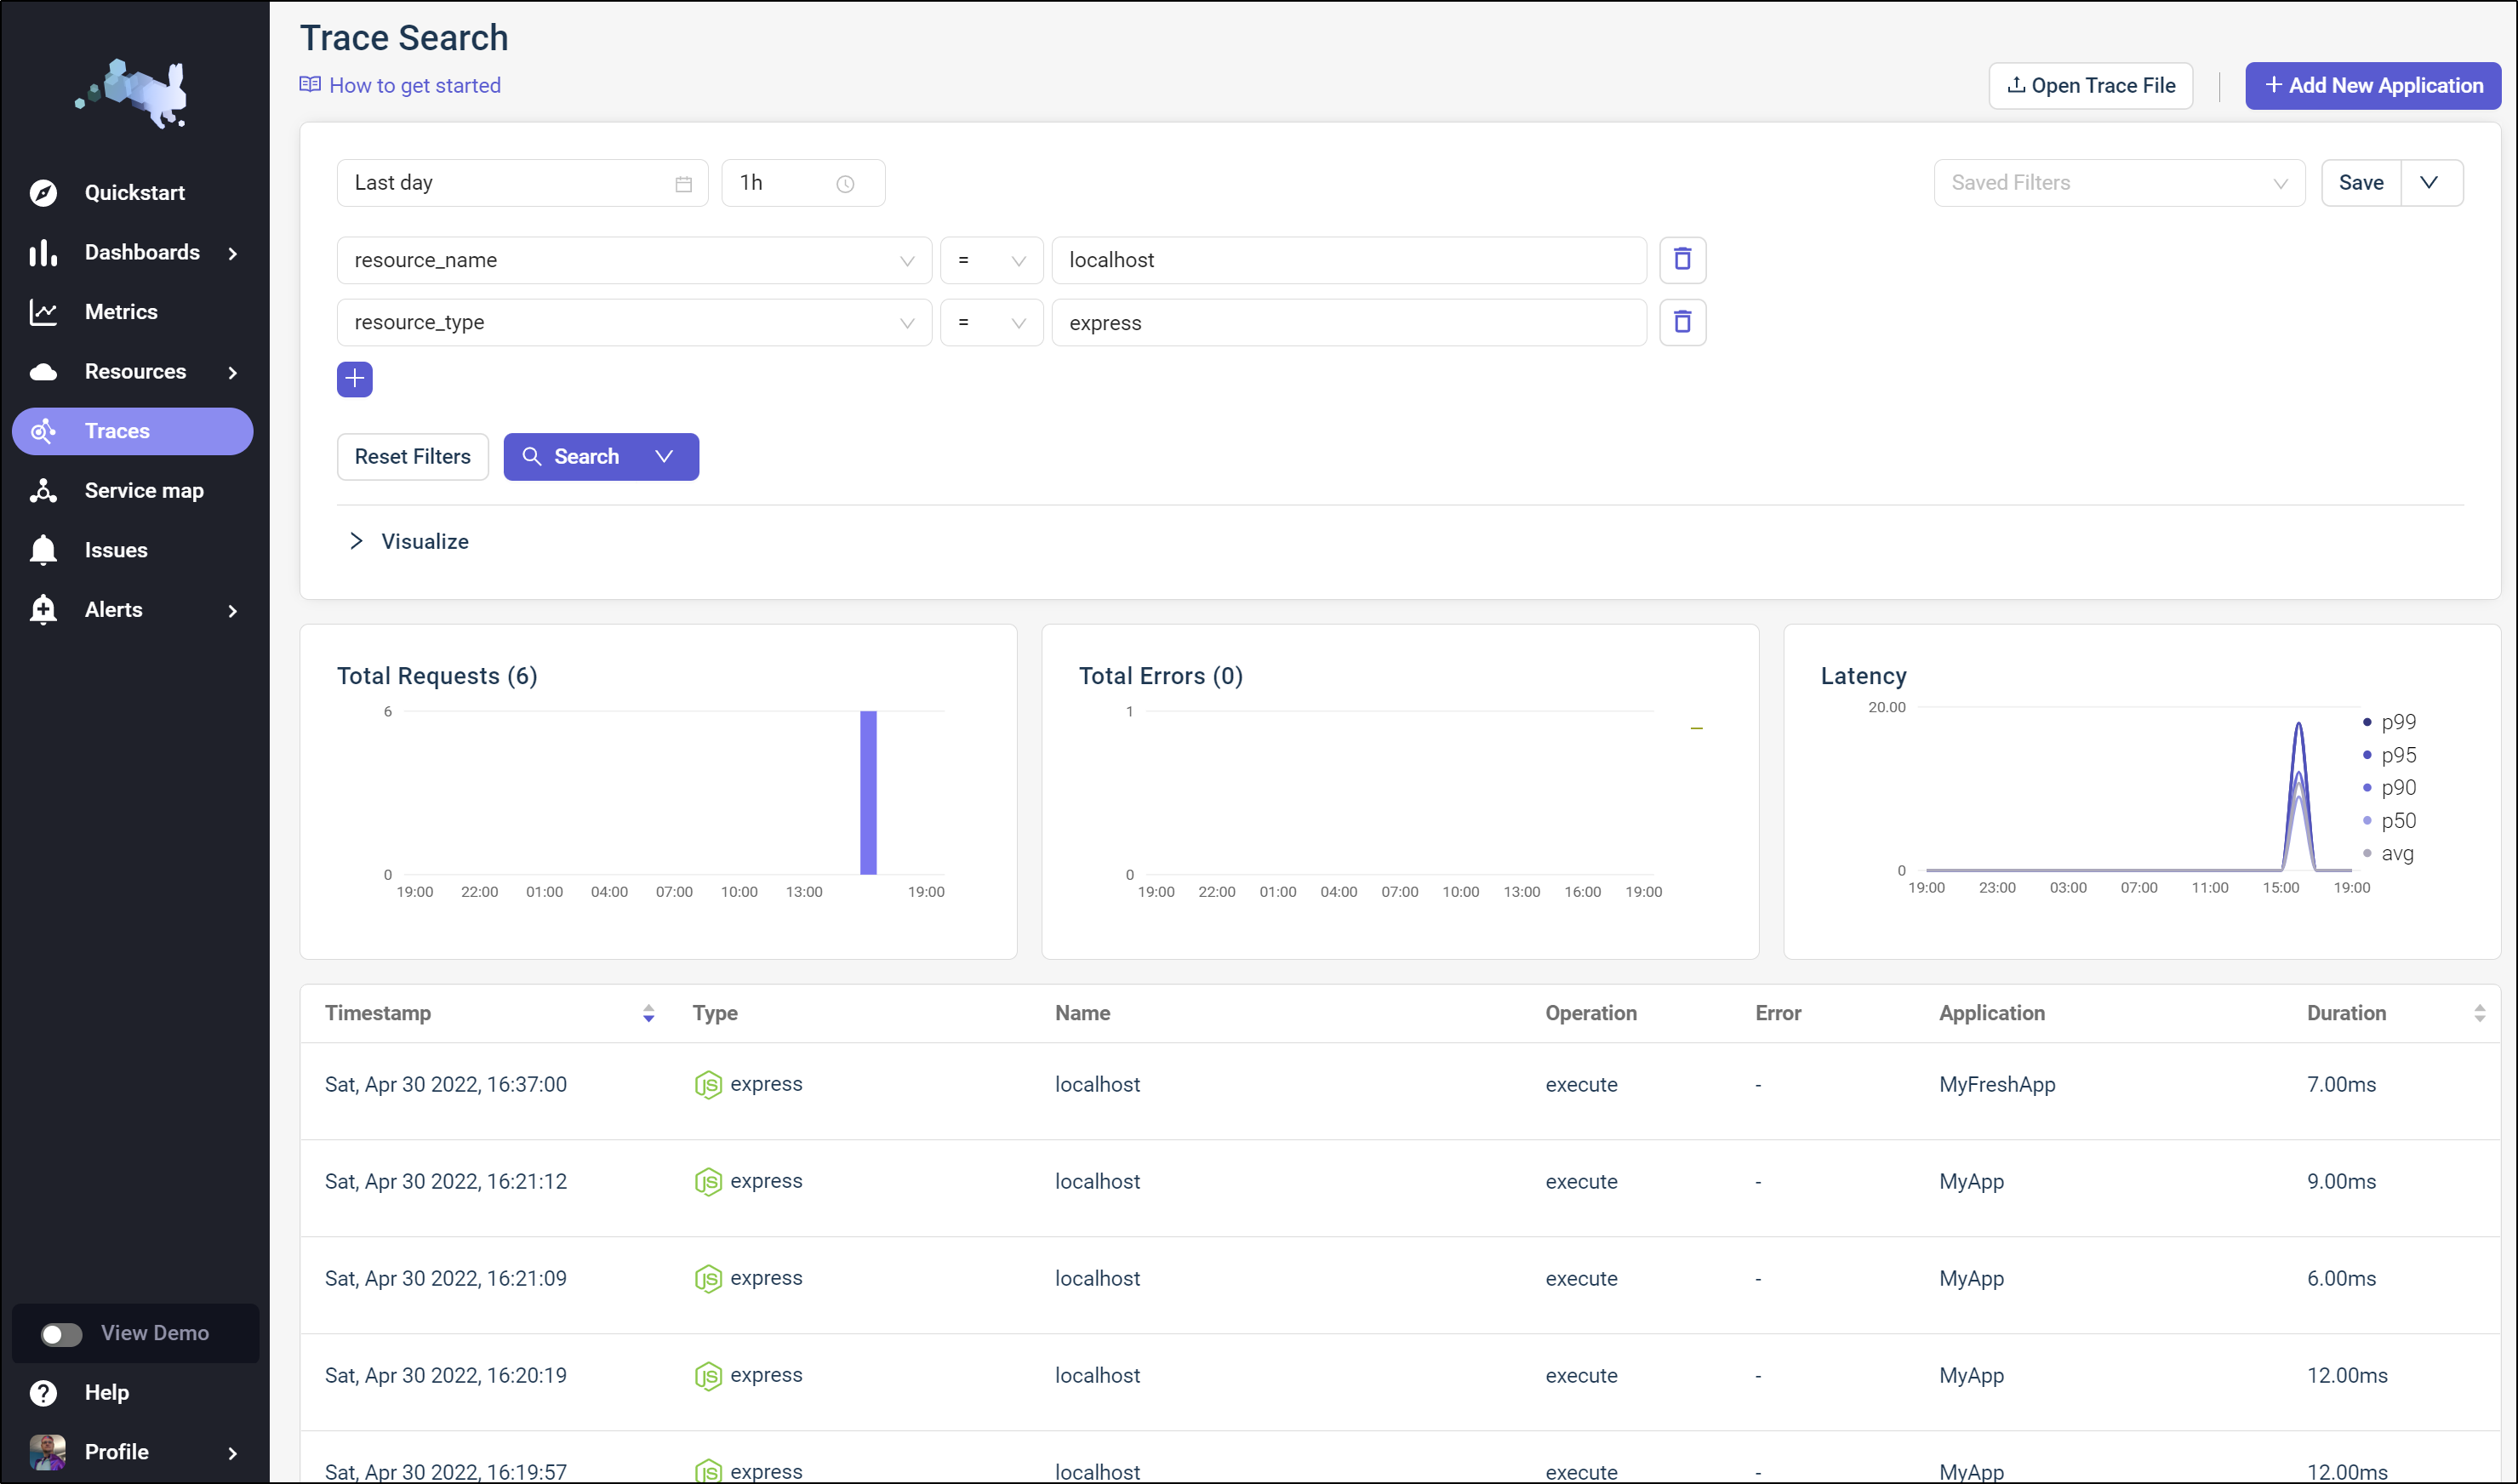
and from there I can see a given trace, which as it’s just a hello world express app, there is not much to see
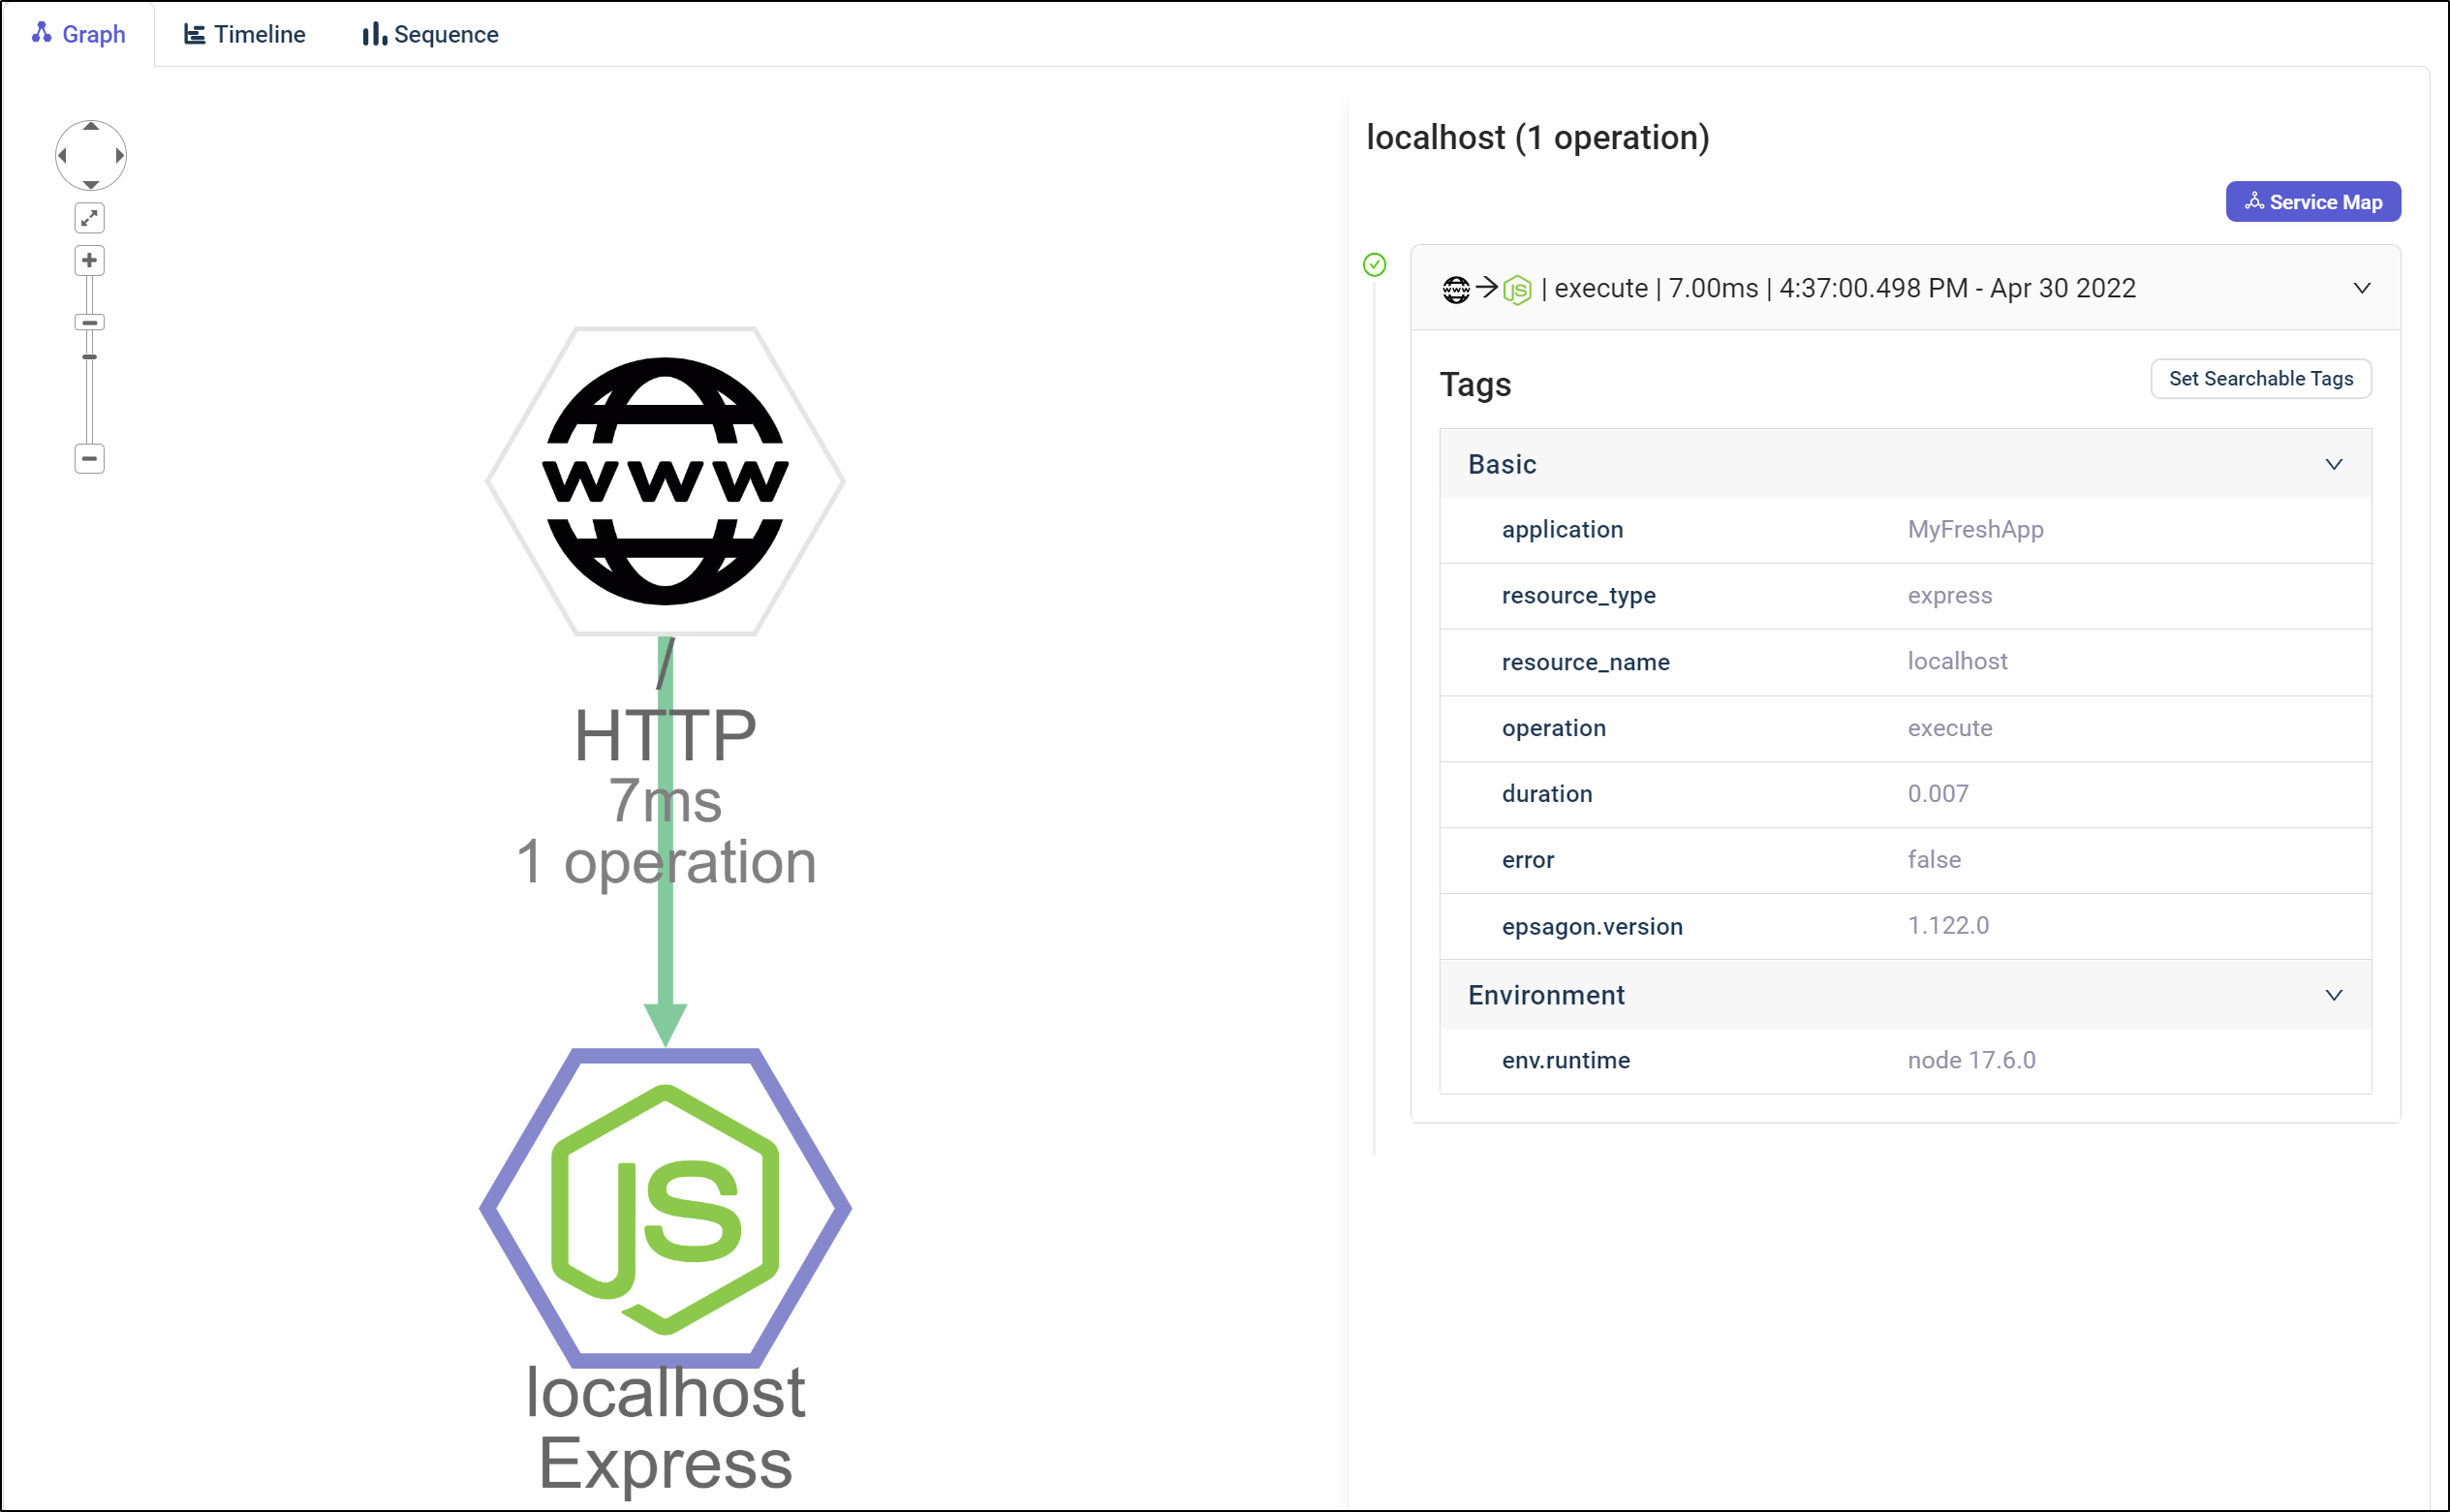
Besides the graph, we can view the timeline
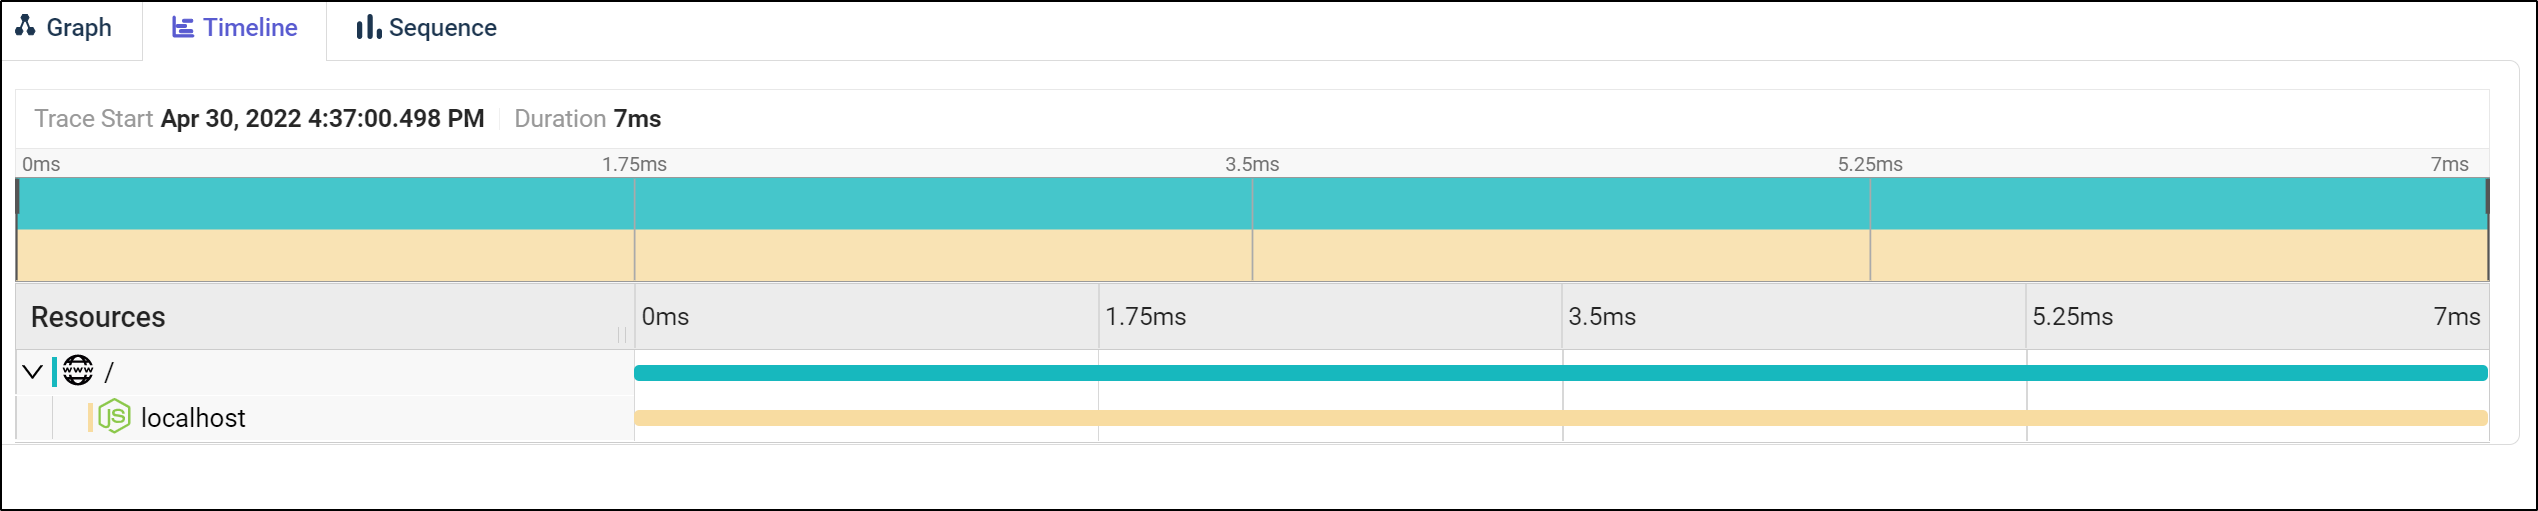
and sequence, which only has data when we chain instrumented services
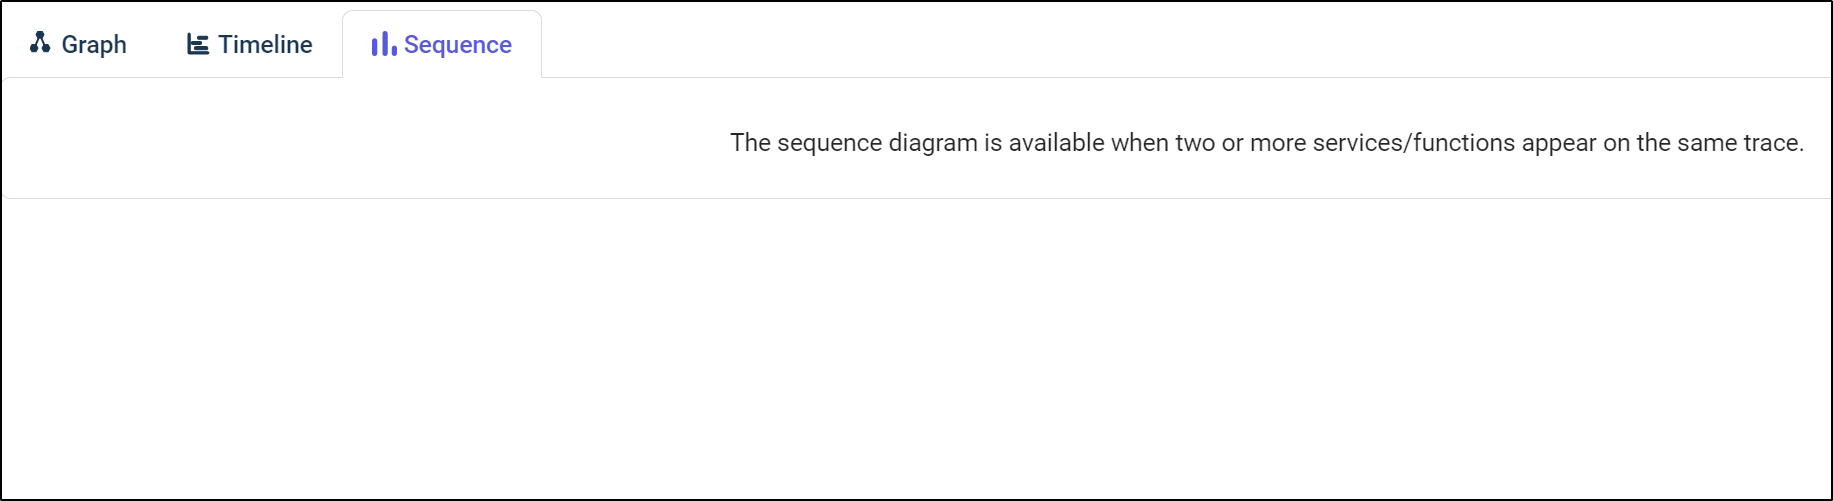
However, short of running a few instrumented sevices or building up a docker compose or loading instrumented services in a cluster, I’m not sure the best way to demo the trace data.
Summary
This brings me to my conclusion; I really am not interested in Observability tools that don’t support Open Telemetry. Even if I can find the monitoring useful (and I do), I’m not planning to promote a suite to my employer that would require us to hardcode a specific vendor library in all our code. To that end, I generally want to see Open Telemetry both to avoid vendor lock-in and to rollout observability solutions that do not require recompiling.
I cannot see why they avoided rolling out OTel. I found blog posts on their site walking through a great ETL demo using RabbitMQ and Jaeger with OpenCensus (Now OTel) here and another comparing Jaeger and Zipkin for OpenTracing here but in neither article to they cover the last mile, getting traces into Epsagon.
Epsagon does have many frameworks supported and have both a low touch (environment variable) and higher touch (configured library) for many languages. If you are willing to rebuild containers, it would be easy to make an instrumented one just by changing the Dockerfile.
This means one has to weigh the unsettling possible future of the product under Cisco to the rather expansive free offering. 10M traces really cover a lot of small to medium companies.