

Published: Jan 18, 2022 by Isaac Johnson
Cribl has long interested me since a former senior director I worked with at Ahead joined them a few years ago. As I highly respect him, I thought, “what is this funny named company all about”? Recently, since many of our posts have fit in that Logging and APM arena, I felt it was high time to give Cribl a real look.
They evidently are named for a “cribble”, though i can find no such noun used anywhere presently (generally that object is called a “classifier”). The other thing worth noting is the company rather has a thing for goats.
Today we’ll set up a Cribl LogMonitor instance and route OpenTelemtry traces and metrics to it. We’ll show how to route data to S3 and NFS. We’ll setup a Workgroup with multiple workers in Kubernetes and lastly we’ll take a look at GCP App Engine monitoring using a Google Cloud Bucket collector.
Setup
We will approach adding the logmonitor two ways.
First, let us install it on a linux host in single instance mode.
$ curl -Lso - $(curl https://cdn.cribl.io/dl/latest-x64) | tar zxvf -
...
cribl/thirdparty/licenses/license-url-0.11.0
cribl/thirdparty/licenses/license-winston-3.3.3
cribl/thirdparty/licenses/license-winston-transport-4.4.0
cribl/thirdparty/licenses/license-xmlbuilder-10.0.0
cribl/thirdparty/licenses/license-yaml-1.3.2
cribl/thirdparty/licenses/license-@readme-markdown-6.22.0
we should then move it out of the users home dir into opt.
$ sudo mv cribl /opt/
Lastly, we can start it:
$ /opt/cribl/bin/cribl start
Starting Cribl LogStream...
.....
Cribl LogStream started
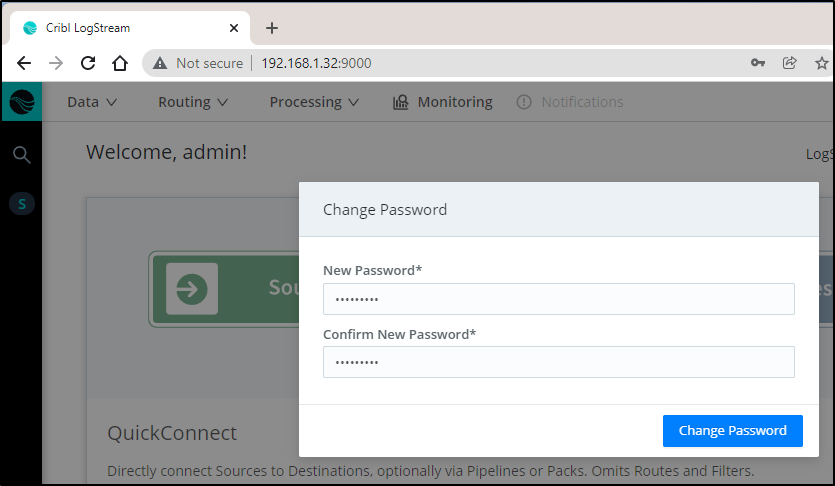
We can now access it on port 9000 and change our default password (admin:admin)
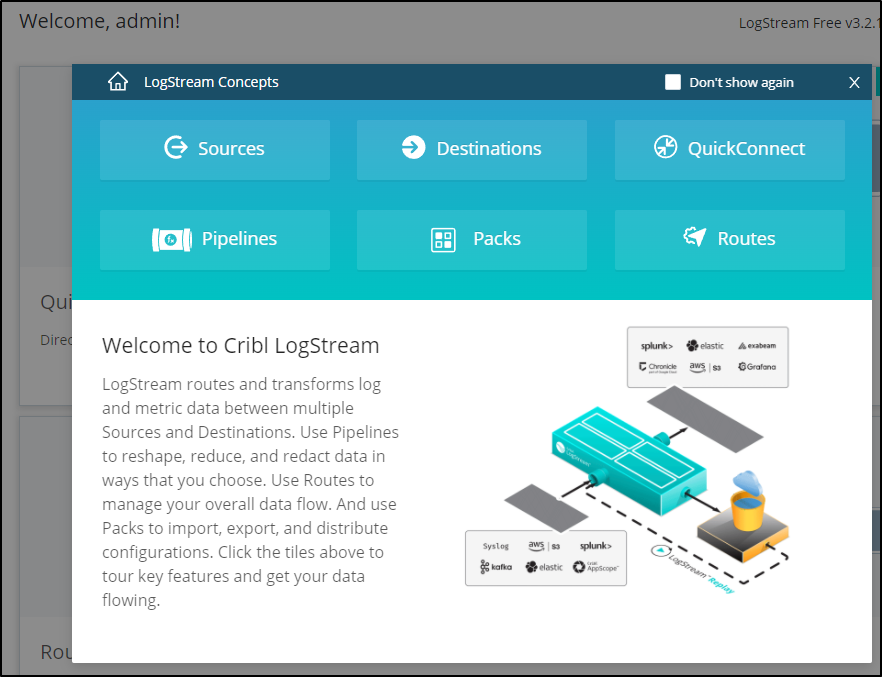
At this point we can start to define sources, destinations and pipelines.
Open Telemetry
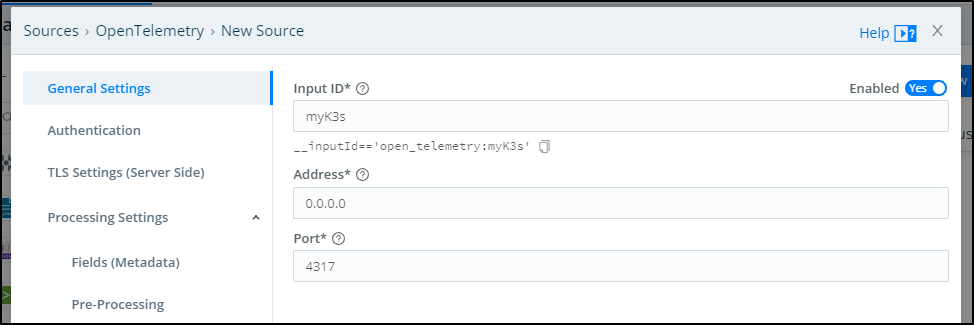
Let’s add an OpenTelemtry Source
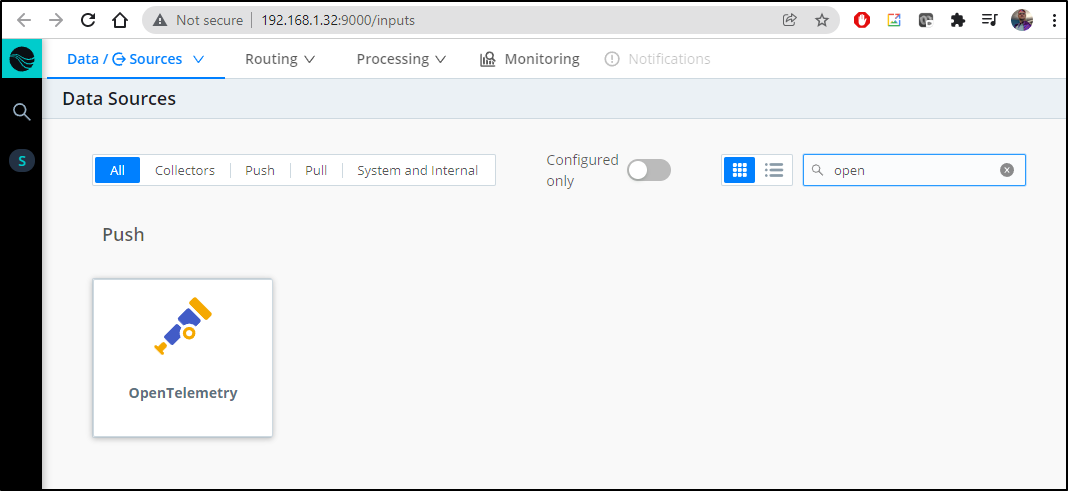
Then click Add New
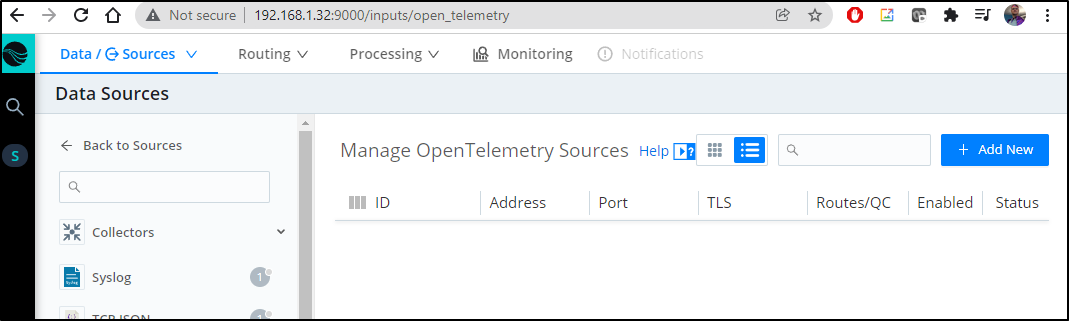
In there we can see the port is 4317 of our agent. We will give it a name as well to identify this OTel stream (myK3s)
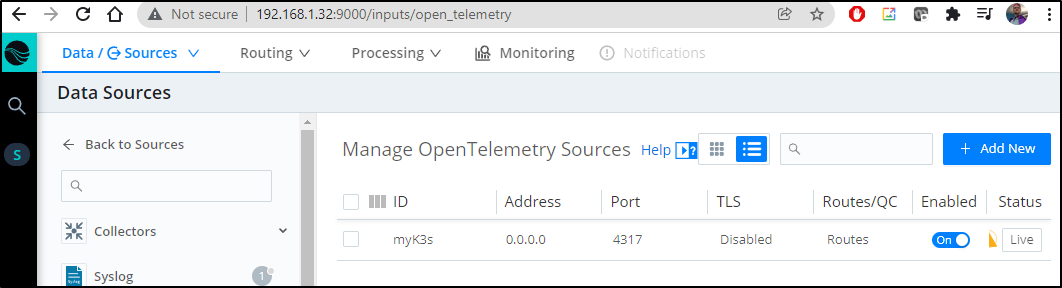
and we see that now is live
Sending Otel data to LogMonitor
I have my Open Telemetry agent configured with an otel configmap
$ kubectl get cm | grep otel
otel-collector-conf                     1      250d
Next I’ll download and edit the CM to start routing metrics to LM
builder@DESKTOP-QADGF36:~/Workspaces/jekyll-blog$ kubectl get cm otel-collector-conf -o yaml > otel.conf
builder@DESKTOP-QADGF36:~/Workspaces/jekyll-blog$ kubectl get cm otel-collector-conf -o yaml > otel.conf.bak
You can see how I swapped out Dynatrace for my local LogMonitor
$ diff -c otel.conf.bak otel.conf
*** otel.conf.bak       2021-12-22 08:28:49.682310585 -0600
--- otel.conf   2021-12-22 08:39:56.502310824 -0600
***************
*** 24,33 ****
        zpages:
          endpoint: :55679
      exporters:
-       dynatrace:
        otlphttp:
!         endpoint: "https://lbt93643.live.dynatrace.com/api/v2/otlp"
!         headers: {"Authorization": "Api-Token dt0c01.NsadfasdfasdfasdfasdfasdfasdfasdfasdfasdfasdfasdfasdfasdfasdfasdfasdfasdfJ4"}
        logging:
          loglevel: debug
        # Depending on where you want to export your trace, use the
--- 24,31 ----
        zpages:
          endpoint: :55679
      exporters:
        otlphttp:
!         endpoint: 192.168.1.32:4317
        logging:
          loglevel: debug
        # Depending on where you want to export your trace, use the
***************
*** 55,61 ****
            exporters: [azuremonitor, datadog, otlphttp, logging]
          metrics:
            receivers: [prometheus]
!           exporters: [dynatrace]
  kind: ConfigMap
  metadata:
    annotations:
--- 53,59 ----
            exporters: [azuremonitor, datadog, otlphttp, logging]
          metrics:
            receivers: [prometheus]
!           exporters: [otlphttp]
  kind: ConfigMap
  metadata:
    annotations:
This makes the Open Telemetry Conf look as such
    receivers:
      otlp:
        protocols:
          grpc:
            endpoint: 0.0.0.0:55680
          http:
            endpoint: 0.0.0.0:55681
      zipkin:
        endpoint: 0.0.0.0:9411
      prometheus:
        config:
          scrape_configs:
            - job_name: 'otel-collector'
              scrape_interval: 10s
              static_configs:
                - targets: [ '0.0.0.0:8888' ]
    extensions:
      health_check:
      pprof:
        endpoint: :1888
      zpages:
        endpoint: :55679
    exporters:
      otlp/insecure:
        endpoint: 192.168.1.32:4317
        tls:
          insecure: true
      logging:
        loglevel: debug
      azuremonitor:
        instrumentation_key: "asdfasfsadf-asdfasdf-asdfas-asdf-asdfasdfasdf"
        endpoint: "https://centralus-2.in.applicationinsights.azure.com/v2/track"
      datadog:
        api:
          key: "asdfasfdasdfasdfasdfsadf"

    service:
      extensions: [pprof, zpages, health_check]
      pipelines:
        traces:
          receivers: [zipkin]
          # List your exporter here.
          exporters: [azuremonitor, datadog, otlp/insecure, logging]
        metrics:
          receivers: [prometheus]
          exporters: [otlp/insecure]
To make it live, I need to apply and rotate the Otel collector agent pod
builder@DESKTOP-QADGF36:~/Workspaces/jekyll-blog$ kubectl apply -f otel.conf
configmap/otel-collector-conf configured
builder@DESKTOP-QADGF36:~/Workspaces/jekyll-blog$ kubectl delete pod otel-collector-85b54fbfdc-wxtkt
pod "otel-collector-85b54fbfdc-wxtkt" deleted
builder@DESKTOP-QADGF36:~/Workspaces/jekyll-blog$ kubectl get pods | grep tel
otel-collector-85b54fbfdc-hhj8p                         1/1     Running   0          7m58s
Note, if you do “https” in Otel conf but do not enable in LogMonitor, you may get a TLS error:
2021-12-22T15:06:24.134Z error exporterhelper/queued_retry_inmemory.go:93 Exporting failed. No more retries left. Dropping data. {"kind": "exporter", "name": "otlphttp", "error": "max elapsed time expired failed to make an HTTP request: Post \"https://192.168.1.32:4317/v1/metrics\": tls: first record does not look like a TLS handshake", "dropped_items": 40}
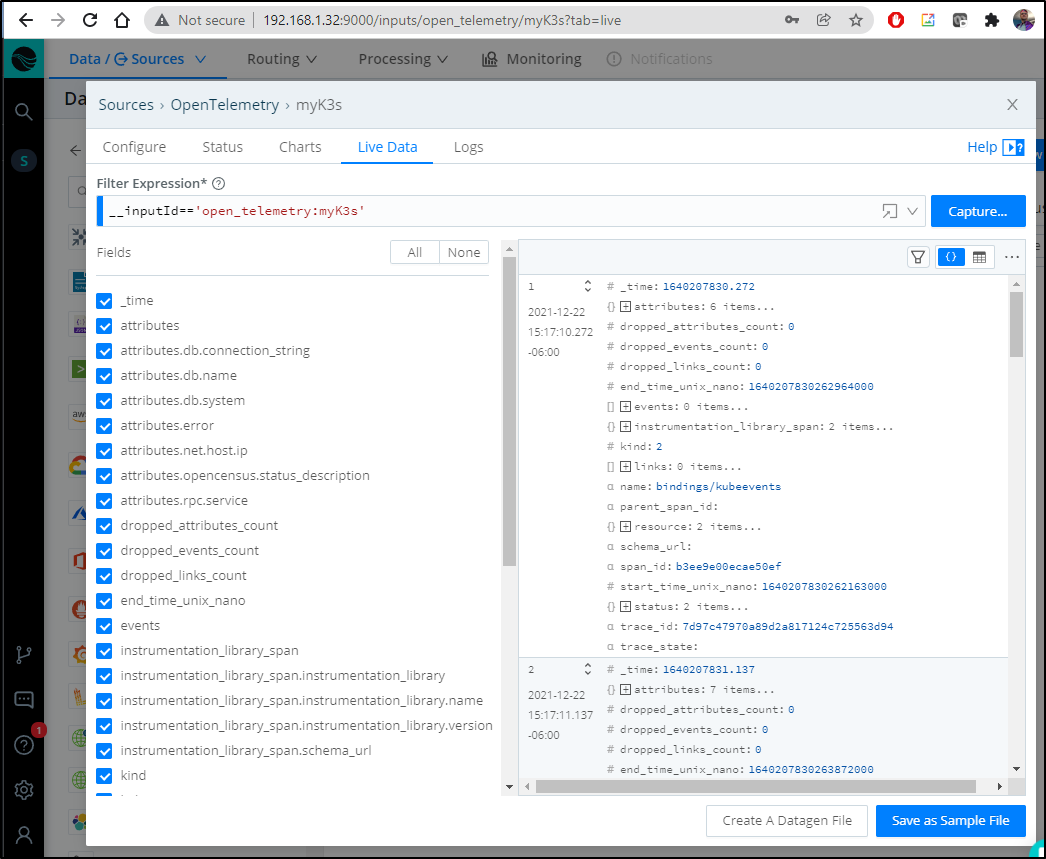
We can now see data is being ingested by LogStream
Additionally, we can fire up a port-forward to a Dapr instrumented app and fire some requests through
$ kubectl port-forward react-form-79c7989844-xqkhq 8080:8080
Forwarding from 127.0.0.1:8080 -> 8080
Forwarding from [::1]:8080 -> 8080
Handling connection for 8080
Handling connection for 8080
Handling connection for 8080
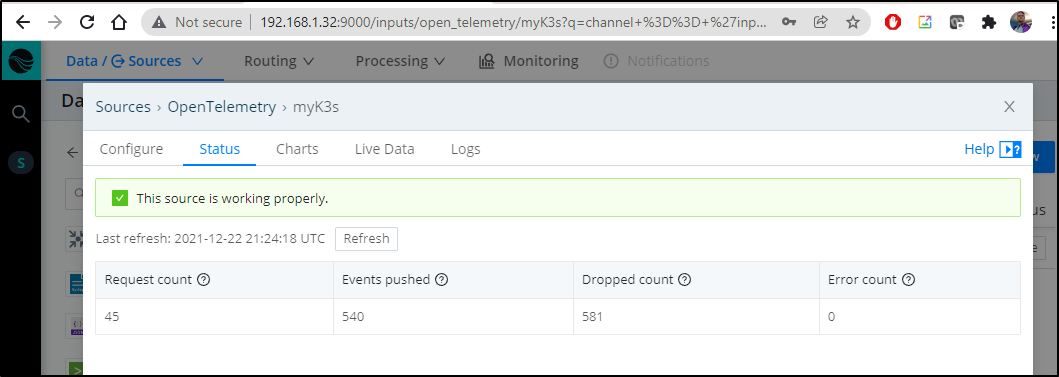
Then we’ll see our request/event counts increase in the State pane:
Sending to S3
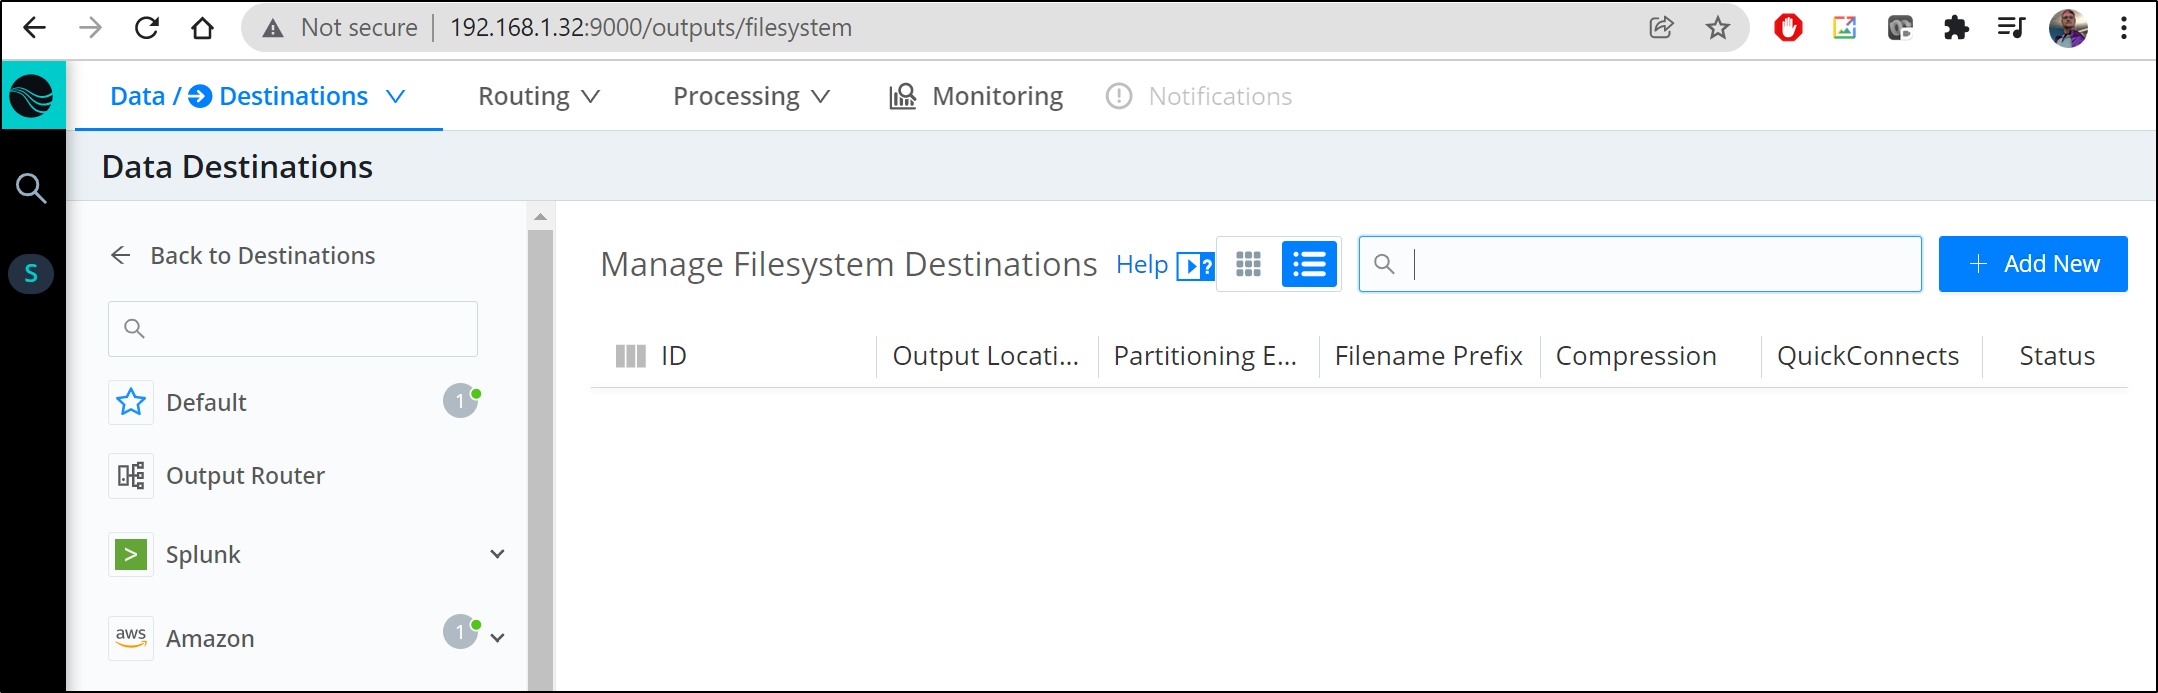
First we need to go to Data Destinations
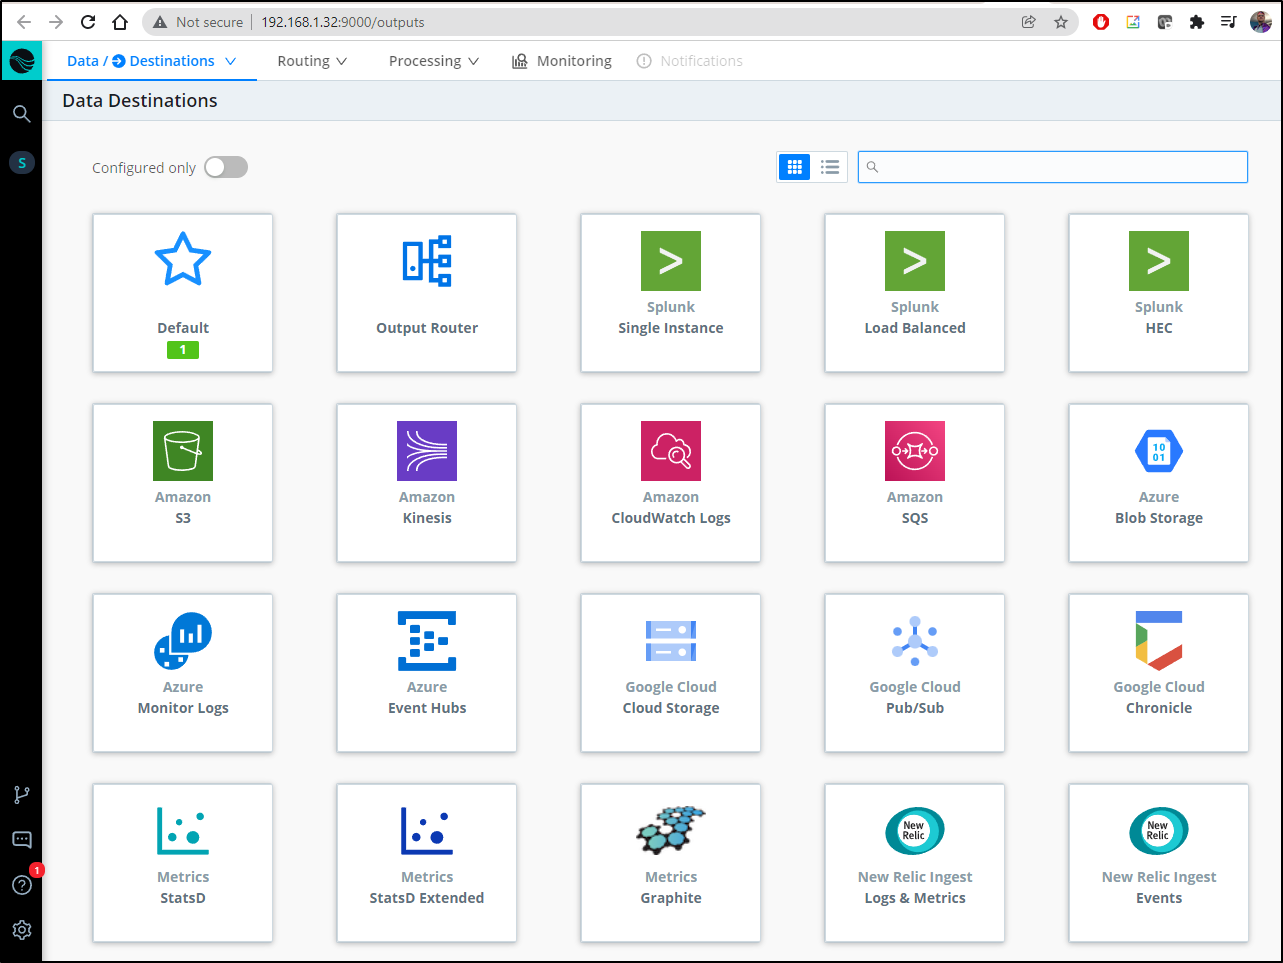
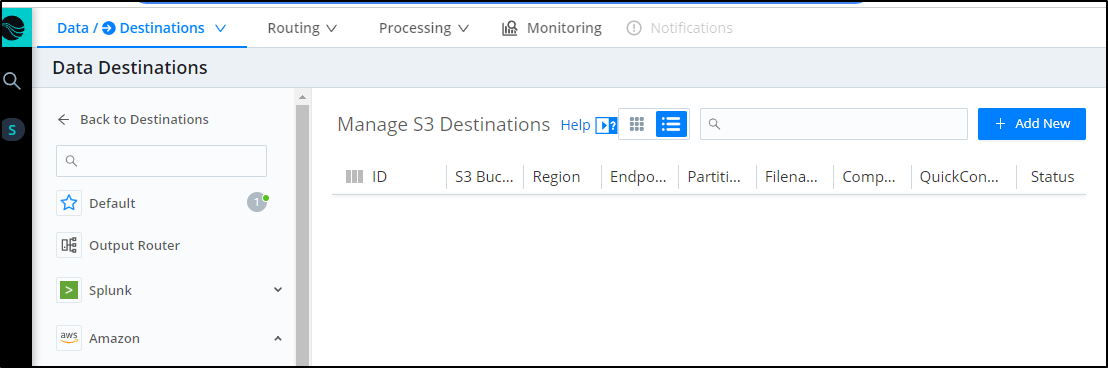
Let’s add S3 (http://192.168.1.32:9000/outputs/s3)
We can click “Add New” in the s3 pane
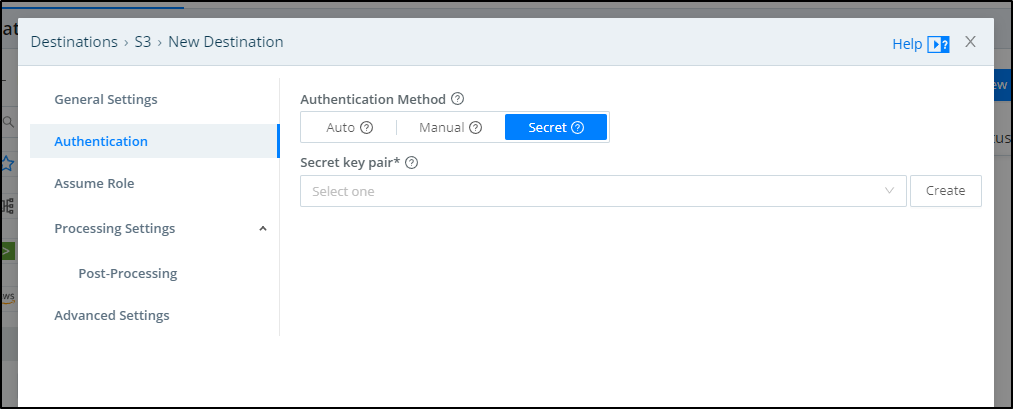
Next, we will need to add an AWS secret so we can access our bucket. In Authentication, select the method of secret and click create
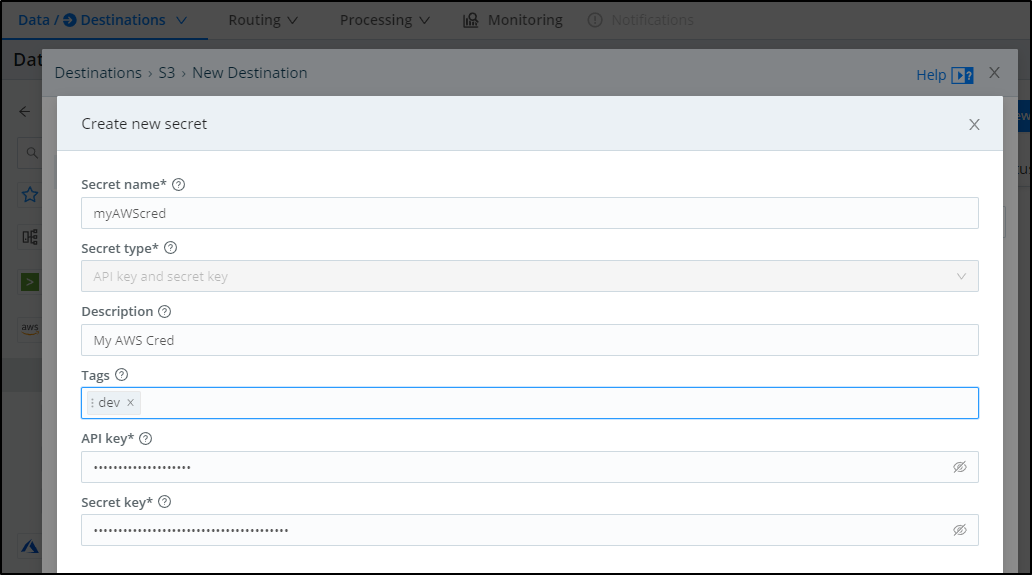
So we can add tags (like “dev”) and give a description. Add your API key (usually starts with AK) and your secret. You can get and create one from the IAM area of AWS.
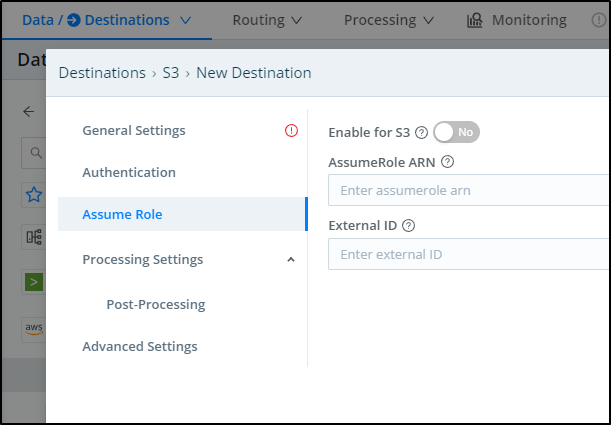
In some AWS settings, one creates a lower privildged IAM access credential but then needs to AssumeRole. If you do use an AssumeRole, you can enter that in the “Assume Role” area:
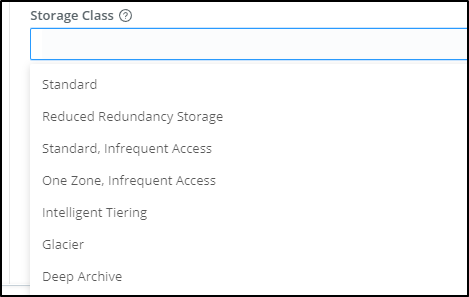
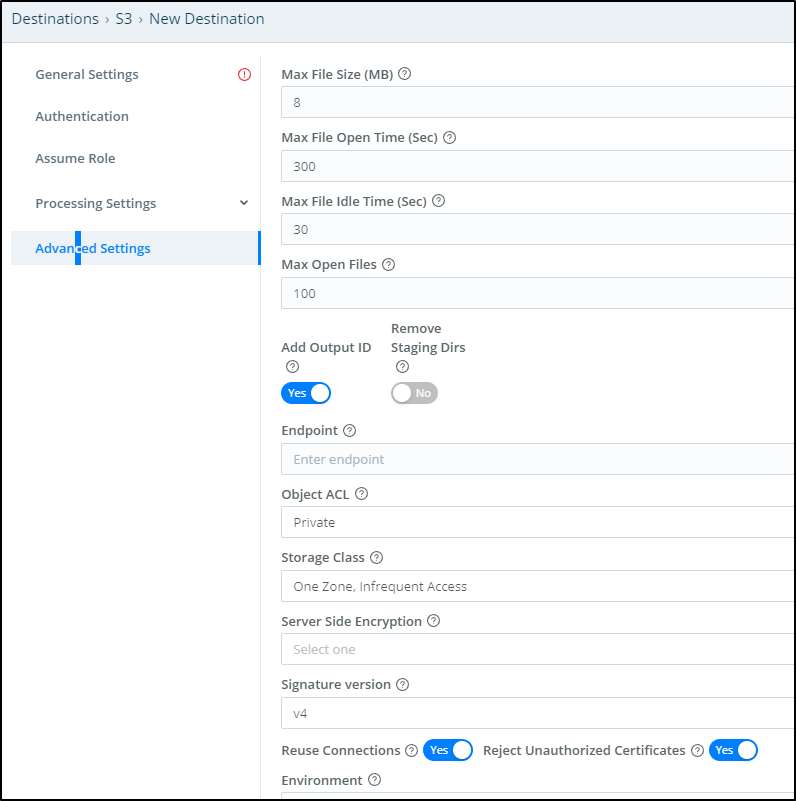
In the Advanced settings we can do things such as setting the Storage Class, the Object ACL and SSE.
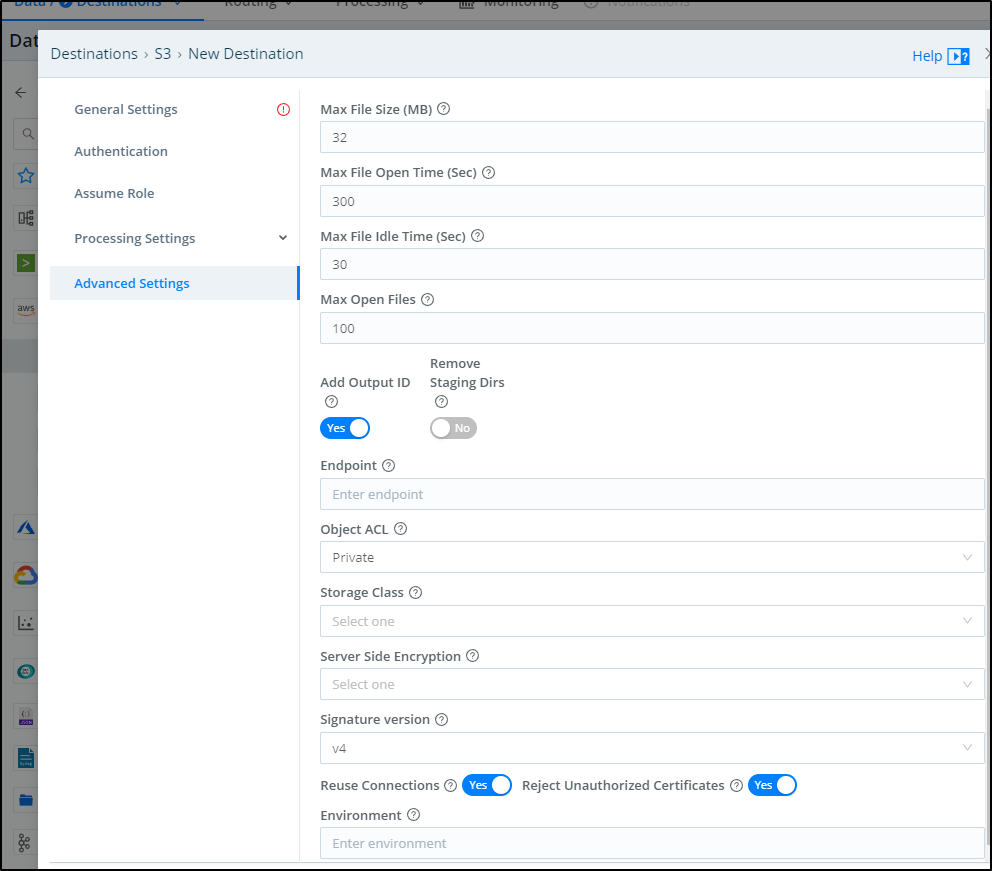
For instance, if we are using Cribl to ensure SLAs for long term storage with the assumption we likely will never need to pull most data, it might make sense to Glacier or Standard, Infrequent Access
For instance, if we set aside 10gb in Standard, we might expect $0.30 of cost.
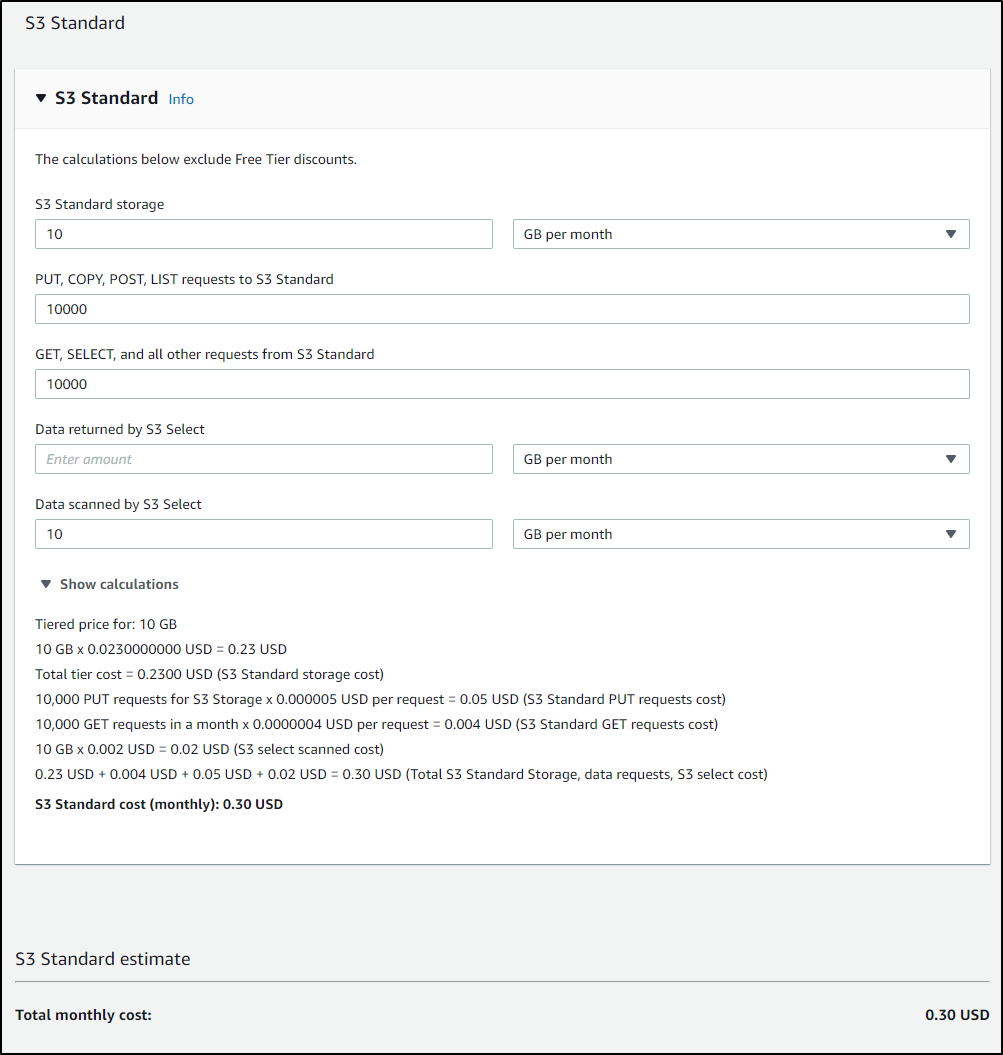
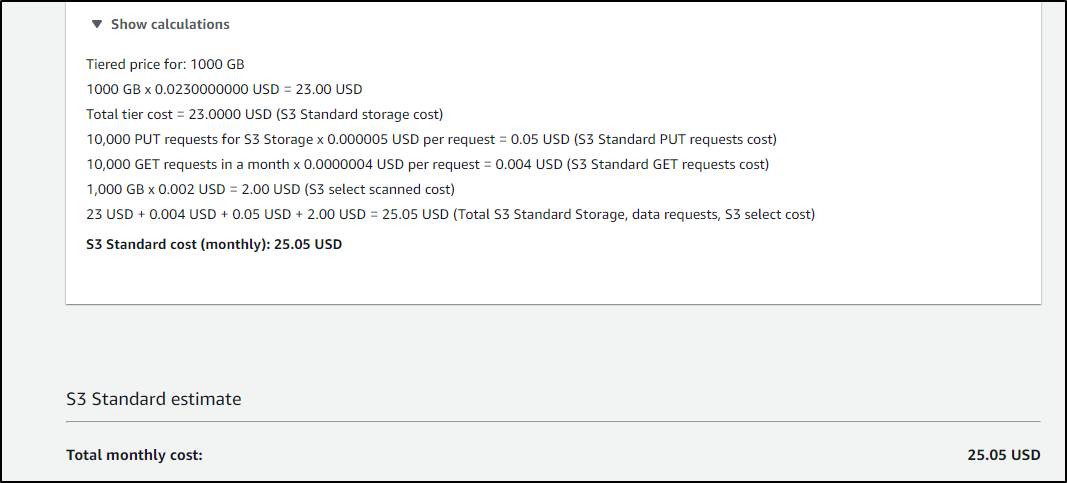
But if we get upwards of a TB, we are at US$25
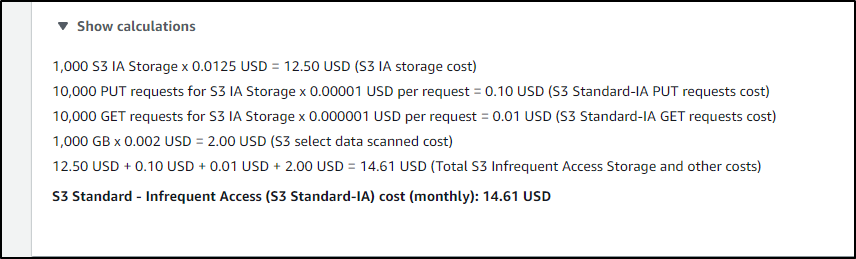
but would only be US$15 with Standard - IA
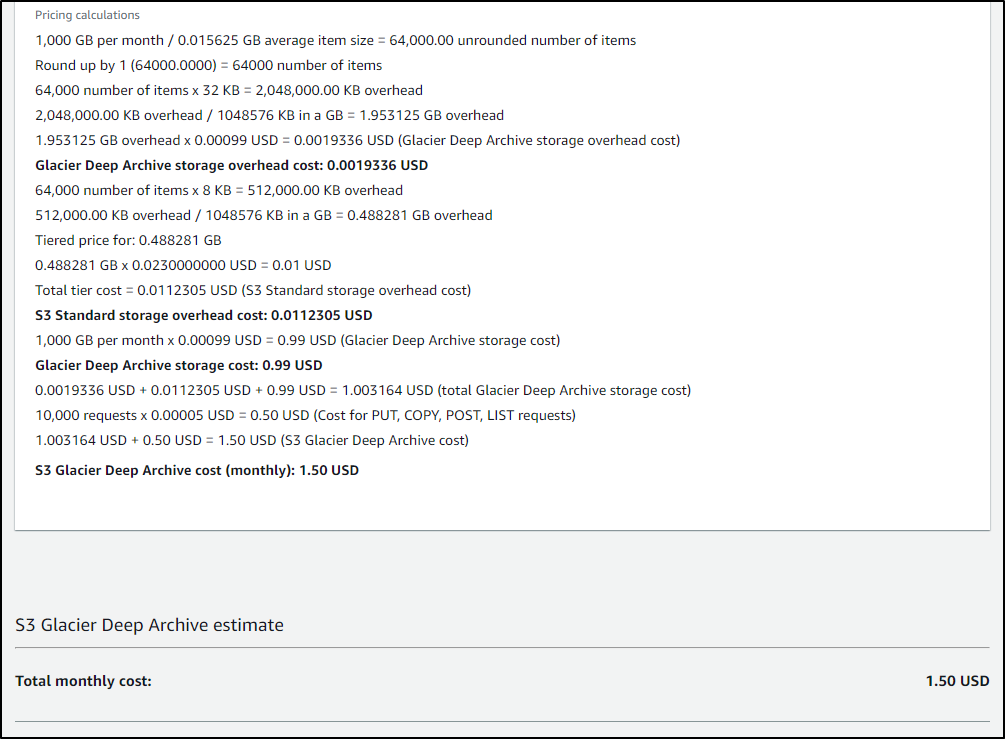
And US$1.50 for Glacier - Deep Archive
For my testing, I’ll use One Zone IA and lower the Max File size (how large a file grows before transferring)
Lastly, I’ll se the ID for this destination (myS3Bucket) and an S3 bucket name (mycriblstorage).
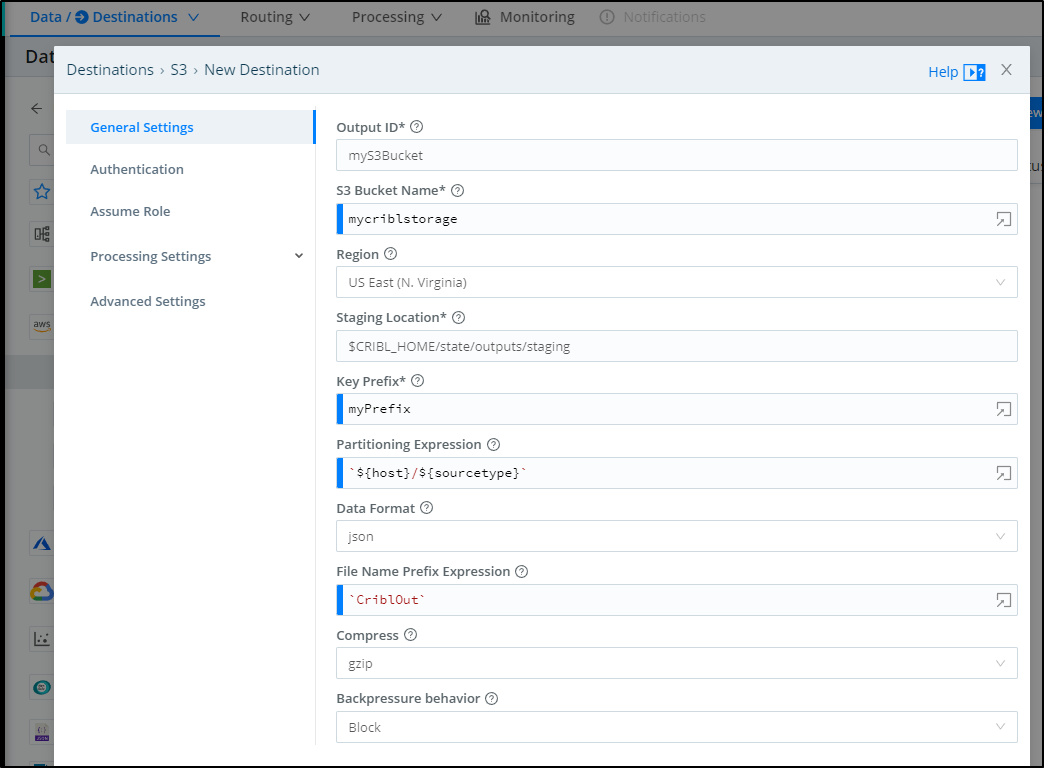
I’ll need to create this bucket if I have not done already
$ aws s3 mb s3://mycriblstorage --region us-east-1
make_bucket: mycriblstorage
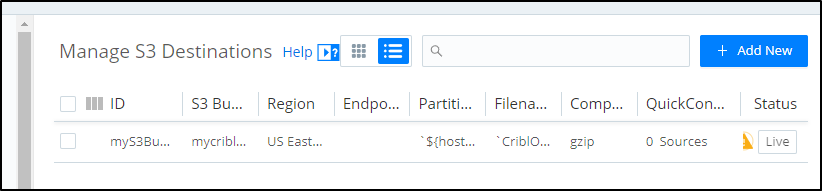
We can now see the destination in our “Data Destinations”
Adding a Route
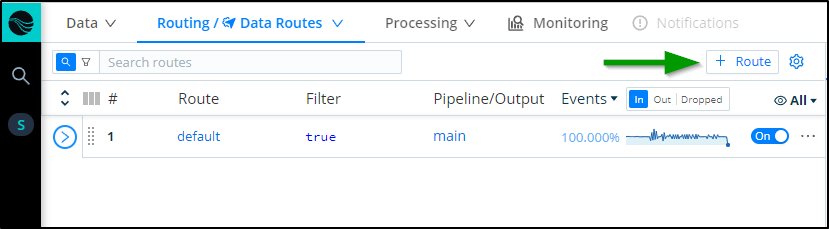
Now that we have a Source and Destination we can connect them with a Pipeline or a Route.
The most straightforward is a simple Route.
In the Routes area of Data, click “+ Route” to add a new Route:
We can now pick our bucket from the Output dropdown
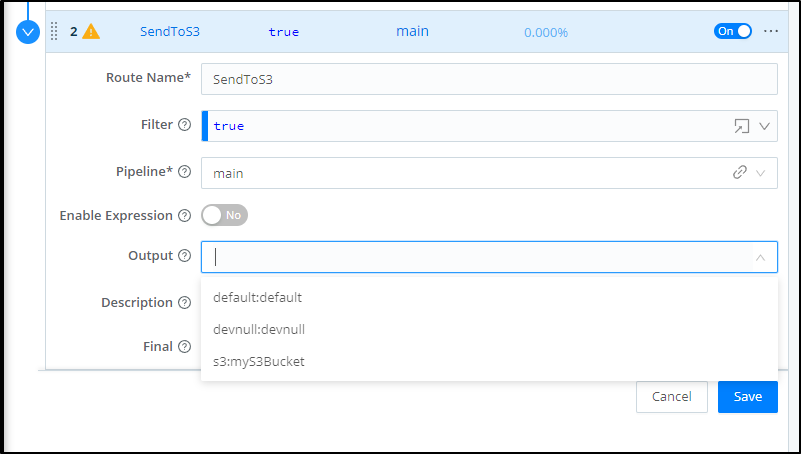
You can give it a Description then save to take effect
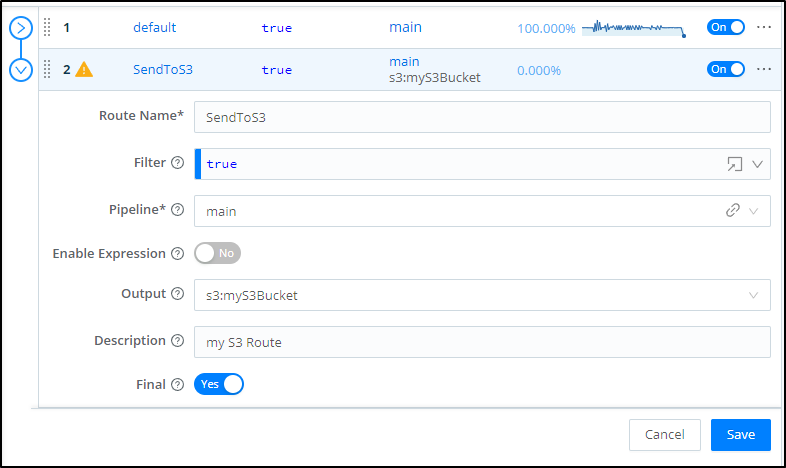
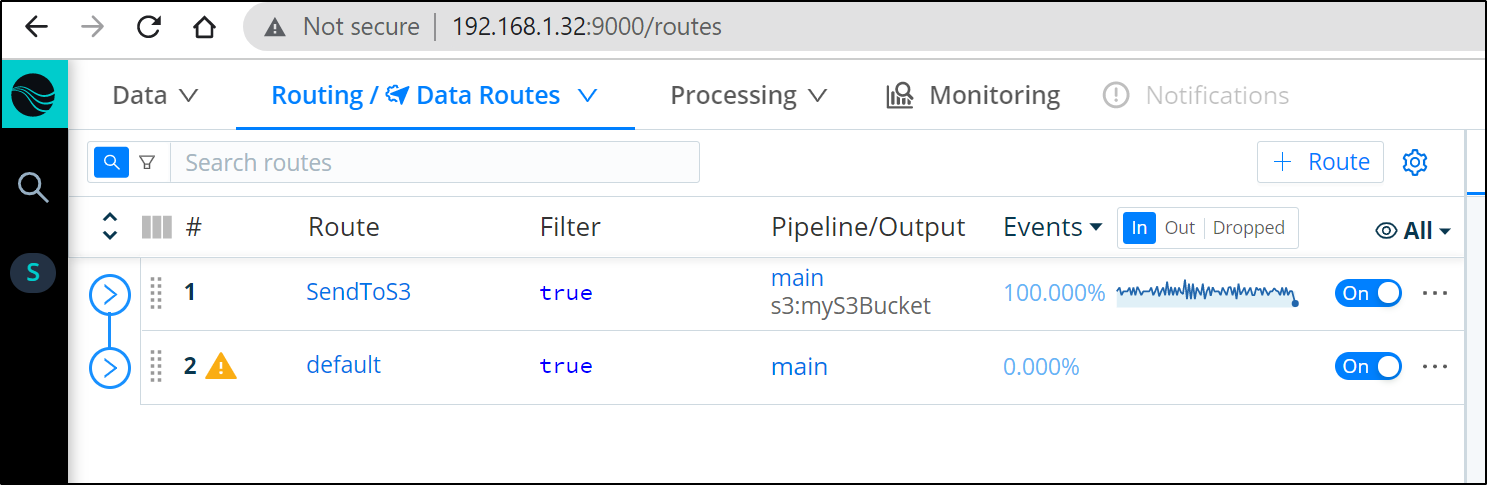
If I move this new Route to the top it will take precedence over default:
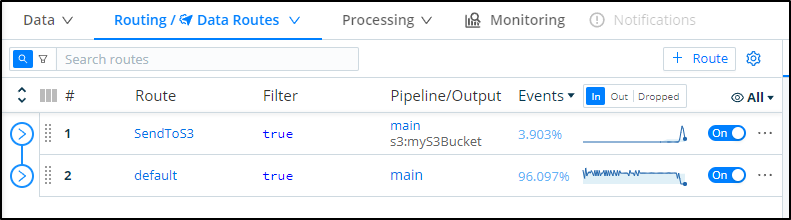
I can push some traffic onto my Dapr enabled pods with port-forward and curl and see the resulting traces propagate.
Now when I check the S3 bucket, I can see tgz’ed results
$ aws s3 ls s3://mycriblstorage/myPrefix/undefined/undefined/
2021-12-24 12:47:16       3253 CriblOut-Io1GKE.0.json.gz
2021-12-24 12:47:09     418316 CriblOut-iGJorr.1.json.gz
If we wish to see the contents, we can transfer it locally and extract it:
$ aws s3 cp s3://mycriblstorage/myPrefix/undefined/undefined/CriblOut-iGJorr.1.json.gz ./
download: s3://mycriblstorage/myPrefix/undefined/undefined/CriblOut-iGJorr.1.json.gz to ./CriblOut-iGJorr.1.json.gz

$ cat CriblOut-iGJorr.1.json | jq | head -n50
{
  "resource": {
    "dropped_attributes_count": 0,
    "attributes": {
      "service.name": "nodeeventwatcher"
    }
  },
  "schema_url": "",
  "instrumentation_library_span": {
    "instrumentation_library": {
      "name": "unknown",
      "version": "unknown"
    },
    "schema_url": ""
  },
  "trace_id": "82f20263fe433114924e1c6ff5939671",
  "span_id": "e3d6467be22df2d5",
  "trace_state": "",
  "parent_span_id": "",
  "name": "bindings/kubeevents",
  "kind": 2,
  "start_time_unix_nano": 1640371327433450000,
  "end_time_unix_nano": 1640371327433977000,
  "attributes": {
    "db.connection_string": "POST /kubeevents",
    "db.name": "kubeevents",
    "db.system": "bindings",
    "opencensus.status_description": "OK",
    "rpc.service": "Dapr",
    "net.host.ip": "10.42.1.10"
  },
  "dropped_attributes_count": 0,
  "events": [],
  "dropped_events_count": 0,
  "links": [],
A typical section looks as such:
{
  "resource": {
    "dropped_attributes_count": 0,
    "attributes": {
      "service.name": "nodeeventwatcher"
    }
  },
  "schema_url": "",
  "instrumentation_library_span": {
    "instrumentation_library": {
      "name": "unknown",
      "version": "unknown"
    },
    "schema_url": ""
  },
  "trace_id": "efe1e974196e77640e09271264b56f22",
  "span_id": "dd8e1bc0887fffd7",
  "trace_state": "",
  "parent_span_id": "",
  "name": "bindings/kubeevents",
  "kind": 2,
  "start_time_unix_nano": 1640371442420920000,
  "end_time_unix_nano": 1640371442421904000,
  "attributes": {
    "db.system": "bindings",
    "opencensus.status_description": "OK",
    "rpc.service": "Dapr",
    "db.connection_string": "POST /kubeevents",
    "db.name": "kubeevents",
    "net.host.ip": "10.42.1.10"
  },
  "dropped_attributes_count": 0,
  "events": [],
  "dropped_events_count": 0,
  "links": [],
  "dropped_links_count": 0,
  "status": {
    "code": 0,
    "message": ""
  },
  "_time": 1640371443.286,
  "cribl": "yes",
  "cribl_pipe": "main"
}
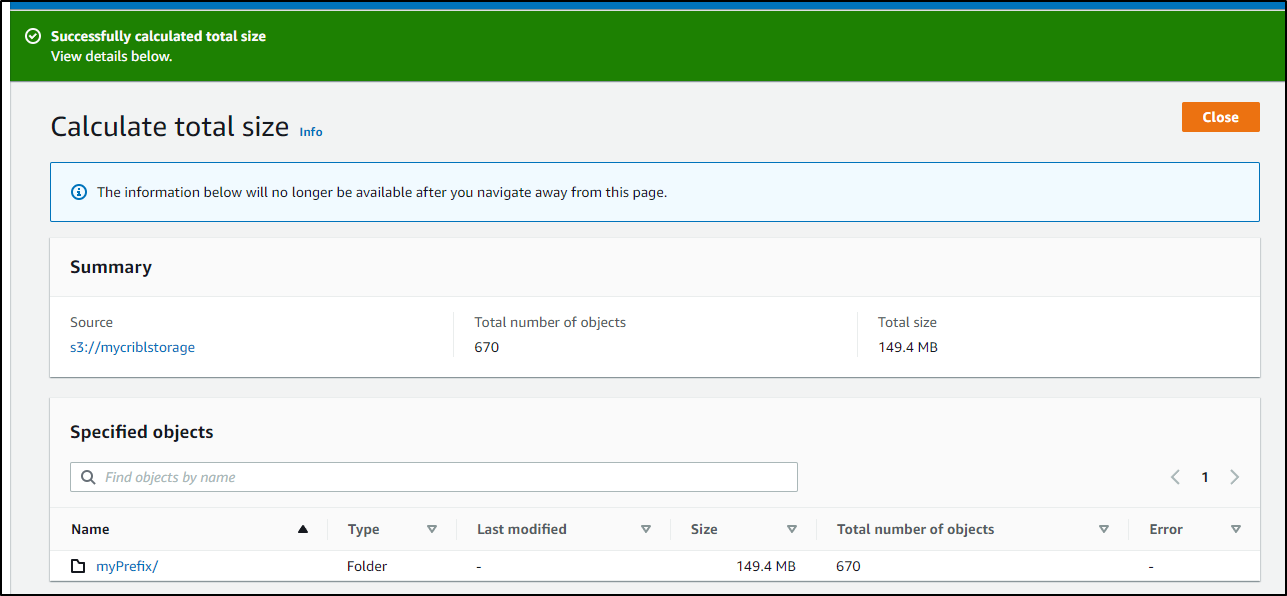
I let it run for a couple days and soon had over 600 files
$ aws s3 ls s3://mycriblstorage/myPrefix/undefined/undefined/ | wc -l
668

$ aws s3 ls s3://mycriblstorage/myPrefix/undefined/undefined/ | tail -n5
2021-12-25 14:46:52     423836 CriblOut-zaxotQ.1.json.gz
2021-12-25 00:27:28     417793 CriblOut-zjtS5c.1.json.gz
2021-12-25 09:38:19     417662 CriblOut-zqDHAY.1.json.gz
2021-12-25 12:05:10     408570 CriblOut-zudofs.1.json.gz
2021-12-24 14:46:06       3391 CriblOut-zyxIUT.0.json.gz
But if I total the size, its just 150Mb which should amount to about US$0.01 in monthly costs.
Sending to NFS
While S3 is great, perhaps we want to use on-prem storage. An easy way to access such storage is using NFS.
If our Logstream host lacks CIFS, we need to add that to access NFS storage mounts
$ sudo apt install -y cifs-utils
[sudo] password for builder:
Reading package lists... Done
Building dependency tree
Reading state information... Done
The following packages were automatically installed and are no longer required:
  libfprint-2-tod1 libllvm10
Use 'sudo apt autoremove' to remove them.
Suggested packages:
  keyutils smbclient winbind
The following NEW packages will be installed:
  cifs-utils
0 upgraded, 1 newly installed, 0 to remove and 50 not upgraded.
Need to get 82.5 kB of archives.
After this operation, 306 kB of additional disk space will be used.
Get:1 http://us.archive.ubuntu.com/ubuntu focal-updates/main amd64 cifs-utils amd64 2:6.9-1ubuntu0.1 [82.5 kB]
Fetched 82.5 kB in 0s (281 kB/s)
Selecting previously unselected package cifs-utils.
(Reading database ... 226144 files and directories currently installed.)
Preparing to unpack .../cifs-utils_2%3a6.9-1ubuntu0.1_amd64.deb ...
Unpacking cifs-utils (2:6.9-1ubuntu0.1) ...
Setting up cifs-utils (2:6.9-1ubuntu0.1) ...
update-alternatives: using /usr/lib/x86_64-linux-gnu/cifs-utils/idmapwb.so to provide /etc/cifs-utils/idmap-plugin (idmap-plugin) in auto mode
Processing triggers for man-db (2.9.1-1) ...
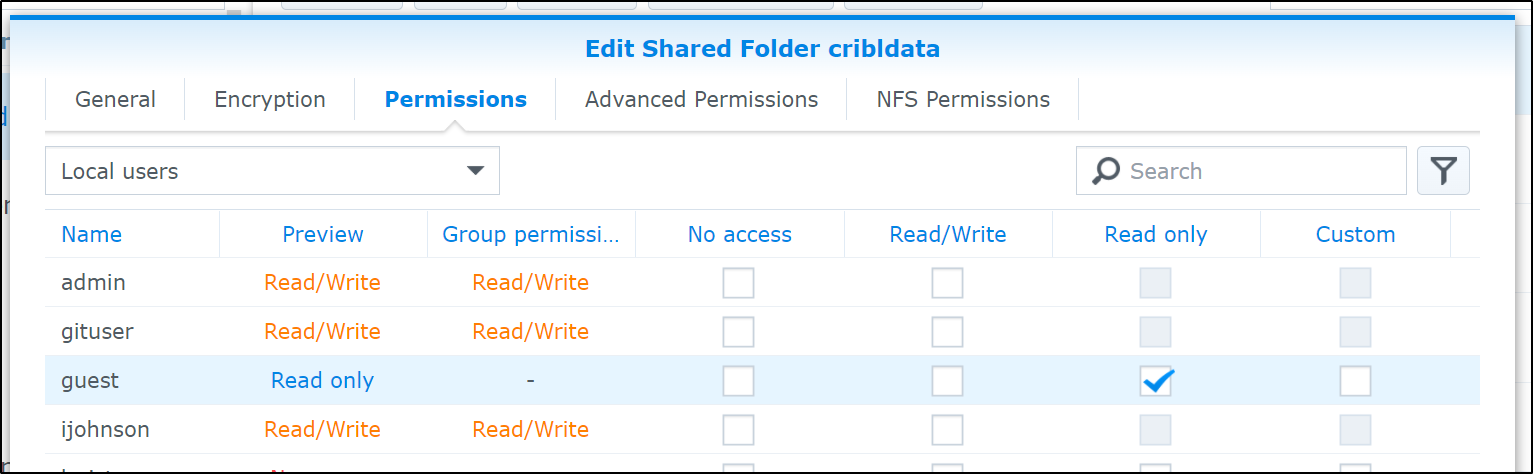
I’ll need to create an NFS share on my NAS (Synology)
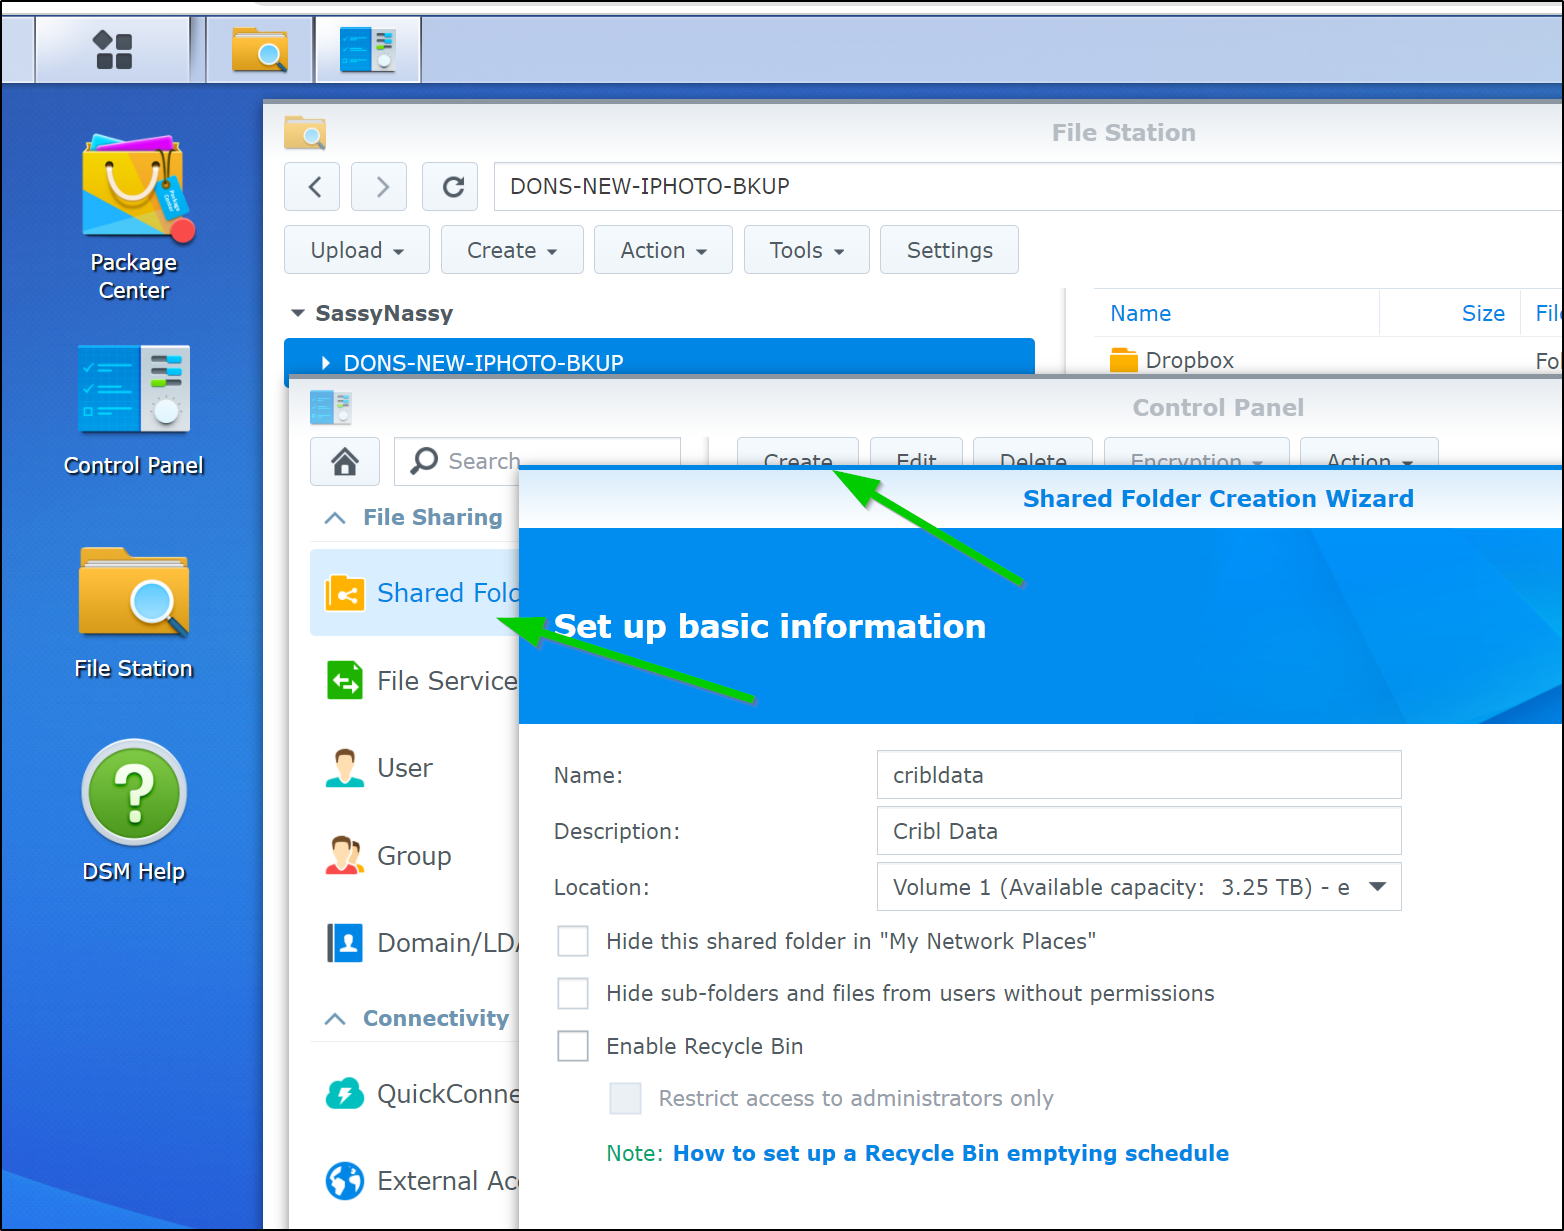
I did enable Guest access
$ SMB_USER=ijohnson
$ SMB_PASS=**************
$ SMB_SERV="//sassynassy/cribldata"
$ sudo mount -t cifs -o username=$SMB_USER,password=$SMB_PASS,noperm,vers=2.0 $SMB_SERV /mnt/mynas
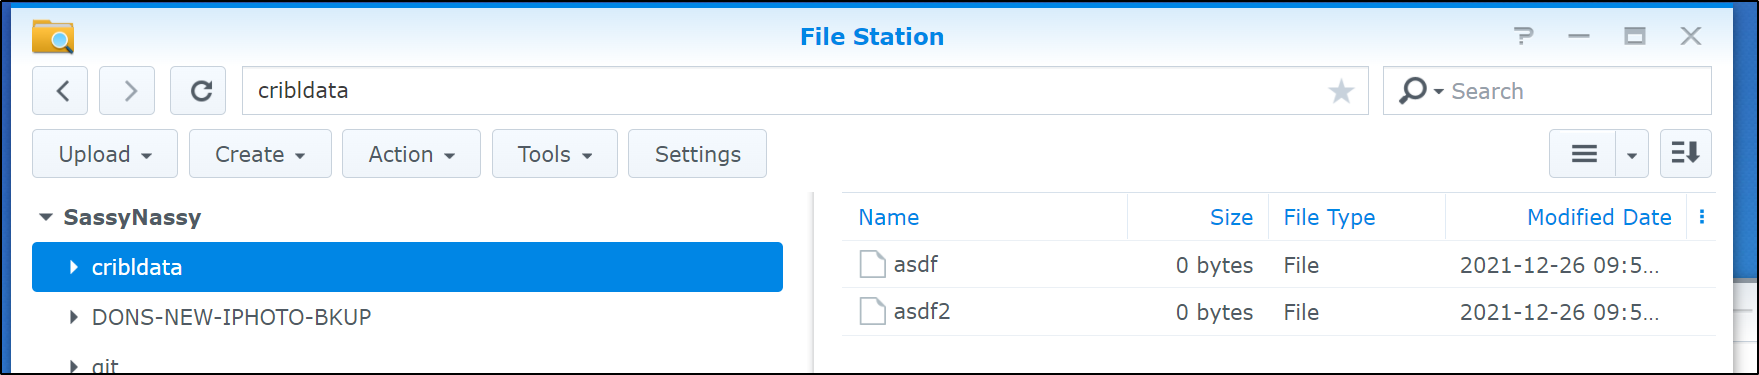
$ touch /mnt/mynas/asdf
$ touch /mnt/mynas/asdf2
$ ls /mnt/mynas/
asdf asdf2
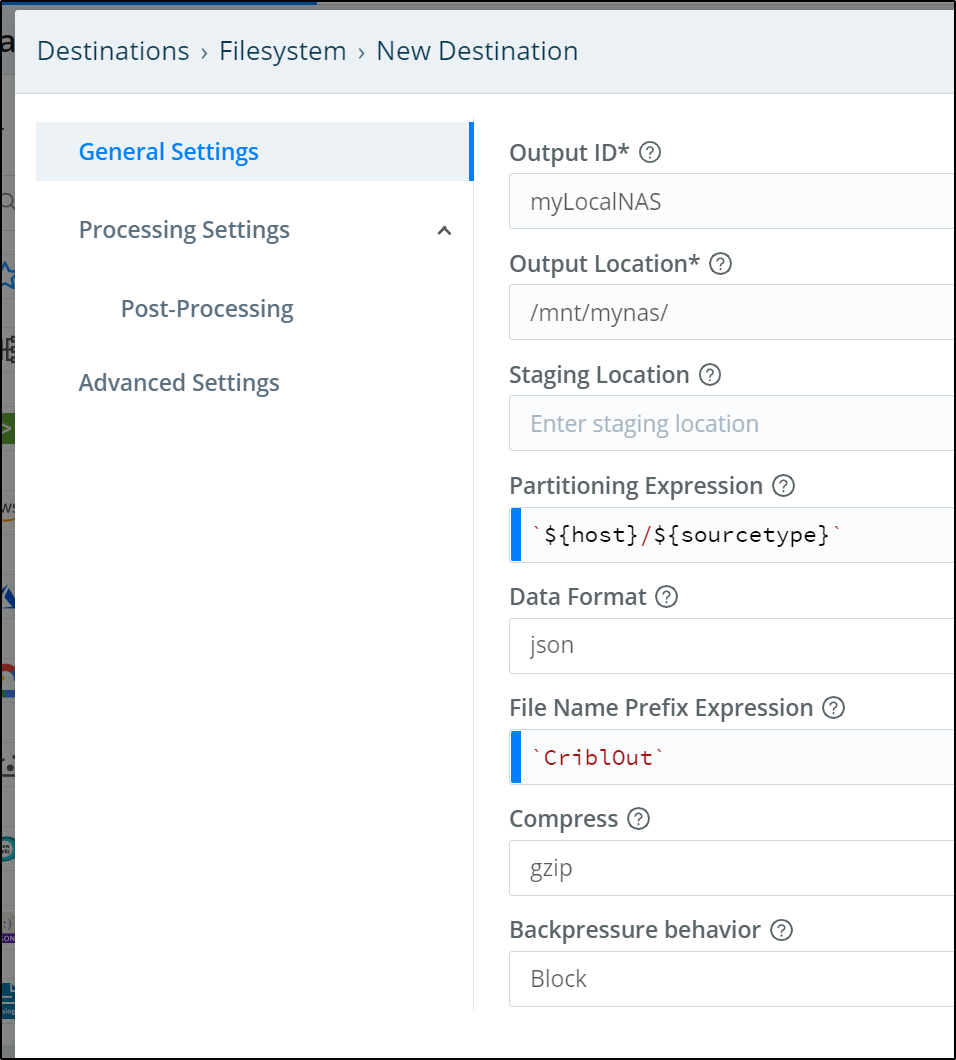
We now need to create a new Destination. We click “+ Add New” in teh Data/Destinations area.
We will give it a name and output location. The Output location is a local filesystem that matches our NFS mount locally.
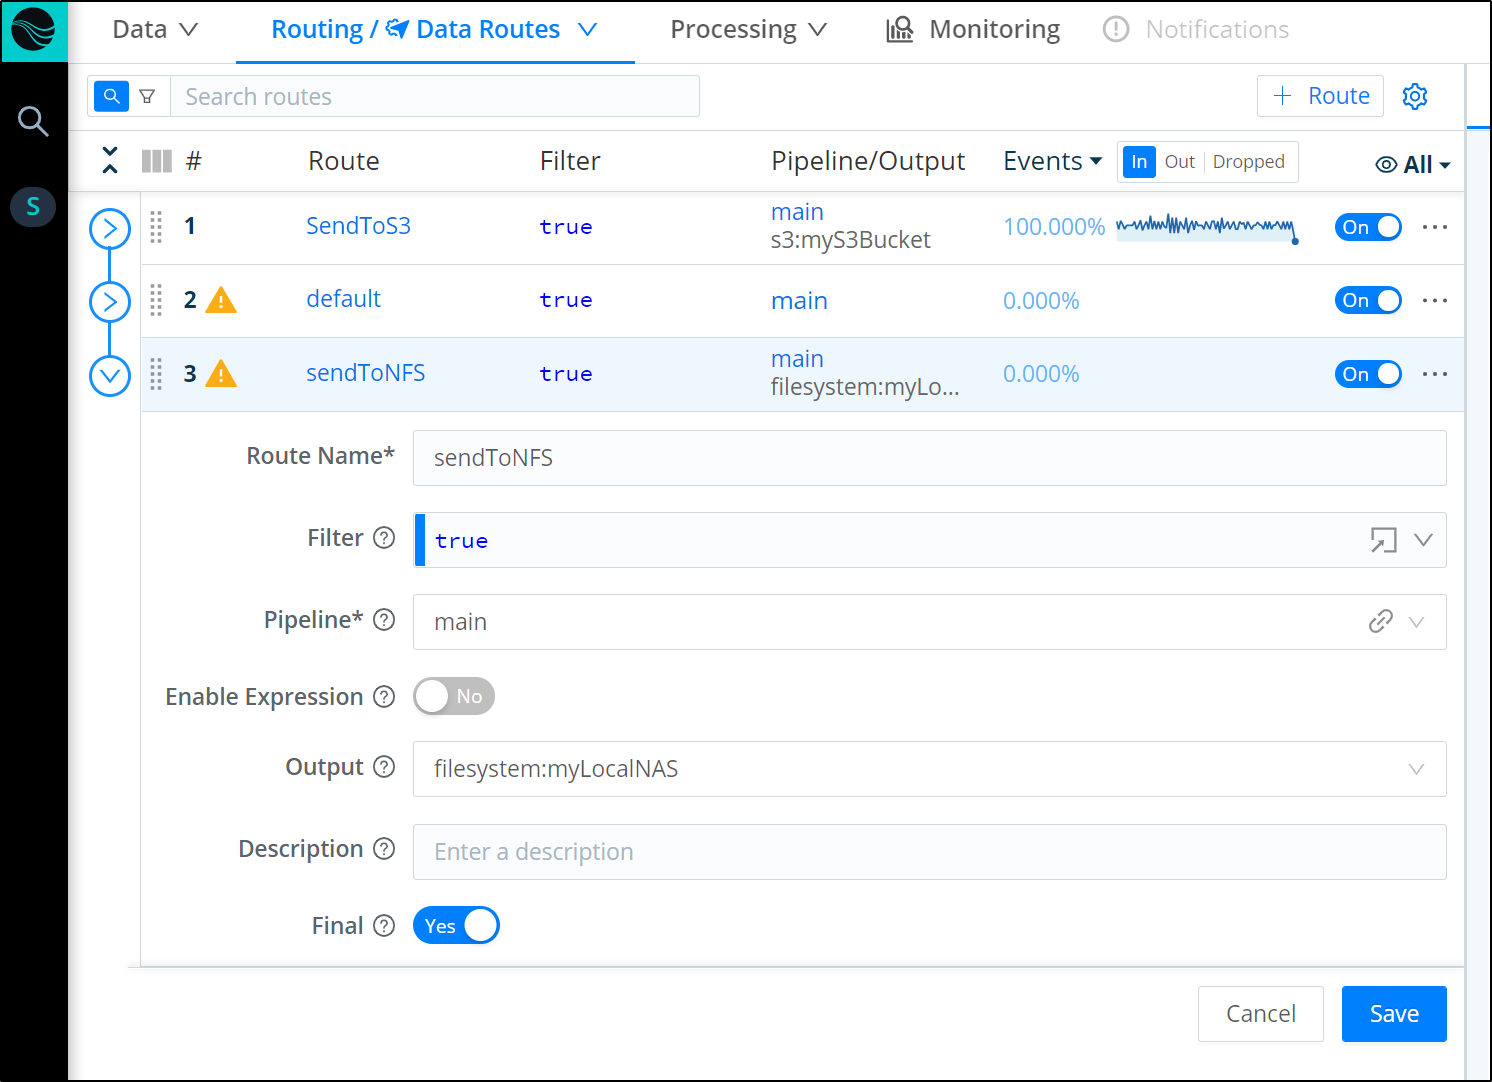
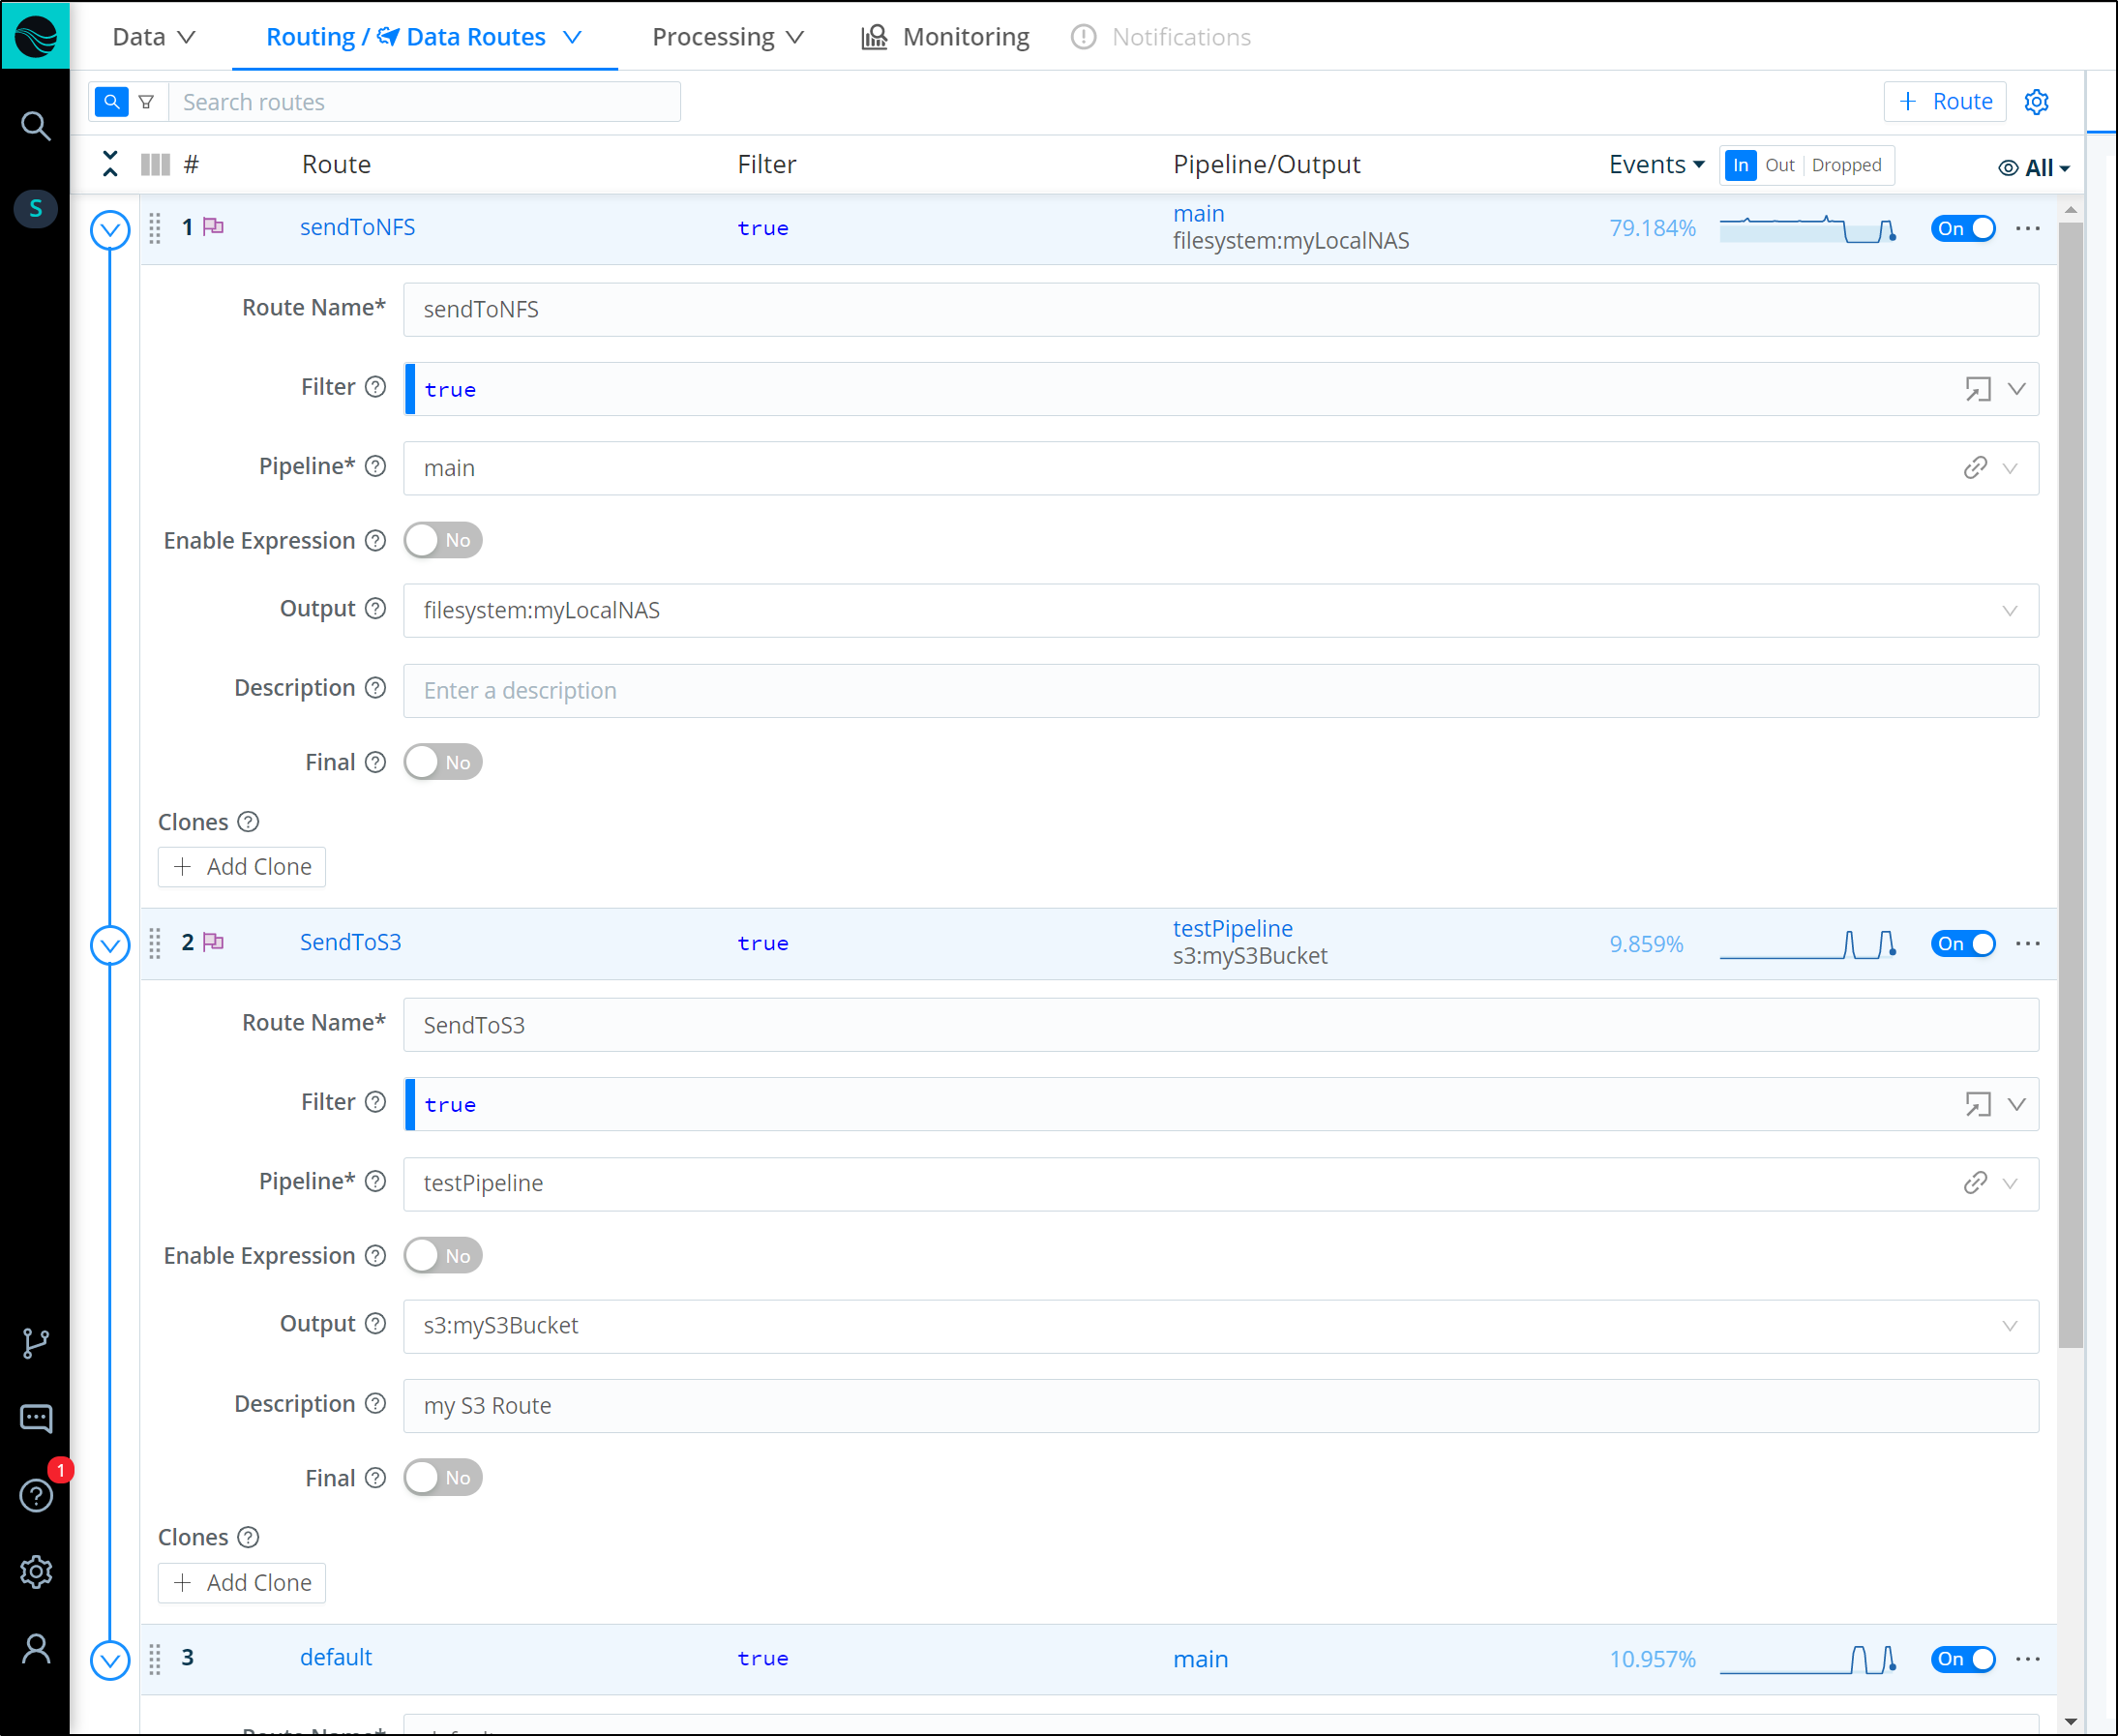
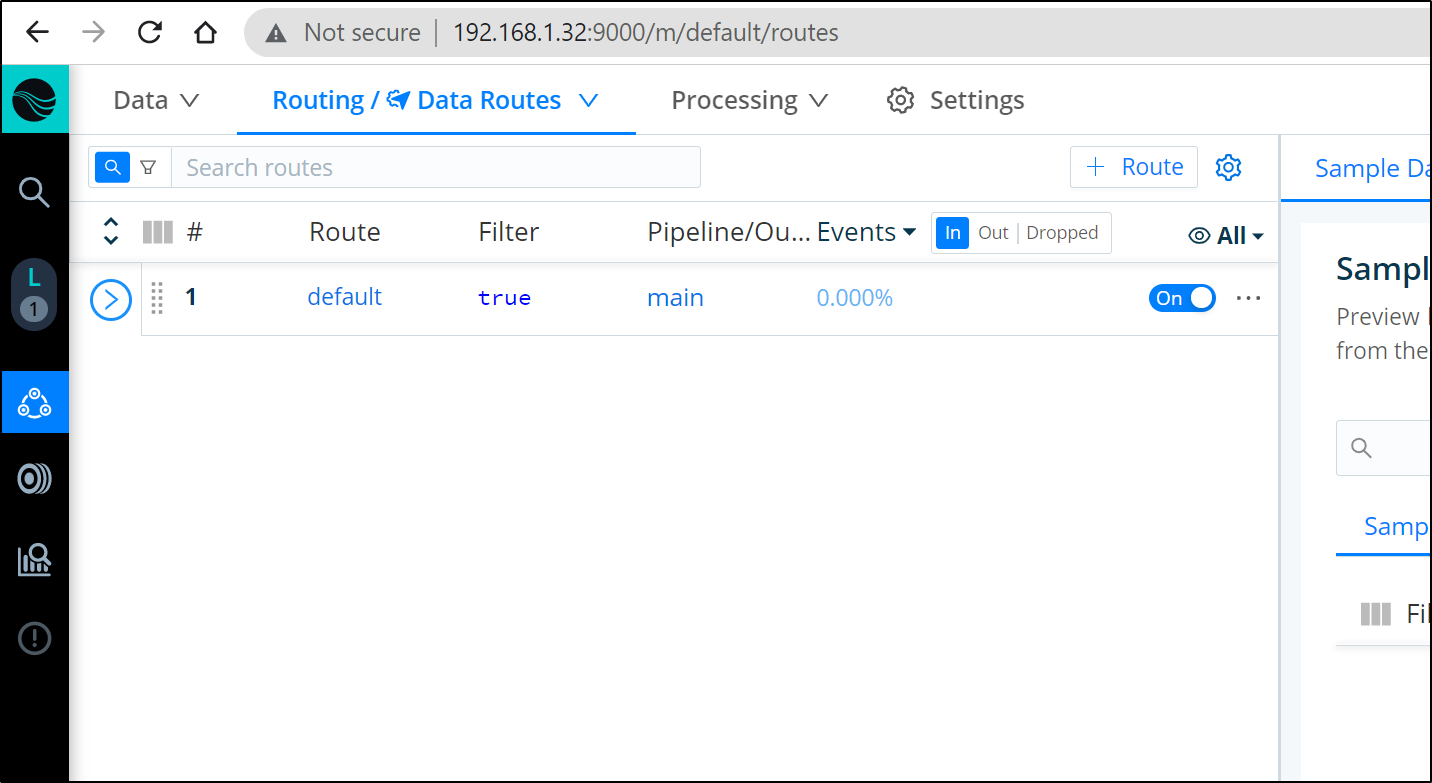
Next we create a route to the Destination making sure to mark it final (below shows defaulted “Final”). Final means that it will stop here (and no proceed further)
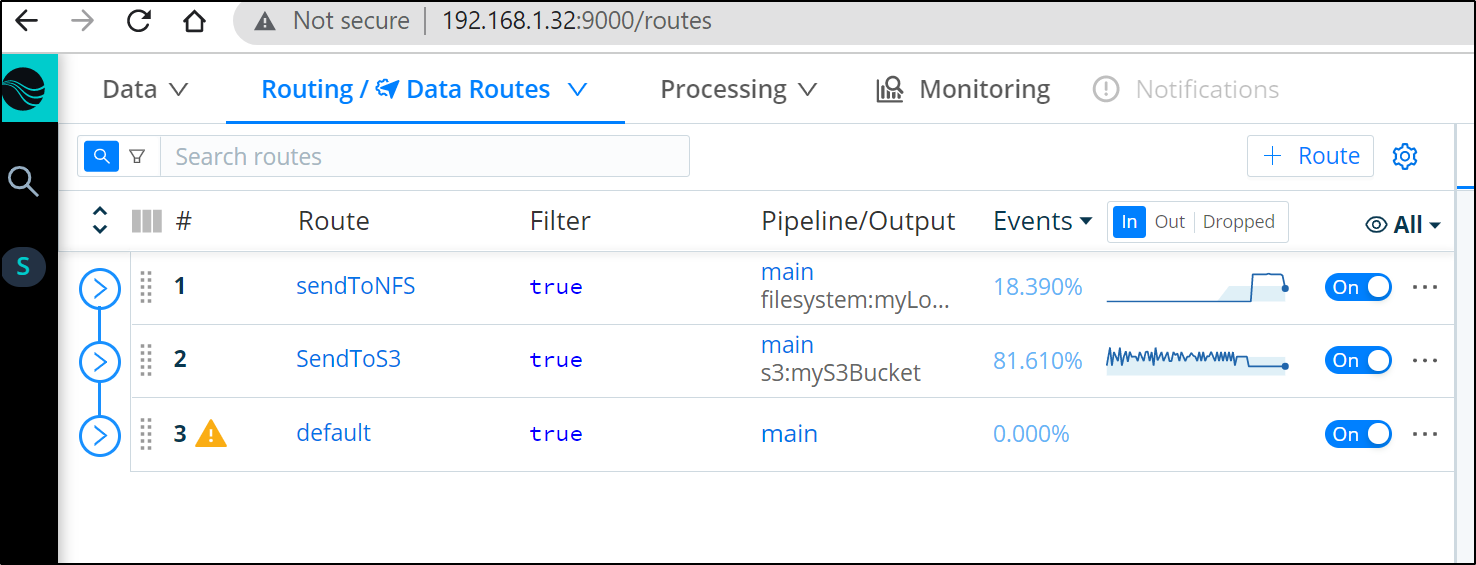
We see presently it is at the end, so we will send to S3, default then onto “sendToNFS” at the end.
We can move our new route to the top to take precedence over other Routes using the main pipeline
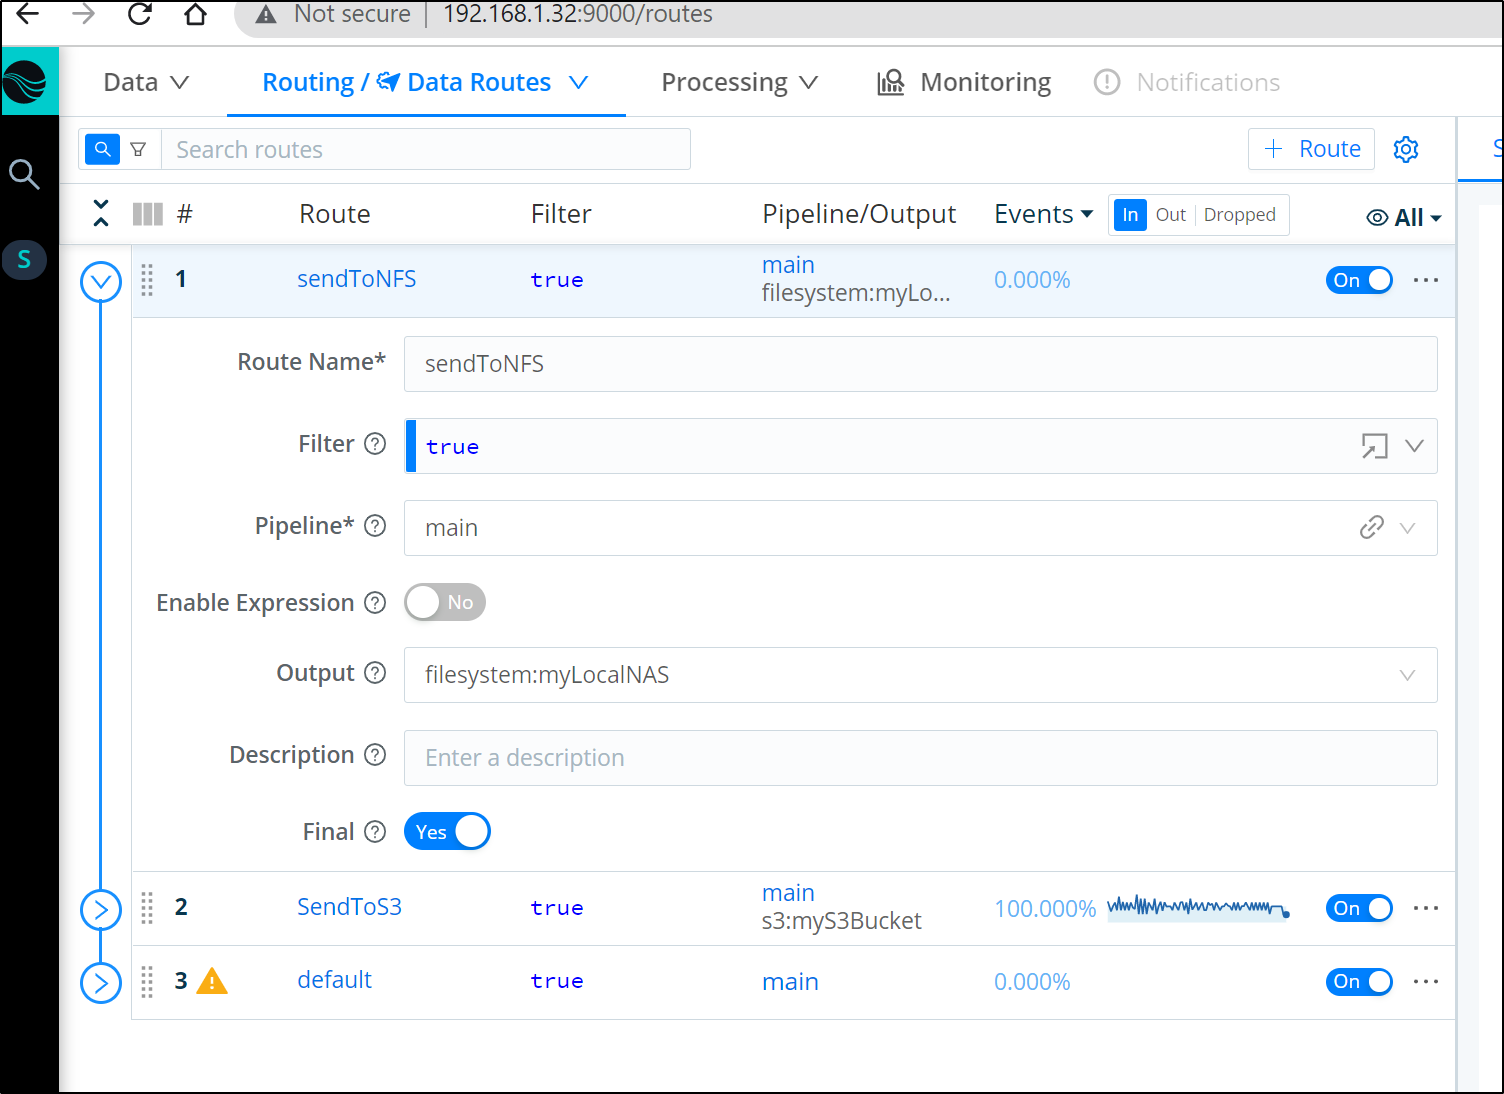
we soon see traffic routing to the NAS instead of S3. The reason it does not do both is because we marked “sendToNFS” as Final.
We can see the data populating in NFS
builder@builder-HP-EliteBook-745-G5:~$ ls /mnt/mynas/myLocalNAS/
CriblOpenFiles.0.json  CriblOpenFiles.2.json  CriblOpenFiles.4.json  undefined
CriblOpenFiles.1.json  CriblOpenFiles.3.json  CriblOpenFiles.5.json
builder@builder-HP-EliteBook-745-G5:~$ ls /mnt/mynas/myLocalNAS/undefined/undefined/
CriblOut-Blp4eI.0.json.tmp  CriblOut-EJsAS7.1.json.tmp
builder@builder-HP-EliteBook-745-G5:~$
And after a few hours we can see that grow:
$ du -chs ./undefined/
41M     ./undefined/
41M     total
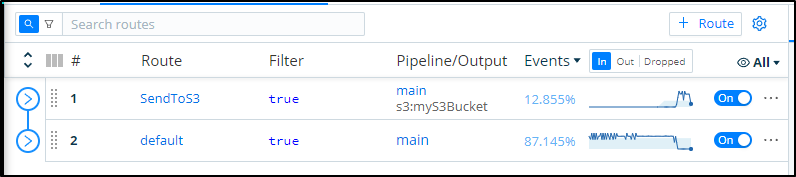
Multiple routes
If you set a route as “final”, that stops from sending data onto more routes. This is on by default when we add a Route.
Therefore, to send data to S3 and NFS, we would need to set the Routes as not final.
we can see one of the key services is the “nodeeventwatcher”
builder@builder-HP-EliteBook-745-G5:/tmp$ cat CriblOut-EJsAS7.1.json | grep nodeeventwatcher | wc -l
4082
builder@builder-HP-EliteBook-745-G5:/tmp$ cat CriblOut-EJsAS7.1.json | wc -l
8231
Adding a workgroup
Note: Once I switched to workgroup, this broke my use of filesystem NAS access as the work moved to the pods, consider any local mounts you have when switching modes
We can add another worker. In the free tier, we are limited to one additional workgroup.
First, in the current Logstream instance, we need to set it as leader and generate a token:
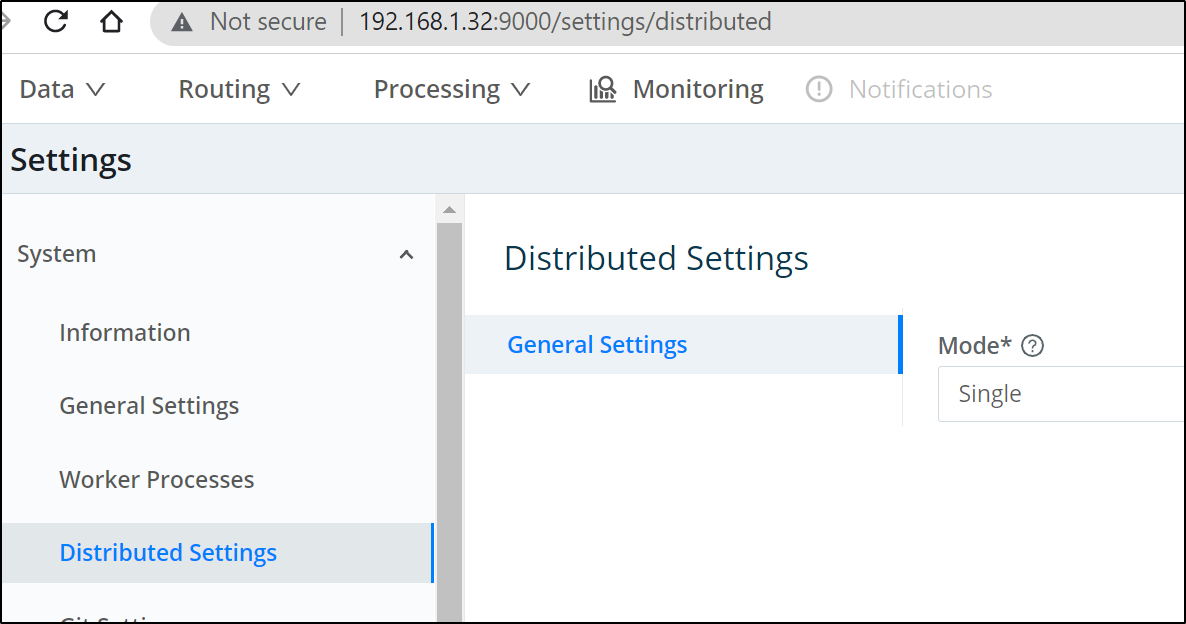
Switch to Leader
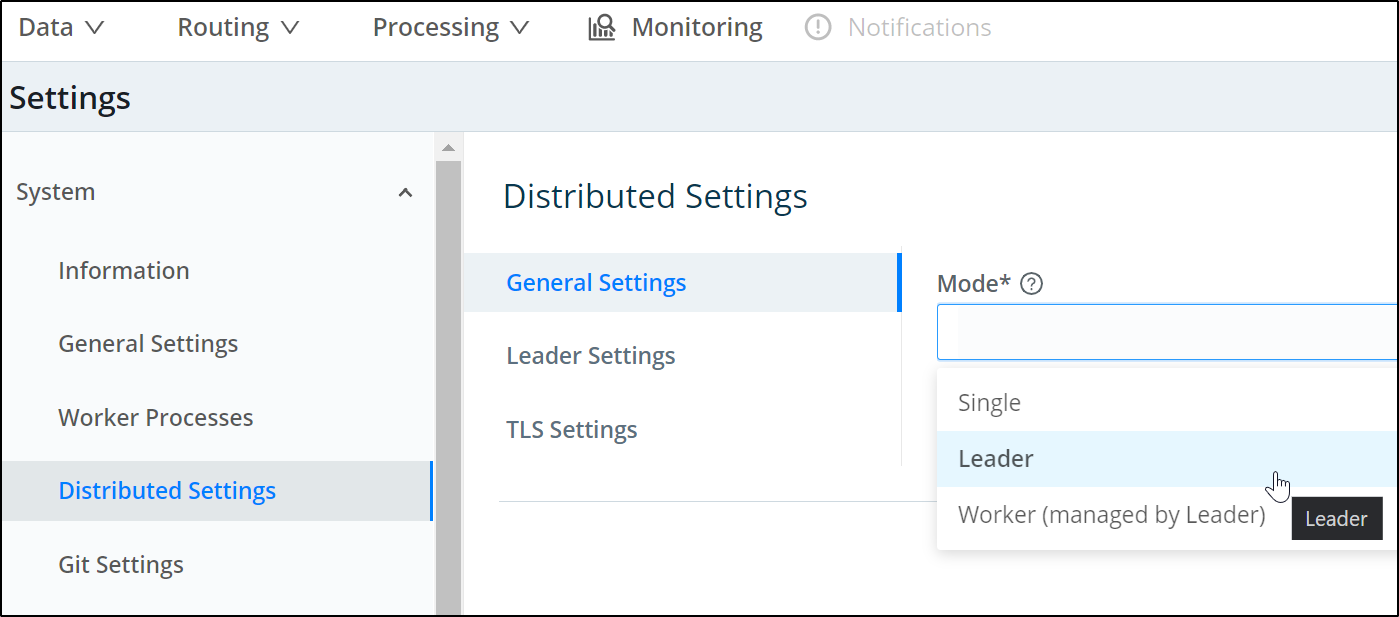
in the Leader settings, we need to generate or set a token. This will be used to add Workers
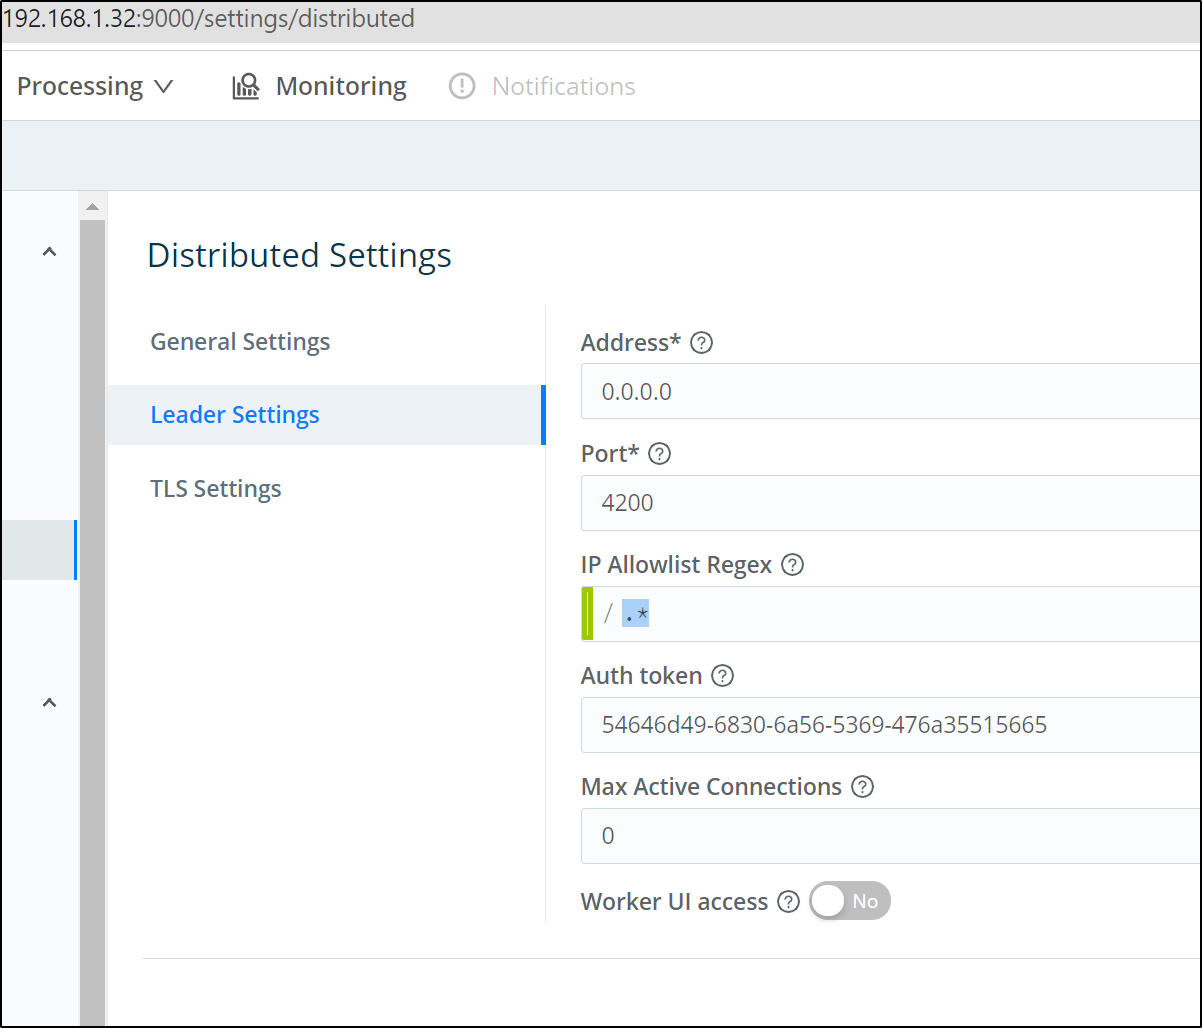
If you get an error about “git is required”, it just means your host lacks git. In my case, i just needed to log into 192.168.1.32 and apt install git-all.
Then, we can add the helm chart, update and install into our cluster.
builder@DESKTOP-72D2D9T:~/Workspaces/jekyll-blog$ kubectl create namespace logstream
namespace/logstream created
builder@DESKTOP-72D2D9T:~/Workspaces/jekyll-blog$ helm repo add cribl https://criblio.github.io/helm-charts/
WARNING: Kubernetes configuration file is group-readable. This is insecure. Location: /home/builder/.kube/config
WARNING: Kubernetes configuration file is world-readable. This is insecure. Location: /home/builder/.kube/config
"cribl" has been added to your repositories
builder@DESKTOP-72D2D9T:~/Workspaces/jekyll-blog$ helm repo update
WARNING: Kubernetes configuration file is group-readable. This is insecure. Location: /home/builder/.kube/config
WARNING: Kubernetes configuration file is world-readable. This is insecure. Location: /home/builder/.kube/config
Hang tight while we grab the latest from your chart repositories...
...Successfully got an update from the "cribl" chart repository
...Successfully got an update from the "actions-runner-controller" chart repository
Update Complete. ⎈Happy Helming!⎈

$ helm install ls-wg-pci cribl/logstream-workergroup --set config.host="192.168.1.32" --set config.tag="myk3s" --set config.token="43707939-6256-4c67-4844-707142716e76" -n logstream
WARNING: Kubernetes configuration file is group-readable. This is insecure. Location: /home/builder/.kube/config
WARNING: Kubernetes configuration file is world-readable. This is insecure. Location: /home/builder/.kube/config
NAME: ls-wg-pci
LAST DEPLOYED: Mon Dec 27 19:06:12 2021
NAMESPACE: logstream
STATUS: deployed
REVISION: 1
TEST SUITE: None
We can see it launching:
$ kubectl get pods -n logstream
NAME                                               READY   STATUS              RESTARTS   AGE
svclb-ls-wg-pci-logstream-workergroup-rslkj        0/7     ContainerCreating   0          39s
svclb-ls-wg-pci-logstream-workergroup-4klwg        7/7     Running             0          39s
svclb-ls-wg-pci-logstream-workergroup-8kbjd        7/7     Running             0          39s
svclb-ls-wg-pci-logstream-workergroup-ktkwk        7/7     Running             0          39s
svclb-ls-wg-pci-logstream-workergroup-mz5fh        7/7     Running             0          39s
svclb-ls-wg-pci-logstream-workergroup-87nkn        7/7     Running             0          39s
ls-wg-pci-logstream-workergroup-5db57c45cb-v8bps   0/1     Running             0          39s
ls-wg-pci-logstream-workergroup-5db57c45cb-nj8w4   0/1     ContainerCreating   0          24s
Soon we can see the Workers added to our Leader:
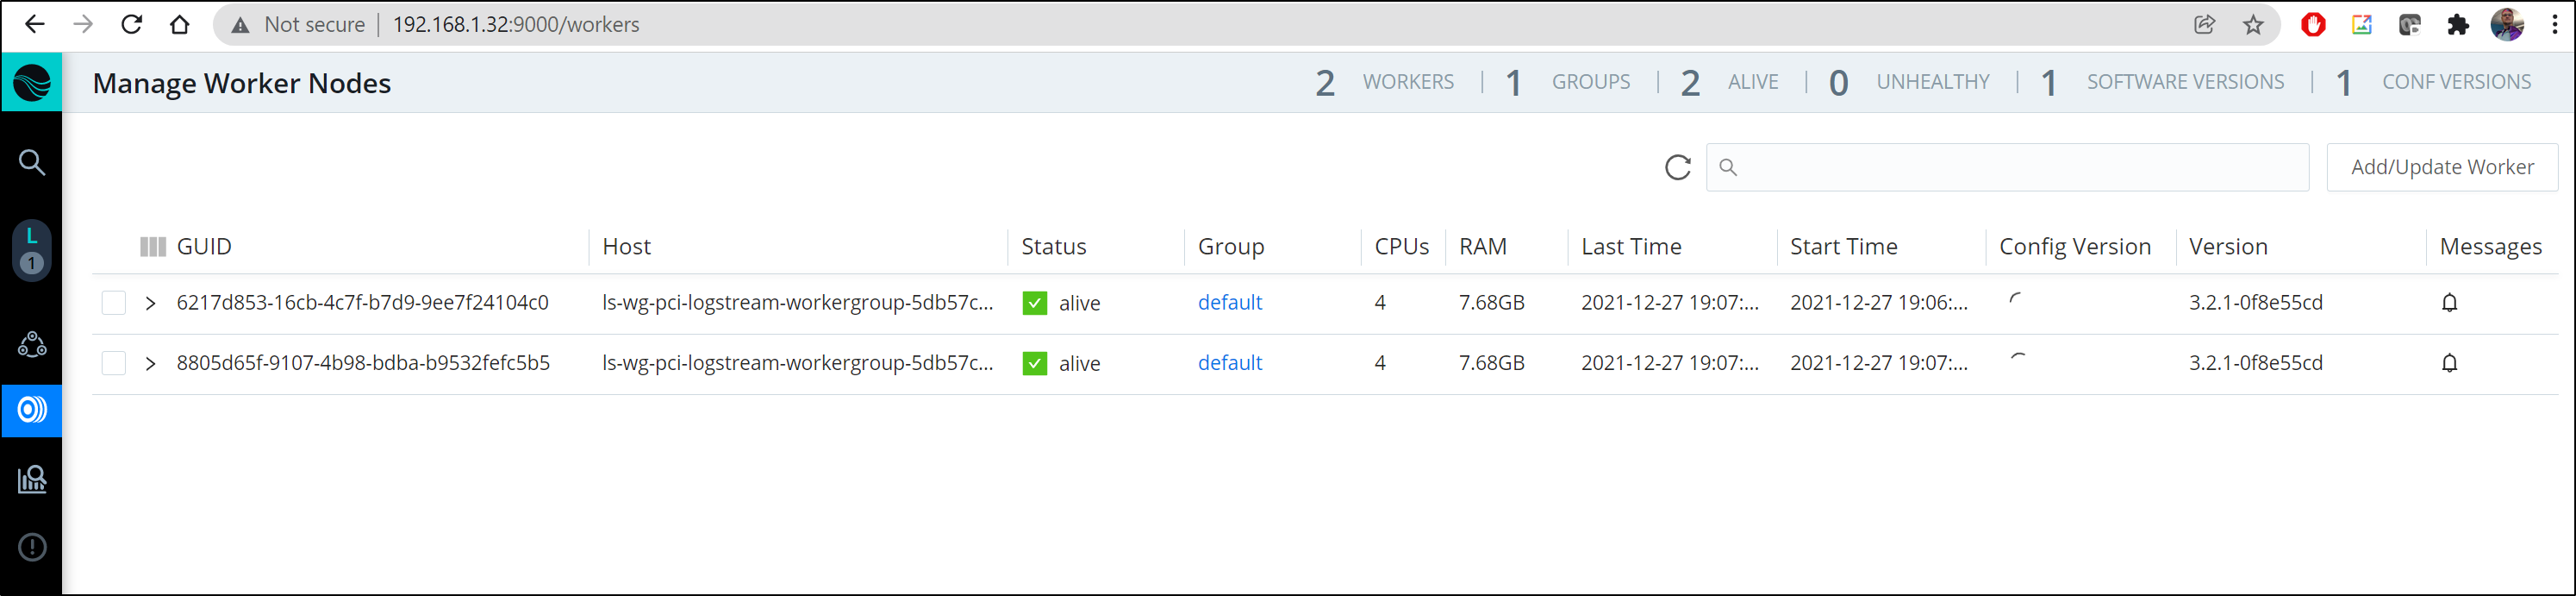
Sadly, as we had no git, in switching to leader mode, I lost the Routes and Logs I had set up.
GCP App Engine Logs
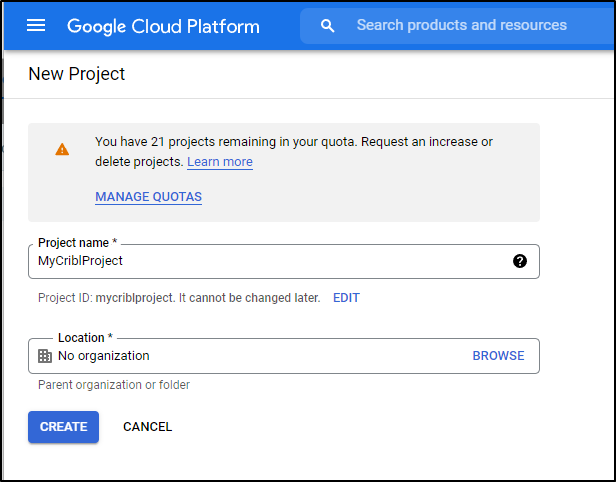
First, let’s create a new Project in GCP
Make sure to select the project, then move onto APIs Overview
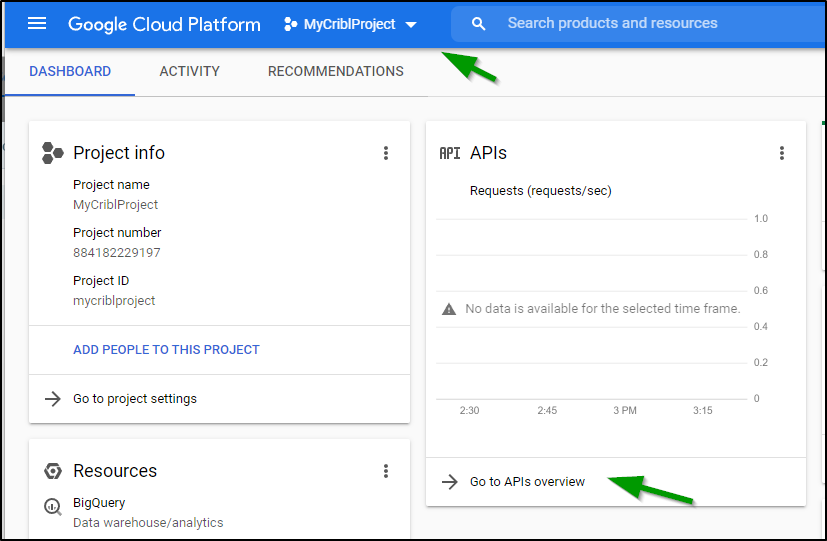
From there click Manage Service Accounts
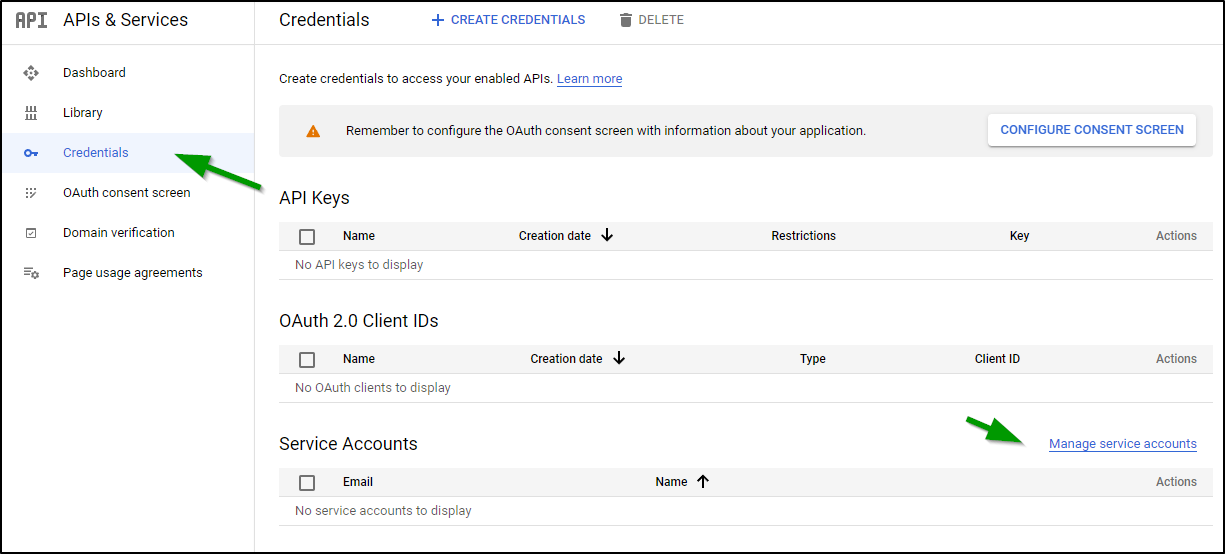
Here we can create a Service Account
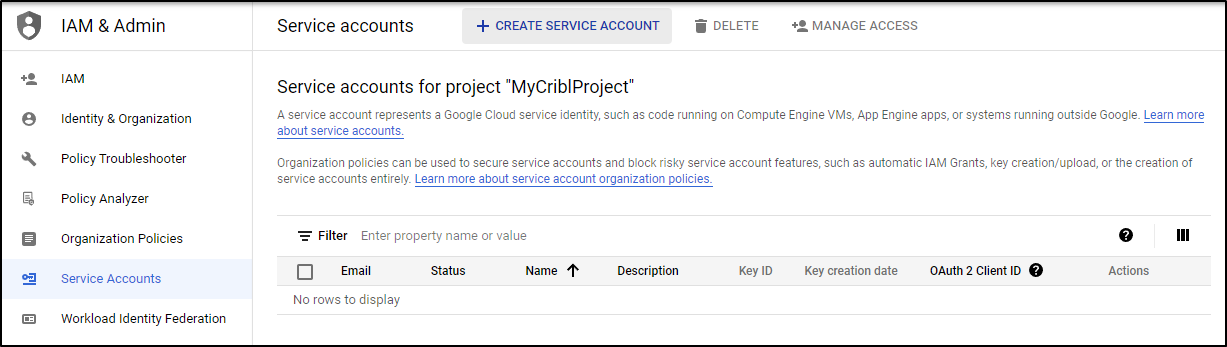
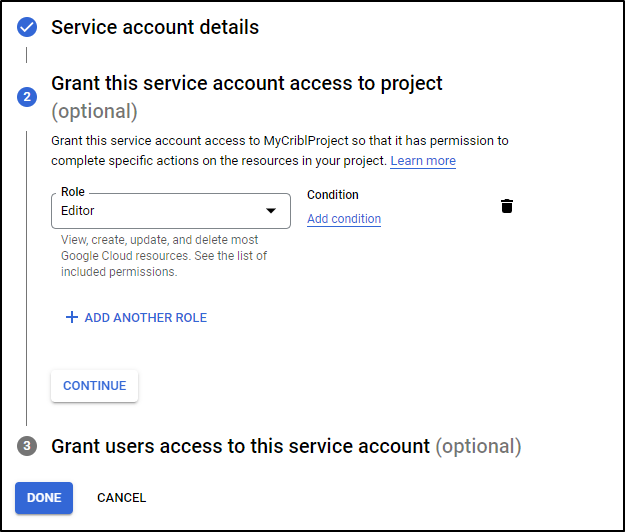
We can give it a name
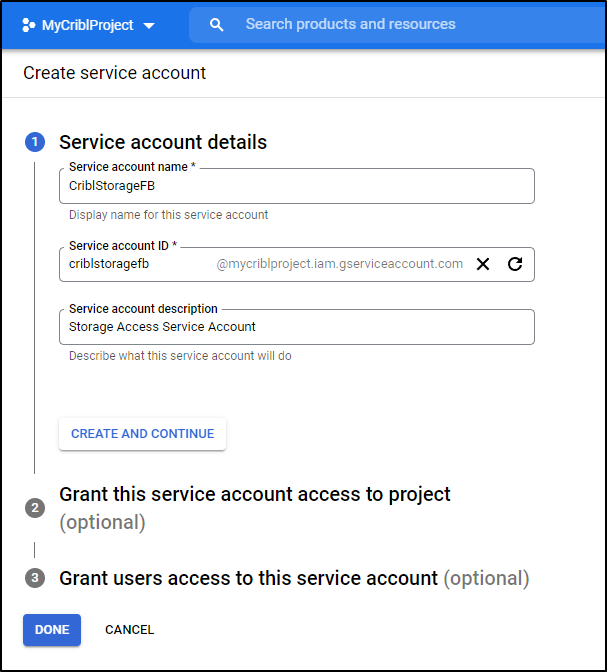
and grant as Editor
Once created we can Add a Key
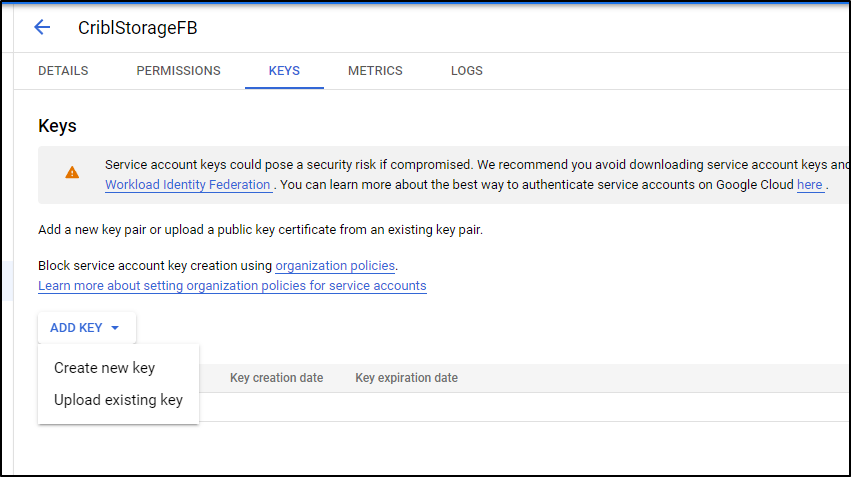
We create as type JSON
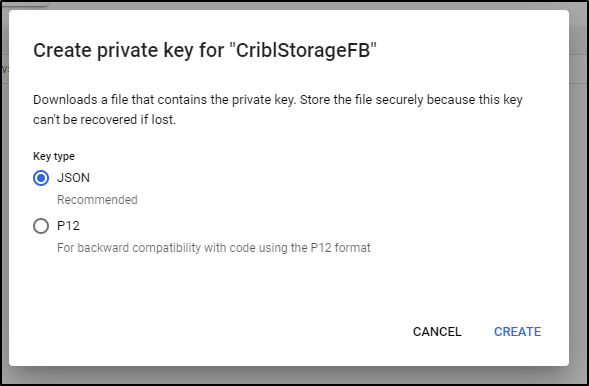
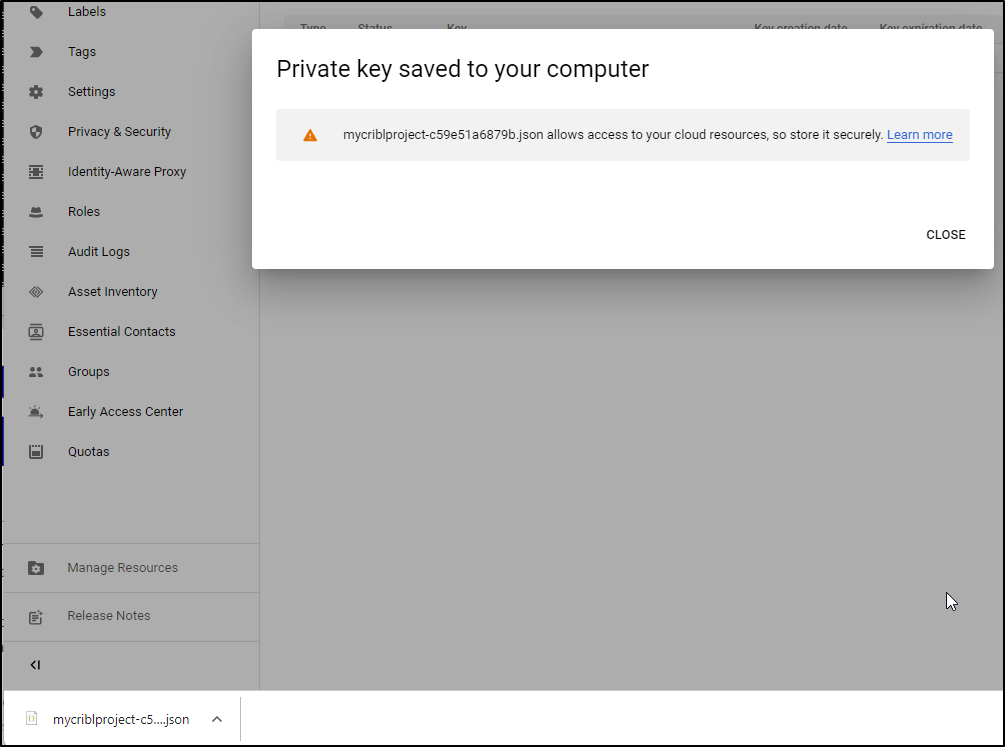
This saves it locally for our use in Cribl LogStream
Next, we need a Cloud Bucket. We can create that under Cloud storage
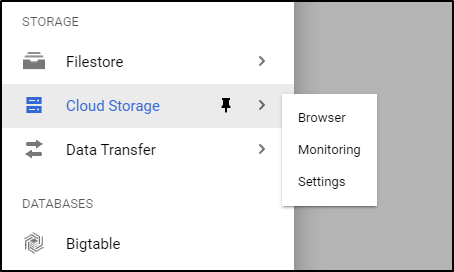
You can click “+ Create bucket” at the top or the blue “Create Bucket” button
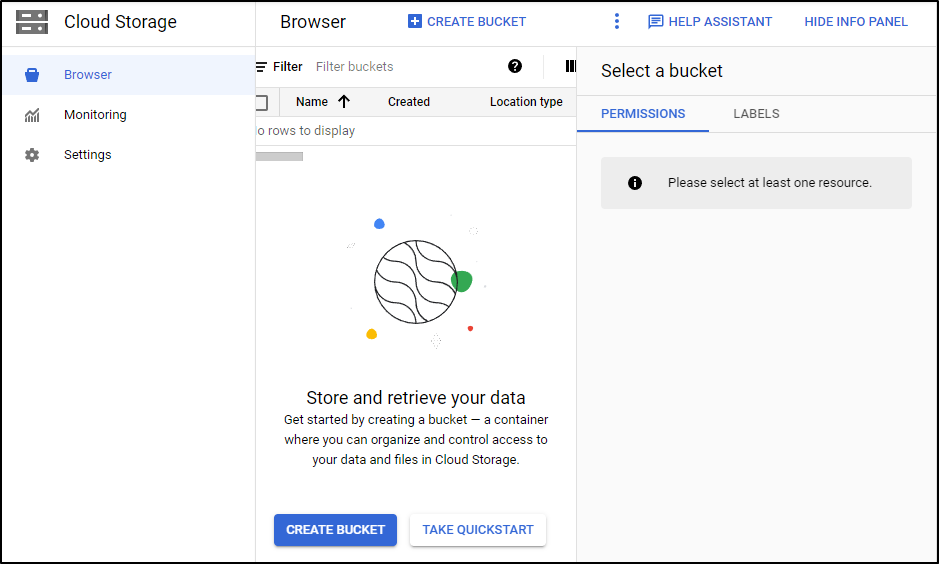
We can now start the wizard for the bucket
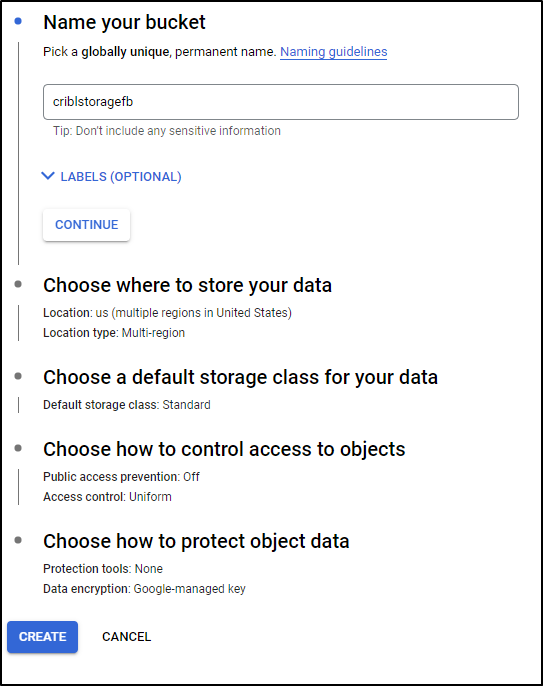
To minimize cost, I’ll set it to just Region
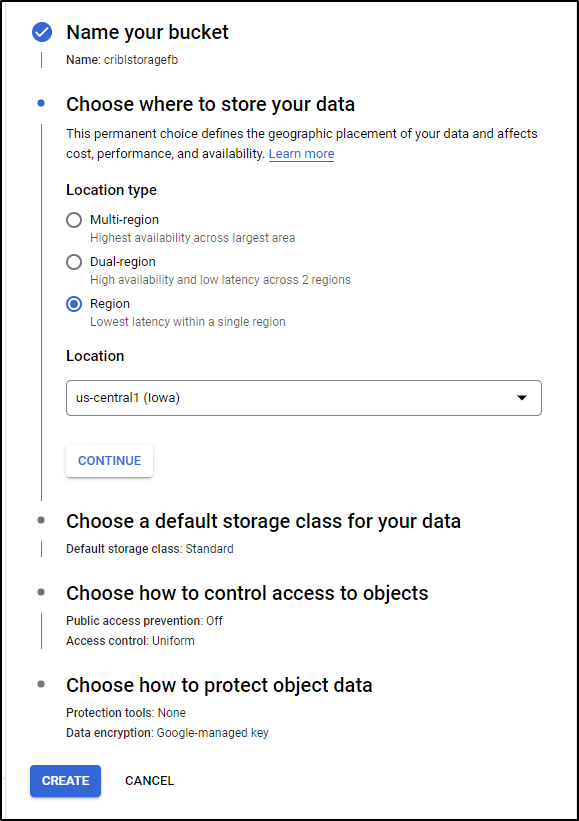
And Standard Tier
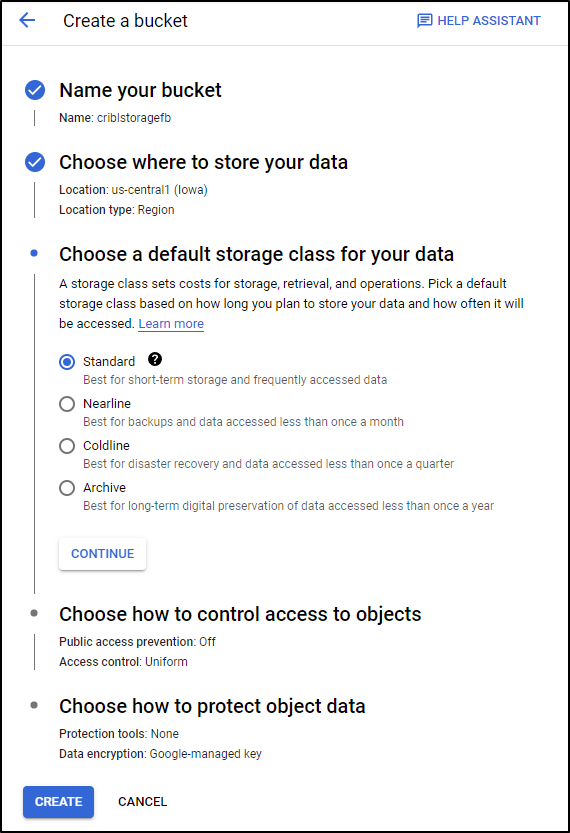
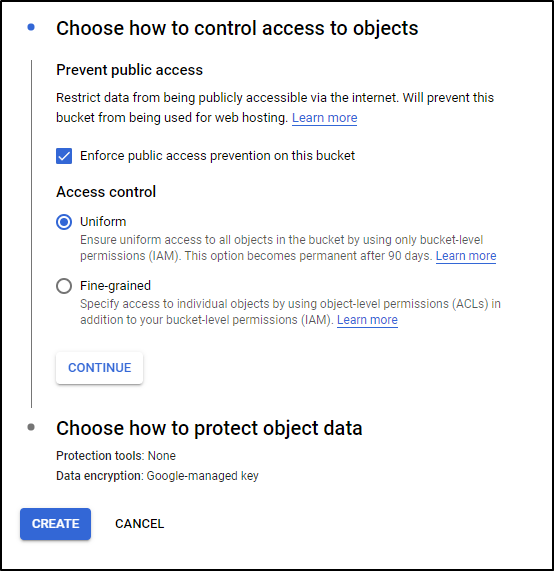
And we can set it to prevent public access
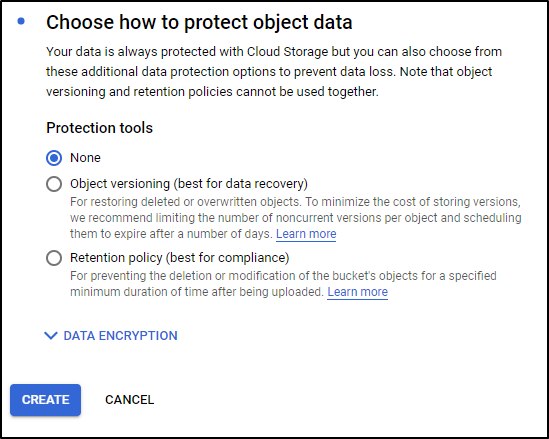
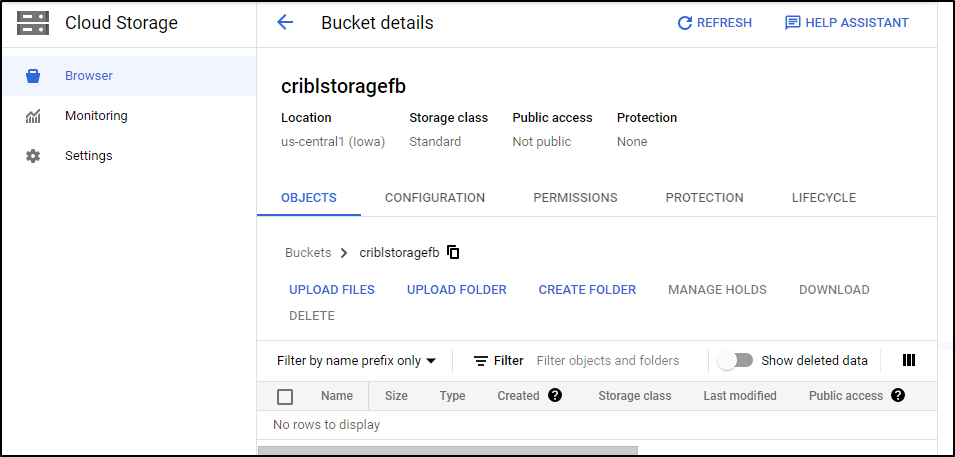
I’ll leave default for Object Protection and click create
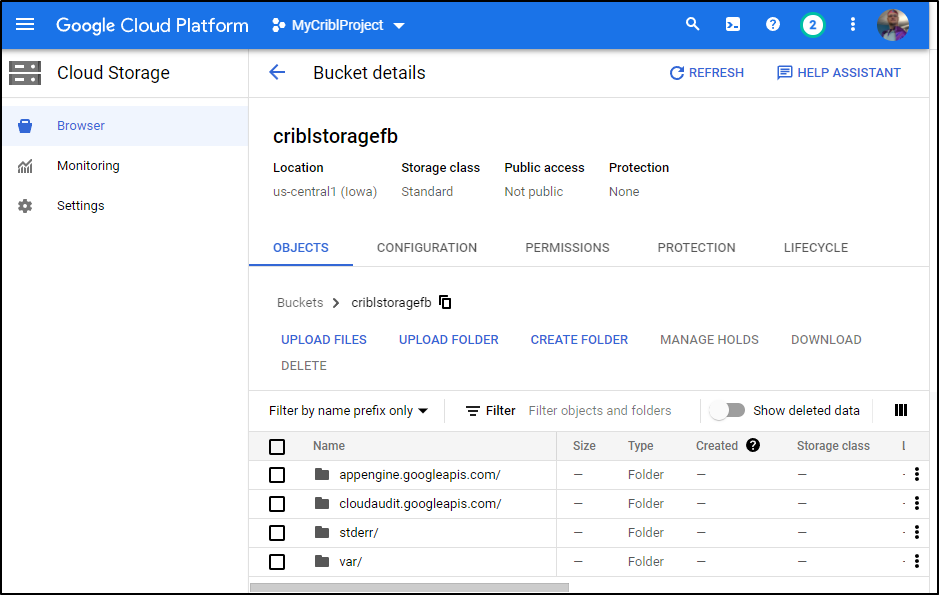
And now I have a storage bucket:
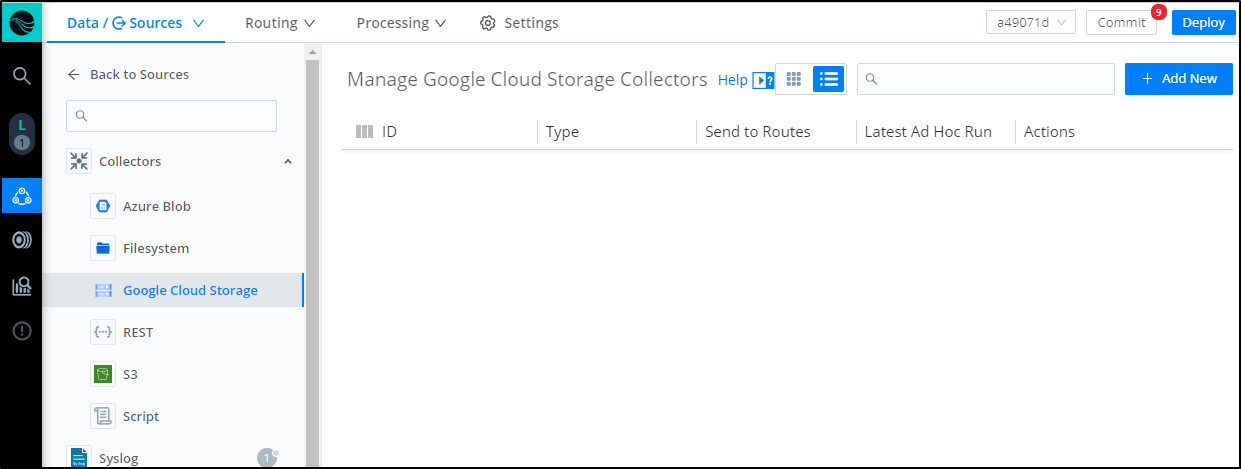
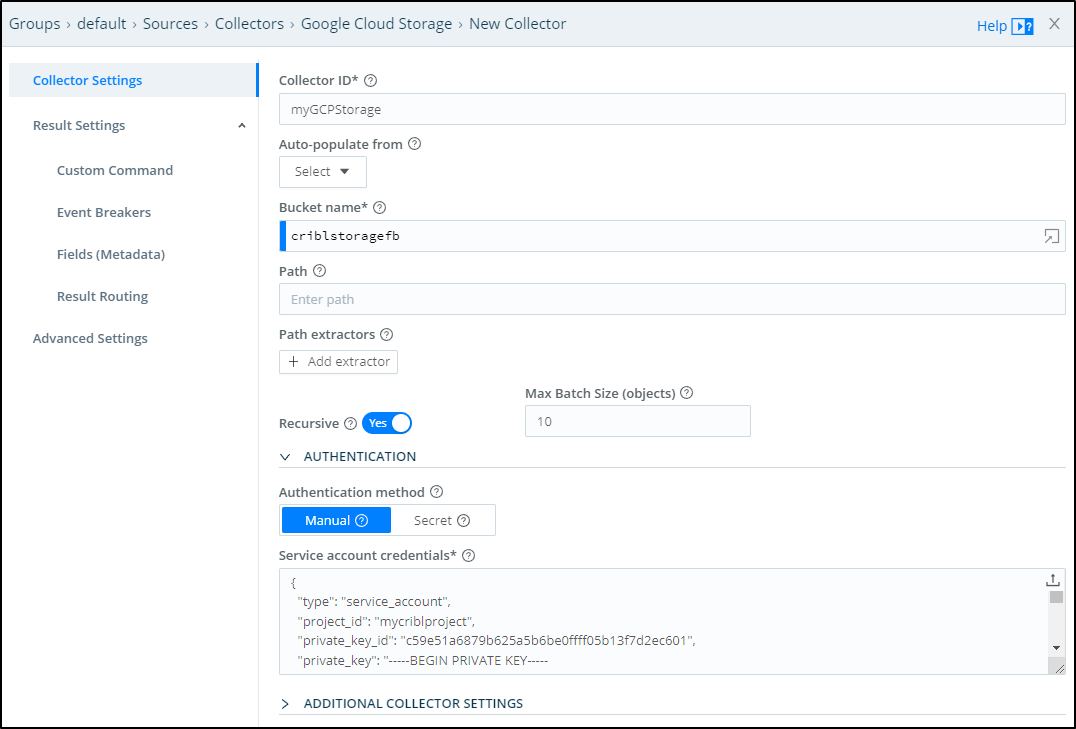
Now in Cribl, we can choose “Google Cloud Storage” in Collectors and click “+ Add New”
From there I can set the Bucket name and upload the JSON secret I had downloaded earlier
Next we need to populate it with some content. The Collector will pull in logs, much like the S3 bucket did. There are a few quickstarts such as the python 3 hello world or the NodeJS one.
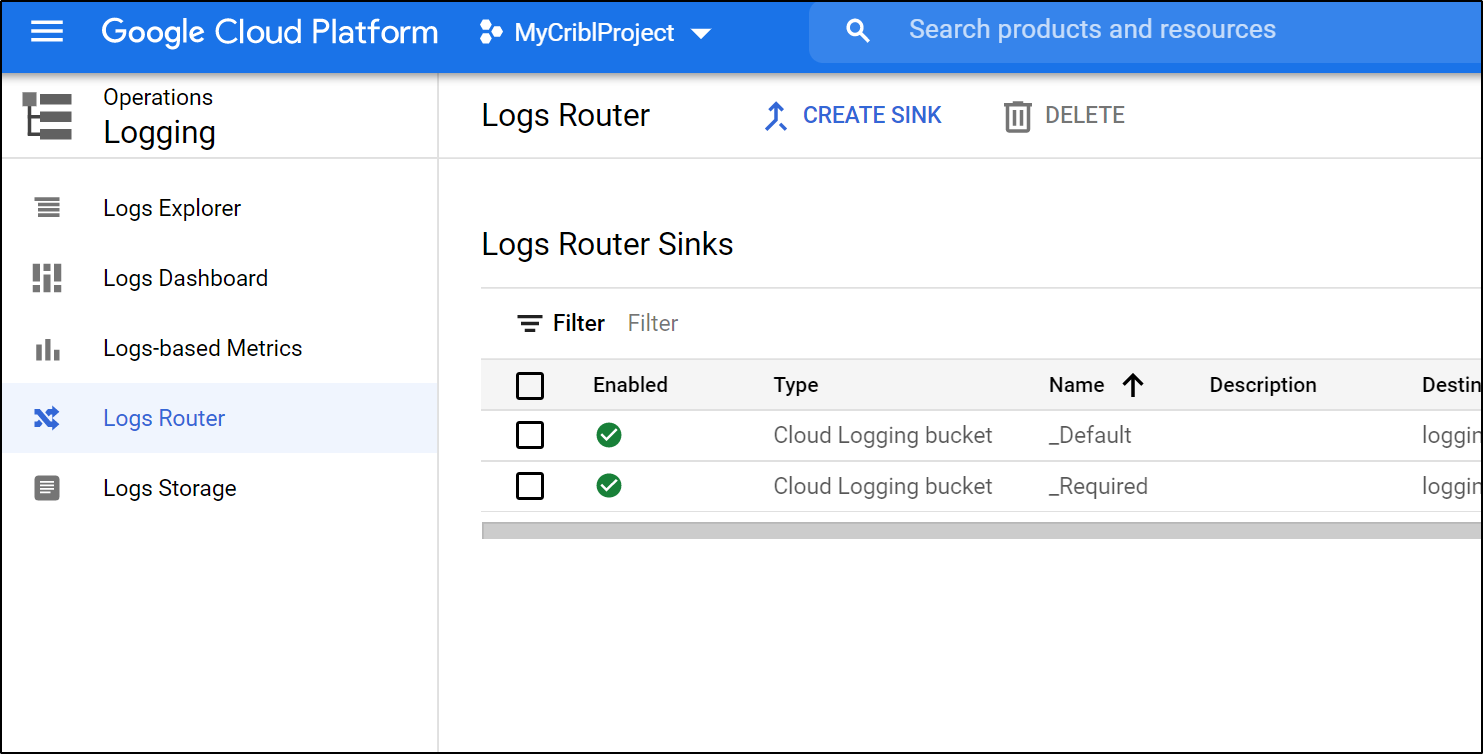
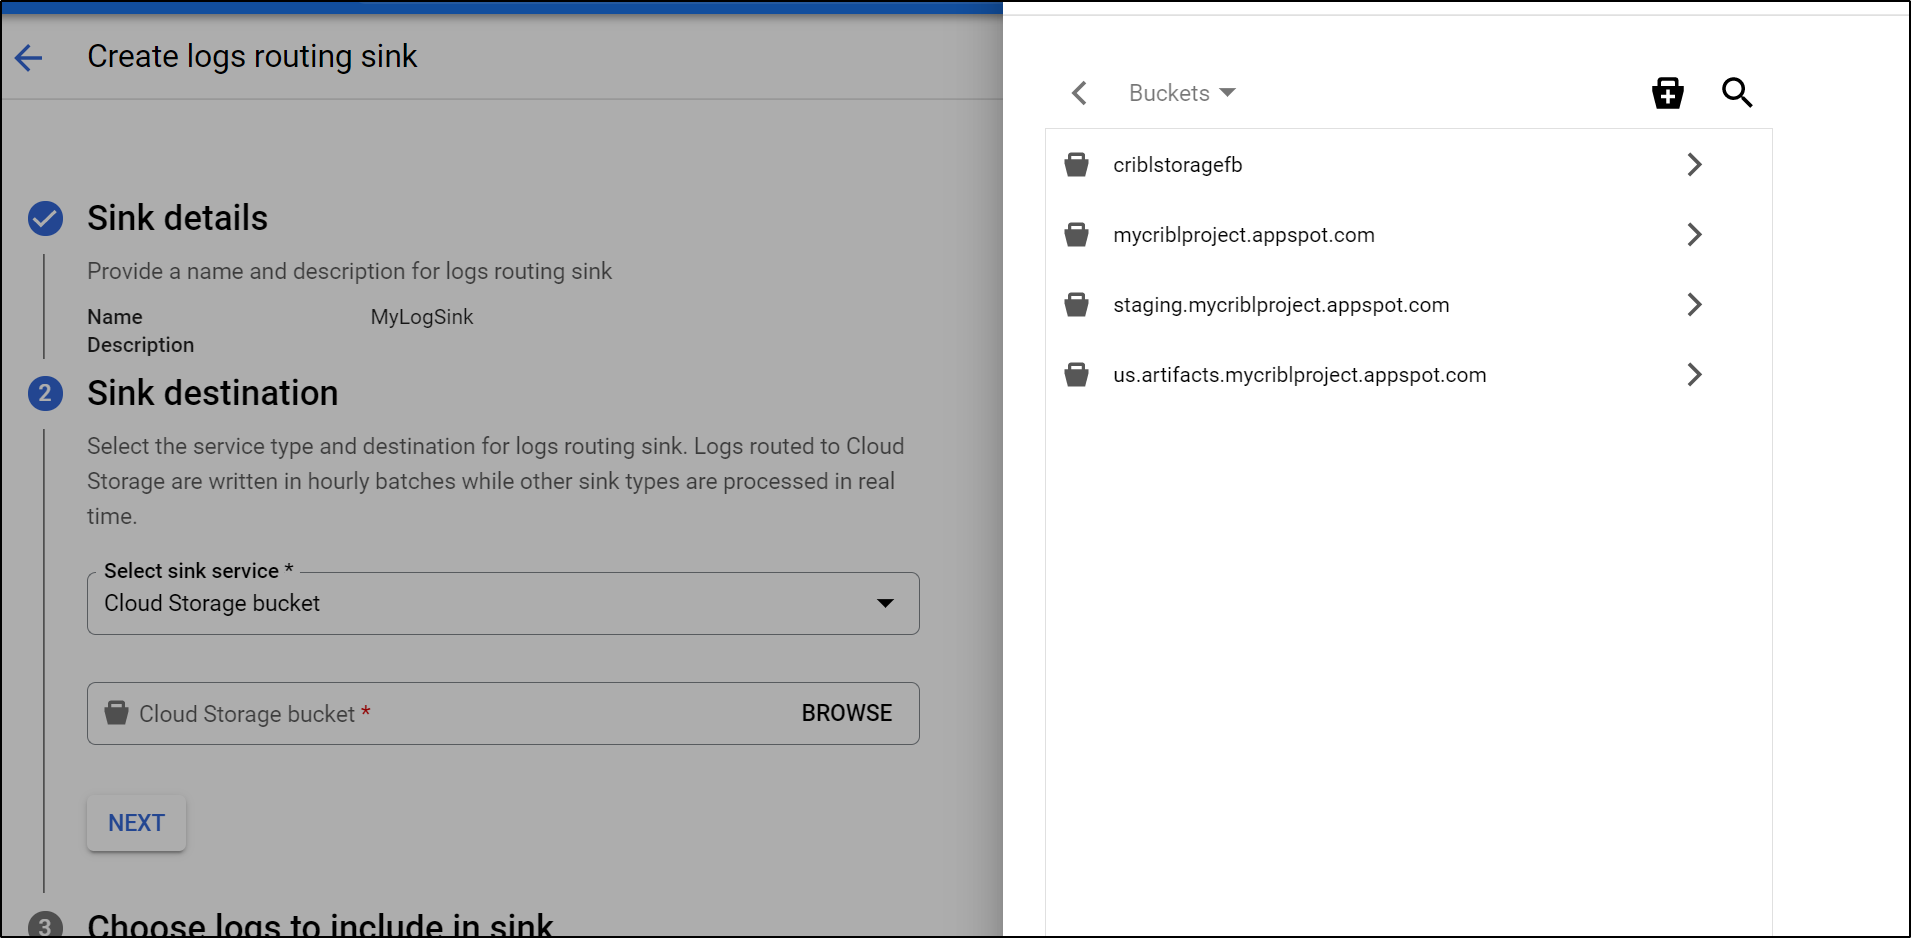
Once created, we will want to create a “Sink” to send AppEngine logs to our bucket. We can “create sink” under the Operations/Logging area.
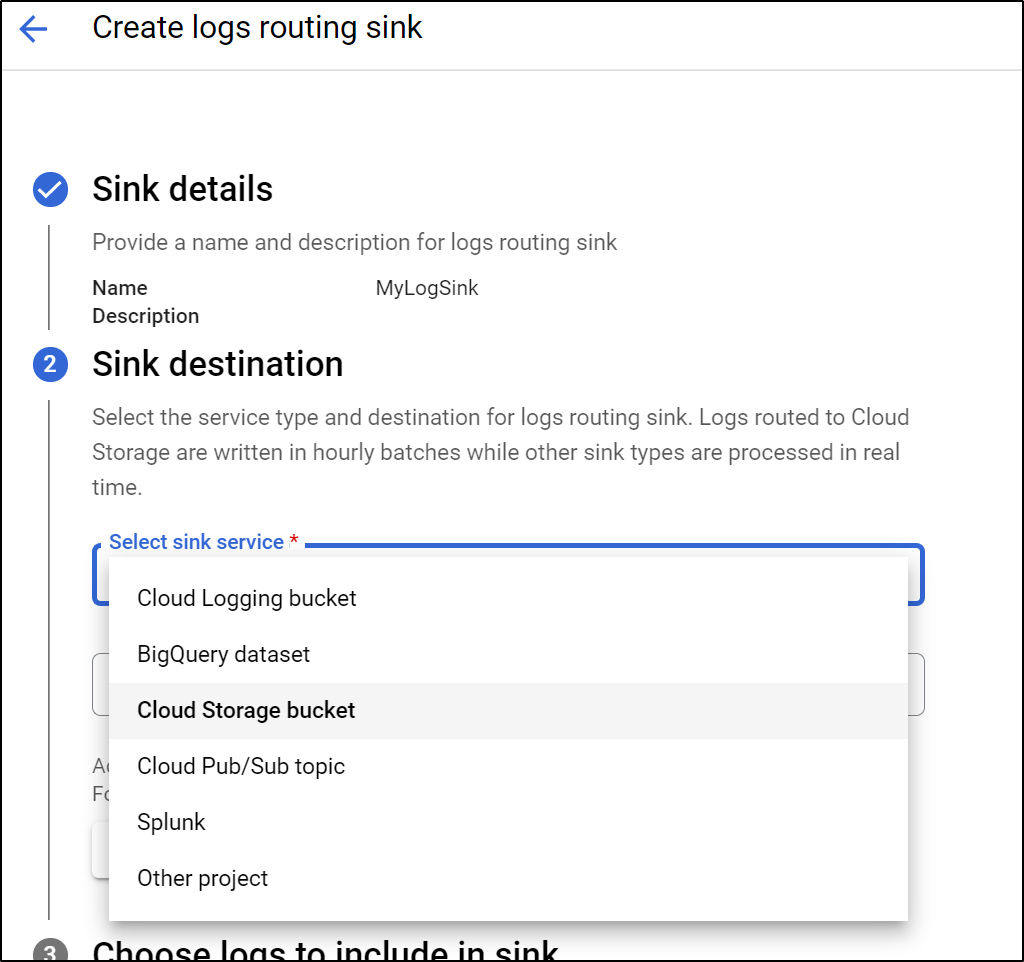
Give it a name and choose type “Cloud Storage Bucket”
Select the bucket we just created
For the inclusion filter, we use resource.type="gae_app"
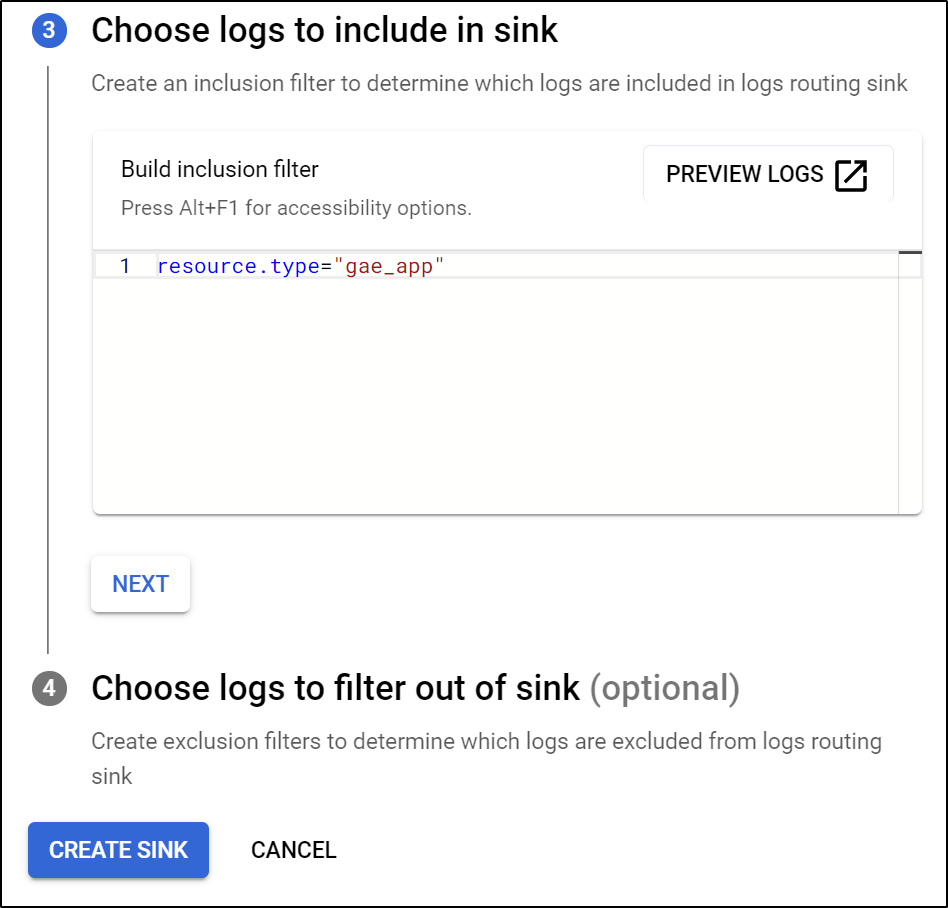
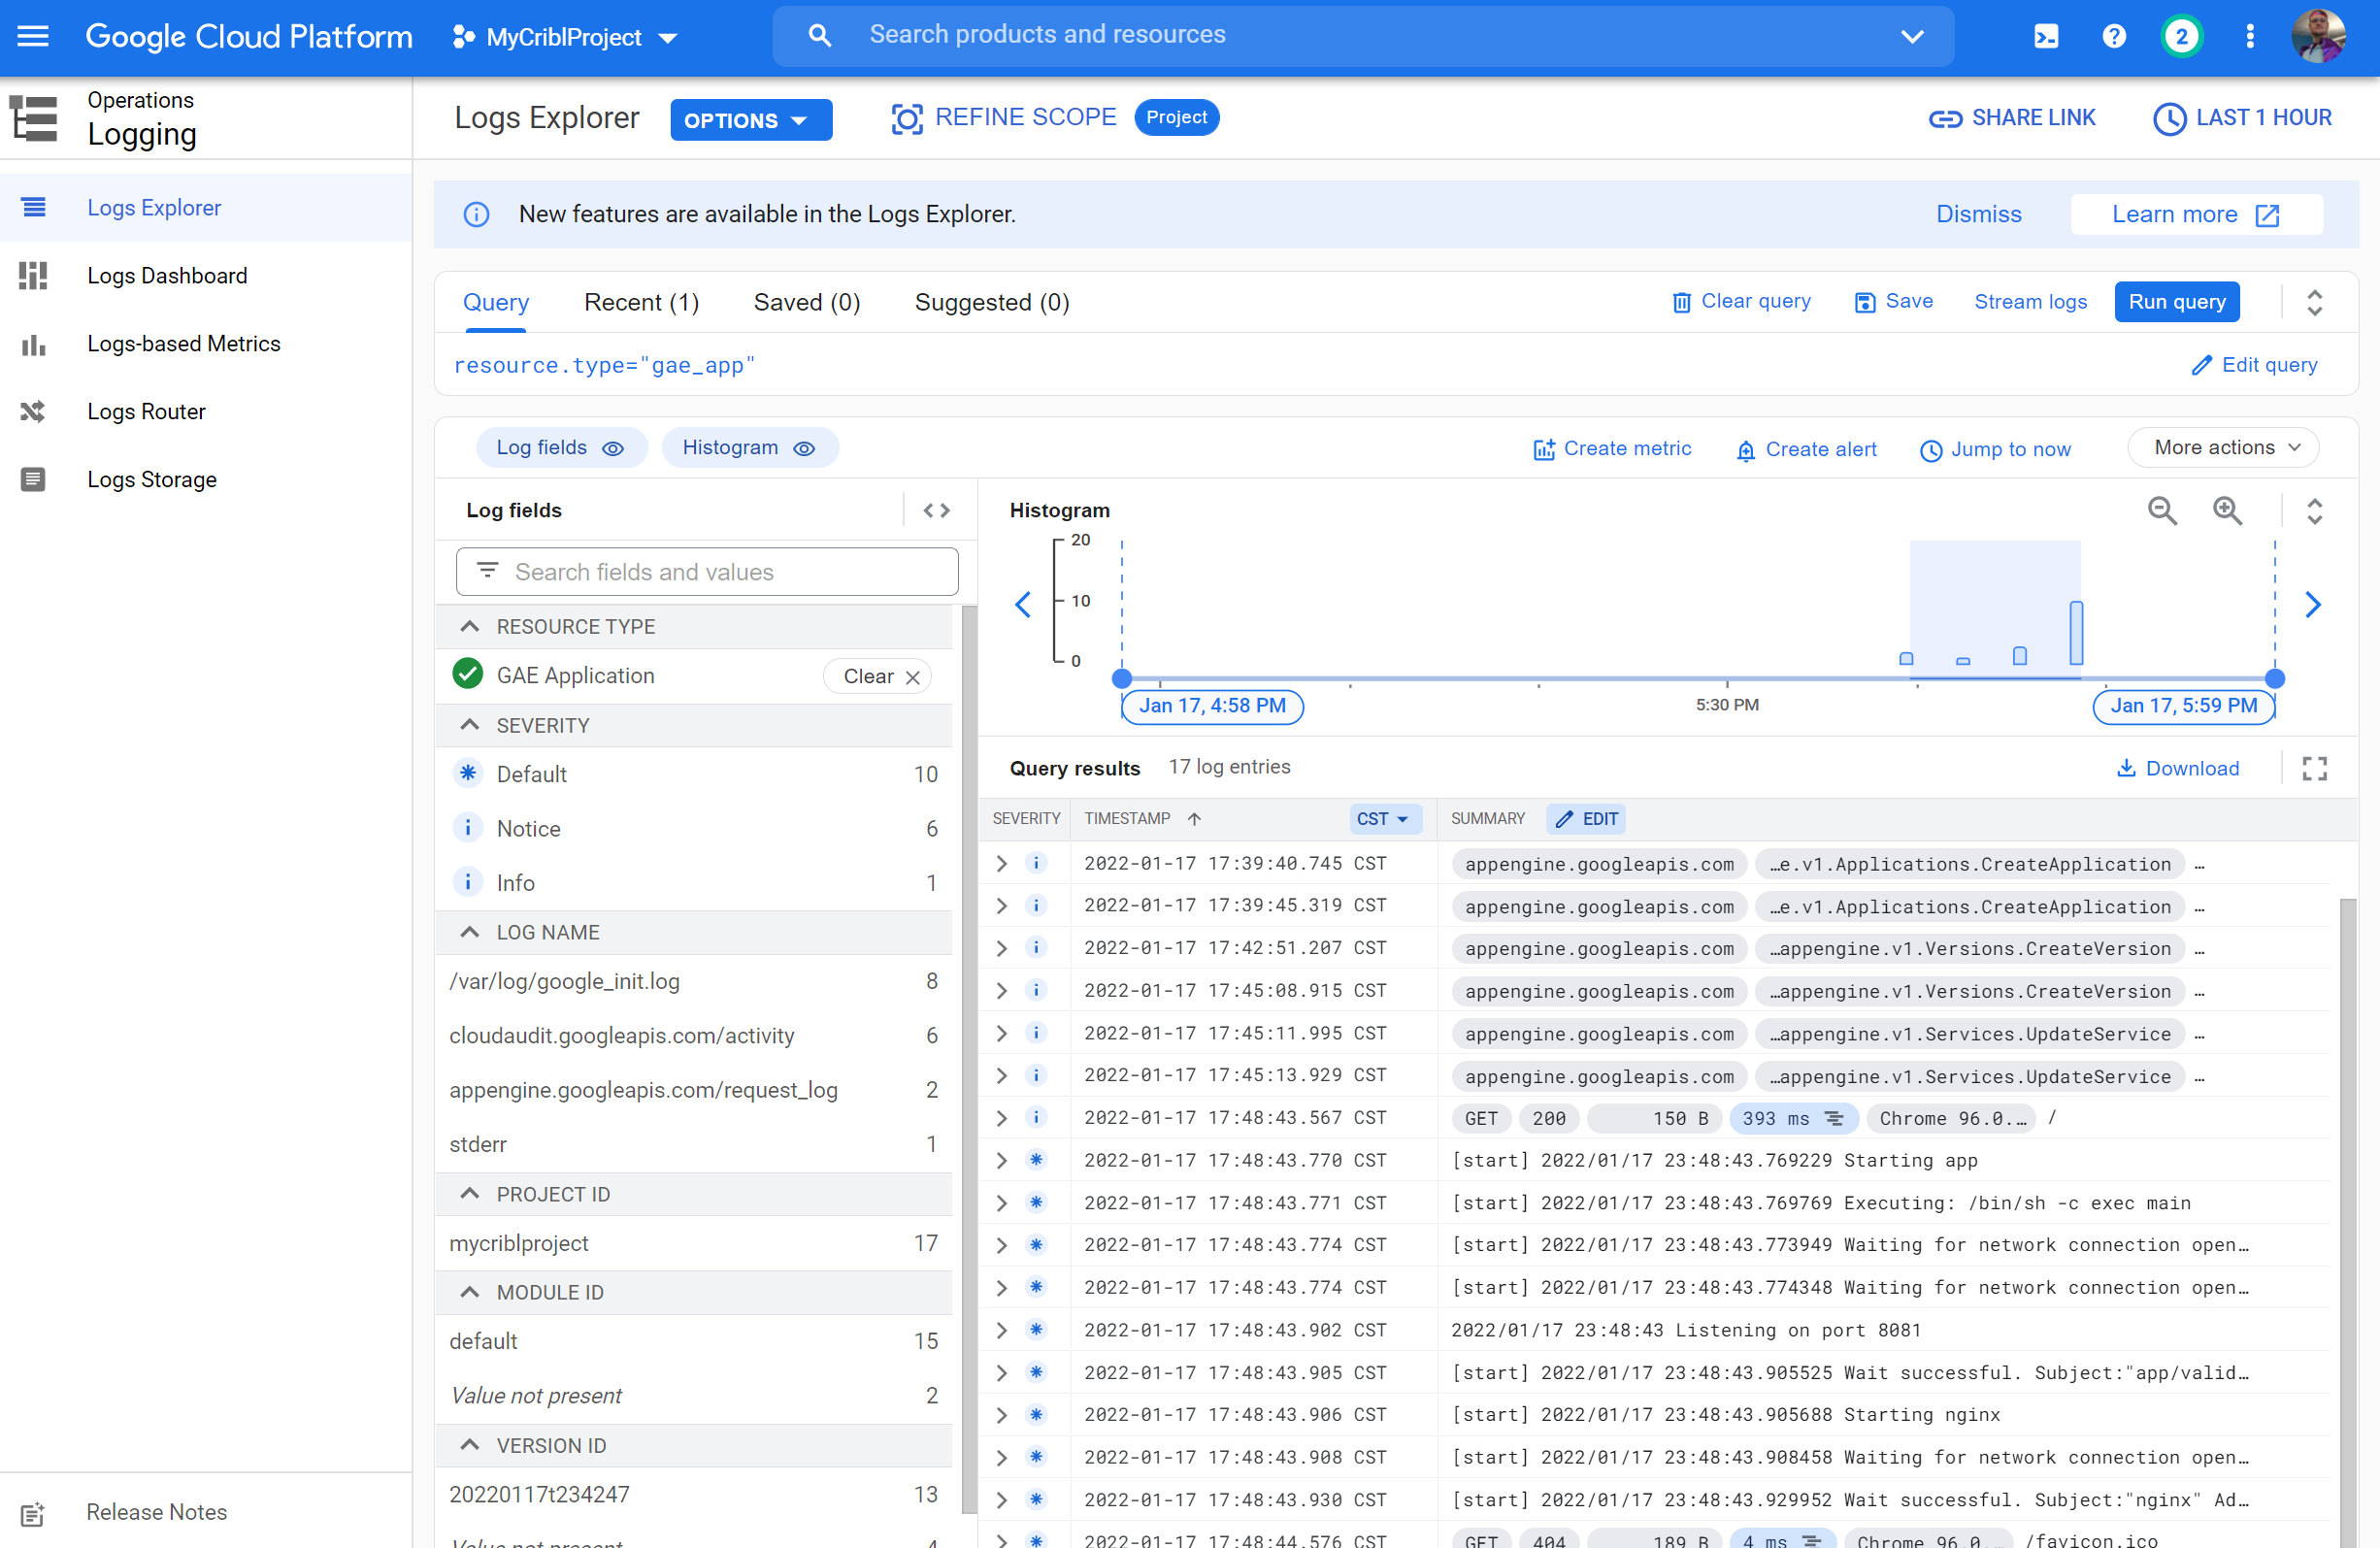
Lastly, we can preview the query in Logs Explorer to verify we have data
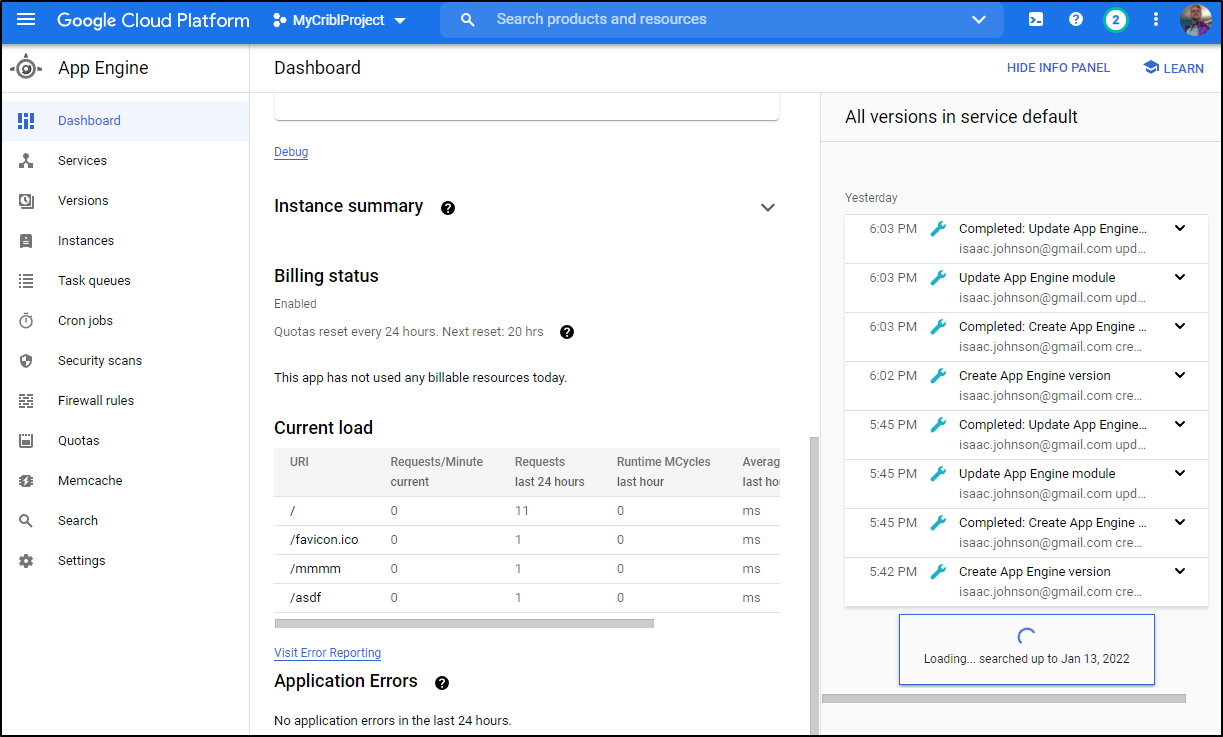
Poking around our endpoint (i hit a few 404s like /asdf and /mmmm) we see we did generate some load:
And in time, we see those logs show up in our cloud storage bucket:
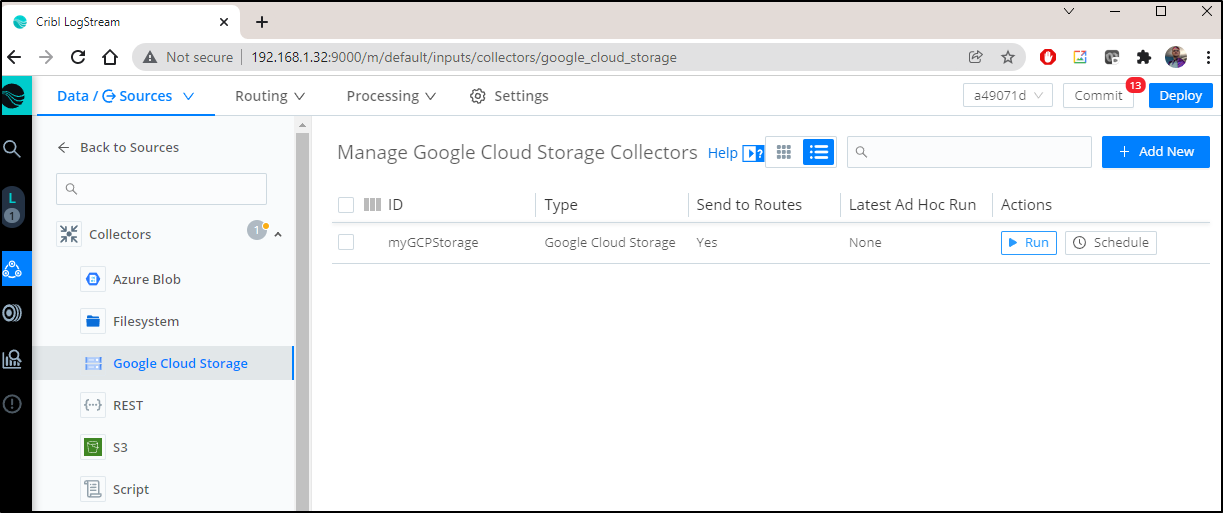
We can force a sync of data by going to the collector and clicking “Run” under actions
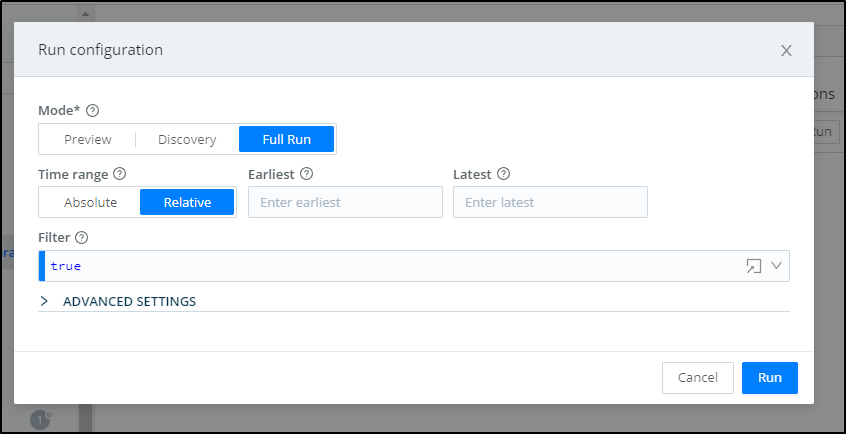
From there we can choose to sync all
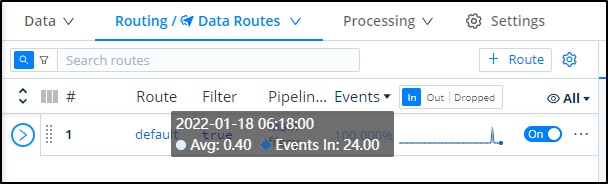
and see events were ingested
History
CEO Clint Sharp detailed their history in a blog post. He had been at Cricket which used Splunk in 2009 and in 2012 actually joined Splunk to work on a new internal project called Hunk (the following year ATT would buy Cricket). Clint met Ledion Bitincka working on that project realized the large problem was that customers often had no handle on their logs being ingested by Splunk. The other co-founder of Cribl, Dritan Bitincka was in professional services. They realized that no one else was solving log reduction and routing; all the other APM and Logging solutions focused on ingesting “all data” and trying to make cheaper storage options. Seeing a real opportunity, they founded Cribl to solve that need in 2017.
 source: medium
Depending on your source, they have between 140 and 220 employees (219 in Jan 2022), are privately held while in Series C funding. It was in 2020 with their Series B round they partnered with Sequoia Capital who brought in Sonya Huang and Pat Grady. Today the leadership stays with the founders; Clint as CEO, Dritan as Head of Product and Ledion as CTO.
Summary
I find Cribl to definitely offer a unique value proposition. Coralogix would argue they do similar, however they generally just provide instructions on tweaking Fluentd to reduce log ingestion - they don’t provide multiple routes. Arguably there are Open-Source solutions as well. A few companies I’ve engaged with have used Kakfa as an intermediary to route various logs in places. But this is complicated (at least to do securely) and requires a team to manage.
Cribl fills that space rather uniquely - a commercial scalable product to route and refine logs and metrics being ingested by one or more APM and Logging tools. As CEO Clint Sharp put it, they can be used as an “observability lake” where customers can store data in their own cost effective means, but process it later if it’s required:
He explains that the lake is where all of the data will go that doesn’t need to go into an existing storage solution. The pipelines will send the data to specific tools and then collect the data, and what doesn’t fit will go back into the lake so companies have it to go back to later. Companies can keep the data for longer and more cost effectively. [ source: TechCrunch ]
But perhaps therein lies the rub. Cribl solves a specific issue for very large customers who wish to organize their logs at the enterprise level but also are willing to buy yet-another APM and Logging suite. Cribl is designed to fit between and if an enterprise is in that place of spending a lot of money to manage log and metric data, they may just wish to invest in one solution, not two.
As much as I like Cribl, I can see them logically merged/acquired with a Datadog or Splunk (Cribl would disagree they are candidates for M&A; firmly focused on a future IPO). While Sharp “did not discuss valuation”, he mentioned in an interview they had raised $254m since inception.
The fact that they have a rather solid free tier product companies can try out means there are really no barriers to trying Cribl and seeing if it can provide value for APM and Logging scaling challenges. I will likely keep using Cribl and exploring new features in future blog posts.