

Published: Jan 11, 2022 by Isaac Johnson
To wrap our series on Sumo Logic, today we’ll explore the Tracing abilities of Sumo Logic with Dapr in a fresh AKS cluster as well as on our On-Prem k3s cluster. We’ll dive deeper into Kubernetes monitoring and then focus on serverless workloads using a .NET Azure Function via Azure Event Hub/Application Insights. We’ll also look deeper at how Sumo Logic handles Metrics and wrap up by ingesting and processing custom logs with the commandline.
Traces
This guide covers setting up Sumo Logic with OpenTelemtry, which is my favourite way to handle tracing. We will be generally following it with a few tweaks.
Since I removed my last AKS cluster, let’s set this up on the On-Prem cluster
$ helm repo add sumologic https://sumologic.github.io/sumologic-kubernetes-collection
"sumologic" has been added to your repositories

$ helm repo update
Hang tight while we grab the latest from your chart repositories...
...Successfully got an update from the "azure-samples" chart repository
...Successfully got an update from the "kuma" chart repository
...Successfully got an update from the "datadog" chart repository
...Successfully got an update from the "sumologic" chart repository
...Successfully got an update from the "rancher-latest" chart repository
...Successfully got an update from the "newrelic" chart repository
...Successfully got an update from the "incubator" chart repository
Update Complete. ⎈Happy Helming!⎈
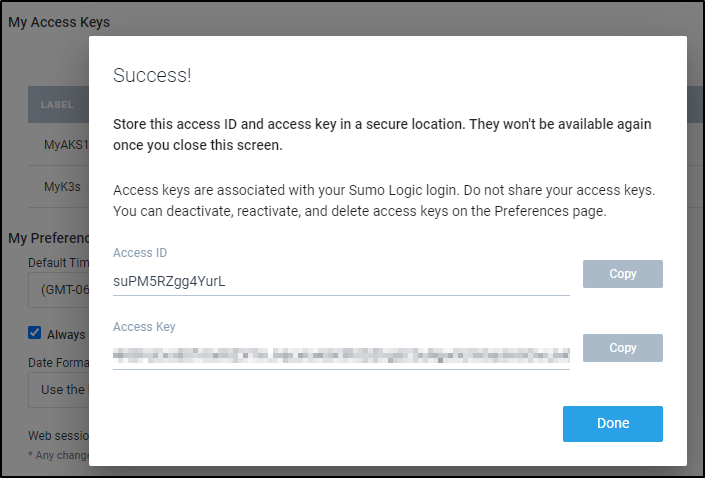
We need an API key
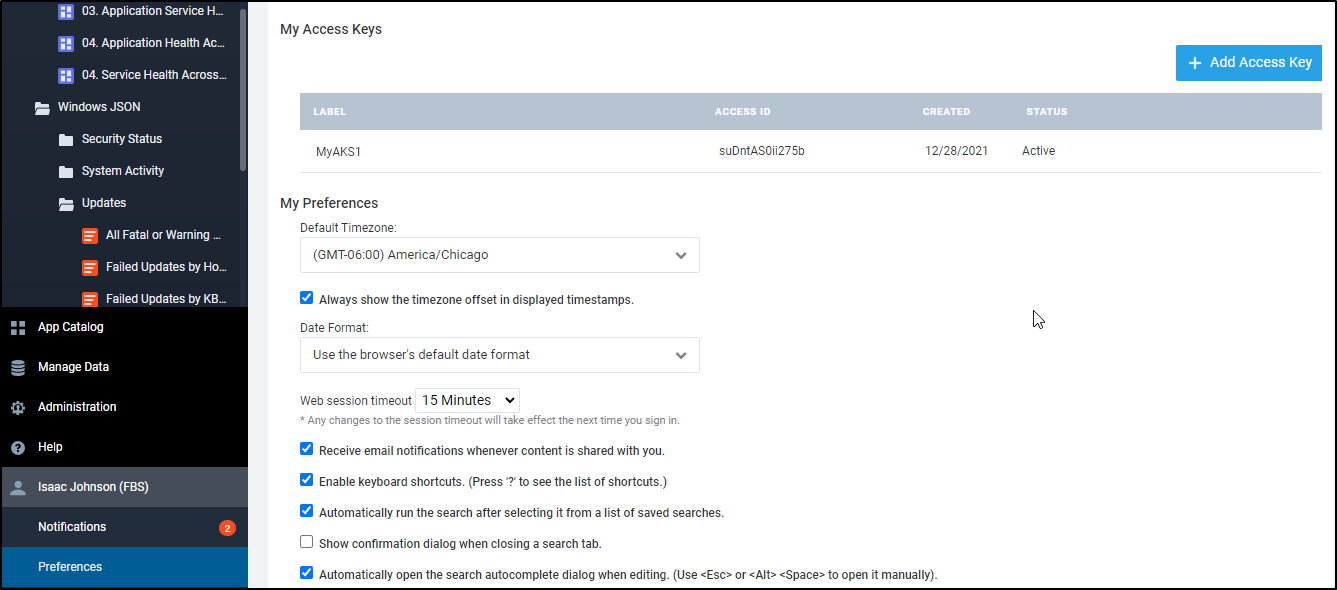 .
.
The first time through this, my cluster could not keep up and pods crashed.
Later, adding another node and removing some unused namespaces seemed to rectify the issues and I did not have pods crashing after installing.
$ helm upgrade --install mysumorelease sumologic/sumologic --set sumologic.accessId=s************Y --set sumologic.accessKey=L***************************x --set sumologic.clusterName="K3sTry2" --set sumologic.traces.enabled=true --set otelagent.enabled=true
Release "mysumorelease" does not exist. Installing it now.
W0107 10:45:40.981059 23329 warnings.go:70] policy/v1beta1 PodSecurityPolicy is deprecated in v1.21+, unavailable in v1.25+
W0107 10:45:40.993489 23329 warnings.go:70] policy/v1beta1 PodSecurityPolicy is deprecated in v1.21+, unavailable in v1.25+
W0107 10:45:41.002004 23329 warnings.go:70] policy/v1beta1 PodSecurityPolicy is deprecated in v1.21+, unavailable in v1.25+
W0107 10:45:41.022630 23329 warnings.go:70] policy/v1beta1 PodSecurityPolicy is deprecated in v1.21+, unavailable in v1.25+
W0107 10:46:29.090276 23329 warnings.go:70] policy/v1beta1 PodSecurityPolicy is deprecated in v1.21+, unavailable in v1.25+
W0107 10:46:29.111384 23329 warnings.go:70] policy/v1beta1 PodSecurityPolicy is deprecated in v1.21+, unavailable in v1.25+
W0107 10:46:29.112672 23329 warnings.go:70] policy/v1beta1 PodSecurityPolicy is deprecated in v1.21+, unavailable in v1.25+
W0107 10:46:29.140028 23329 warnings.go:70] policy/v1beta1 PodSecurityPolicy is deprecated in v1.21+, unavailable in v1.25+
NAME: mysumorelease
LAST DEPLOYED: Fri Jan 7 10:45:39 2022
NAMESPACE: default
STATUS: deployed
REVISION: 1
NOTES:
Thank you for installing sumologic.
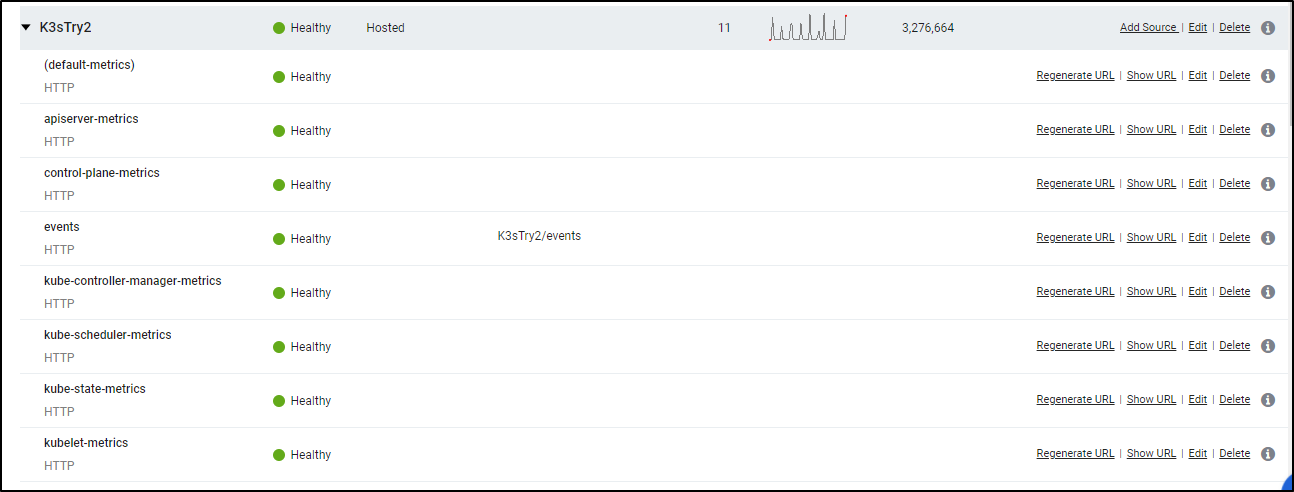
A Collector with the name "K3sTry2" has been created in your Sumo Logic account.
Check the release status by running:
kubectl --namespace default get pods -l "release=mysumorelease"
We've tried to automatically create fields. In an unlikely scenario that this
fails please refer to the following to create them manually:
https://github.com/SumoLogic/sumologic-kubernetes-collection/blob/2b3ca63/deploy/docs/Installation_with_Helm.md#prerequisite
Coming back after lunch I nearly did a spit take on the ingestion numbers
Clearly there was an initial spike
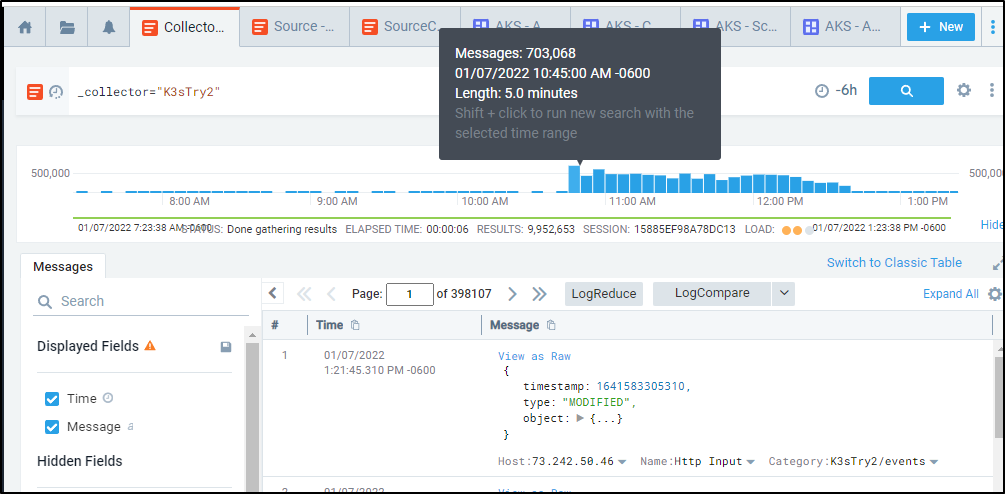
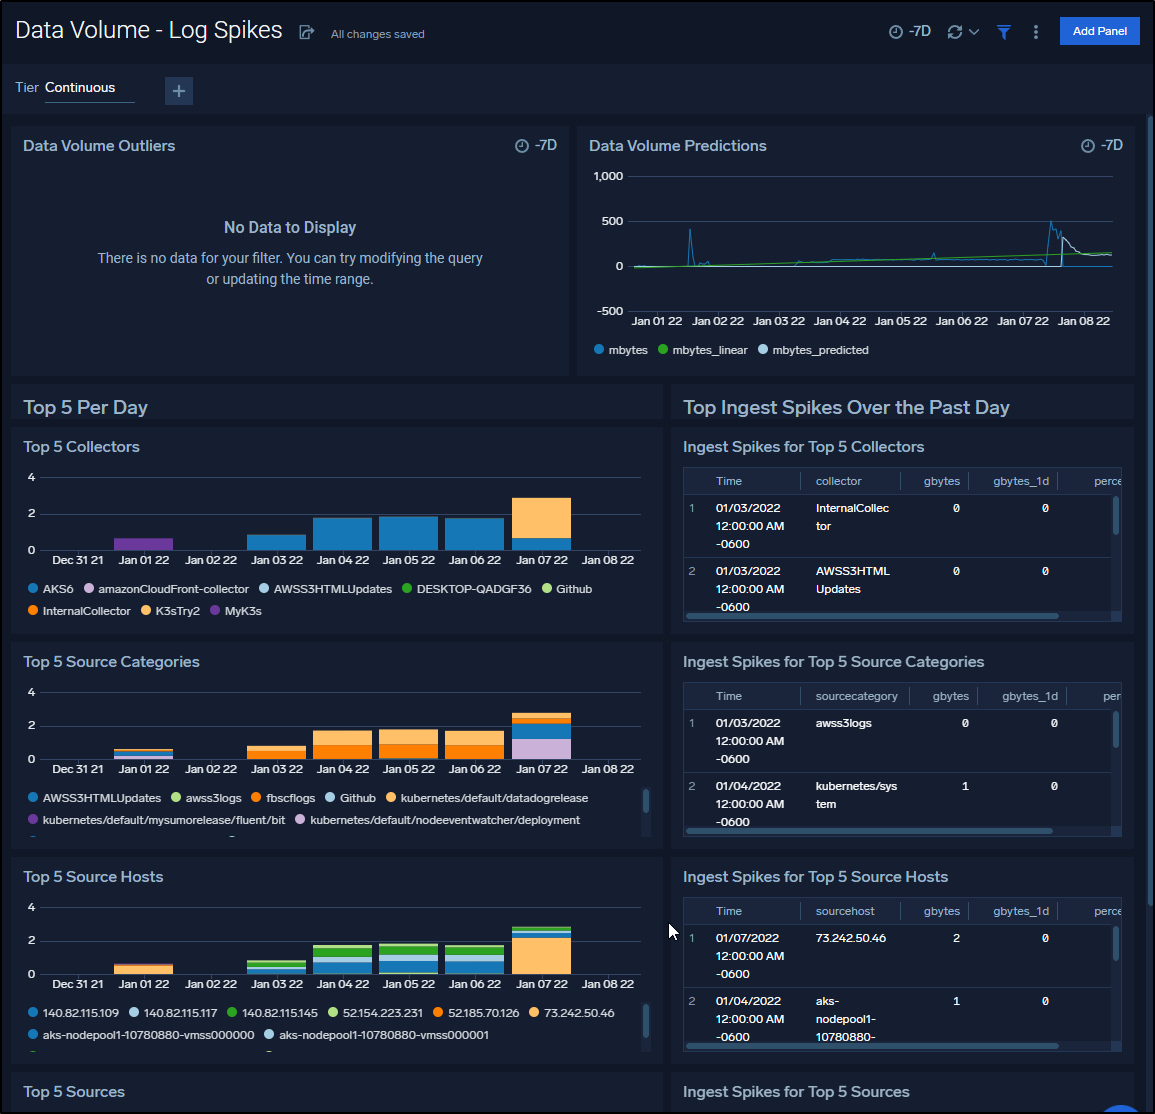
And the Data Volume widget confirms it:
My next issue to setting up traces is that Crossplane.io created a “Configuration” CRD which is the same “Kind” name used by Dapr.io. Trying to fetch my appconfig dapr.io configuration was becoming a challenge since Crossplane was winning out in the “Kind” name conflict.
$ kubectl get configuration
NAME                            INSTALLED   HEALTHY   PACKAGE                                                    AGE
xp-getting-started-with-azure   True        True      registry.upbound.io/xp/getting-started-with-azure:v1.4.1   89d
With some searching, I found the syntax for the fully qualified name is kind.provider:
$ kubectl get configuration.dapr.io appconfig -o yaml | tail -n 4
  tracing:
    samplingRate: "1"
    zipkin:
      endpointAddress: http://otel-collector.default.svc.cluster.local:9411/api/v2/spans
Now that I’ve verified Dapr’s zipkin trace data is going to my Otel collector, I’ll update the otelconf
apiVersion: v1
data:
  otel-collector-config: |
    receivers:
      otlp:
        protocols:
          grpc:
            endpoint: 0.0.0.0:55680
          http:
            endpoint: 0.0.0.0:55681
      zipkin:
        endpoint: 0.0.0.0:9411
      prometheus:
        config:
          scrape_configs:
            - job_name: 'otel-collector'
              scrape_interval: 10s
              static_configs:
                - targets: [ '0.0.0.0:8888' ]
    extensions:
      health_check:
      pprof:
        endpoint: :1888
      zpages:
        endpoint: :55679
    exporters:
      otlp/insecure:
        endpoint: 192.168.1.32:4317
        tls:
          insecure: true
      logging:
        loglevel: debug

      otlp:
        endpoint: "10.43.182.221:4317"
        tls:
          insecure: true
      zipkin:
        endpoint: "http://10.43.182.221:9411/api/v2/spans"
      # Depending on where you want to export your trace, use the
      # correct OpenTelemetry trace exporter here.
      #
      # Refer to
      # https://github.com/open-telemetry/opentelemetry-collector/tree/main/exporter
      # and
      # https://github.com/open-telemetry/opentelemetry-collector-contrib/tree/main/exporter
      # for full lists of trace exporters that you can use, and how to
      # configure them.
      azuremonitor:
        instrumentation_key: "7db4a1e8-asdf-asdf-asdf-4575551c80da"
        endpoint: "https://centralus-2.in.applicationinsights.azure.com/v2/track"
      datadog:
        api:
          key: "asdfasdfasfsadfsadfsadfasdf"

    service:
      extensions: [pprof, zpages, health_check]
      pipelines:
        traces:
          receivers: [zipkin]
          # List your exporter here.
          exporters: [azuremonitor, datadog, otlp/insecure, otlp, zipkin, logging]
        metrics:
          receivers: [prometheus]
          exporters: [otlp/insecure]
kind: ConfigMap
metadata:
  annotations:
    kubectl.kubernetes.io/last-applied-configuration: |
      {"apiVersion":"v1","data":{"otel-collector-config":"receivers:\n  otlp:\n    protocols:\n      grpc:\n        endpoint: 0.0.0.0:55680\n      http:\n        endpoint: 0.0.0.0:55681\n  zipkin:\n    endpoint: 0.0.0.0:9411\n  prometheus:\n    config:\n      scrape_configs:\n        - job_name: 'otel-collector'\n          scrape_interval: 10s\n          static_configs:\n            - targets: [ '0.0.0.0:8888' ]\nextensions:\n  health_check:\n  pprof:\n    endpoint: :1888\n  zpages:\n    endpoint: :55679\nexporters:\n  otlp/insecure:\n    endpoint: 192.168.1.32:4317\n    tls:\n      insecure: true\n  logging:\n    loglevel: debug\n  # Depending on where you want to export your trace, use the\n  # correct OpenTelemetry trace exporter here.\n  #\n  # Refer to\n  # https://github.com/open-telemetry/opentelemetry-collector/tree/main/exporter\n  # and\n  # https://github.com/open-telemetry/opentelemetry-collector-contrib/tree/main/exporter\n  # for full lists of trace exporters that you can use, and how to\n  # configure them.\n  azuremonitor:\n    instrumentation_key: \"7db4a1e8-asdf-asdf-asdf-4575551c80da\"\n    endpoint: \"https://centralus-2.in.applicationinsights.azure.com/v2/track\"\n  datadog:\n    api:\n      key: \"asdfasdfasdfasdsadfsadf\"\n\nservice:\n  extensions: [pprof, zpages, health_check]\n  pipelines:\n    traces:\n      receivers: [zipkin]\n      # List your exporter here.\n      exporters: [azuremonitor, datadog, otlp/insecure, logging]\n    metrics:\n      receivers: [prometheus]\n      exporters: [otlp/insecure]\n"},"kind":"ConfigMap","metadata":{"annotations":{},"creationTimestamp":"2021-04-16T01:10:08Z","labels":{"app":"opentelemetry","component":"otel-collector-conf"},"name":"otel-collector-conf","namespace":"default","resourceVersion":"144966729","uid":"caae6b5c-b4ea-44f6-8ede-4824a51e2563"}}
  creationTimestamp: "2021-04-16T01:10:08Z"
  labels:
    app: opentelemetry
    component: otel-collector-conf
  name: otel-collector-conf
  namespace: default
  resourceVersion: "144977871"
  uid: caae6b5c-b4ea-44f6-8ede-4824a51e2563
To be clear, 10.43.182.221 is the IP of my mysumorelease-sumologic-otelcol service, whereas 192.168.1.32 is my local Cribl Logmonitor Linux host (not in K8s)
Now I’ll apply and bounce the otel collector
$ kubectl apply -f myk3sotel.conf
configmap/otel-collector-conf configured

$ kubectl delete pod otel-collector-85b54fbfdc-s5s45
pod "otel-collector-85b54fbfdc-s5s45" deleted
I can see the new pod is spewing trace data:
$ kubectl logs otel-collector-85b54fbfdc-d4j2z  | tail -n20
     -> net.host.ip: STRING(10.42.5.48)
Span #92
    Trace ID       : 512e521196afed311aec44db87aa454f
    Parent ID      :
    ID             : c895377482c57953
    Name           : bindings/kubeevents
    Kind           : SPAN_KIND_SERVER
    Start time     : 2022-01-07 19:52:13.992013 +0000 UTC
    End time       : 2022-01-07 19:52:13.992869 +0000 UTC
    Status code    : STATUS_CODE_UNSET
    Status message :
Attributes:
     -> db.system: STRING(bindings)
     -> error: STRING(NOT_FOUND)
     -> opencensus.status_description: STRING(NotFound)
     -> rpc.service: STRING(Dapr)
     -> db.connection_string: STRING(POST /kubeevents)
     -> db.name: STRING(kubeevents)
     -> net.host.ip: STRING(10.42.5.48)
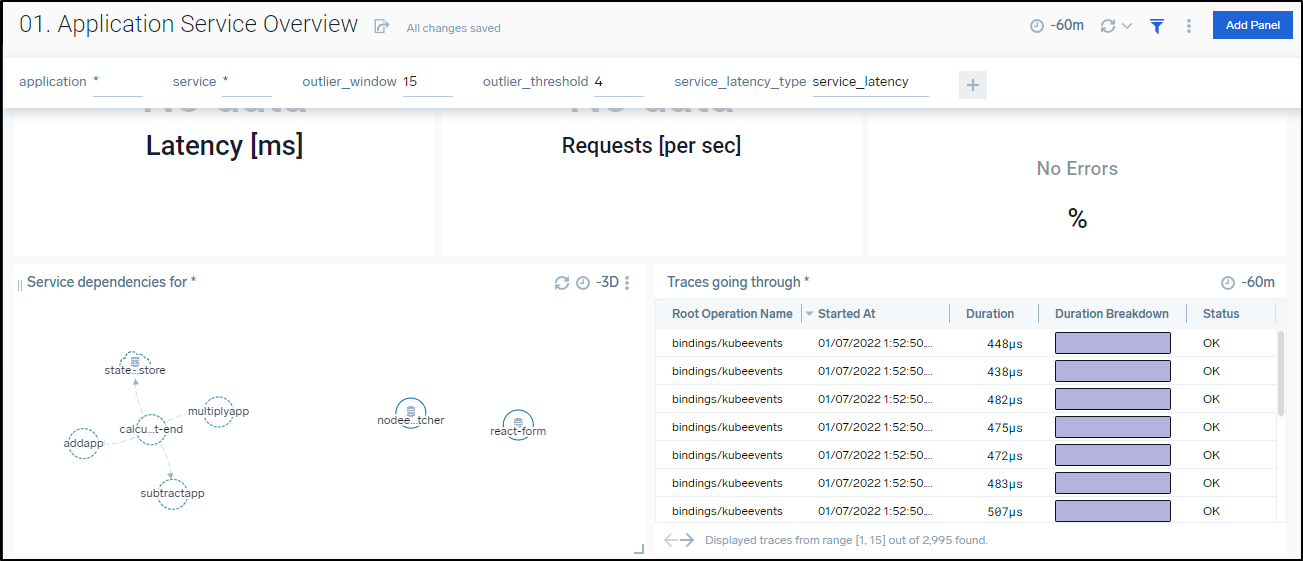
And I can see the Application Service Overview page has updated with new services
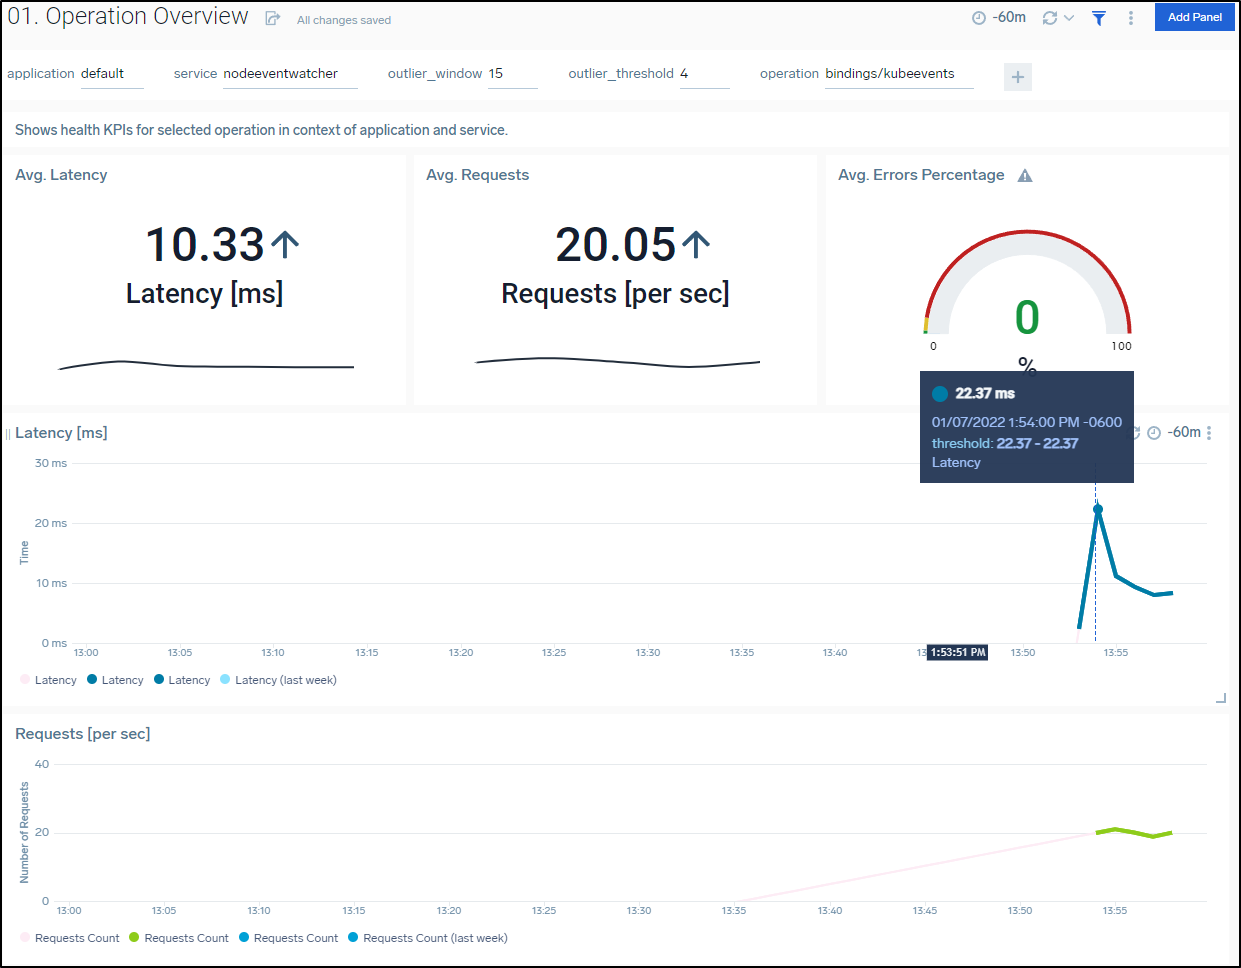
We can also use the Operation Overview to see more about the noisy nodeventwatcher service
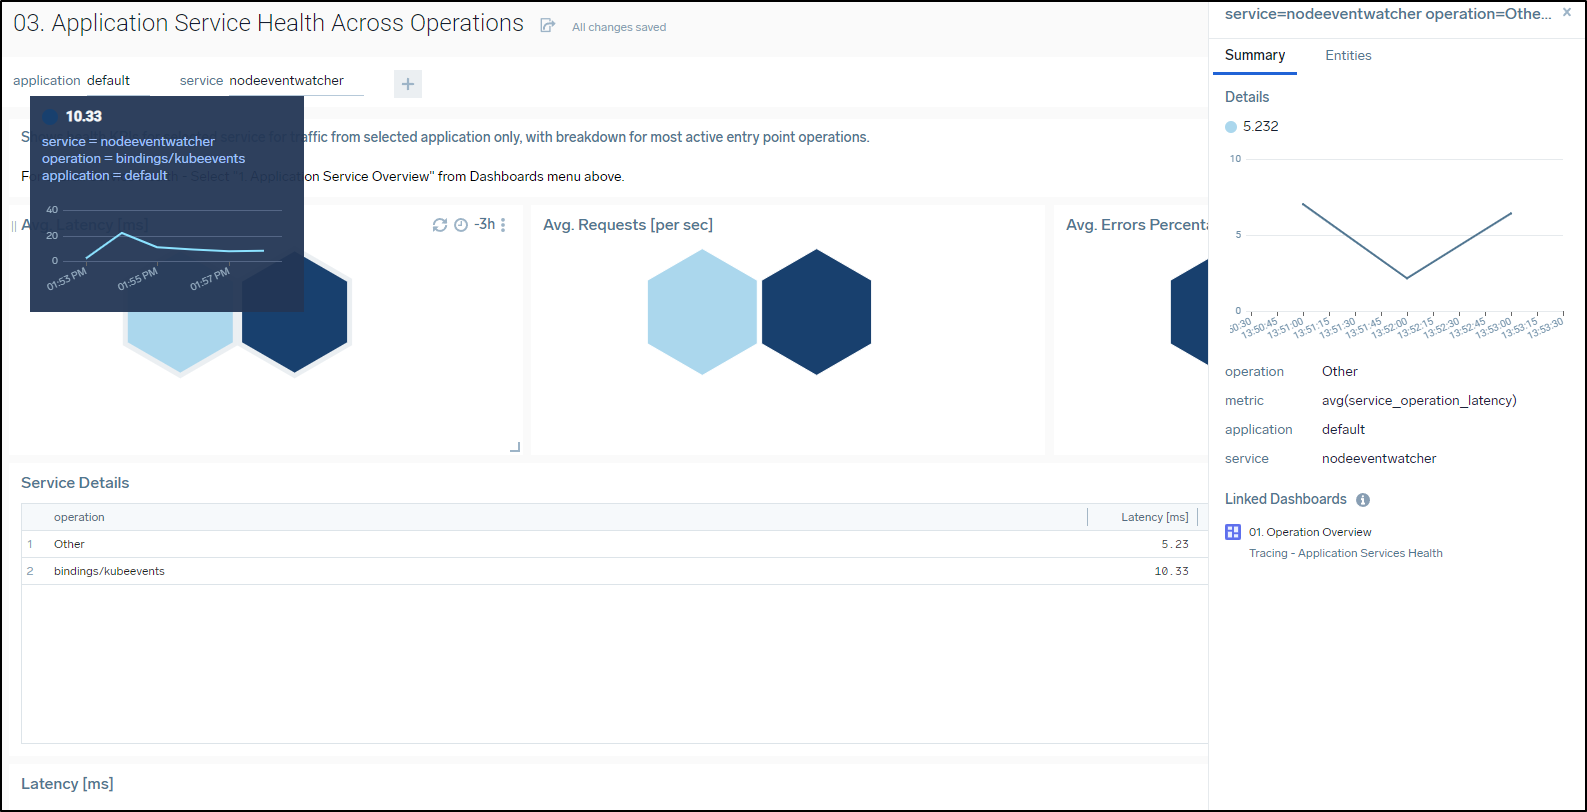
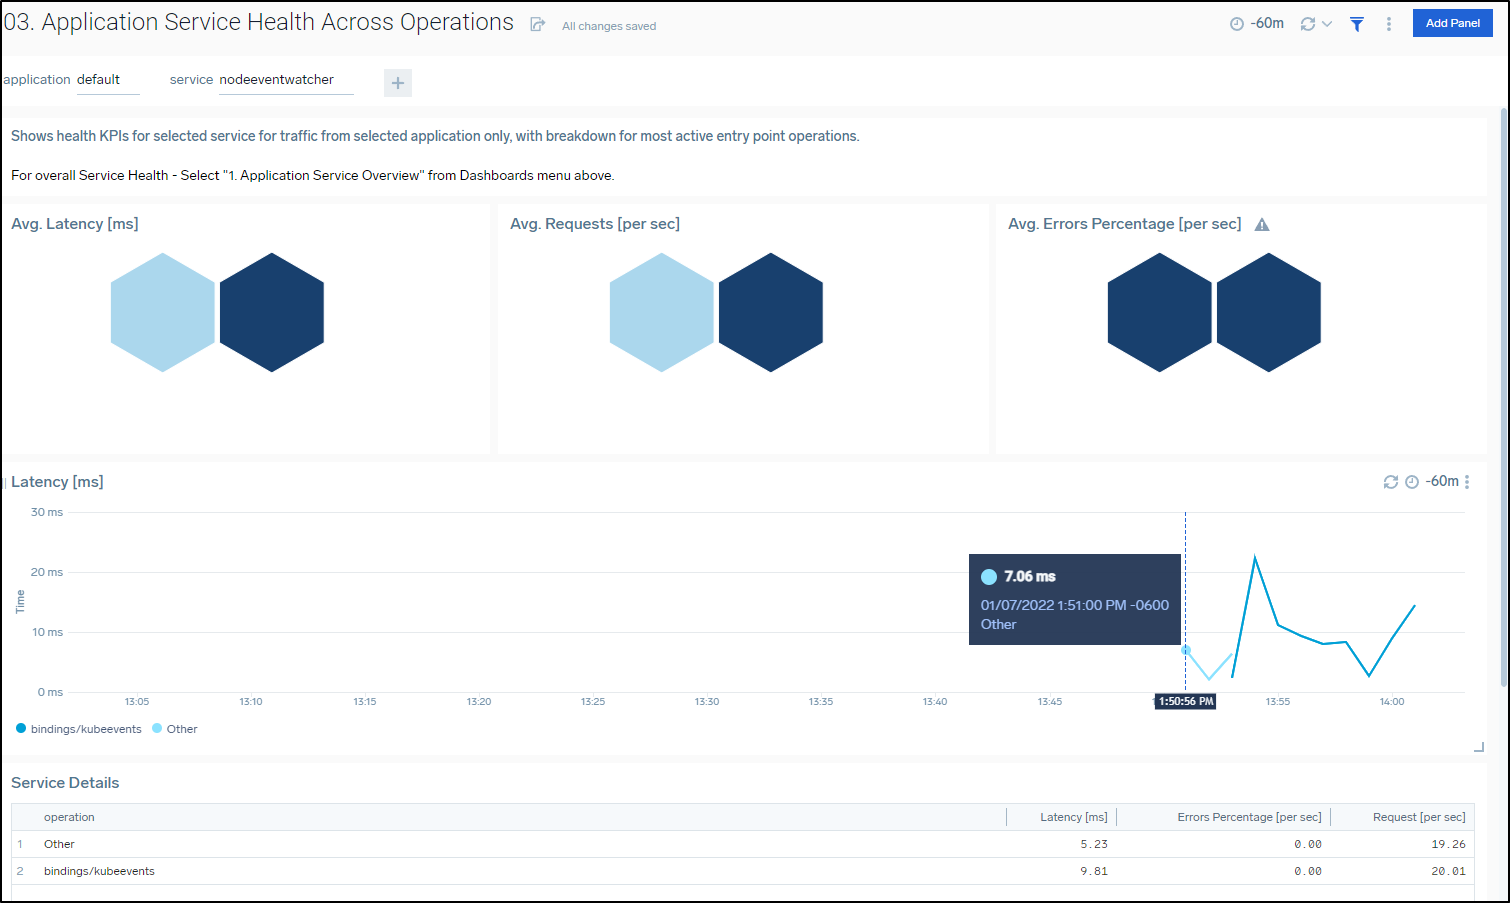
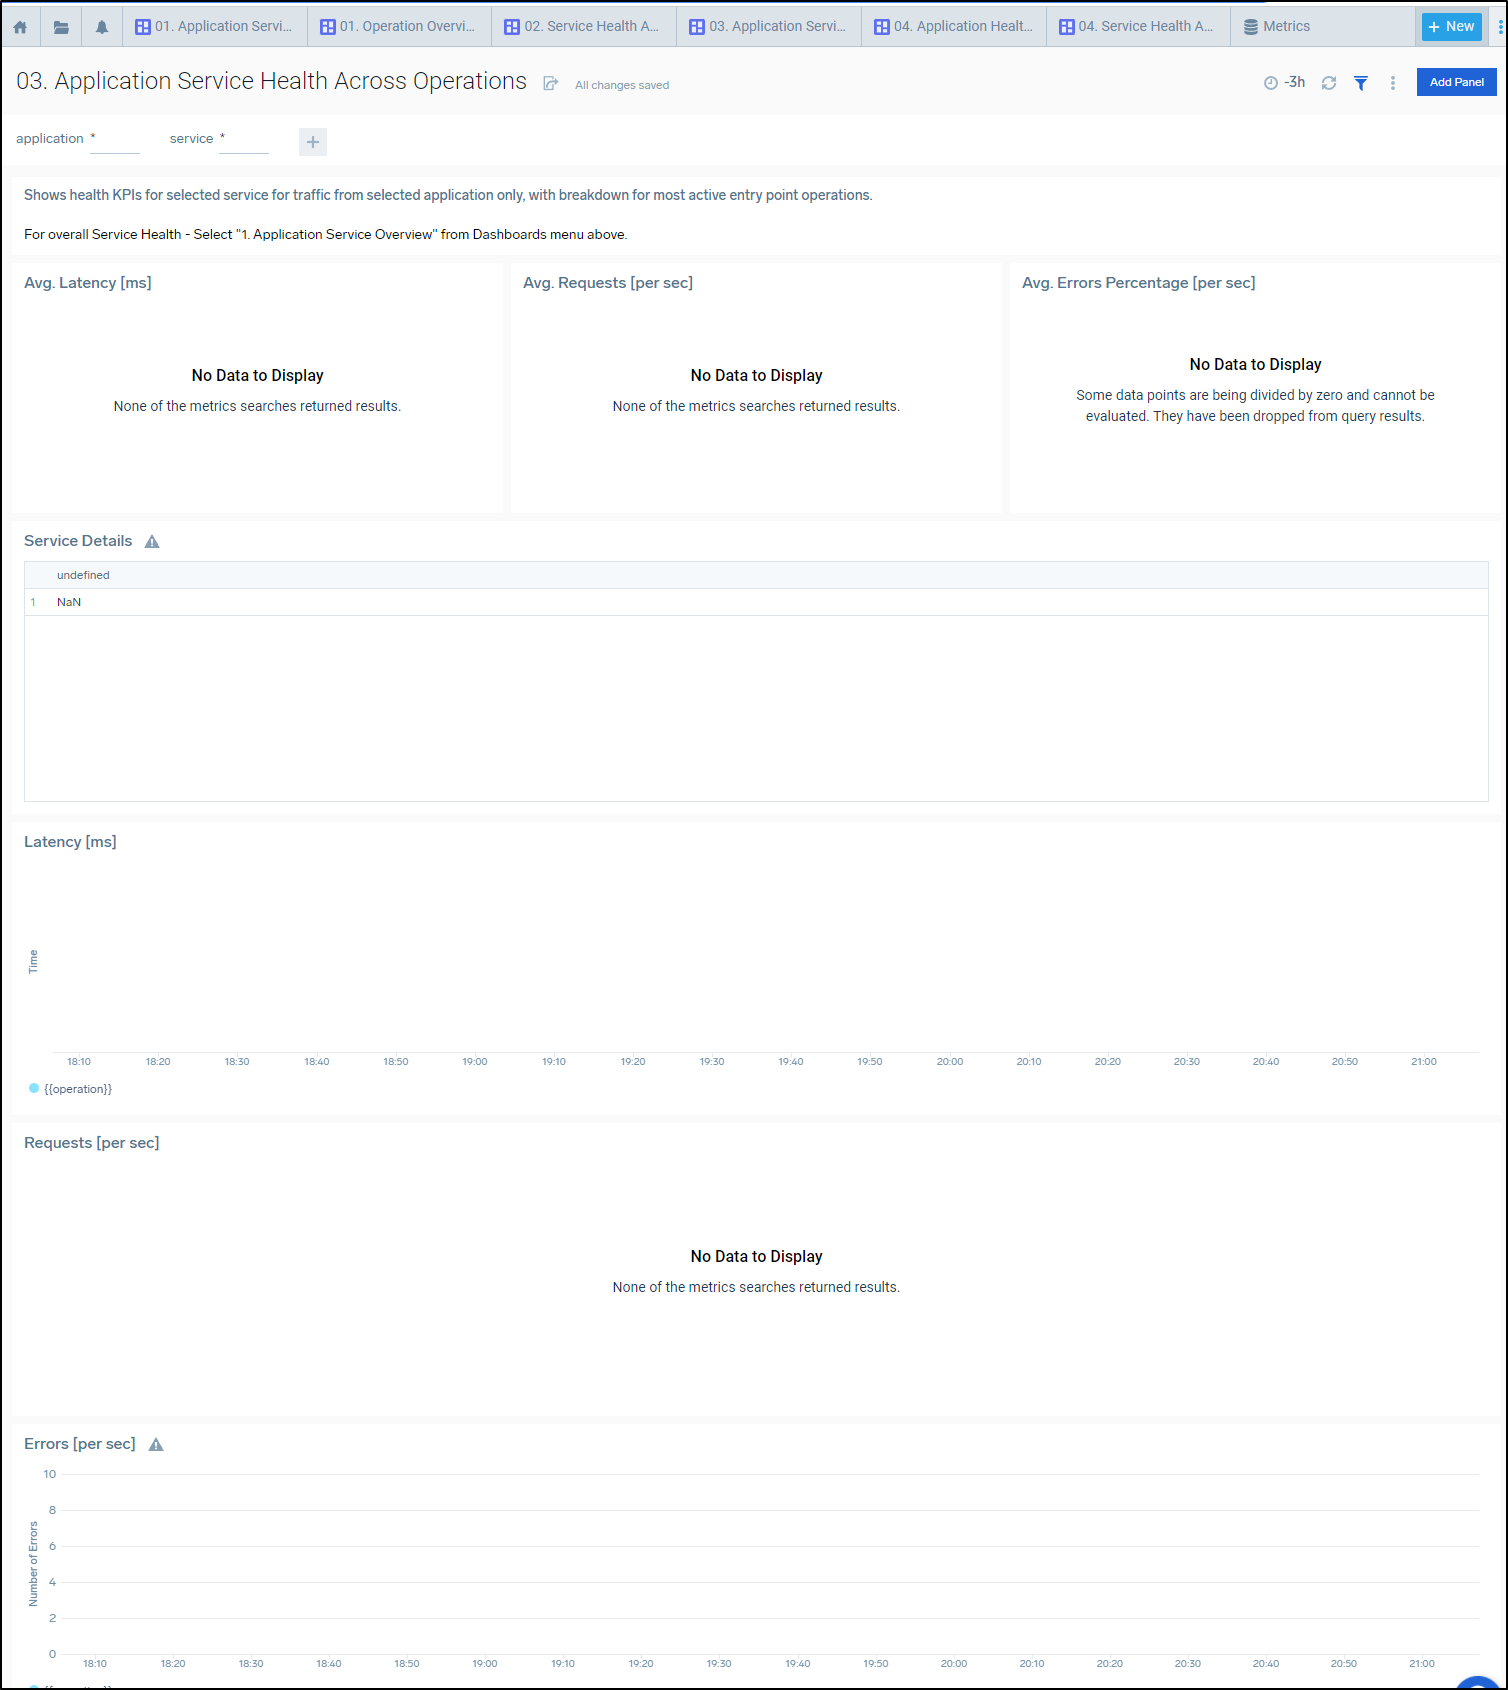
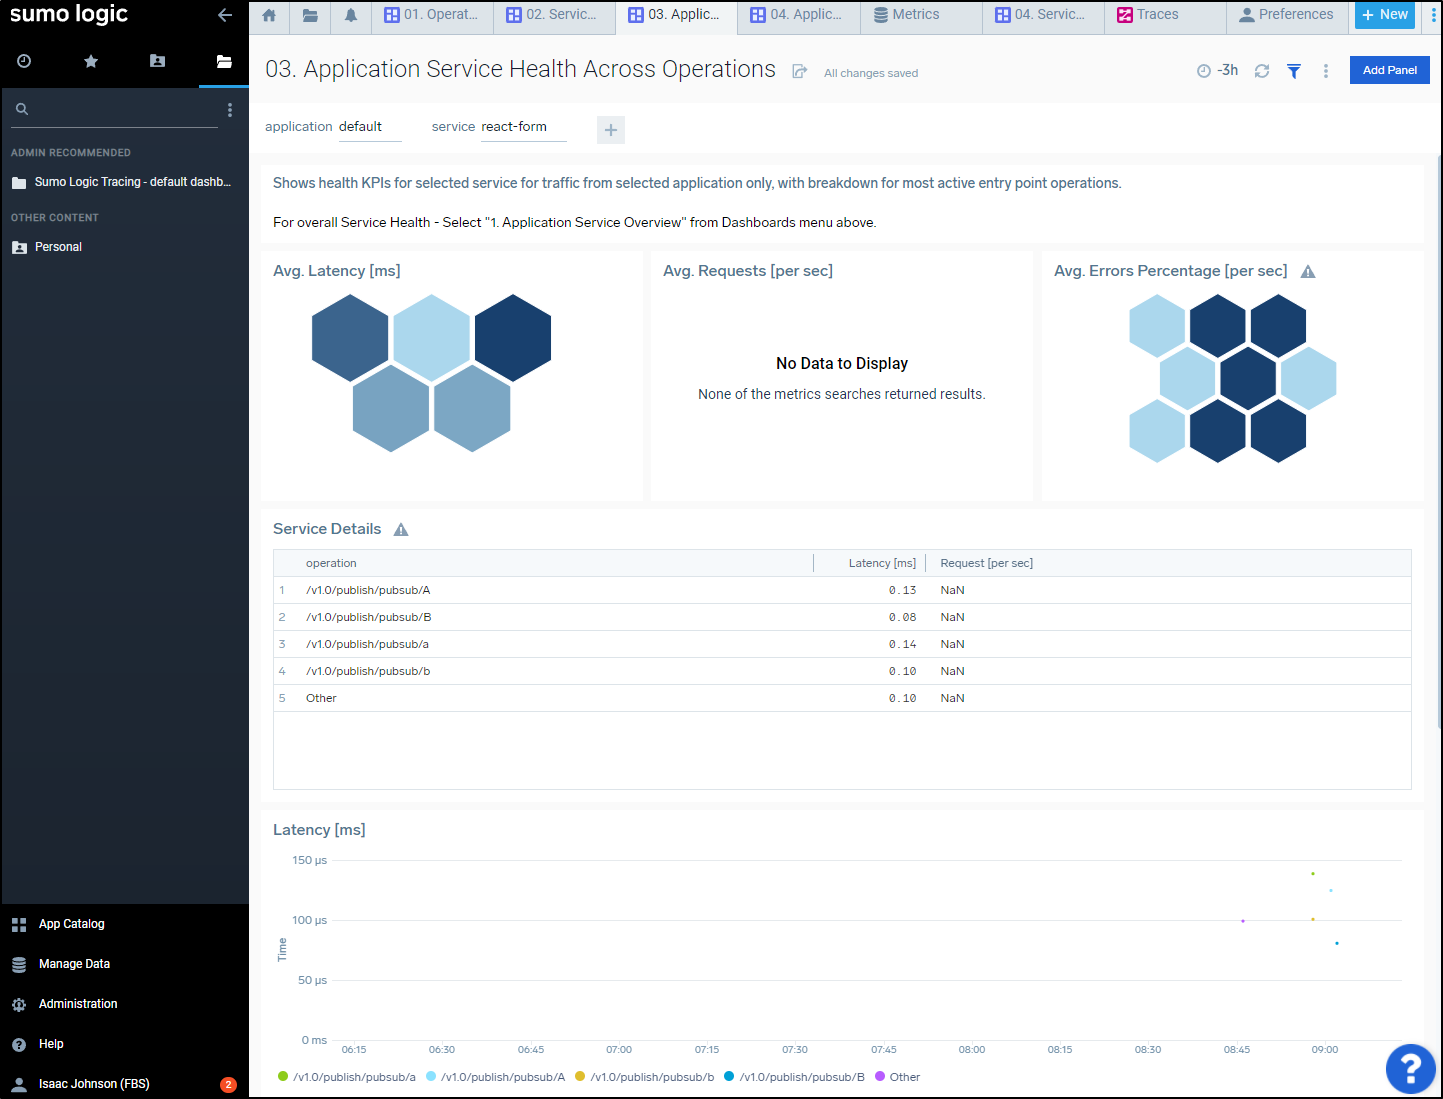
The Application Service Health Across Operations is a good way to break down which Operations are doing what
The Latency graph gives me the clue that first “Other” events were monitored, then “bindings/kubeevents”
K3s Dashboard
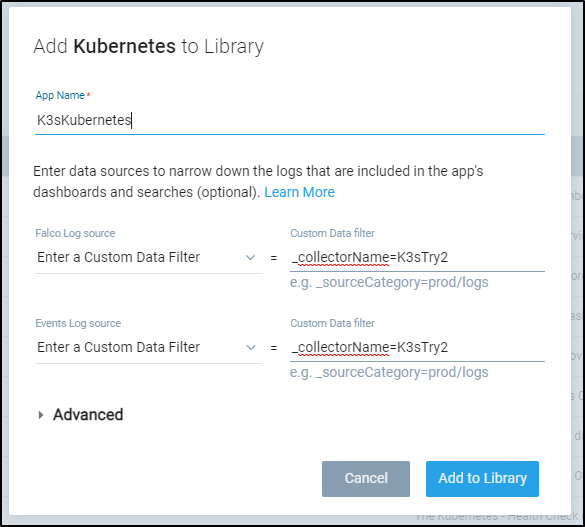
We can add the Kubernetes Dashboard using the collectorName which was set at the start
Add the “Kubernetes” App
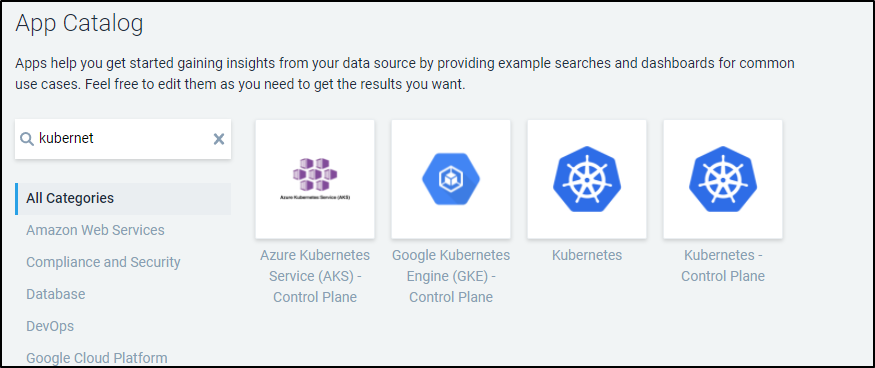
use the _collectorName we used with Helm
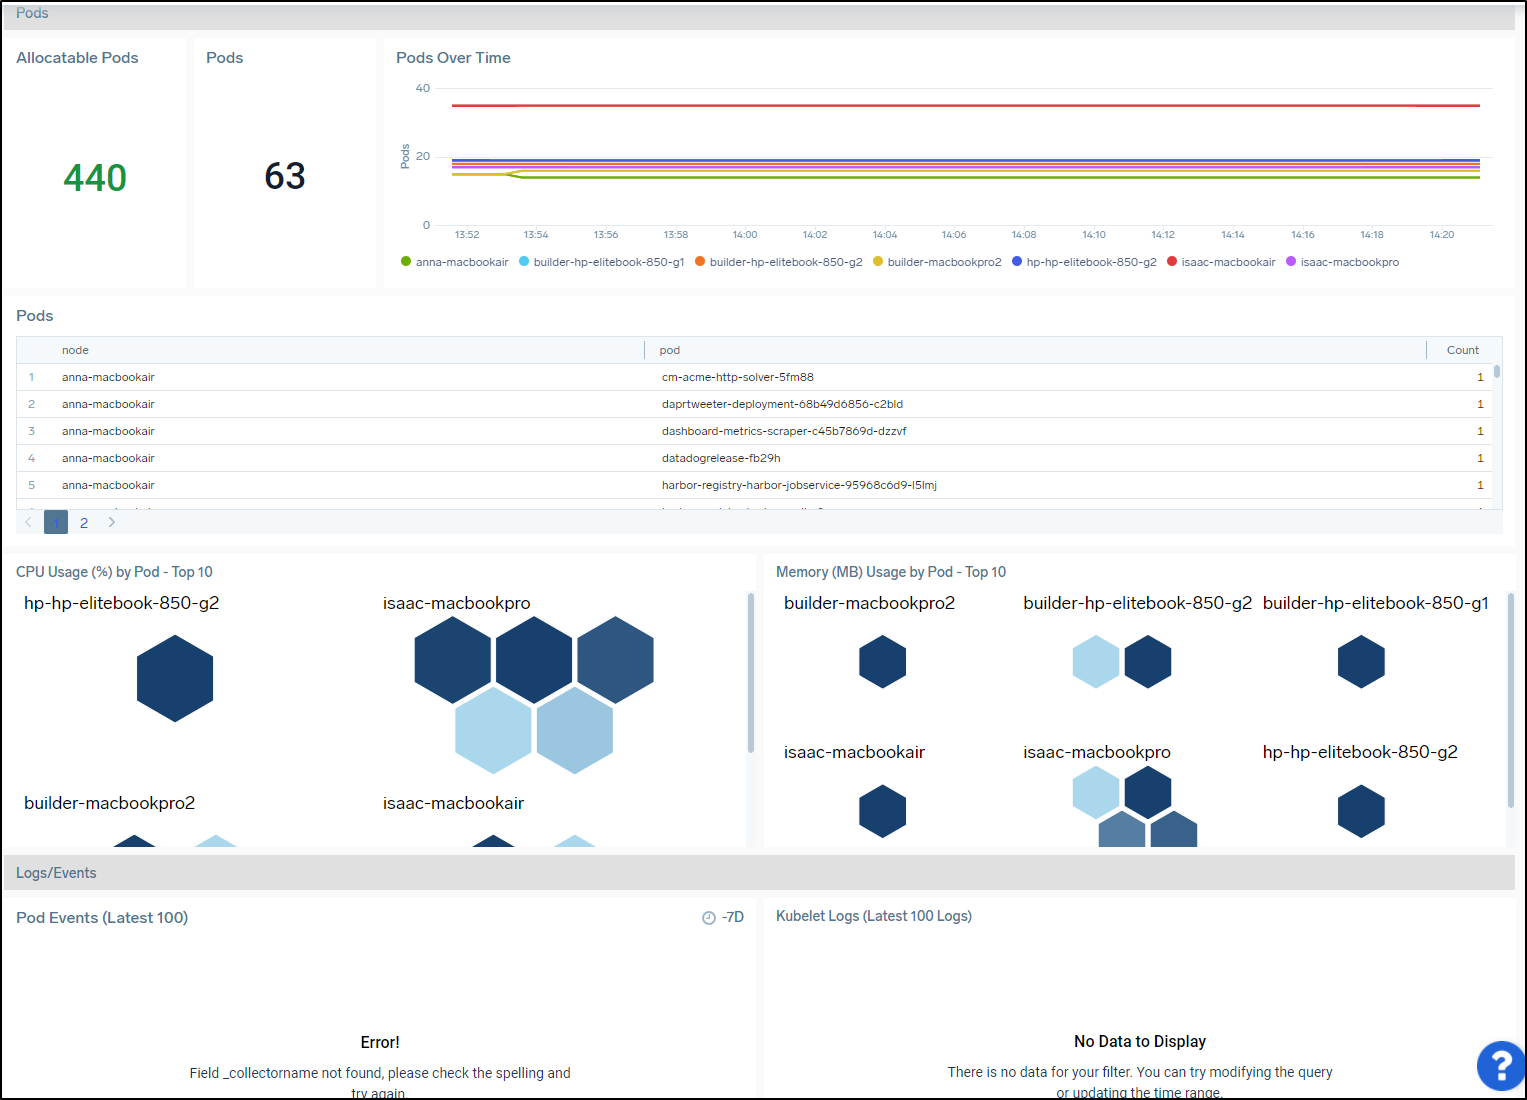
We can see a good overview dashboard of the whole Kubernetes cluster
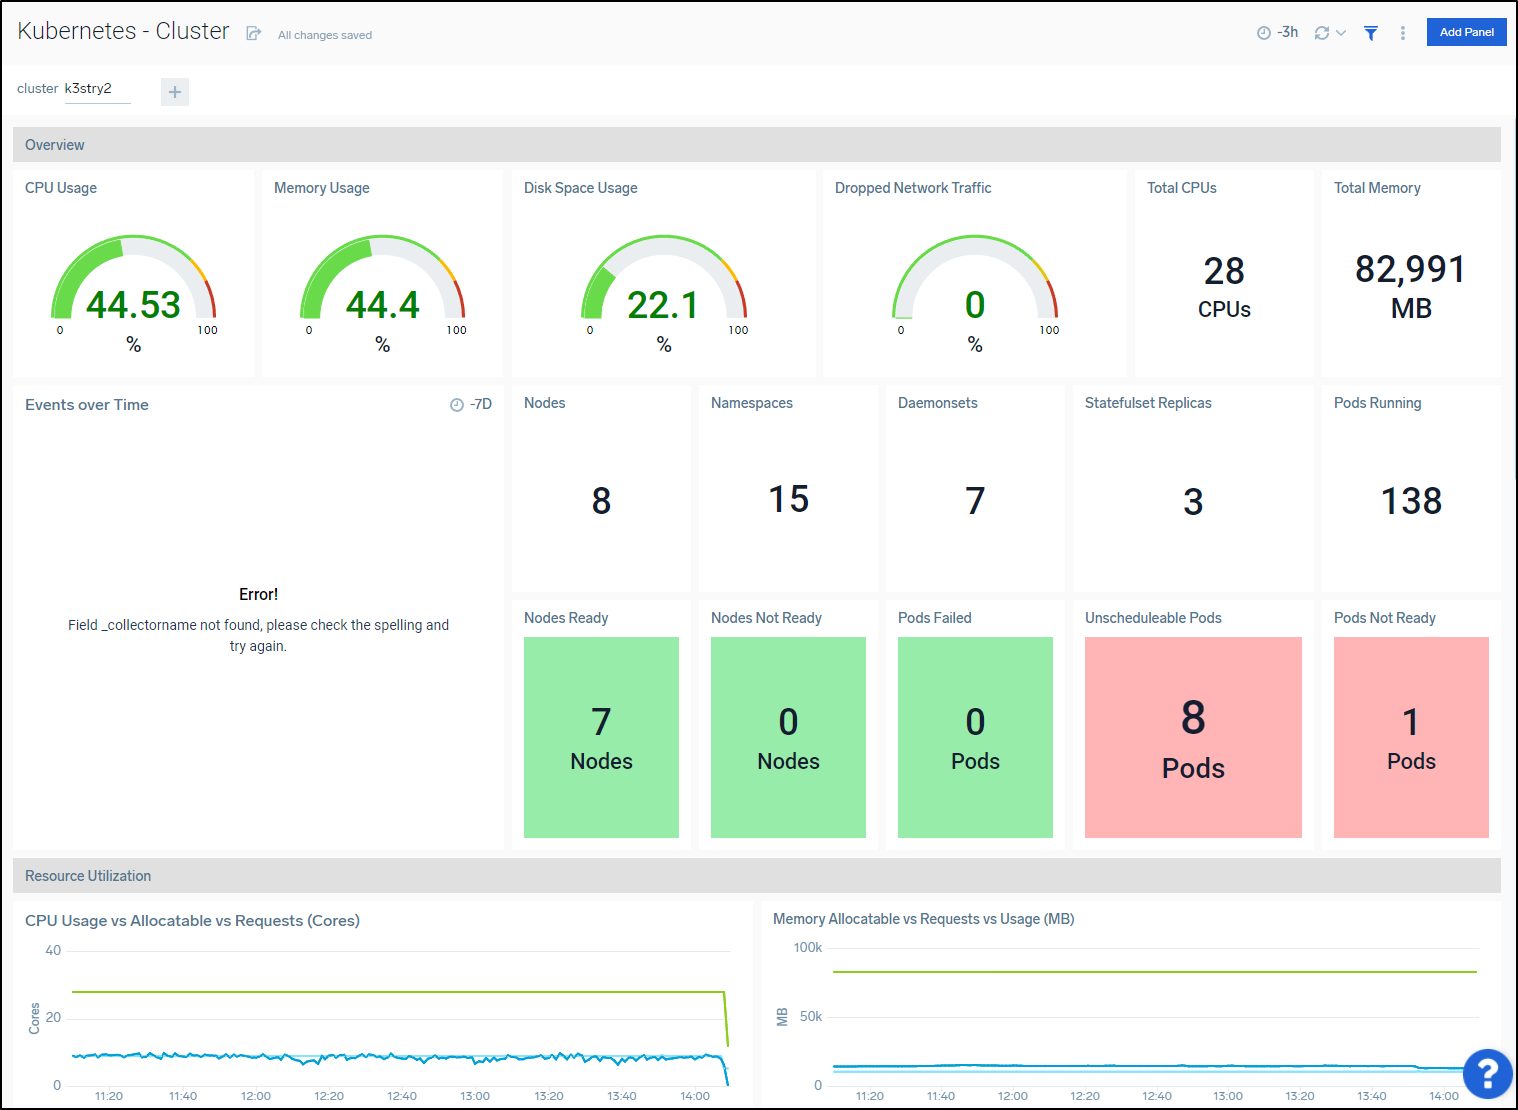
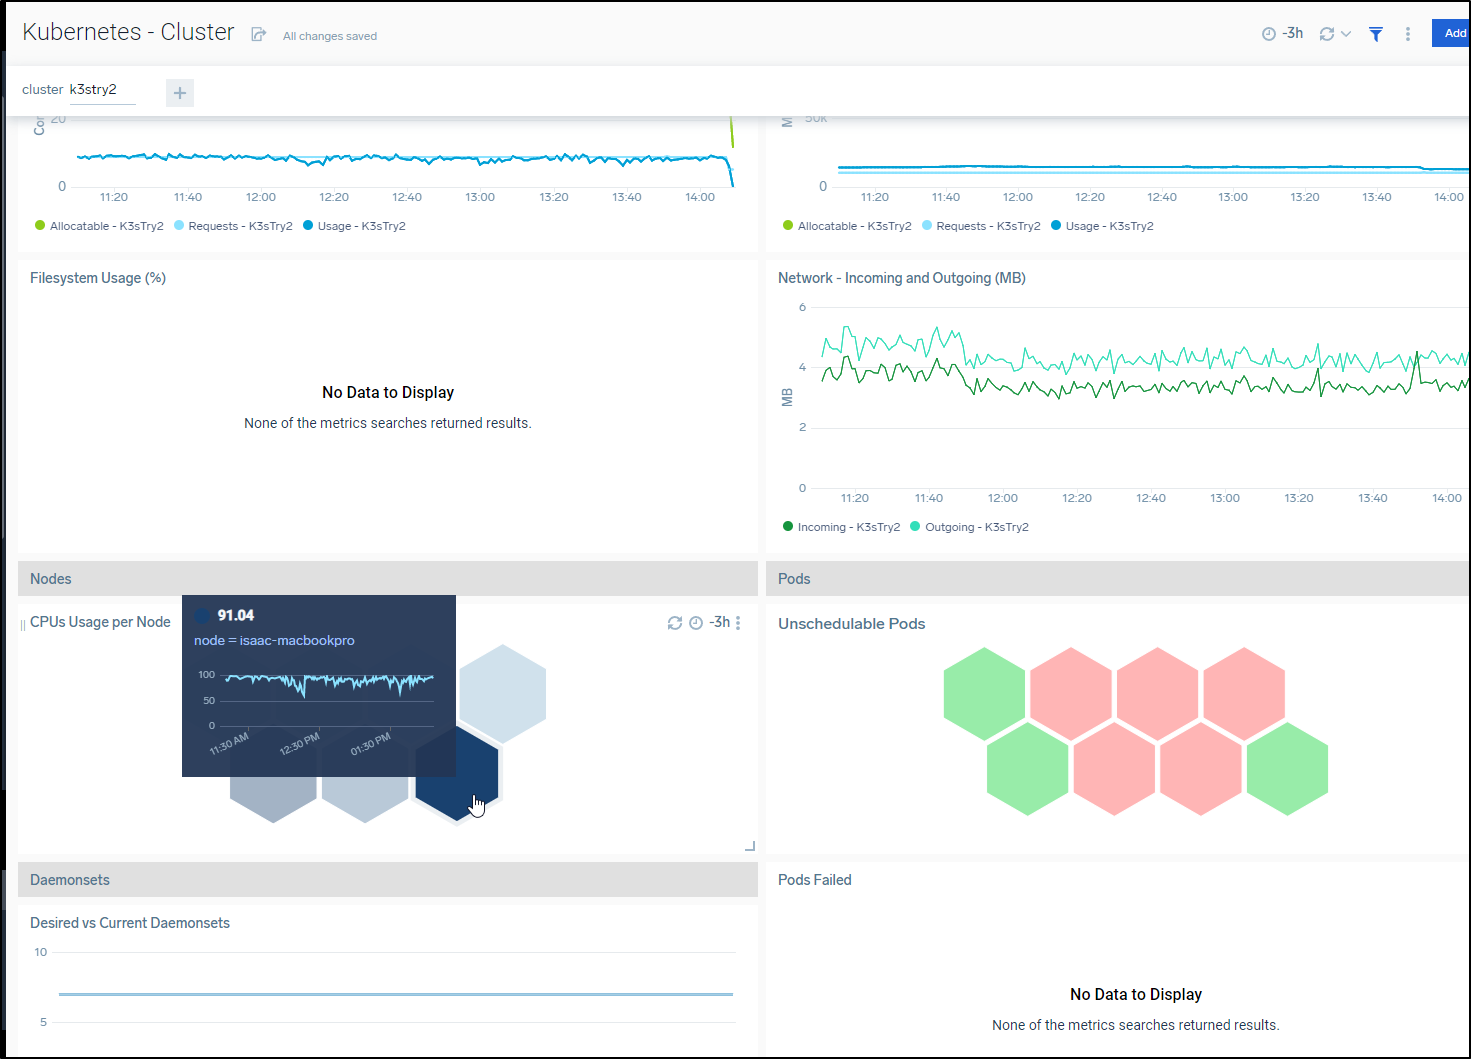
Scrolling down we can see one of the Nodes is overloaded (Macbook Pro)
I see a key pod is down, the Harbor DB
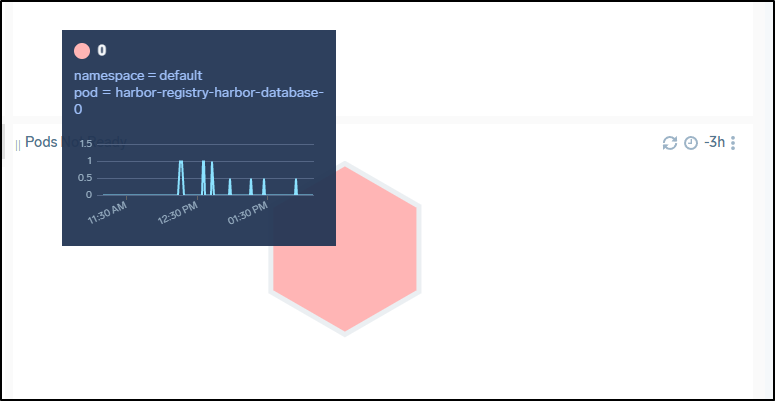
This shows up in a pod listing as well:
mysumorelease-sumologic-fluentd-logs-2                  1/1     Running            0          3h24m
mysumorelease-sumologic-fluentd-logs-1                  1/1     Running            0          3h24m
otel-collector-85b54fbfdc-d4j2z                         1/1     Running            0          20m
harbor-registry-harbor-database-0                       0/1     CrashLoopBackOff   47         5d22h
I’ll cycle it and see if it comes back up
$ kubectl delete pod harbor-registry-harbor-database-0
pod "harbor-registry-harbor-database-0" deleted

$ kubectl get pods | grep harbor
harbor-registry-harbor-registry-86dbbfd48f-kg4dt        2/2     Running           0          46d
harbor-registry-harbor-redis-0                          1/1     Running           0          45d
harbor-registry-harbor-jobservice-95968c6d9-l5lmj       1/1     Running           1          46d
harbor-registry-harbor-portal-76bdcc7969-cnc8r          1/1     Running           0          71d
harbor-registry-harbor-core-7b4594d78d-vcv84            1/1     Running           3          45d
harbor-registry-harbor-exporter-655dd658bb-79nrj        1/1     Running           6          71d
harbor-registry-harbor-notary-server-779c6bddd5-6rb94   1/1     Running           3          71d
harbor-registry-harbor-chartmuseum-559bd98f8f-4bmrz     1/1     Running           0          5d23h
harbor-registry-harbor-trivy-0                          1/1     Running           0          5d23h
harbor-registry-harbor-notary-signer-c97648889-xt56d    1/1     Running           1          5d22h
harbor-registry-harbor-database-0                       0/1     PodInitializing   0          32s

$ kubectl get pods harbor-registry-harbor-database-0
NAME                                READY   STATUS    RESTARTS   AGE
harbor-registry-harbor-database-0   1/1     Running   1          93s
And after a few refreshes I see that disappear (as it should) from the pane in Sumo
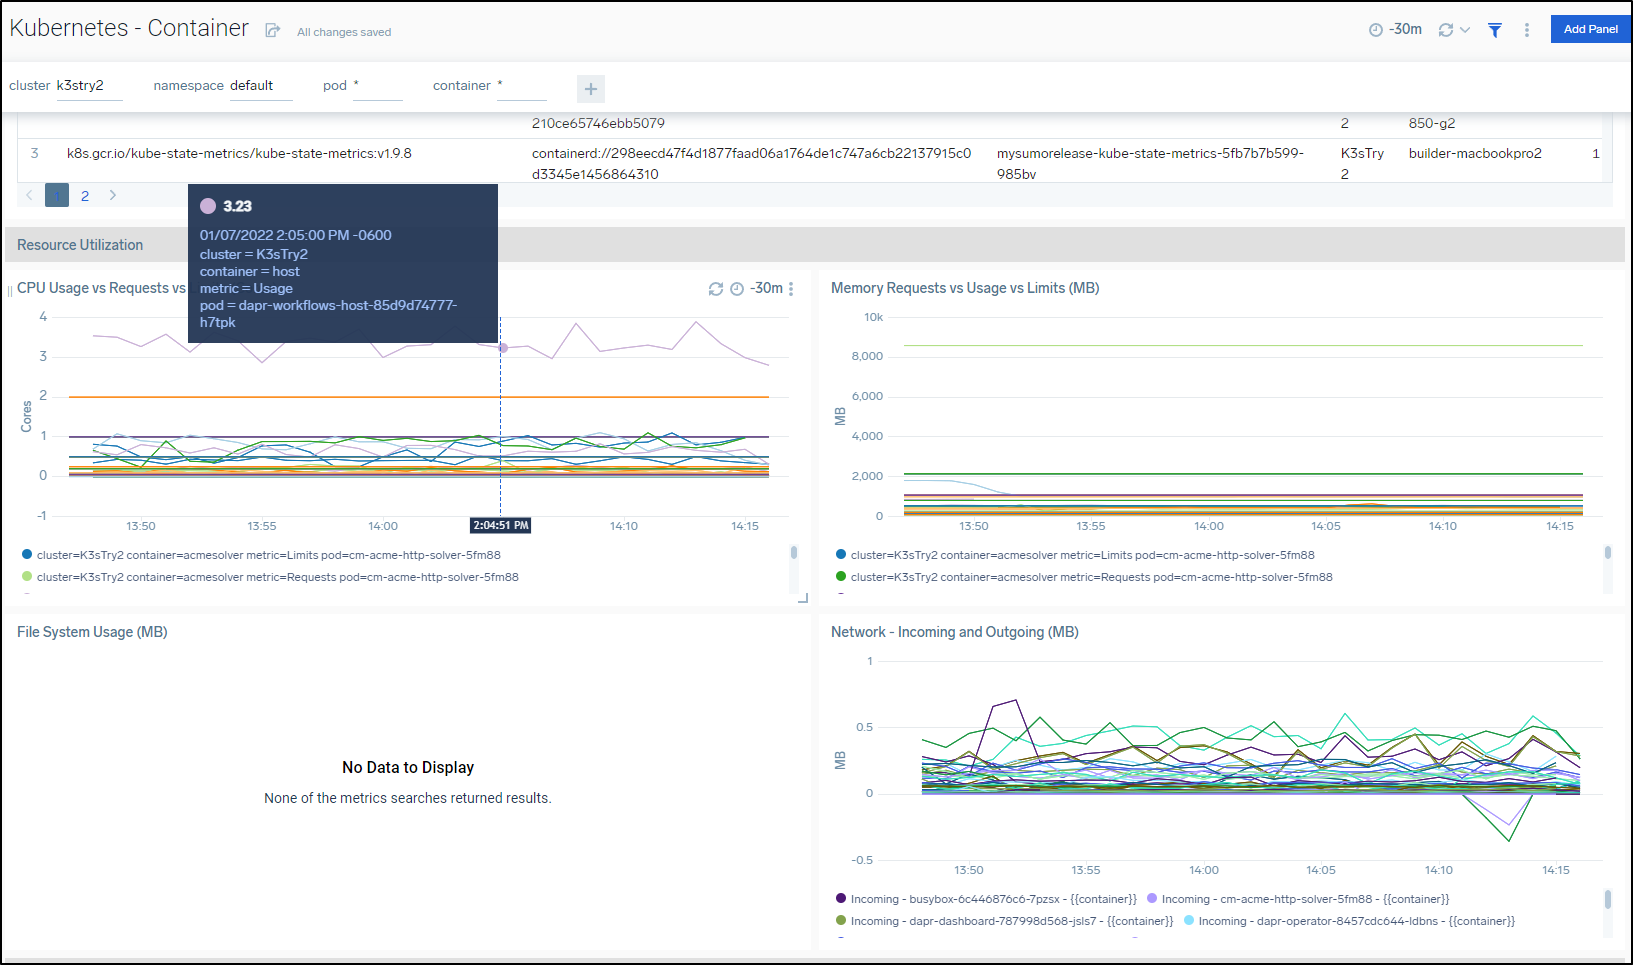
I can see the metrics collected limited to a given namespace. Here we see the container system usage of the default namespace
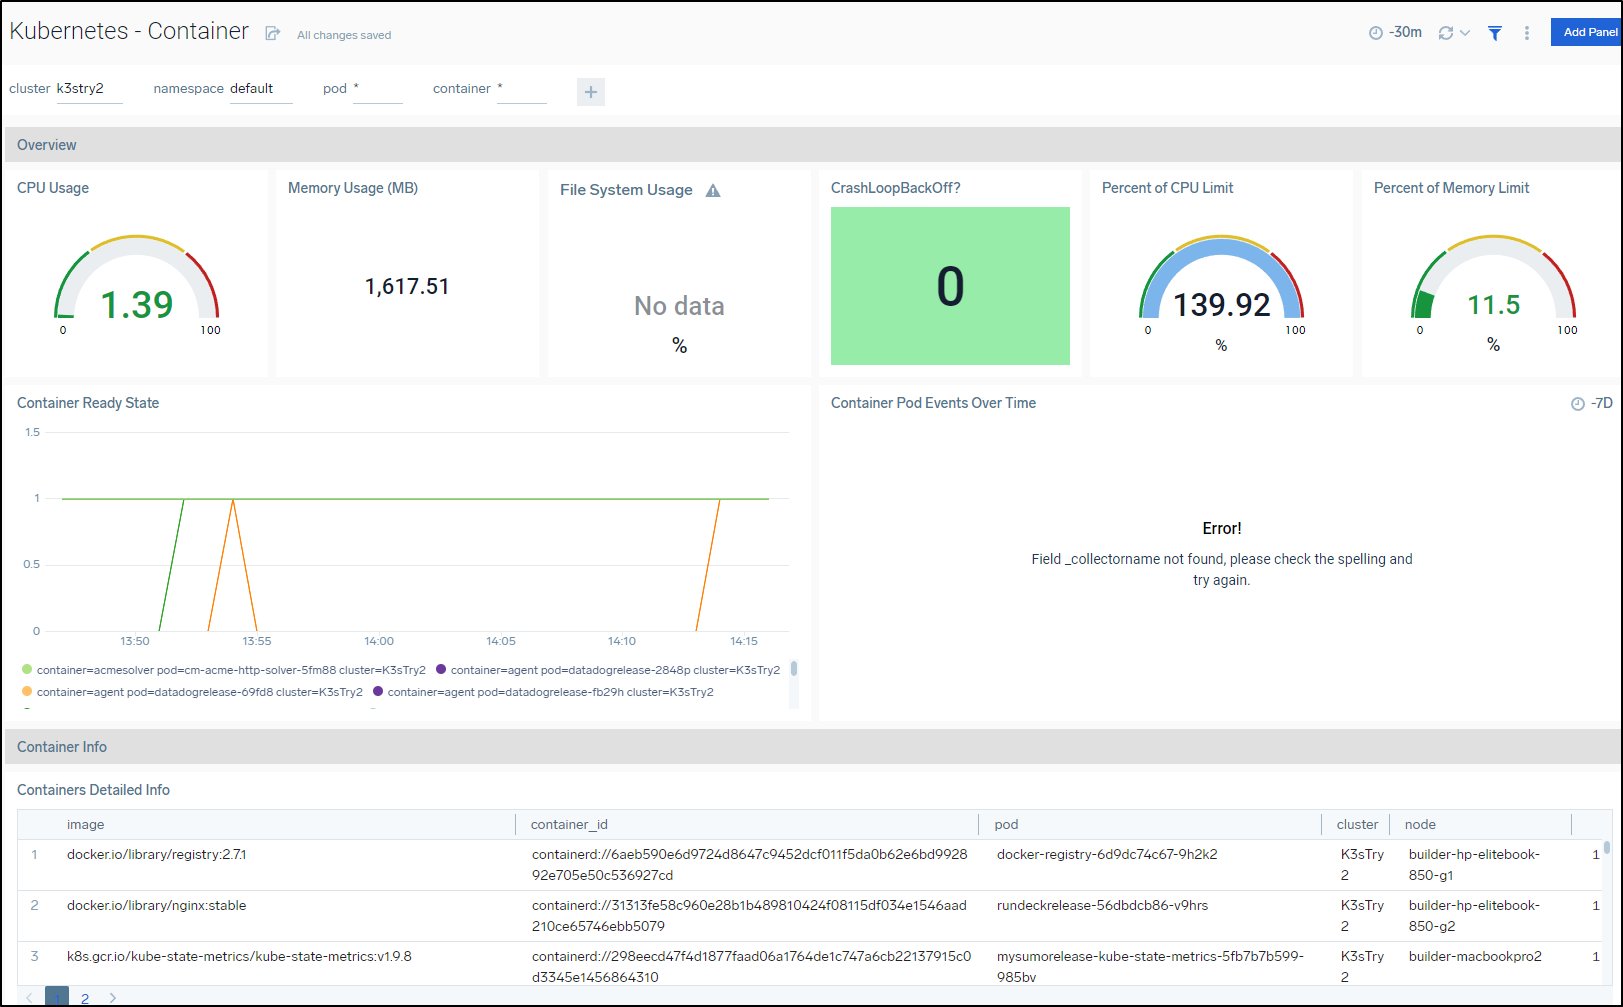
And we can see that the Workflow container is my troublemaker (it runs an Azure workflow for Dapr)
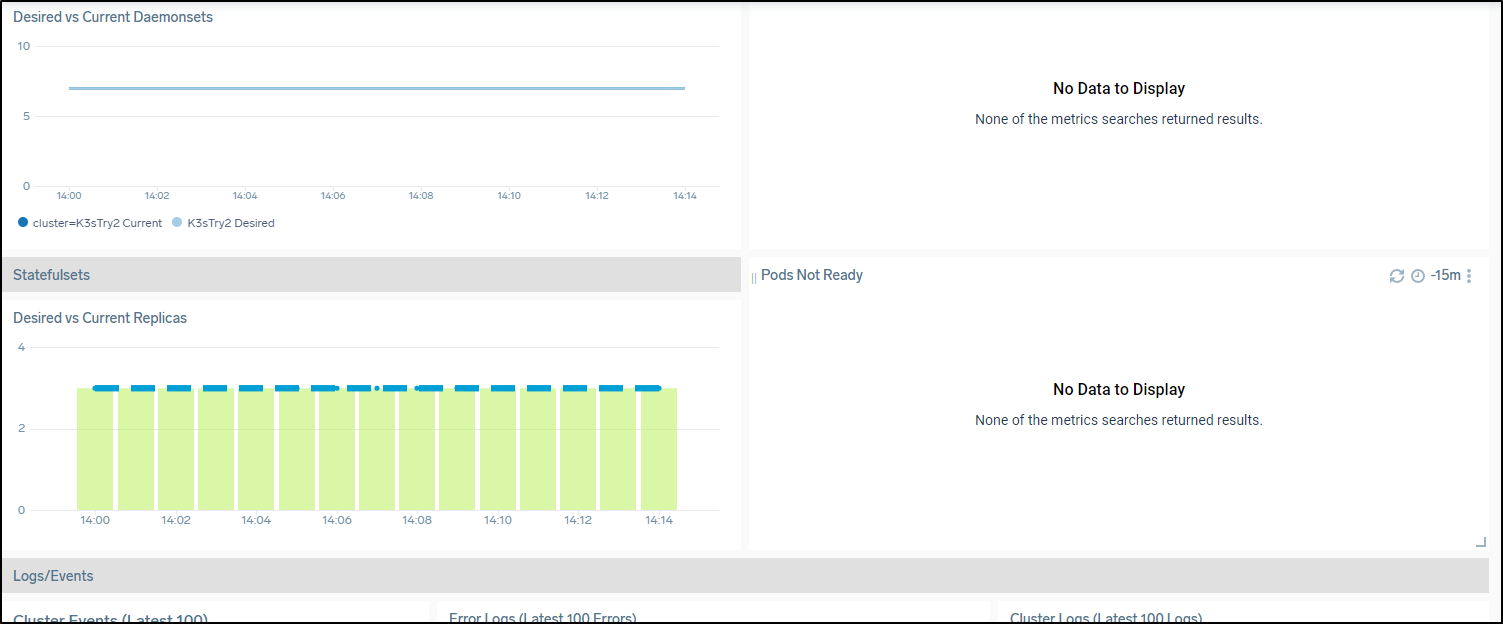
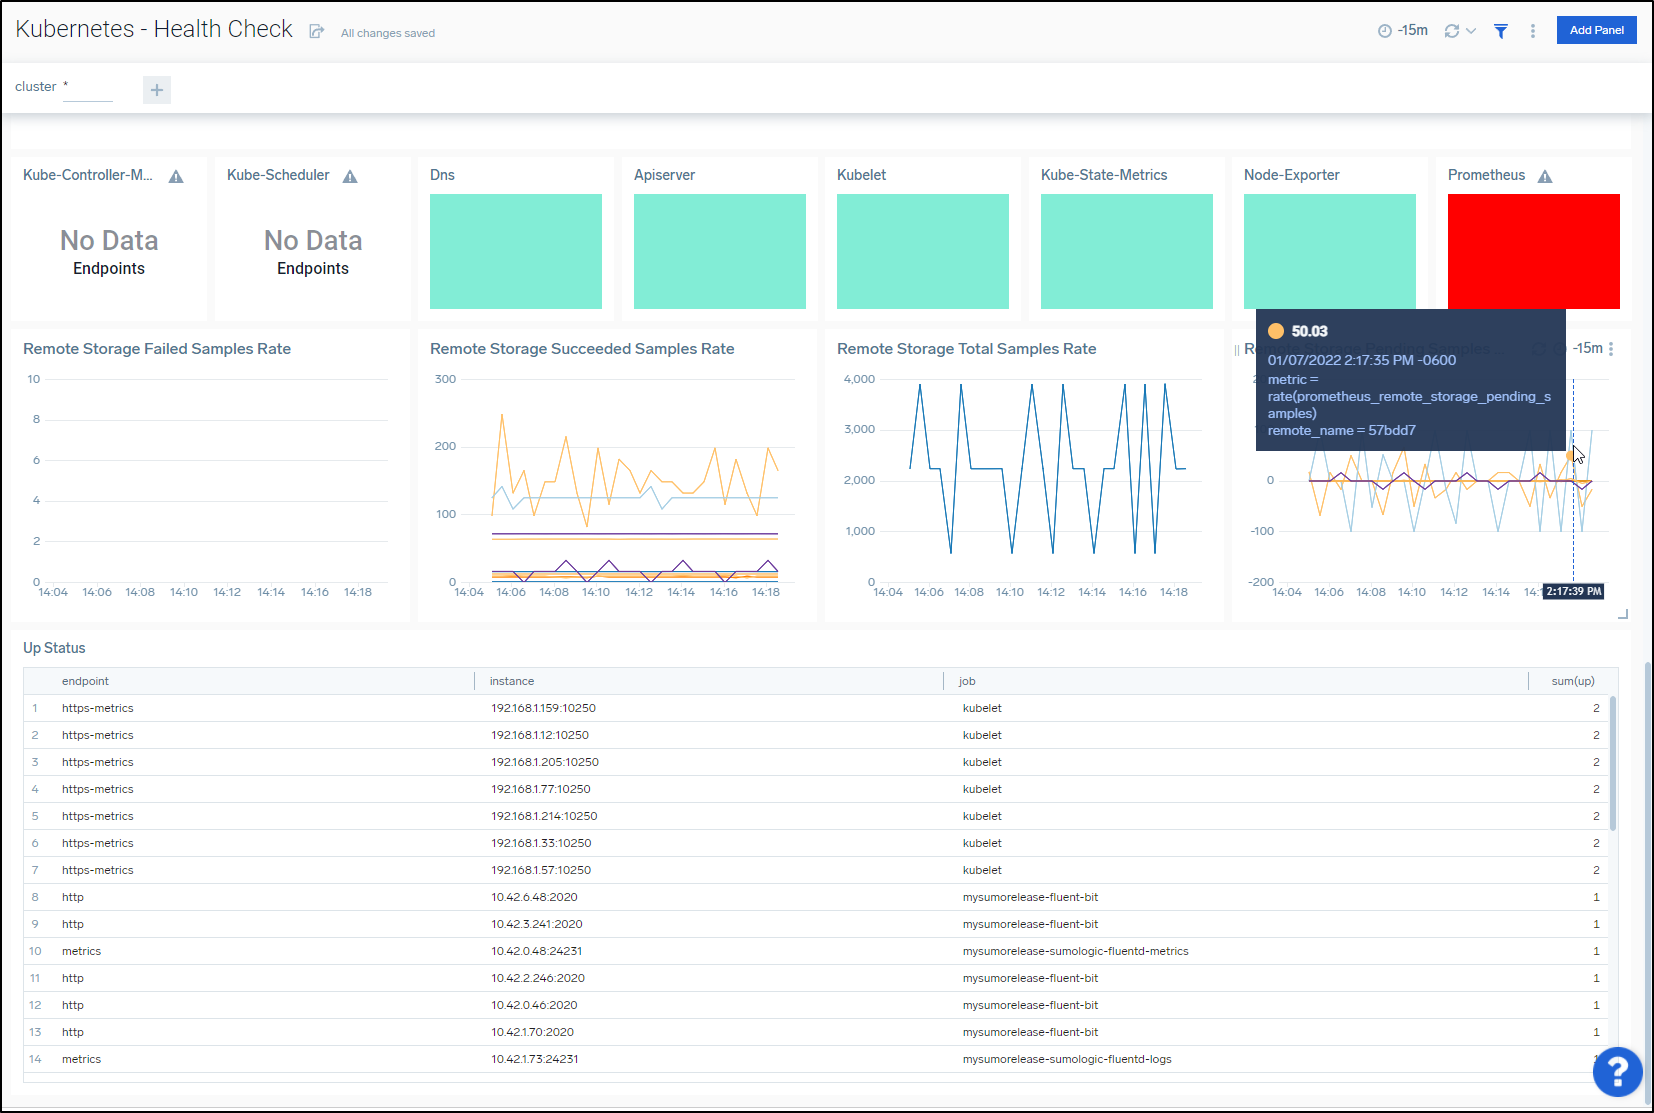
A Dashboard I have not seen elsewhere is a “Kubernetes - Health Check” one that is intended to ensure fluent is keeping up with our events (hard to know if we miss something if fluent cannot keep up)
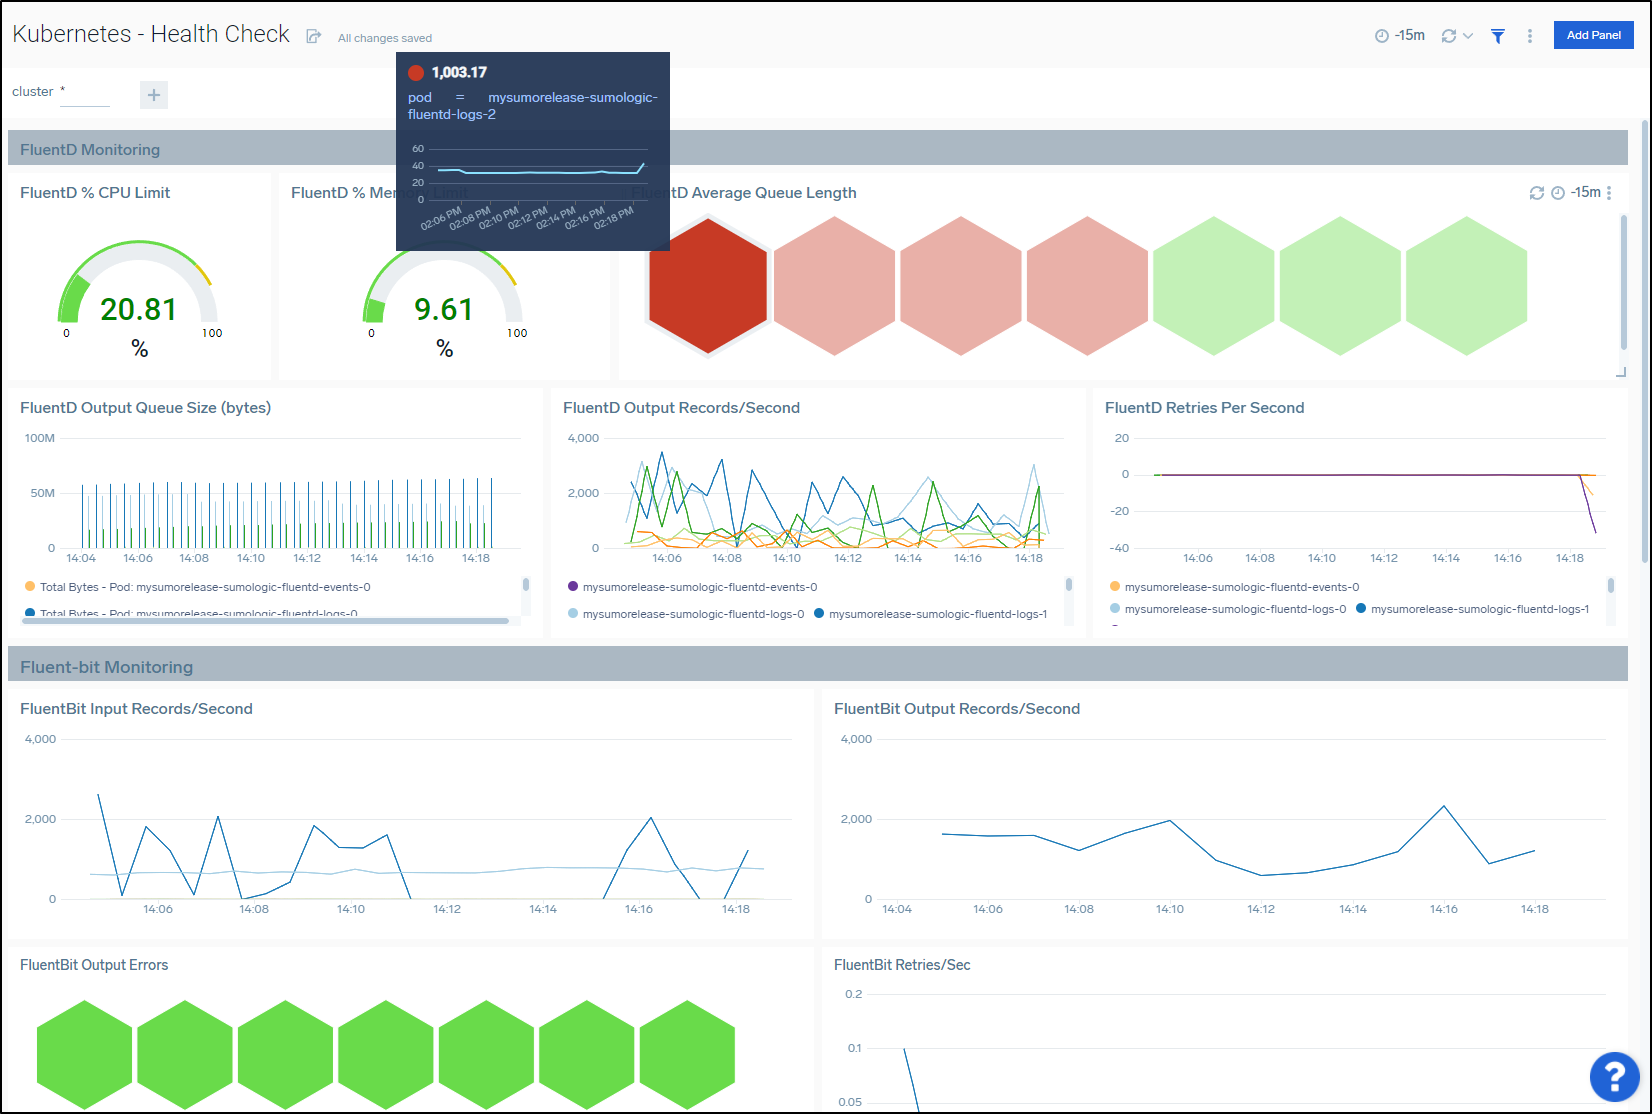
with sampling details at the bottom
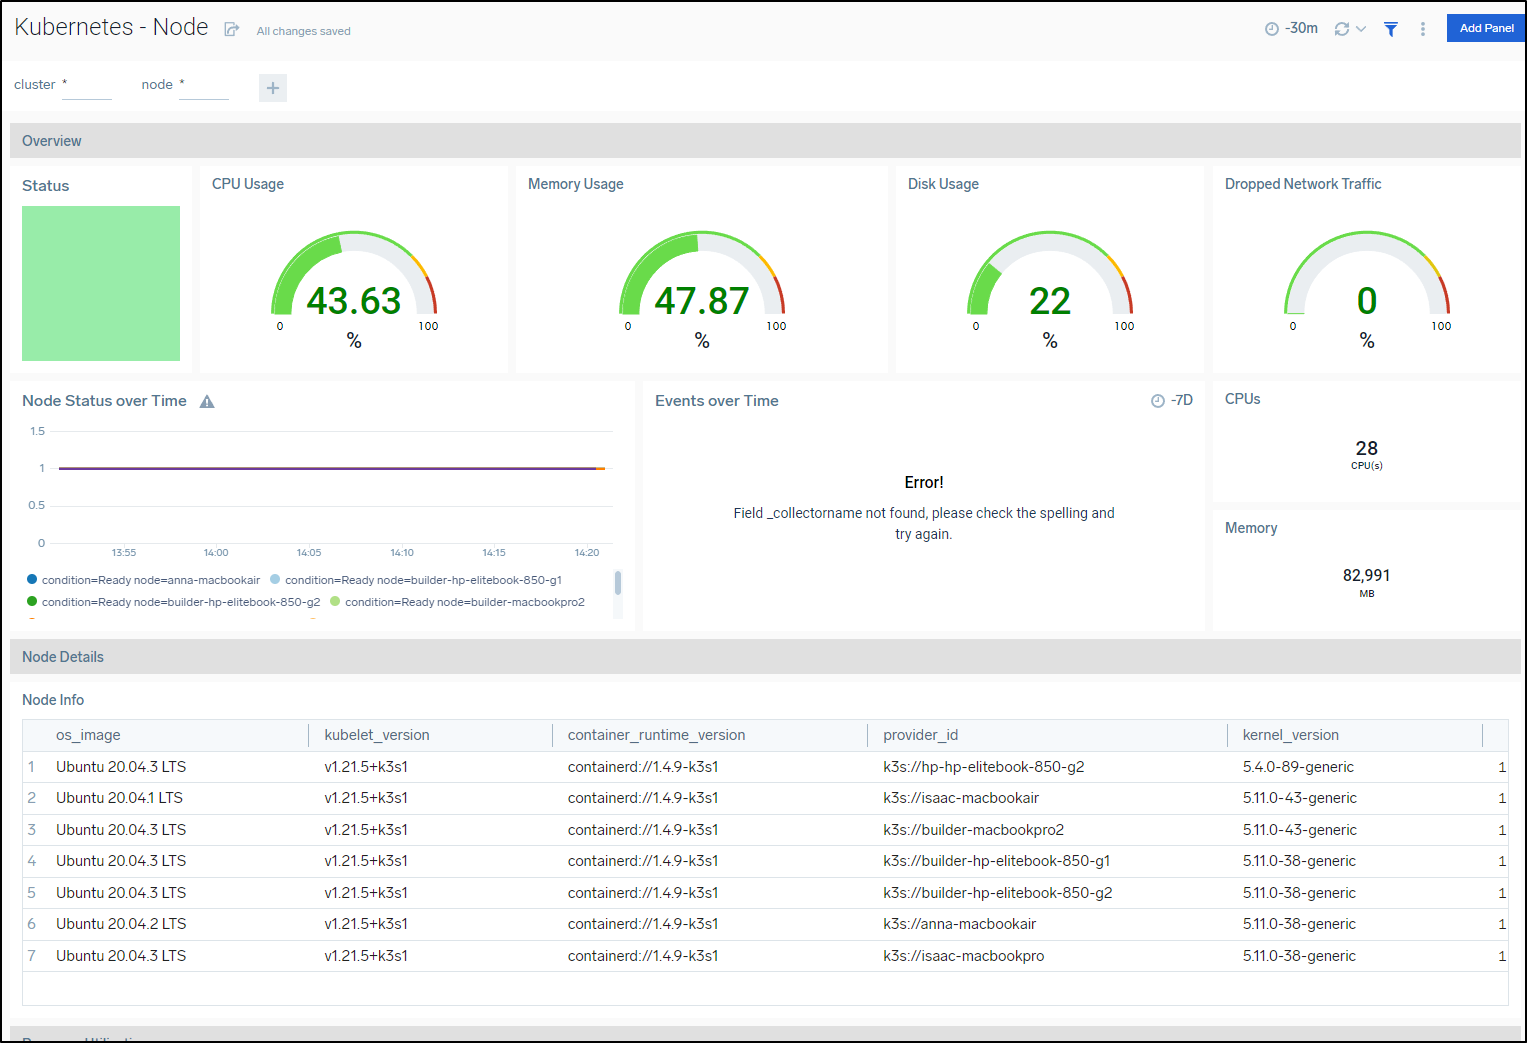
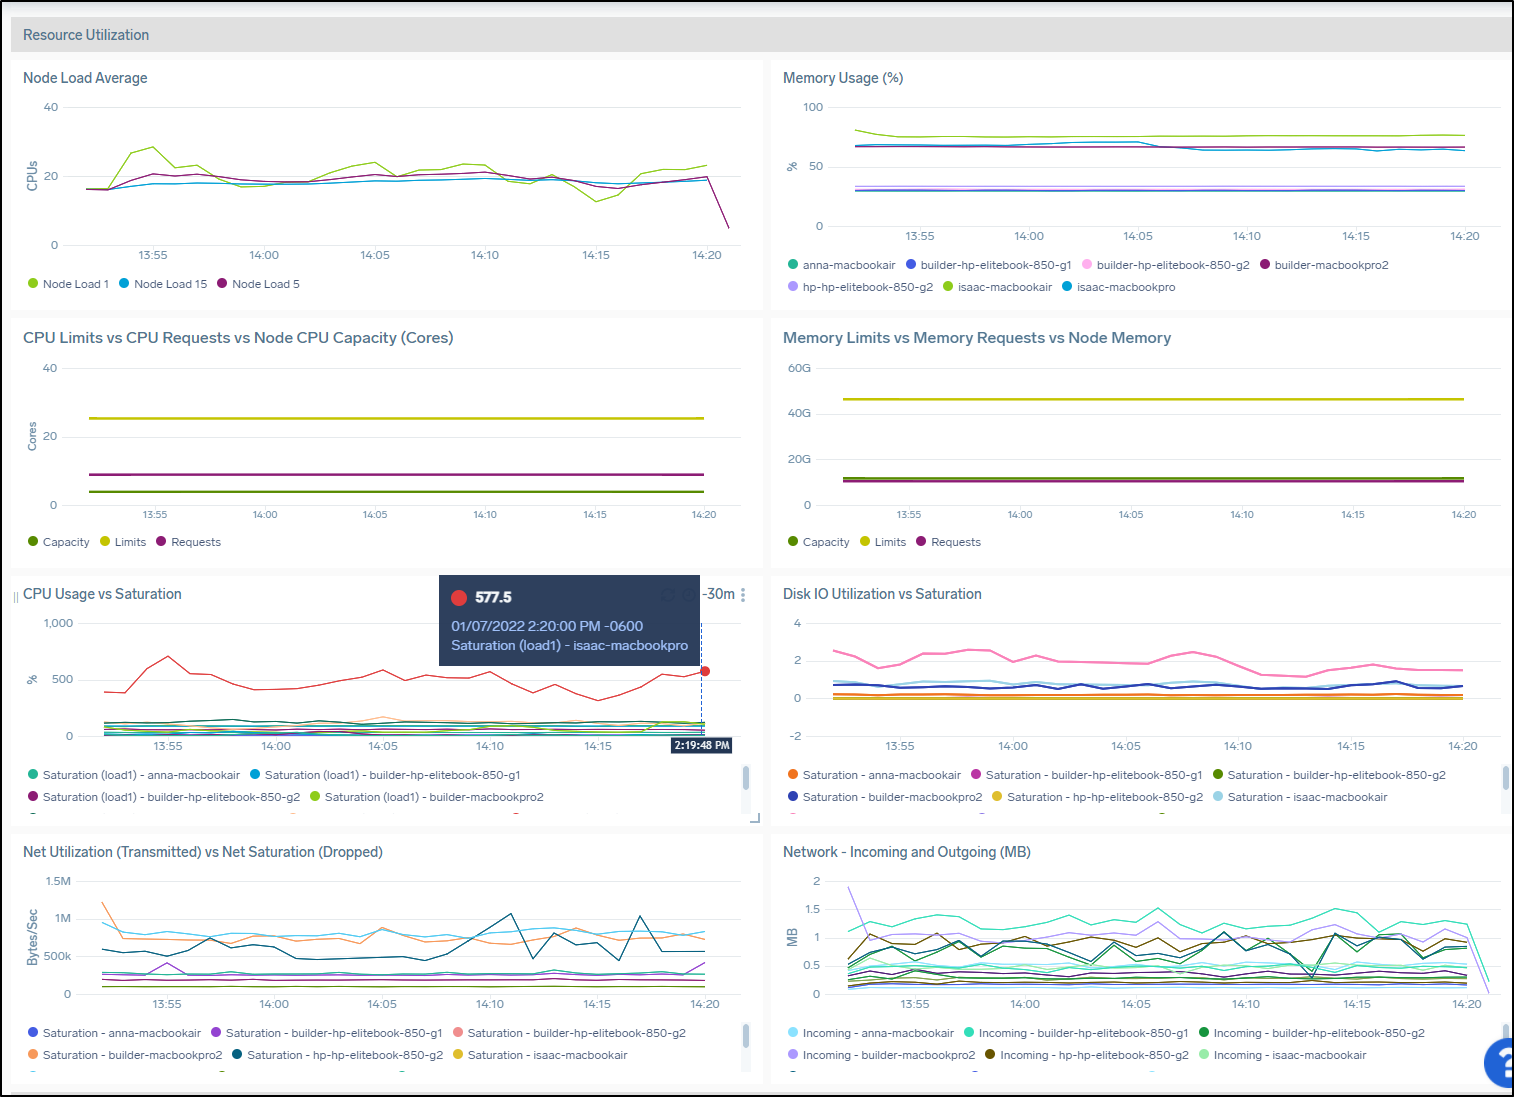
A Dashboard that is fantastic, but quite long, is the “Node” dashboard that breaks down all the detais I might need to track on Node health.
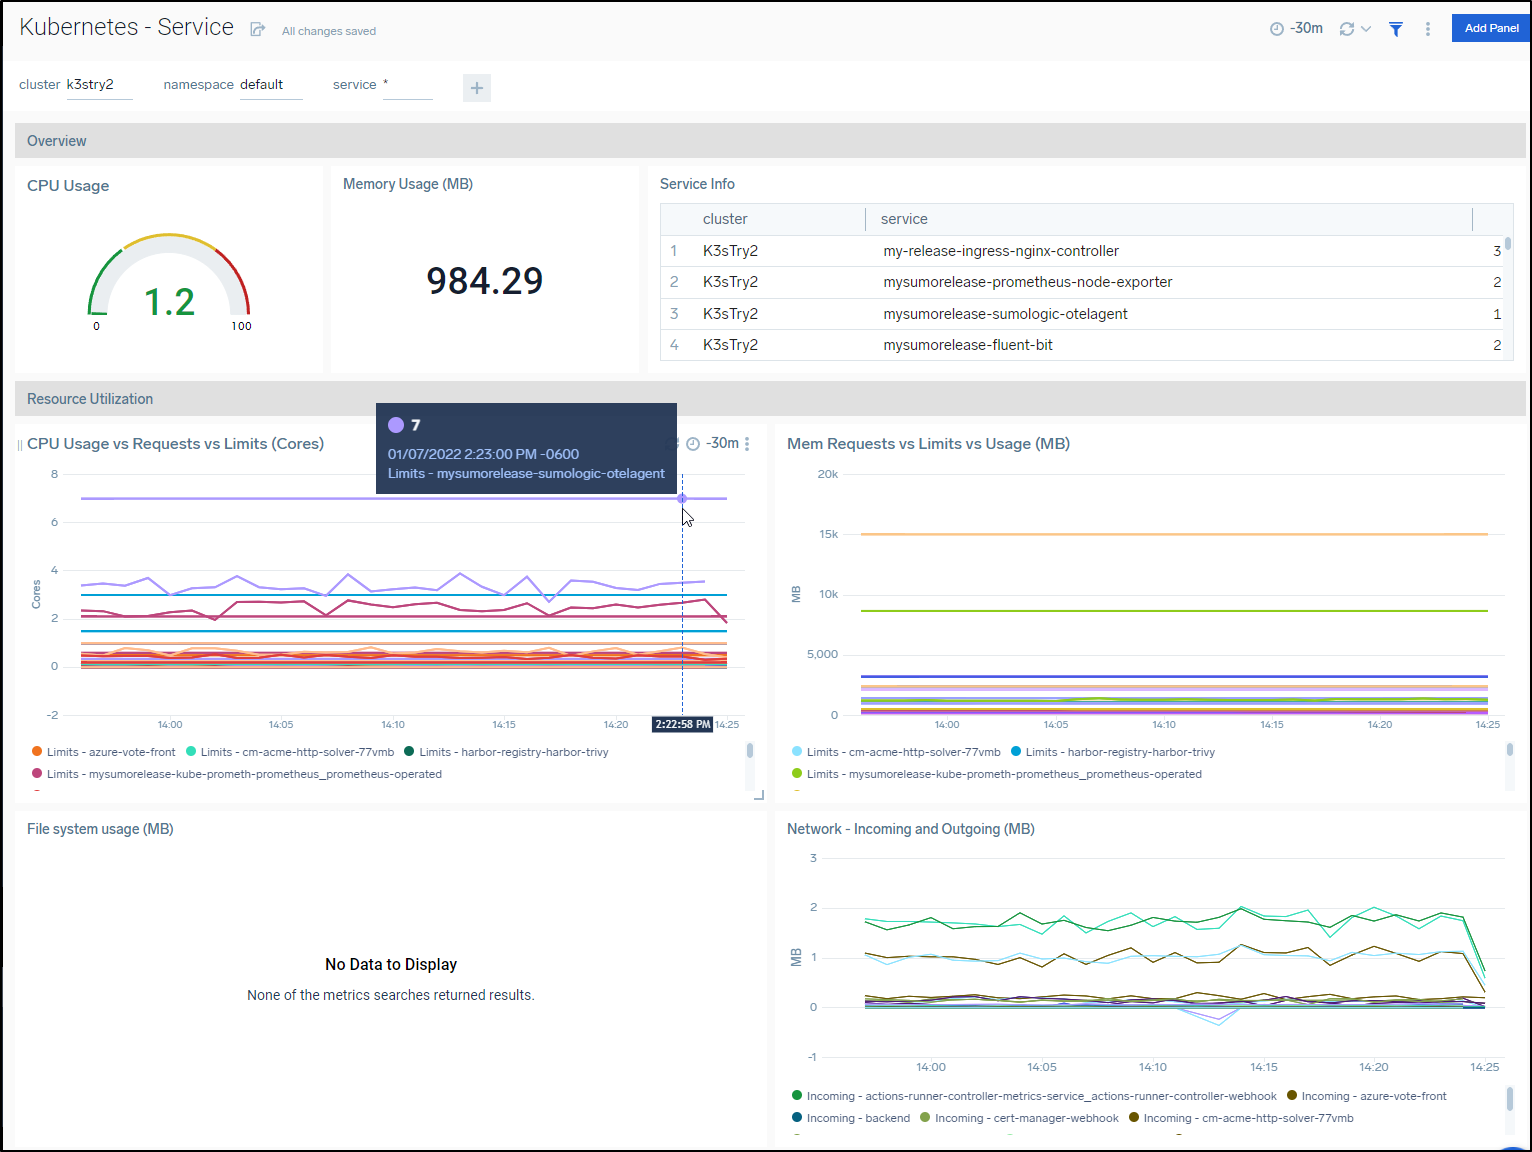
The service Dashboard, as you would expect, breaks things down by services
Lastly, a good color chart for Hygiene would make for a nice Wall mounted dashboard in the office
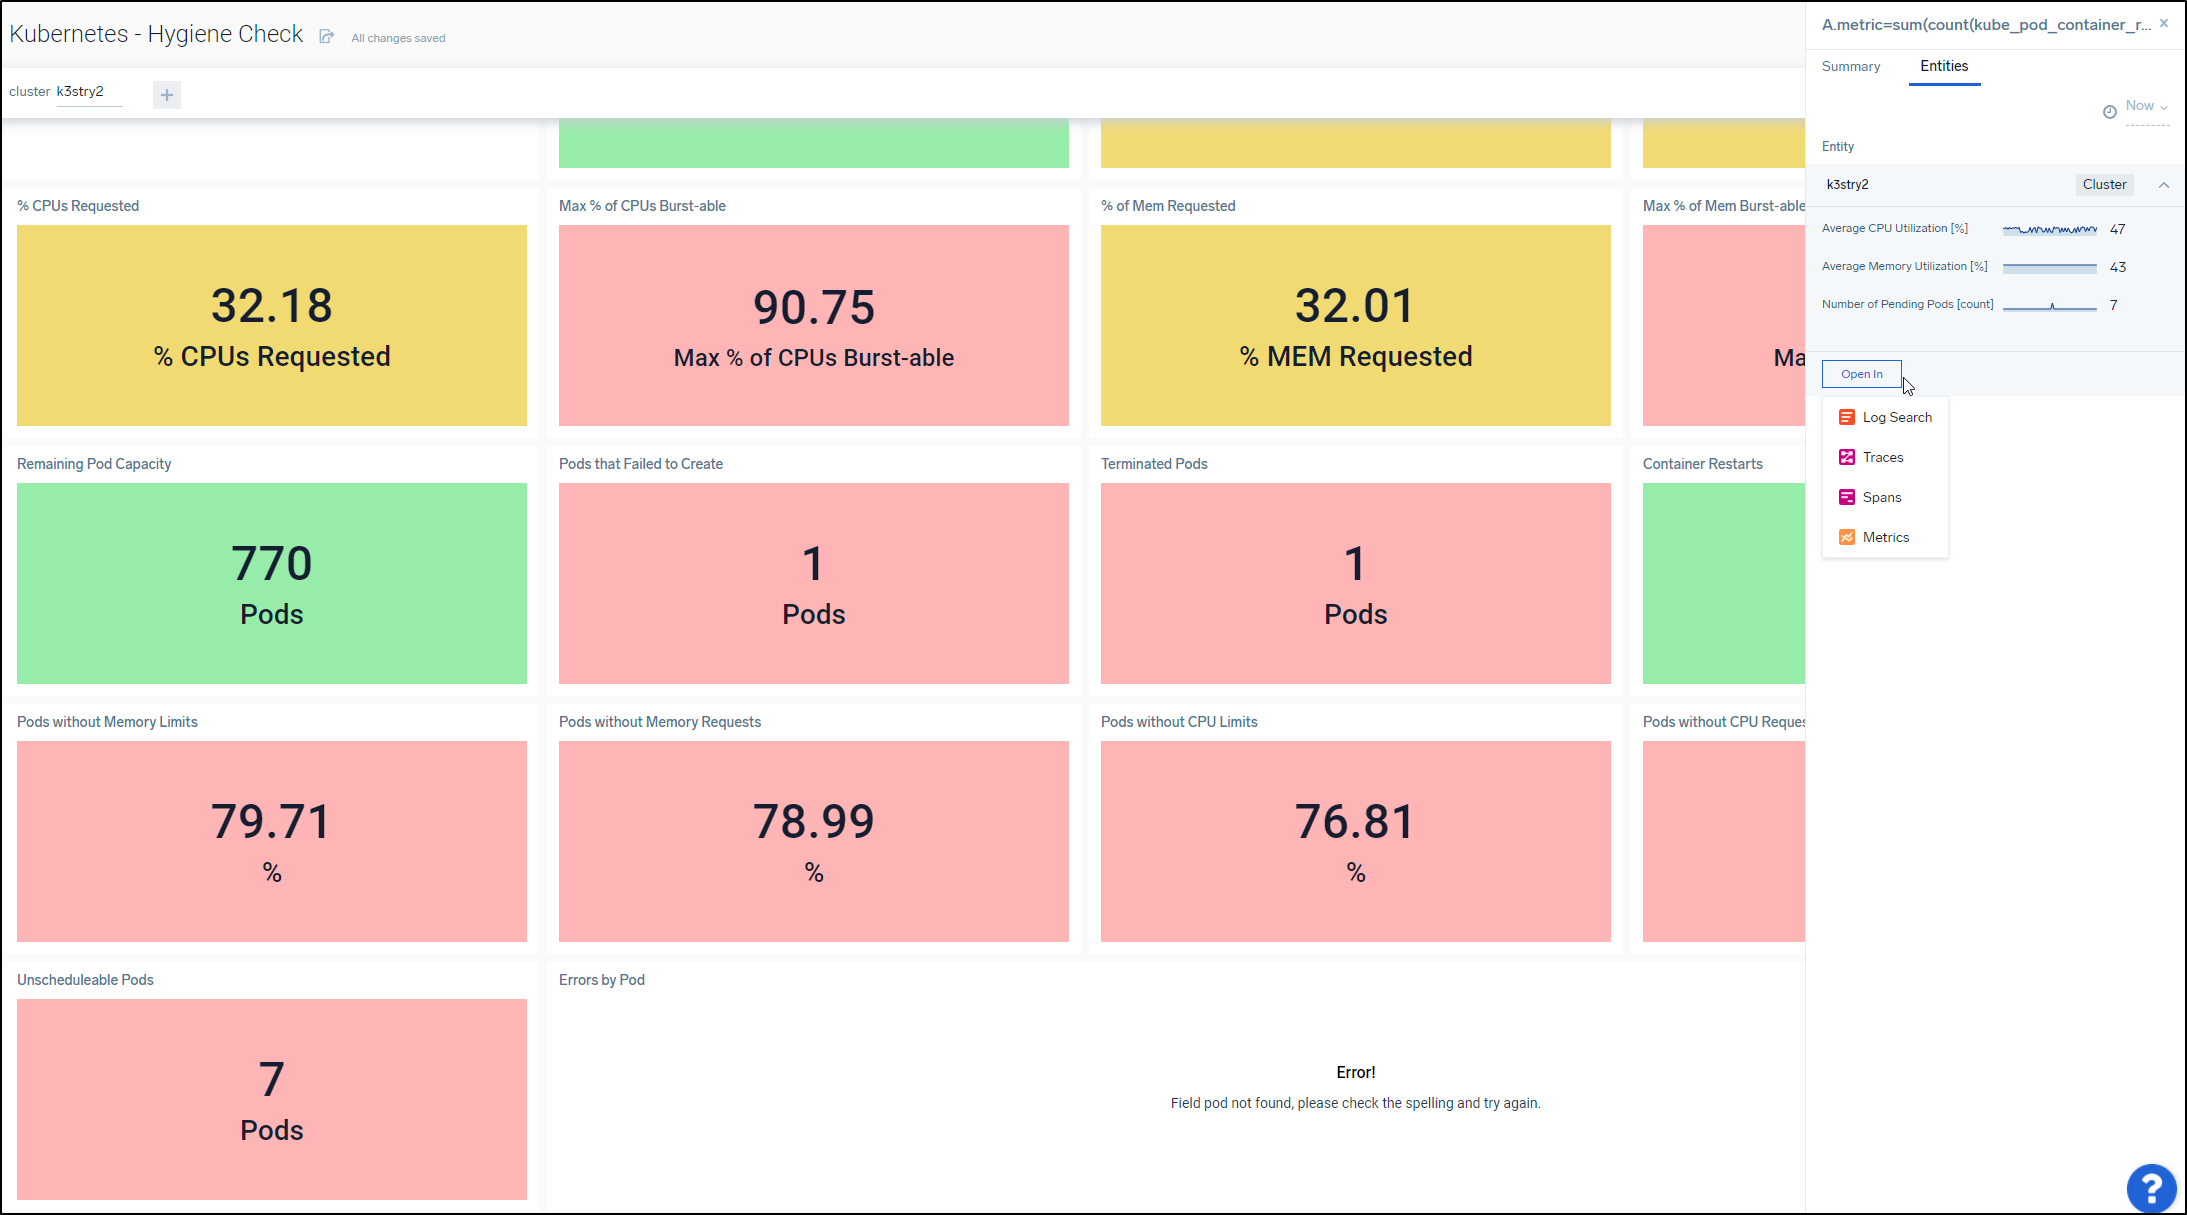
As you can see, any of the panels can be clicked to bring up a summary and entities pane, the latter of which can open into logs, metrics, etc.
Fresh AKS for Tracing
I’ll use a fresh AKS for a fresh Dapr setup
$ az account set --subscription "Visual Studio Enterprise Subscription"
$ az group create -n idjaks05rg --location centralus
{
  "id": "/subscriptions/d4c0asdf-asdf-asdf-asdf-fd877504a619/resourceGroups/idjaks05rg",
  "location": "centralus",
  "managedBy": null,
  "name": "idjaks05rg",
  "properties": {
    "provisioningState": "Succeeded"
  },
  "tags": null,
  "type": "Microsoft.Resources/resourceGroups"
}
$ export SP_ID=`cat ./SP_ID | tr -d '\n'`
$ export SP_PASS=`cat ./SP_PASS | tr -d '\n'`
$ az aks create -g idjaks05rg -n idjaks05sl --location centralus  --network-plugin azure --network-policy azure --generate-ssh-keys --service-principal $SP_ID --client-secret $SP_PASS

$ (rm -f ~/.kube/config || true) && az aks get-credentials -g idjaks05rg -n idjaks05sl --admin && kubectl get nodes
If you need to install dapr, use
$ wget -q https://raw.githubusercontent.com/dapr/cli/master/install/install.sh -O - | /bin/bash
Then install Dapr:
$ dapr init -k
⌛  Making the jump to hyperspace...
ℹ️  Note: To install Dapr using Helm, see here: https://docs.dapr.io/getting-started/install-dapr-kubernetes/#install-with-helm-advanced

✅  Deploying the Dapr control plane to your cluster...
✅  Success! Dapr has been installed to namespace dapr-system. To verify, run `dapr status -k' in your terminal. To get started, go here: https://aka.ms/dapr-getting-started
Next we need to create an OpenTelemetry config, service and deployment:
Example otel-collector.yaml:
apiVersion: v1
kind: ConfigMap
metadata:
  name: otel-collector-conf
  labels:
    app: opentelemetry
    component: otel-collector-conf
data:
  otel-collector-config: |
    receivers:
      zipkin:
        endpoint: 0.0.0.0:9411
    extensions:
      health_check:
      pprof:
        endpoint: :1888
      zpages:
        endpoint: :55679
    exporters:
       logging:
         loglevel: debug
       otlphttp:
         endpoint: collection-sumologic-otelagent.sumologic:55681/v1/trace

     service:
       extensions: [pprof, zpages, health_check]
       pipelines:
         traces:
           receivers: [zipkin]
           # List your exporter here.
           exporters: [otlphttp,logging]
---
apiVersion: v1
kind: Service
metadata:
  name: otel-collector
  labels:
    app: opencesus
    component: otel-collector
spec:
  ports:
  - name: zipkin # Default endpoint for Zipkin receiver.
    port: 9411
    protocol: TCP
    targetPort: 9411
  selector:
    component: otel-collector
---
apiVersion: apps/v1
kind: Deployment
metadata:
  name: otel-collector
  labels:
    app: opentelemetry
    component: otel-collector
spec:
  replicas: 1  # scale out based on your usage
  selector:
    matchLabels:
      app: opentelemetry
  template:
    metadata:
      labels:
        app: opentelemetry
        component: otel-collector
    spec:
      containers:
      - name: otel-collector
        image: otel/opentelemetry-collector-contrib-dev:latest
        command:
          - "/otelcontribcol"
          - "--config=/conf/otel-collector-config.yaml"
        resources:
          limits:
            cpu: 1
            memory: 2Gi
          requests:
            cpu: 200m
            memory: 400Mi
        ports:
          - containerPort: 9411 # Default endpoint for Zipkin receiver.
        volumeMounts:
          - name: otel-collector-config-vol
            mountPath: /conf
        livenessProbe:
          httpGet:
            path: /
            port: 13133
        readinessProbe:
          httpGet:
            path: /
            port: 13133
      volumes:
        - configMap:
            name: otel-collector-conf
            items:
              - key: otel-collector-config
                path: otel-collector-config.yaml
          name: otel-collector-config-vol
You’ll note that I’ve already setup the OtlpHTTP for the Sumo Logic agent. So next we’ll install it
$ kubectl apply -f otel-collector.yml
configmap/otel-collector-conf created
service/otel-collector created
deployment.apps/otel-collector created
We install the Helm agent (I still called it “myK3s” to match the Key)
$ helm upgrade --install collection sumologic/sumologic --namespace sumologic --create-namespace --set sumologic.accessId=s**************P --set sumologic.accessKey=H*******************************a --set sumologi
c.clusterName="MyK3s" --set sumologic.traces.enabled=true --set otelagent.enabled=true
Release "collection" does not exist. Installing it now.
W0101 16:56:03.828405   14290 warnings.go:70] policy/v1beta1 PodSecurityPolicy is deprecated in v1.21+, unavailable in v1.25+
W0101 16:56:03.854902   14290 warnings.go:70] policy/v1beta1 PodSecurityPolicy is deprecated in v1.21+, unavailable in v1.25+
W0101 16:56:03.880931   14290 warnings.go:70] policy/v1beta1 PodSecurityPolicy is deprecated in v1.21+, unavailable in v1.25+
W0101 16:56:03.904252   14290 warnings.go:70] policy/v1beta1 PodSecurityPolicy is deprecated in v1.21+, unavailable in v1.25+
W0101 16:56:48.896298   14290 warnings.go:70] policy/v1beta1 PodSecurityPolicy is deprecated in v1.21+, unavailable in v1.25+
W0101 16:56:48.897790   14290 warnings.go:70] policy/v1beta1 PodSecurityPolicy is deprecated in v1.21+, unavailable in v1.25+
W0101 16:56:48.897790   14290 warnings.go:70] policy/v1beta1 PodSecurityPolicy is deprecated in v1.21+, unavailable in v1.25+
W0101 16:56:48.910121   14290 warnings.go:70] policy/v1beta1 PodSecurityPolicy is deprecated in v1.21+, unavailable in v1.25+
NAME: collection
LAST DEPLOYED: Sat Jan  1 16:56:00 2022
NAMESPACE: sumologic
STATUS: deployed
REVISION: 1
NOTES:
Thank you for installing sumologic.

A Collector with the name "MyK3s" has been created in your Sumo Logic account.

Check the release status by running:
  kubectl --namespace sumologic get pods -l "release=collection"

We've tried to automatically create fields. In an unlikely scenario that this
fails please refer to the following to create them manually:
https://github.com/SumoLogic/sumologic-kubernetes-collection/blob/2b3ca63/deploy/docs/Installation_with_Helm.md#prerequisite
We need a Dapr App config to send Traces to the Otel Agent (which in Turn will send them to the Sumo Logic collector)
$ cat appconfig.yaml
apiVersion: dapr.io/v1alpha1
kind: Configuration
metadata:
  name: appconfig
  namespace: default
spec:
  tracing:
    samplingRate: "1"
    zipkin:
      endpointAddress: "http://otel-collector.default.svc.cluster.local:9411/api/v2/spans"

$ kubectl apply -f appconfig.yaml
configuration.dapr.io/appconfig created
Next, I want to annotate the Vote app to instrument with Dapr. I tried a few ways, but the easiest was
$ helm template myvoterelease azure-samples/azure-vote > my-azure-vote-app.yml.bak
$ helm template myvoterelease azure-samples/azure-vote > my-azure-vote-app.yml
$ dos2unix my-azure-vote-app.yml.bak
$ dos2unix my-azure-vote-app.yml
$ diff -c my-azure-vote-app.yml.bak my-azure-vote-app.yml
*** my-azure-vote-app.yml.bak   2022-01-01 17:08:44.662631089 -0600
--- my-azure-vote-app.yml       2022-01-01 17:10:00.612631117 -0600
***************
*** 38,43 ****
--- 38,48 ----
        app: vote-back-myvoterelease
    template:
      metadata:
+       annotations:
+         dapr.io/enabled: "true"
+         dapr.io/app-id: "myvoteappback"
+         dapr.io/app-port: "8080"
+         dapr.io/config: "appconfig"
        labels:
          app: vote-back-myvoterelease
      spec:
***************
*** 65,70 ****
--- 70,80 ----
    minReadySeconds: 5
    template:
      metadata:
+       annotations:
+         dapr.io/enabled: "true"
+         dapr.io/app-id: "myvoteappfront"
+         dapr.io/app-port: "8080"
+         dapr.io/config: "appconfig"
        labels:
          app: vote-front-myvoterelease
      spec:

$ kubectl apply -f my-azure-vote-app.yml
service/vote-back-myvoterelease created
service/azure-vote-front created
deployment.apps/vote-back-myvoterelease created
deployment.apps/vote-front-myvoterelease created
We can see the sidecars are injected so the pods are annotated properly:
$ kubectl get pods
NAME                                        READY   STATUS    RESTARTS   AGE
otel-collector-849b8cbd5-926wv              1/1     Running   0          15m
vote-back-myvoterelease-59dd4ff44f-r8zhg    1/2     Running   0          7s
vote-front-myvoterelease-7dc97b5955-5bb9c   0/2     Pending   0          7s
I tried multiple apps and added zipkin, jaeger and otlphttp endpoints
      otlphttp:
        endpoint: collection-sumologic-otelagent.sumologic:55681/v1/trace
      zipkin:
        endpoint: collection-sumologic-otelagent.sumologic:9411/api/v2/spans
      jaeger:
        endpoint: "http://collection-sumologic-otelagent.sumologic:55681"
        tls:
          insecure: true

    service:
      extensions: [pprof, zpages, health_check]
      pipelines:
        traces:
          receivers: [zipkin]
          # List your exporter here.
          exporters: [otlphttp,jaeger,zipkin,logging]
I could see some traces attempted but mostly fail:
2022-01-02T02:28:38.197Z        INFO    loggingexporter/logging_exporter.go:40  TracesExporter  {"#spans": 1}
2022-01-02T02:28:38.197Z        DEBUG   loggingexporter/logging_exporter.go:49  ResourceSpans #0
Resource SchemaURL:
Resource labels:
     -> service.name: STRING(react-form)
InstrumentationLibrarySpans #0
InstrumentationLibraryMetrics SchemaURL:
InstrumentationLibrary
Span #0
    Trace ID       : e71540a24d942ed9423705a6232995f3
    Parent ID      :
    ID             : 7e13932126a6c403
    Name           : /v1.0/publish/pubsub/A
    Kind           : SPAN_KIND_CLIENT
    Start time     : 2022-01-02 02:28:37.585404 +0000 UTC
    End time       : 2022-01-02 02:28:37.585508 +0000 UTC
    Status code    : STATUS_CODE_UNSET
    Status message :
Attributes:
     -> messaging.destination_kind: STRING(topic)
     -> messaging.system: STRING(pubsub)
     -> opencensus.status_description: STRING(InvalidArgument)
     -> dapr.api: STRING(POST /v1.0/publish/pubsub/A)
     -> dapr.protocol: STRING(http)
     -> dapr.status_code: STRING(400)
     -> error: STRING(INVALID_ARGUMENT)
     -> messaging.destination: STRING(A)
     -> net.host.ip: STRING(10.240.0.38)

2022-01-02T02:28:47.610Z        info    exporterhelper/queued_retry.go:215      Exporting failed. Will retry the request after interval.        {"kind": "exporter", "name": "otlphttp", "error": "failed to make an HTTP request: Post \"collection-sumologic-otelagent.sumologic:55681/v1/trace/v1/traces\": unsupported protocol scheme \"collection-sumologic-otelagent.sumologic\"", "interval": "15.600374721s"}
2022-01-02T02:28:57.911Z        info    exporterhelper/queued_retry.go:215      Exporting failed. Will retry the request after interval.        {"kind": "exporter", "name": "otlphttp", "error": "failed to make an HTTP request: Post \"collection-sumologic-otelagent.sumologic:55681/v1/trace/v1/traces\": unsupported protocol scheme \"collection-sumologic-otelagent.sumologic\"", "interval": "14.873151718s"}
2022-01-02T02:29:12.785Z        info    exporterhelper/queued_retry.go:215      Exporting failed. Will retry the request after interval.        {"kind": "exporter", "name": "otlphttp", "error": "failed to make an HTTP request: Post \"collection-sumologic-otelagent.sumologic:55681/v1/trace/v1/traces\": unsupported protocol scheme \"collection-sumologic-otelagent.sumologic\"", "interval": "14.929984476s"}
Try again
I decided to wait and come back to try again later.
I’m going to fire a fresh cluster, this time with a proper auto-scaler:
$ export SP_ID=`cat ./SP_ID | tr -d '\n'` && export SP_PASS=`cat ./SP_PASS | tr -d '\n'` && az account set --subscription "Visual Studio Enterprise Subscription" && az group create -n idjaks06rg --location centralus && az aks create -g idjaks06rg -n idjaks06 --location centralus --network-plugin a
zure --network-policy azure --generate-ssh-keys --service-principal $SP_ID --client-secret $SP_PASS --enable-cluster-autoscaler --min-count 3 --max-count 6
{
  "id": "/subscriptions/d4c0asdf-asdf-asdf-asdf-fd877504a619/resourceGroups/idjaks06rg",
  "location": "centralus",
  "managedBy": null,
  "name": "idjaks06rg",
  "properties": {
    "provisioningState": "Succeeded"
  },
  "tags": null,
  "type": "Microsoft.Resources/resourceGroups"
}
{
  "aadProfile": null,
  "addonProfiles": null,
  "agentPoolProfiles": [
    {
      "availabilityZones": null,
      "count": 3,
      "enableAutoScaling": true,
      "enableEncryptionAtHost": false,
      "enableFips": false,
      "enableNodePublicIp": false,
      "enableUltraSsd": false,
      "gpuInstanceProfile": null,
      "kubeletConfig": null,
      "kubeletDiskType": "OS",
      "linuxOsConfig": null,
      "maxCount": 6,
      "maxPods": 30,
      "minCount": 3,
      "mode": "System",
      "name": "nodepool1",
      "nodeImageVersion": "AKSUbuntu-1804gen2containerd-2021.12.07",
      "nodeLabels": null,
      "nodePublicIpPrefixId": null,
      "nodeTaints": null,
      "orchestratorVersion": "1.21.7",
      "osDiskSizeGb": 128,
      "osDiskType": "Managed",
      "osSku": "Ubuntu",
      "osType": "Linux",
      "podSubnetId": null,
      "powerState": {
        "code": "Running"
      },
      "provisioningState": "Succeeded",
      "proximityPlacementGroupId": null,
      "scaleDownMode": null,
      "scaleSetEvictionPolicy": null,
      "scaleSetPriority": null,
      "spotMaxPrice": null,
      "tags": null,
      "type": "VirtualMachineScaleSets",
      "upgradeSettings": null,
      "vmSize": "Standard_DS2_v2",
      "vnetSubnetId": null
    }
  ],
  "apiServerAccessProfile": null,
  "autoScalerProfile": {
    "balanceSimilarNodeGroups": "false",
    "expander": "random",
    "maxEmptyBulkDelete": "10",
    "maxGracefulTerminationSec": "600",
    "maxNodeProvisionTime": "15m",
    "maxTotalUnreadyPercentage": "45",
    "newPodScaleUpDelay": "0s",
    "okTotalUnreadyCount": "3",
    "scaleDownDelayAfterAdd": "10m",
    "scaleDownDelayAfterDelete": "10s",
    "scaleDownDelayAfterFailure": "3m",
    "scaleDownUnneededTime": "10m",
    "scaleDownUnreadyTime": "20m",
    "scaleDownUtilizationThreshold": "0.5",
    "scanInterval": "10s",
    "skipNodesWithLocalStorage": "false",
    "skipNodesWithSystemPods": "true"
  },
  "autoUpgradeProfile": null,
  "azurePortalFqdn": "idjaks06-idjaks06rg-d4c094-2712cfe1.portal.hcp.centralus.azmk8s.io",
  "disableLocalAccounts": false,
  "diskEncryptionSetId": null,
  "dnsPrefix": "idjaks06-idjaks06rg-d4c094",
  "enablePodSecurityPolicy": null,
  "enableRbac": true,
  "extendedLocation": null,
  "fqdn": "idjaks06-idjaks06rg-d4c094-2712cfe1.hcp.centralus.azmk8s.io",
  "fqdnSubdomain": null,
  "httpProxyConfig": null,
  "id": "/subscriptions/d4c0asdf-asdf-asdf-asdf-fd877504a619/resourcegroups/idjaks06rg/providers/Microsoft.ContainerService/managedClusters/idjaks06",
  "identity": null,
  "identityProfile": null,
  "kubernetesVersion": "1.21.7",
  "linuxProfile": {
    "adminUsername": "azureuser",
    "ssh": {
      "publicKeys": [
        {
          "keyData": "ssh-rsa AAAAB3NzaC1yc2EAAAADAQABAAABAQCztCsq2pg/AFf8t6asdfasdfasdfasdfasfasdf7OX+FJmJ4dY2ydPxQ6RoxOLxWx6IDk9ysDK8MoSIUoD9nvD/PqlWBZLXBqqlO6asdfasdfasdfasdfasdfasdfasdfasdfasdfasdfasdfasdfasdfasdfasdfasdfasdfasdfasdfasdfasdfasdfasdfasdfPq87h"
        }
      ]
    }
  },
  "location": "centralus",
  "maxAgentPools": 100,
  "name": "idjaks06",
  "networkProfile": {
    "dnsServiceIp": "10.0.0.10",
    "dockerBridgeCidr": "172.17.0.1/16",
    "loadBalancerProfile": {
      "allocatedOutboundPorts": null,
      "effectiveOutboundIPs": [
        {
          "id": "/subscriptions/d4c0asdf-asdf-asdf-asdf-fd877504a619/resourceGroups/MC_idjaks06rg_idjaks06_centralus/providers/Microsoft.Network/publicIPAddresses/91f434f0-285d-46b0-8e09-4e6b2fe9efaf",
          "resourceGroup": "MC_idjaks06rg_idjaks06_centralus"
        }
      ],
      "idleTimeoutInMinutes": null,
      "managedOutboundIPs": {
        "count": 1
      },
      "outboundIPs": null,
      "outboundIpPrefixes": null
    },
    "loadBalancerSku": "Standard",
    "natGatewayProfile": null,
    "networkMode": null,
    "networkPlugin": "azure",
    "networkPolicy": "azure",
    "outboundType": "loadBalancer",
    "podCidr": null,
    "serviceCidr": "10.0.0.0/16"
  },
  "nodeResourceGroup": "MC_idjaks06rg_idjaks06_centralus",
  "podIdentityProfile": null,
  "powerState": {
    "code": "Running"
  },
  "privateFqdn": null,
  "privateLinkResources": null,
  "provisioningState": "Succeeded",
  "resourceGroup": "idjaks06rg",
  "securityProfile": null,
  "servicePrincipalProfile": {
    "clientId": "b57b1062-776a-4476-83b0-3a00e1a4a54b",
    "secret": null
  },
  "sku": {
    "name": "Basic",
    "tier": "Free"
  },
  "tags": null,
  "type": "Microsoft.ContainerService/ManagedClusters",
  "windowsProfile": {
    "adminPassword": null,
    "adminUsername": "azureuser",
    "enableCsiProxy": true,
    "licenseType": null
  }
}
Quick validation
$ (rm -f ~/.kube/config || true) && az aks get-credentials -g idjaks06rg -n idjaks06 --admin
Merged "idjaks06-admin" as current context in /home/builder/.kube/config

$ kubectl get nodes
NAME                                STATUS   ROLES   AGE   VERSION
aks-nodepool1-10780880-vmss000000   Ready    agent   13m   v1.21.7
aks-nodepool1-10780880-vmss000001   Ready    agent   13m   v1.21.7
aks-nodepool1-10780880-vmss000002   Ready    agent   13m   v1.21.7
Next, I created a New Key (AKS6)
Then installed SumoLogic using it:
$ helm upgrade --install mysumorelease sumologic/sumologic --set sumologic.accessId=*************g --set sumologic.accessKe
y=1**********************************Y --set sumologic.clusterName="AKS6" --set sumologic.traces.enabled=true --set otelagent.enabled=true
Release "mysumorelease" does not exist. Installing it now.
W0103 07:03:54.811412   30752 warnings.go:70] policy/v1beta1 PodSecurityPolicy is deprecated in v1.21+, unavailable in v1.25+
W0103 07:03:54.835491   30752 warnings.go:70] policy/v1beta1 PodSecurityPolicy is deprecated in v1.21+, unavailable in v1.25+
W0103 07:03:54.856431   30752 warnings.go:70] policy/v1beta1 PodSecurityPolicy is deprecated in v1.21+, unavailable in v1.25+
W0103 07:03:54.877780   30752 warnings.go:70] policy/v1beta1 PodSecurityPolicy is deprecated in v1.21+, unavailable in v1.25+
W0103 07:04:15.527738   30752 warnings.go:70] policy/v1beta1 PodSecurityPolicy is deprecated in v1.21+, unavailable in v1.25+
W0103 07:04:15.534815   30752 warnings.go:70] policy/v1beta1 PodSecurityPolicy is deprecated in v1.21+, unavailable in v1.25+
W0103 07:04:15.540160   30752 warnings.go:70] policy/v1beta1 PodSecurityPolicy is deprecated in v1.21+, unavailable in v1.25+
W0103 07:04:15.540179   30752 warnings.go:70] policy/v1beta1 PodSecurityPolicy is deprecated in v1.21+, unavailable in v1.25+
NAME: mysumorelease
LAST DEPLOYED: Mon Jan  3 07:03:52 2022
NAMESPACE: default
STATUS: deployed
REVISION: 1
NOTES:
Thank you for installing sumologic.

A Collector with the name "AKS6" has been created in your Sumo Logic account.

Check the release status by running:
  kubectl --namespace default get pods -l "release=mysumorelease"

We've tried to automatically create fields. In an unlikely scenario that this
fails please refer to the following to create them manually:
https://github.com/SumoLogic/sumologic-kubernetes-collection/blob/2b3ca63/deploy/docs/Installation_with_Helm.md#prerequisite
We can now see it running:
$ kubectl get pods
NAME                                                   READY   STATUS    RESTARTS   AGE
mysumorelease-fluent-bit-6fw2g                         1/1     Running   0          15m
mysumorelease-fluent-bit-mfmx4                         1/1     Running   0          15m
mysumorelease-fluent-bit-r8p9x                         1/1     Running   0          15m
mysumorelease-fluent-bit-rfx29                         1/1     Running   0          15m
mysumorelease-kube-prometh-operator-77fb54985d-2r9kb   1/1     Running   0          15m
mysumorelease-kube-state-metrics-5fb7b7b599-7tdqf      1/1     Running   0          15m
mysumorelease-prometheus-node-exporter-cbqvj           1/1     Running   0          15m
mysumorelease-prometheus-node-exporter-cbxvj           1/1     Running   0          15m
mysumorelease-prometheus-node-exporter-wzldr           1/1     Running   0          15m
mysumorelease-prometheus-node-exporter-zz9x7           1/1     Running   0          15m
mysumorelease-sumologic-fluentd-events-0               1/1     Running   0          15m
mysumorelease-sumologic-fluentd-logs-0                 1/1     Running   0          15m
mysumorelease-sumologic-fluentd-logs-1                 1/1     Running   0          15m
mysumorelease-sumologic-fluentd-logs-2                 1/1     Running   0          15m
mysumorelease-sumologic-fluentd-metrics-0              1/1     Running   0          15m
mysumorelease-sumologic-fluentd-metrics-1              1/1     Running   0          15m
mysumorelease-sumologic-fluentd-metrics-2              1/1     Running   0          15m
mysumorelease-sumologic-otelagent-f2jk2                1/1     Running   0          15m
mysumorelease-sumologic-otelagent-gkcrv                1/1     Running   0          15m
mysumorelease-sumologic-otelagent-mdpbp                1/1     Running   0          15m
mysumorelease-sumologic-otelagent-nls4c                1/1     Running   0          15m
mysumorelease-sumologic-otelcol-85d6965c7f-cfjmc       1/1     Running   0          15m
prometheus-mysumorelease-kube-prometh-prometheus-0     3/3     Running   1          15m
Again, this is a fresh cluster, so we need to add Dapr for OpenTel.
This time, instead of using dapr init -k, let’s use the helm chart
$ helm repo add dapr https://dapr.github.io/helm-charts/
"dapr" has been added to your repositories

$ helm repo update
Hang tight while we grab the latest from your chart repositories...
...Successfully got an update from the "dapr" chart repository
...Successfully got an update from the "azure-samples" chart repository
...Successfully got an update from the "kuma" chart repository
...Successfully got an update from the "sumologic" chart repository
...Successfully got an update from the "datadog" chart repository
...Successfully got an update from the "incubator" chart repository
...Successfully got an update from the "rancher-latest" chart repository
...Successfully got an update from the "newrelic" chart repository
...Successfully got an update from the "bitnami" chart repository
Update Complete. ⎈Happy Helming!⎈
Install:
$ helm install dapr dapr/dapr --create-namespace --namespace dapr-system --wait
NAME: dapr
LAST DEPLOYED: Mon Jan  3 07:27:46 2022
NAMESPACE: dapr-system
STATUS: deployed
REVISION: 1
TEST SUITE: None
NOTES:
Thank you for installing Dapr: High-performance, lightweight serverless runtime for cloud and edge

Your release is named dapr.

To get started with Dapr, we recommend using our quickstarts:
https://github.com/dapr/quickstarts

For more information on running Dapr, visit:
https://dapr.io
The next thing I want to try is to send Zipkin trace data directly to the Sumo Logic operator
We can see the services:
$ kubectl get svc | grep otel
mysumorelease-sumologic-otelagent                  ClusterIP   10.0.112.181   <none>        5778/TCP,6831/UDP,6832/UDP,8888/TCP,9411/TCP,14250/TCP,14267/TCP,14268/TCP,55678/TCP,4317/TCP,55680/TCP,55681/TCP   27m
mysumorelease-sumologic-otelcol                    ClusterIP   10.0.97.131    <none>        5778/TCP,6831/UDP,6832/UDP,8888/TCP,9411/TCP,14250/TCP,14267/TCP,14268/TCP,55678/TCP,4317/TCP,55680/TCP,55681/TCP   27m
Then we will use the AppConfig annotation to have Dapr automatically send trace data to the Sumo Collector OTelAgent.
$ cat appconfig2.yaml
apiVersion: dapr.io/v1alpha1
kind: Configuration
metadata:
  name: appconfig
  namespace: default
spec:
  tracing:
    samplingRate: "1"
    zipkin:
      endpointAddress: "http://mysumorelease-sumologic-otelagent.svc.cluster.local:9411/api/v2/spans"

$ kubectl apply -f appconfig2.yaml
configuration.dapr.io/appconfig created
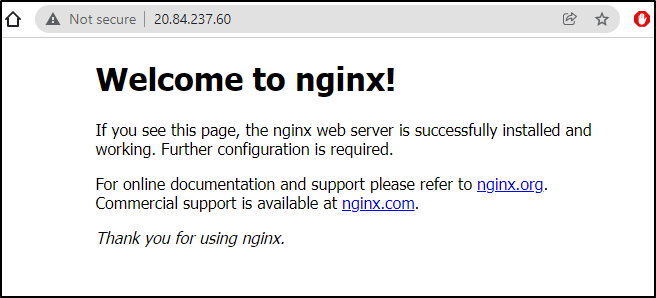
I’ll first try the basic NGinx Hello world
$ helm install --generate-name ./hello-world
NAME: hello-world-1641217128
LAST DEPLOYED: Mon Jan  3 07:38:49 2022
NAMESPACE: default
STATUS: deployed
REVISION: 1
NOTES:
1. Get the application URL by running these commands:
  export POD_NAME=$(kubectl get pods --namespace default -l "app.kubernetes.io/name=hello-world,app.kubernetes.io/instance=hello-world-1641217128" -o jsonpath="{.items[0].metadata.name}")
  export CONTAINER_PORT=$(kubectl get pod --namespace default $POD_NAME -o jsonpath="{.spec.containers[0].ports[0].containerPort}")
  echo "Visit http://127.0.0.1:8080 to use your application"
  kubectl --namespace default port-forward $POD_NAME 8080:$CONTAINER_PORT
It is just the hello-world Nginx sample app with the values.yaml modified to set the podAnnotations for dapr:
$ cat hello-world/values.yaml | head -n31 | tail -n7

podAnnotations:
  dapr.io/enabled: "true"
  dapr.io/app-id: "helloworld"
  dapr.io/app-port: "80"
  dapr.io/config: "appconfig"
Then i want to expose it for ingress
$ kubectl get deployments
NAME                                  READY   UP-TO-DATE   AVAILABLE   AGE
hello-world-1641217128                1/1     1            1           2m17s
mysumorelease-kube-prometh-operator   1/1     1            1           36m
mysumorelease-kube-state-metrics      1/1     1            1           36m
mysumorelease-sumologic-otelcol       1/1     1            1           36m

$ kubectl expose deployment hello-world-1641217128 --type=LoadBalancer --name=myhelloworld
service/myhelloworld exposed

$ kubectl get svc myhelloworld
NAME           TYPE           CLUSTER-IP   EXTERNAL-IP    PORT(S)        AGE
myhelloworld   LoadBalancer   10.0.229.0   20.84.237.60   80:31072/TCP   71s
 .
.
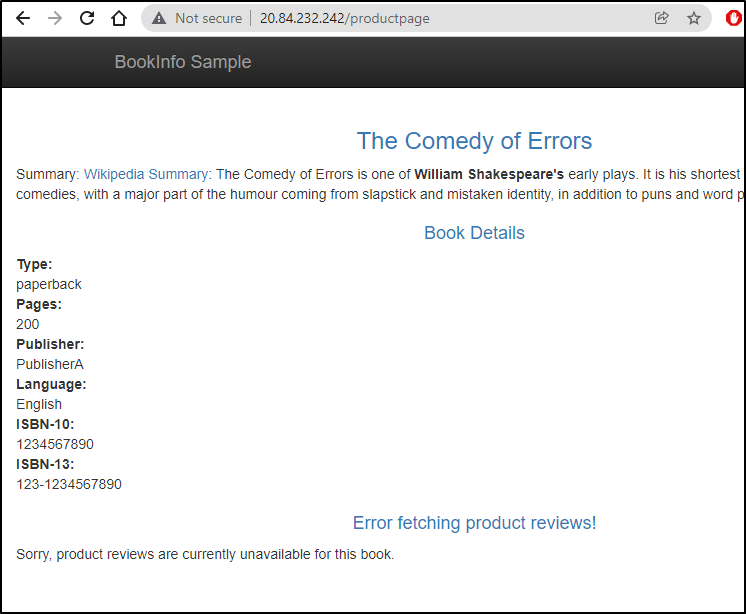
I’m also going to setup Istio with the Book app
note: in the end, the book app kept failing. I moved onto Dapr quickstarts after
builder@DESKTOP-QADGF36:~/Workspaces$ cd istio-1.12.1/
builder@DESKTOP-QADGF36:~/Workspaces/istio-1.12.1$ ls
LICENSE  README.md  bin  manifest.yaml  manifests  samples  tools
builder@DESKTOP-QADGF36:~/Workspaces/istio-1.12.1$ export PATH=$PWD/bin:$PATH
builder@DESKTOP-QADGF36:~/Workspaces/istio-1.12.1$ istioctl install --set profile=demo -y
✔ Istio core installed
✔ Istiod installed
✔ Ingress gateways installed
✔ Egress gateways installed
✔ Installation complete                                                                                                                                                    Making this installation the default for injection and validation.

Thank you for installing Istio 1.12.  Please take a few minutes to tell us about your install/upgrade experience!  https://forms.gle/FegQbc9UvePd4Z9z7
builder@DESKTOP-QADGF36:~/Workspaces/istio-1.12.1$ kubectl apply -f https://raw.githubusercontent.com/istio/istio/release-1.12/samples/bookinfo/platform/kube/bookinfo.yaml

service/details created
serviceaccount/bookinfo-details created
deployment.apps/details-v1 created
service/ratings created
serviceaccount/bookinfo-ratings created
deployment.apps/ratings-v1 created
service/reviews created
serviceaccount/bookinfo-reviews created
deployment.apps/reviews-v1 created
deployment.apps/reviews-v2 created
deployment.apps/reviews-v3 created
service/productpage created
serviceaccount/bookinfo-productpage created
deployment.apps/productpage-v1 created
builder@DESKTOP-QADGF36:~/Workspaces/istio-1.12.1$
builder@DESKTOP-QADGF36:~/Workspaces/istio-1.12.1$ kubectl apply -f https://raw.githubusercontent.com/istio/istio/release-1.12/samples/bookinfo/networking/bookinfo-gateway.yaml
gateway.networking.istio.io/bookinfo-gateway created
virtualservice.networking.istio.io/bookinfo created
builder@DESKTOP-QADGF36:~/Workspaces/istio-1.12.1$ kubectl -n istio-system get service istio-ingressgateway -o jsonpath='{.status.loadBalancer.ingress[0].ip}'
20.84.232.242
 .
.
I pulled down the Deployments for all 6 apps and updated to include a dapr annotation block. e.g.
spec:
  progressDeadlineSeconds: 600
  replicas: 1
  revisionHistoryLimit: 10
  selector:
    matchLabels:
      app: details
      version: v1
  strategy:
    rollingUpdate:
      maxSurge: 25%
      maxUnavailable: 25%
    type: RollingUpdate
  template:
    metadata:
      annotations:
        dapr.io/enabled: "true"
        dapr.io/app-id: "details"
        dapr.io/app-port: "8080"
        dapr.io/config: "appconfig"
Then updated the deployments and watched the pods rotate, this time with the Dapr sidecar and the appconfig configuration
$ kubectl apply -f productpage-v1.dep.yaml && kubectl apply -f reviews-v1.dep.yaml && kubectl apply -f reviews-v2.dep.yaml
 && kubectl apply -f reviews-v3.dep.yaml && kubectl apply -f ratings-v1.dep.yaml && kubectl apply -f details-v1.dep.yaml
deployment.apps/productpage-v1 configured
deployment.apps/reviews-v1 configured
deployment.apps/reviews-v2 configured
deployment.apps/reviews-v3 configured
deployment.apps/ratings-v1 configured
deployment.apps/details-v1 configured

$ kubectl get pods
NAME                                                   READY   STATUS              RESTARTS   AGE
details-v1-549ff57dc4-zn8jx                            0/2     ContainerCreating   0          2s
details-v1-79f774bdb9-pqsqm                            1/1     Running             0          8m27s
hello-world-1641217128-88d48dbd8-q4xdr                 2/2     Running             0          18m
mysumorelease-fluent-bit-6fw2g                         1/1     Running             0          53m
mysumorelease-fluent-bit-mfmx4                         1/1     Running             0          53m
mysumorelease-fluent-bit-r8p9x                         1/1     Running             0          53m
mysumorelease-fluent-bit-rfx29                         1/1     Running             0          53m
mysumorelease-kube-prometh-operator-77fb54985d-2r9kb   1/1     Running             0          53m
mysumorelease-kube-state-metrics-5fb7b7b599-7tdqf      1/1     Running             0          53m
mysumorelease-prometheus-node-exporter-cbqvj           1/1     Running             0          53m
mysumorelease-prometheus-node-exporter-cbxvj           1/1     Running             0          53m
mysumorelease-prometheus-node-exporter-wzldr           1/1     Running             0          53m
mysumorelease-prometheus-node-exporter-zz9x7           1/1     Running             0          53m
mysumorelease-sumologic-fluentd-events-0               1/1     Running             0          53m
mysumorelease-sumologic-fluentd-logs-0                 1/1     Running             0          53m
mysumorelease-sumologic-fluentd-logs-1                 1/1     Running             0          53m
mysumorelease-sumologic-fluentd-logs-2                 1/1     Running             0          53m
mysumorelease-sumologic-fluentd-metrics-0              1/1     Running             0          53m
mysumorelease-sumologic-fluentd-metrics-1              1/1     Running             0          53m
mysumorelease-sumologic-fluentd-metrics-2              1/1     Running             0          53m
mysumorelease-sumologic-otelagent-f2jk2                1/1     Running             0          53m
mysumorelease-sumologic-otelagent-gkcrv                1/1     Running             0          52m
mysumorelease-sumologic-otelagent-mdpbp                1/1     Running             0          53m
mysumorelease-sumologic-otelagent-nls4c                1/1     Running             0          53m
mysumorelease-sumologic-otelcol-85d6965c7f-cfjmc       1/1     Running             0          53m
productpage-v1-64db4f97dd-wx4vl                        0/2     ContainerCreating   0          3s
productpage-v1-6b746f74dc-bgrcr                        1/1     Running             0          8m26s
prometheus-mysumorelease-kube-prometh-prometheus-0     3/3     Running             1          53m
ratings-v1-68784fbb74-gr5wk                            0/2     ContainerCreating   0          2s
ratings-v1-b6994bb9-m6jm7                              1/1     Running             0          8m27s
reviews-v1-545db77b95-p976c                            1/1     Running             0          8m27s
reviews-v1-5cd6fd4874-4nhlz                            0/2     ContainerCreating   0          3s
reviews-v2-7bf8c9648f-jkg76                            1/1     Running             0          8m27s
reviews-v2-f85d464fc-h9tkg                             0/2     ContainerCreating   0          3s
reviews-v3-84779c7bbc-9bf5p                            1/1     Running             0          8m27s
reviews-v3-8588449844-zbjjl                            0/2     ContainerCreating   0          2s
They keep crashing.. lets use otelcol instead of otelagent:
$ cat appconfig2.yaml
apiVersion: dapr.io/v1alpha1
kind: Configuration
metadata:
  name: appconfig
  namespace: default
spec:
  tracing:
    samplingRate: "1"
    zipkin:
      endpointAddress: "http://mysumorelease-sumologic-otelcol.svc.cluster.local:9411/api/v2/spans"
$ kubectl apply -f appconfig2.yaml
configuration.dapr.io/appconfig configured
still no luck:
productpage-v1-64db4f97dd-q6pvd                        1/2     Running            2          62s
productpage-v1-6b746f74dc-bgrcr                        1/1     Running            0          20m
prometheus-mysumorelease-kube-prometh-prometheus-0     3/3     Running            1          64m
ratings-v1-68784fbb74-gr5wk                            1/2     CrashLoopBackOff   7          11m
ratings-v1-b6994bb9-m6jm7                              1/1     Running            0          20m
reviews-v1-545db77b95-p976c                            1/1     Running            0          20m
reviews-v1-5cd6fd4874-4nhlz                            1/2     CrashLoopBackOff   7          11m
reviews-v2-7bf8c9648f-jkg76                            1/1     Running            0          20m
reviews-v2-f85d464fc-h9tkg                             1/2     CrashLoopBackOff   7          11m
reviews-v3-84779c7bbc-9bf5p                            1/1     Running            0          20m
reviews-v3-8588449844-zbjjl                            1/2     CrashLoopBackOff   7          11m
trying without http
endpointAddress: "mysumorelease-sumologic-otelcol.svc.cluster.local:9411/api/v2/spans"
builder@DESKTOP-QADGF36:~/Workspaces/jekyll-blog/tmp$ cat appconfig2.yaml
apiVersion: dapr.io/v1alpha1
kind: Configuration
metadata:
  name: appconfig
  namespace: default
spec:
  tracing:
    samplingRate: "1"
    zipkin:
      endpointAddress: "mysumorelease-sumologic-otelcol.default:9411/api/v2/spans"
builder@DESKTOP-QADGF36:~/Workspaces/jekyll-blog/tmp$ kubectl apply -f appconfig2.yaml
configuration.dapr.io/appconfig configured
still no go..
productpage-v1-64db4f97dd-ckk8p                        1/2     CrashLoopBackOff   3          79s
productpage-v1-6b746f74dc-bgrcr                        1/1     Running            0          27m
prometheus-mysumorelease-kube-prometh-prometheus-0     3/3     Running            1          71m
ratings-v1-68784fbb74-8t8pc                            1/2     CrashLoopBackOff   3          79s
ratings-v1-b6994bb9-m6jm7                              1/1     Running            0          27m
reviews-v1-545db77b95-p976c                            1/1     Running            0          27m
reviews-v1-5cd6fd4874-4nhlz                            1/2     CrashLoopBackOff   11         18m
reviews-v2-7bf8c9648f-jkg76                            1/1     Running            0          27m
reviews-v2-f85d464fc-h9tkg                             1/2     CrashLoopBackOff   11         18m
reviews-v3-84779c7bbc-9bf5p                            1/1     Running            0          27m
reviews-v3-8588449844-zbjjl                            1/2     Running            11         18m
fine.. I’ll use the Dapr Otel collector first
apiVersion: dapr.io/v1alpha1
kind: Configuration
metadata:
  name: appconfig
  namespace: default
spec:
  tracing:
    samplingRate: "1"
    zipkin:
      endpointAddress: "http://otel-collector.default.svc.cluster.local:9411/api/v2/spans"
I’ll need to install the Otel Collector:
apiVersion: v1
kind: ConfigMap
metadata:
  name: otel-collector-conf
  labels:
    app: opentelemetry
    component: otel-collector-conf
data:
  otel-collector-config: |
    receivers:
      zipkin:
        endpoint: 0.0.0.0:9411
    extensions:
      health_check:
      pprof:
        endpoint: :1888
      zpages:
        endpoint: :55679
    exporters:
      logging:
        loglevel: debug
      # Depending on where you want to export your trace, use the
      # correct OpenTelemetry trace exporter here.
      #
      # Refer to
      # https://github.com/open-telemetry/opentelemetry-collector/tree/main/exporter
      # and
      # https://github.com/open-telemetry/opentelemetry-collector-contrib/tree/main/exporter
      # for full lists of trace exporters that you can use, and how to
      # configure them.
      otlphttp:
        endpoint: mysumorelease-sumologic-otelcol.sumologic:55681/v1/trace
      zipkin:
        endpoint: mysumorelease-sumologic-otelcol.sumologic:9411/api/v2/spans

    service:
      extensions: [pprof, zpages, health_check]
      pipelines:
        traces:
          receivers: [zipkin]
          # List your exporter here.
          exporters: [otlphttp,zipkin,logging]
---
apiVersion: v1
kind: Service
metadata:
  name: otel-collector
  labels:
    app: opencesus
    component: otel-collector
spec:
  ports:
  - name: zipkin # Default endpoint for Zipkin receiver.
    port: 9411
    protocol: TCP
    targetPort: 9411
  selector:
    component: otel-collector
---
apiVersion: apps/v1
kind: Deployment
metadata:
  name: otel-collector
  labels:
    app: opentelemetry
    component: otel-collector
spec:
  replicas: 1  # scale out based on your usage
  selector:
    matchLabels:
      app: opentelemetry
  template:
    metadata:
      labels:
        app: opentelemetry
        component: otel-collector
    spec:
      containers:
      - name: otel-collector
        image: otel/opentelemetry-collector-contrib:latest
        command:
          - "/otelcontribcol"
          - "--config=/conf/otel-collector-config.yaml"
        resources:
          limits:
            cpu: 1
            memory: 2Gi
          requests:
            cpu: 200m
            memory: 400Mi
        ports:
          - containerPort: 9411 # Default endpoint for Zipkin receiver.
        volumeMounts:
          - name: otel-collector-config-vol
            mountPath: /conf
        livenessProbe:
          httpGet:
            path: /
            port: 13133
        readinessProbe:
          httpGet:
            path: /
            port: 13133
      volumes:
        - configMap:
            name: otel-collector-conf
            items:
              - key: otel-collector-config
                path: otel-collector-config.yaml
          name: otel-collector-config-vol
and apply:
$ kubectl apply -f otel-collector.yml
configmap/otel-collector-conf created
service/otel-collector created
deployment.apps/otel-collector created
In the end, this is what worked:
The Dapr Config
apiVersion: dapr.io/v1alpha1
kind: Configuration
metadata:
  name: appconfig
  namespace: default
spec:
  tracing:
    samplingRate: "1"
    zipkin:
      endpointAddress: "http://otel-collector.default.svc.cluster.local:9411/api/v2/spans"
and skipping the HTTP connector to use the regular gPRC one
    receivers:
      zipkin:
        endpoint: 0.0.0.0:9411
    extensions:
      health_check:
      pprof:
        endpoint: :1888
      zpages:
        endpoint: :55679
    exporters:
      logging:
        loglevel: debug
      # Depending on where you want to export your trace, use the
      # correct OpenTelemetry trace exporter here.
      #
      # Refer to
      # https://github.com/open-telemetry/opentelemetry-collector/tree/main/exporter
      # and
      # https://github.com/open-telemetry/opentelemetry-collector-contrib/tree/main/exporter
      # for full lists of trace exporters that you can use, and how to
      # configure them.
      otlp:
        endpoint: "10.0.97.131:4317"
        tls:
          insecure: true
      zipkin:
        endpoint: "http://10.0.97.131:9411/api/v2/spans"

    service:
      extensions: [pprof, zpages, health_check]
      pipelines:
        traces:
          receivers: [zipkin]
          # List your exporter here.
          exporters: [otlp,zipkin,logging]
I watched the Otel logs carefully. Even though it should resolve with mysumorelease-sumologic-otelcol, mysumorelease-sumologic-otelcol.default and mysumorelease-sumologic-otelcol.default.svc.local, all of them failed to resolve the name within the Collector container
2022-01-03T15:06:15.739Z        info    exporterhelper/queued_retry.go:215      Exporting failed. Will retry the request after interval.        {"kind": "exporter", "name": "zipkin", "error": "failed to push trace data via Zipkin exporter: Post \"http://mysumorelease-sumologic-otelcol.default.svc.local:9411/api/v2/spans\": dial tcp: lookup mysumorelease-sumologic-otelcol.default.svc.local on 10.0.0.10:53: no such host", "interval": "30.718122605s"}
2022-01-03T15:06:18.055Z        info    exporterhelper/queued_retry.go:215      Exporting failed. Will retry the request after interval.        {"kind": "exporter", "name": "otlp", "error": "rpc error: code = Unavailable desc = connection error: desc = \"transport: Error while dialing dial tcp: lookup mysumorelease-sumologic-otelcol.default.svc.local on 10.0.0.10:53: no such host\"", "interval": "44.016198395s"}
I can see Span data was set to the collector:
$ kubectl logs otel-collector-85b54fbfdc-8j4kq
2022-01-03T15:09:00.643Z        info    service/collector.go:190        Applying configuration...
2022-01-03T15:09:00.644Z        info    builder/exporters_builder.go:254        Exporter was built.     {"kind": "exporter", "name": "otlp"}
2022-01-03T15:09:00.646Z        info    builder/exporters_builder.go:254        Exporter was built.     {"kind": "exporter", "name": "zipkin"}
2022-01-03T15:09:00.647Z        info    builder/exporters_builder.go:254        Exporter was built.     {"kind": "exporter", "name": "logging"}
2022-01-03T15:09:00.647Z        info    builder/pipelines_builder.go:222        Pipeline was built.     {"name": "pipeline", "name": "traces"}
2022-01-03T15:09:00.647Z        info    builder/receivers_builder.go:224        Receiver was built.     {"kind": "receiver", "name": "zipkin", "datatype": "traces"}
2022-01-03T15:09:00.647Z        info    service/service.go:86   Starting extensions...
2022-01-03T15:09:00.647Z        info    extensions/extensions.go:38     Extension is starting...        {"kind": "extension", "name": "pprof"}
2022-01-03T15:09:00.649Z        info    pprofextension@v0.40.0/pprofextension.go:78     Starting net/http/pprof server  {"kind": "extension", "name": "pprof", "config": {"TCPAddr":{"Endpoint":":1888"},"BlockProfileFraction":0,"MutexProfileFraction":0,"SaveToFile":""}}
2022-01-03T15:09:00.650Z        info    extensions/extensions.go:42     Extension started.      {"kind": "extension", "name": "pprof"}
2022-01-03T15:09:00.650Z        info    extensions/extensions.go:38     Extension is starting...        {"kind": "extension", "name": "zpages"}
2022-01-03T15:09:00.650Z        info    zpagesextension/zpagesextension.go:40   Register Host's zPages  {"kind": "extension", "name": "zpages"}
2022-01-03T15:09:00.650Z        info    zpagesextension/zpagesextension.go:53   Starting zPages extension       {"kind": "extension", "name": "zpages", "config": {"TCPAddr":{"Endpoint":":55679"}}}
2022-01-03T15:09:00.650Z        info    extensions/extensions.go:42     Extension started.      {"kind": "extension", "name": "zpages"}
2022-01-03T15:09:00.650Z        info    extensions/extensions.go:38     Extension is starting...        {"kind": "extension", "name": "health_check"}
2022-01-03T15:09:00.650Z        info    healthcheckextension@v0.40.0/healthcheckextension.go:43 Starting health_check extension {"kind": "extension", "name": "health_check", "config": {"Port":0,"TCPAddr":{"Endpoint":"0.0.0.0:13133"},"Path":"/","CheckCollectorPipeline":{"Enabled":false,"Interval":"5m","ExporterFailureThreshold":5}}}
2022-01-03T15:09:00.650Z        info    extensions/extensions.go:42     Extension started.      {"kind": "extension", "name": "health_check"}
2022-01-03T15:09:00.650Z        info    service/service.go:91   Starting exporters...
2022-01-03T15:09:00.650Z        info    builder/exporters_builder.go:40 Exporter is starting... {"kind": "exporter", "name": "zipkin"}
2022-01-03T15:09:00.650Z        info    builder/exporters_builder.go:48 Exporter started.       {"kind": "exporter", "name": "zipkin"}
2022-01-03T15:09:00.650Z        info    builder/exporters_builder.go:40 Exporter is starting... {"kind": "exporter", "name": "logging"}
2022-01-03T15:09:00.650Z        info    builder/exporters_builder.go:48 Exporter started.       {"kind": "exporter", "name": "logging"}
2022-01-03T15:09:00.650Z        info    builder/exporters_builder.go:40 Exporter is starting... {"kind": "exporter", "name": "otlp"}
2022-01-03T15:09:00.650Z        info    builder/exporters_builder.go:48 Exporter started.       {"kind": "exporter", "name": "otlp"}
2022-01-03T15:09:00.650Z        info    service/service.go:96   Starting processors...
2022-01-03T15:09:00.650Z        info    builder/pipelines_builder.go:54 Pipeline is starting... {"name": "pipeline", "name": "traces"}
2022-01-03T15:09:00.650Z        info    builder/pipelines_builder.go:65 Pipeline is started.    {"name": "pipeline", "name": "traces"}
2022-01-03T15:09:00.650Z        info    service/service.go:101  Starting receivers...
2022-01-03T15:09:00.650Z        info    builder/receivers_builder.go:68 Receiver is starting... {"kind": "receiver", "name": "zipkin"}
2022-01-03T15:09:00.650Z        info    builder/receivers_builder.go:73 Receiver started.       {"kind": "receiver", "name": "zipkin"}
2022-01-03T15:09:00.650Z        info    healthcheck/handler.go:129      Health Check state change       {"kind": "extension", "name": "health_check", "status": "ready"}
2022-01-03T15:09:00.650Z        info    service/telemetry.go:92 Setting up own telemetry...
2022-01-03T15:09:00.651Z        info    service/telemetry.go:116        Serving Prometheus metrics      {"address": ":8888", "level": "basic", "service.instance.id": "142197b9-bbe6-4ca0-9ba7-af2cbe6e5285", "service.version": "latest"}
2022-01-03T15:09:00.651Z        info    service/collector.go:239        Starting otelcontribcol...      {"Version": "bb95489", "NumCPU": 2}
2022-01-03T15:09:00.651Z        info    service/collector.go:135        Everything is ready. Begin running and processing data.
2022-01-03T15:09:12.123Z        INFO    loggingexporter/logging_exporter.go:40  TracesExporter  {"#spans": 1}
2022-01-03T15:09:12.123Z        DEBUG   loggingexporter/logging_exporter.go:49  ResourceSpans #0
Resource labels:
     -> service.name: STRING(react-form)
InstrumentationLibrarySpans #0
InstrumentationLibrary
Span #0
    Trace ID       : 898085e72a7edabdb3176d24a9ebf543
    Parent ID      :
    ID             : db319a53c619c25e
    Name           : /v1.0/publish/pubsub/A
    Kind           : SPAN_KIND_CLIENT
    Start time     : 2022-01-03 15:09:11.723768 +0000 UTC
    End time       : 2022-01-03 15:09:11.723894 +0000 UTC
    Status code    : STATUS_CODE_UNSET
    Status message :
Attributes:
     -> opencensus.status_description: STRING(InvalidArgument)
     -> dapr.api: STRING(POST /v1.0/publish/pubsub/A)
     -> dapr.protocol: STRING(http)
     -> dapr.status_code: STRING(400)
     -> error: STRING(INVALID_ARGUMENT)
     -> messaging.destination: STRING(A)
     -> messaging.destination_kind: STRING(topic)
     -> messaging.system: STRING(pubsub)
     -> net.host.ip: STRING(10.240.0.48)

2022-01-03T15:09:14.213Z        INFO    loggingexporter/logging_exporter.go:40  TracesExporter  {"#spans": 1}
2022-01-03T15:09:14.213Z        DEBUG   loggingexporter/logging_exporter.go:49  ResourceSpans #0
Resource labels:
     -> service.name: STRING(react-form)
InstrumentationLibrarySpans #0
InstrumentationLibrary
Span #0
    Trace ID       : 3b419bca1ac2f58e77f4f44bafd1c416
    Parent ID      :
    ID             : 8c7ea545e471324e
    Name           : /v1.0/publish/pubsub/B
    Kind           : SPAN_KIND_CLIENT
    Start time     : 2022-01-03 15:09:14.200078 +0000 UTC
    End time       : 2022-01-03 15:09:14.200181 +0000 UTC
    Status code    : STATUS_CODE_UNSET
    Status message :
Attributes:
     -> dapr.api: STRING(POST /v1.0/publish/pubsub/B)
     -> dapr.protocol: STRING(http)
     -> dapr.status_code: STRING(400)
     -> error: STRING(INVALID_ARGUMENT)
     -> messaging.destination: STRING(B)
     -> messaging.destination_kind: STRING(topic)
     -> messaging.system: STRING(pubsub)
     -> opencensus.status_description: STRING(InvalidArgument)
     -> net.host.ip: STRING(10.240.0.48)

2022-01-03T15:09:16.313Z        INFO    loggingexporter/logging_exporter.go:40  TracesExporter  {"#spans": 1}
2022-01-03T15:09:16.313Z        DEBUG   loggingexporter/logging_exporter.go:49  ResourceSpans #0
Resource labels:
     -> service.name: STRING(react-form)
InstrumentationLibrarySpans #0
InstrumentationLibrary
Span #0
    Trace ID       : ecbafc09607f21de7b8ef9f85ea0ecaa
    Parent ID      :
    ID             : 3dcbb03702caa23d
    Name           : /v1.0/publish/pubsub/A
    Kind           : SPAN_KIND_CLIENT
    Start time     : 2022-01-03 15:09:15.720106 +0000 UTC
    End time       : 2022-01-03 15:09:15.720174 +0000 UTC
    Status code    : STATUS_CODE_UNSET
    Status message :
Attributes:
     -> dapr.api: STRING(POST /v1.0/publish/pubsub/A)
     -> dapr.protocol: STRING(http)
     -> dapr.status_code: STRING(400)
     -> error: STRING(INVALID_ARGUMENT)
     -> messaging.destination: STRING(A)
     -> messaging.destination_kind: STRING(topic)
     -> messaging.system: STRING(pubsub)
     -> opencensus.status_description: STRING(InvalidArgument)
     -> net.host.ip: STRING(10.240.0.48)

2022-01-03T15:09:18.412Z        INFO    loggingexporter/logging_exporter.go:40  TracesExporter  {"#spans": 1}
2022-01-03T15:09:18.413Z        DEBUG   loggingexporter/logging_exporter.go:49  ResourceSpans #0
Resource labels:
     -> service.name: STRING(react-form)
InstrumentationLibrarySpans #0
InstrumentationLibrary
Span #0
    Trace ID       : 2979e0567907ba0288d1757426efa751
    Parent ID      :
    ID             : ee17bc292022132d
    Name           : /v1.0/publish/pubsub/A
    Kind           : SPAN_KIND_CLIENT
    Start time     : 2022-01-03 15:09:17.952136 +0000 UTC
    End time       : 2022-01-03 15:09:17.952307 +0000 UTC
    Status code    : STATUS_CODE_UNSET
    Status message :
Attributes:
     -> messaging.destination_kind: STRING(topic)
     -> messaging.system: STRING(pubsub)
     -> opencensus.status_description: STRING(InvalidArgument)
     -> dapr.api: STRING(POST /v1.0/publish/pubsub/A)
     -> dapr.protocol: STRING(http)
     -> dapr.status_code: STRING(400)
     -> error: STRING(INVALID_ARGUMENT)
     -> messaging.destination: STRING(A)
     -> net.host.ip: STRING(10.240.0.48)
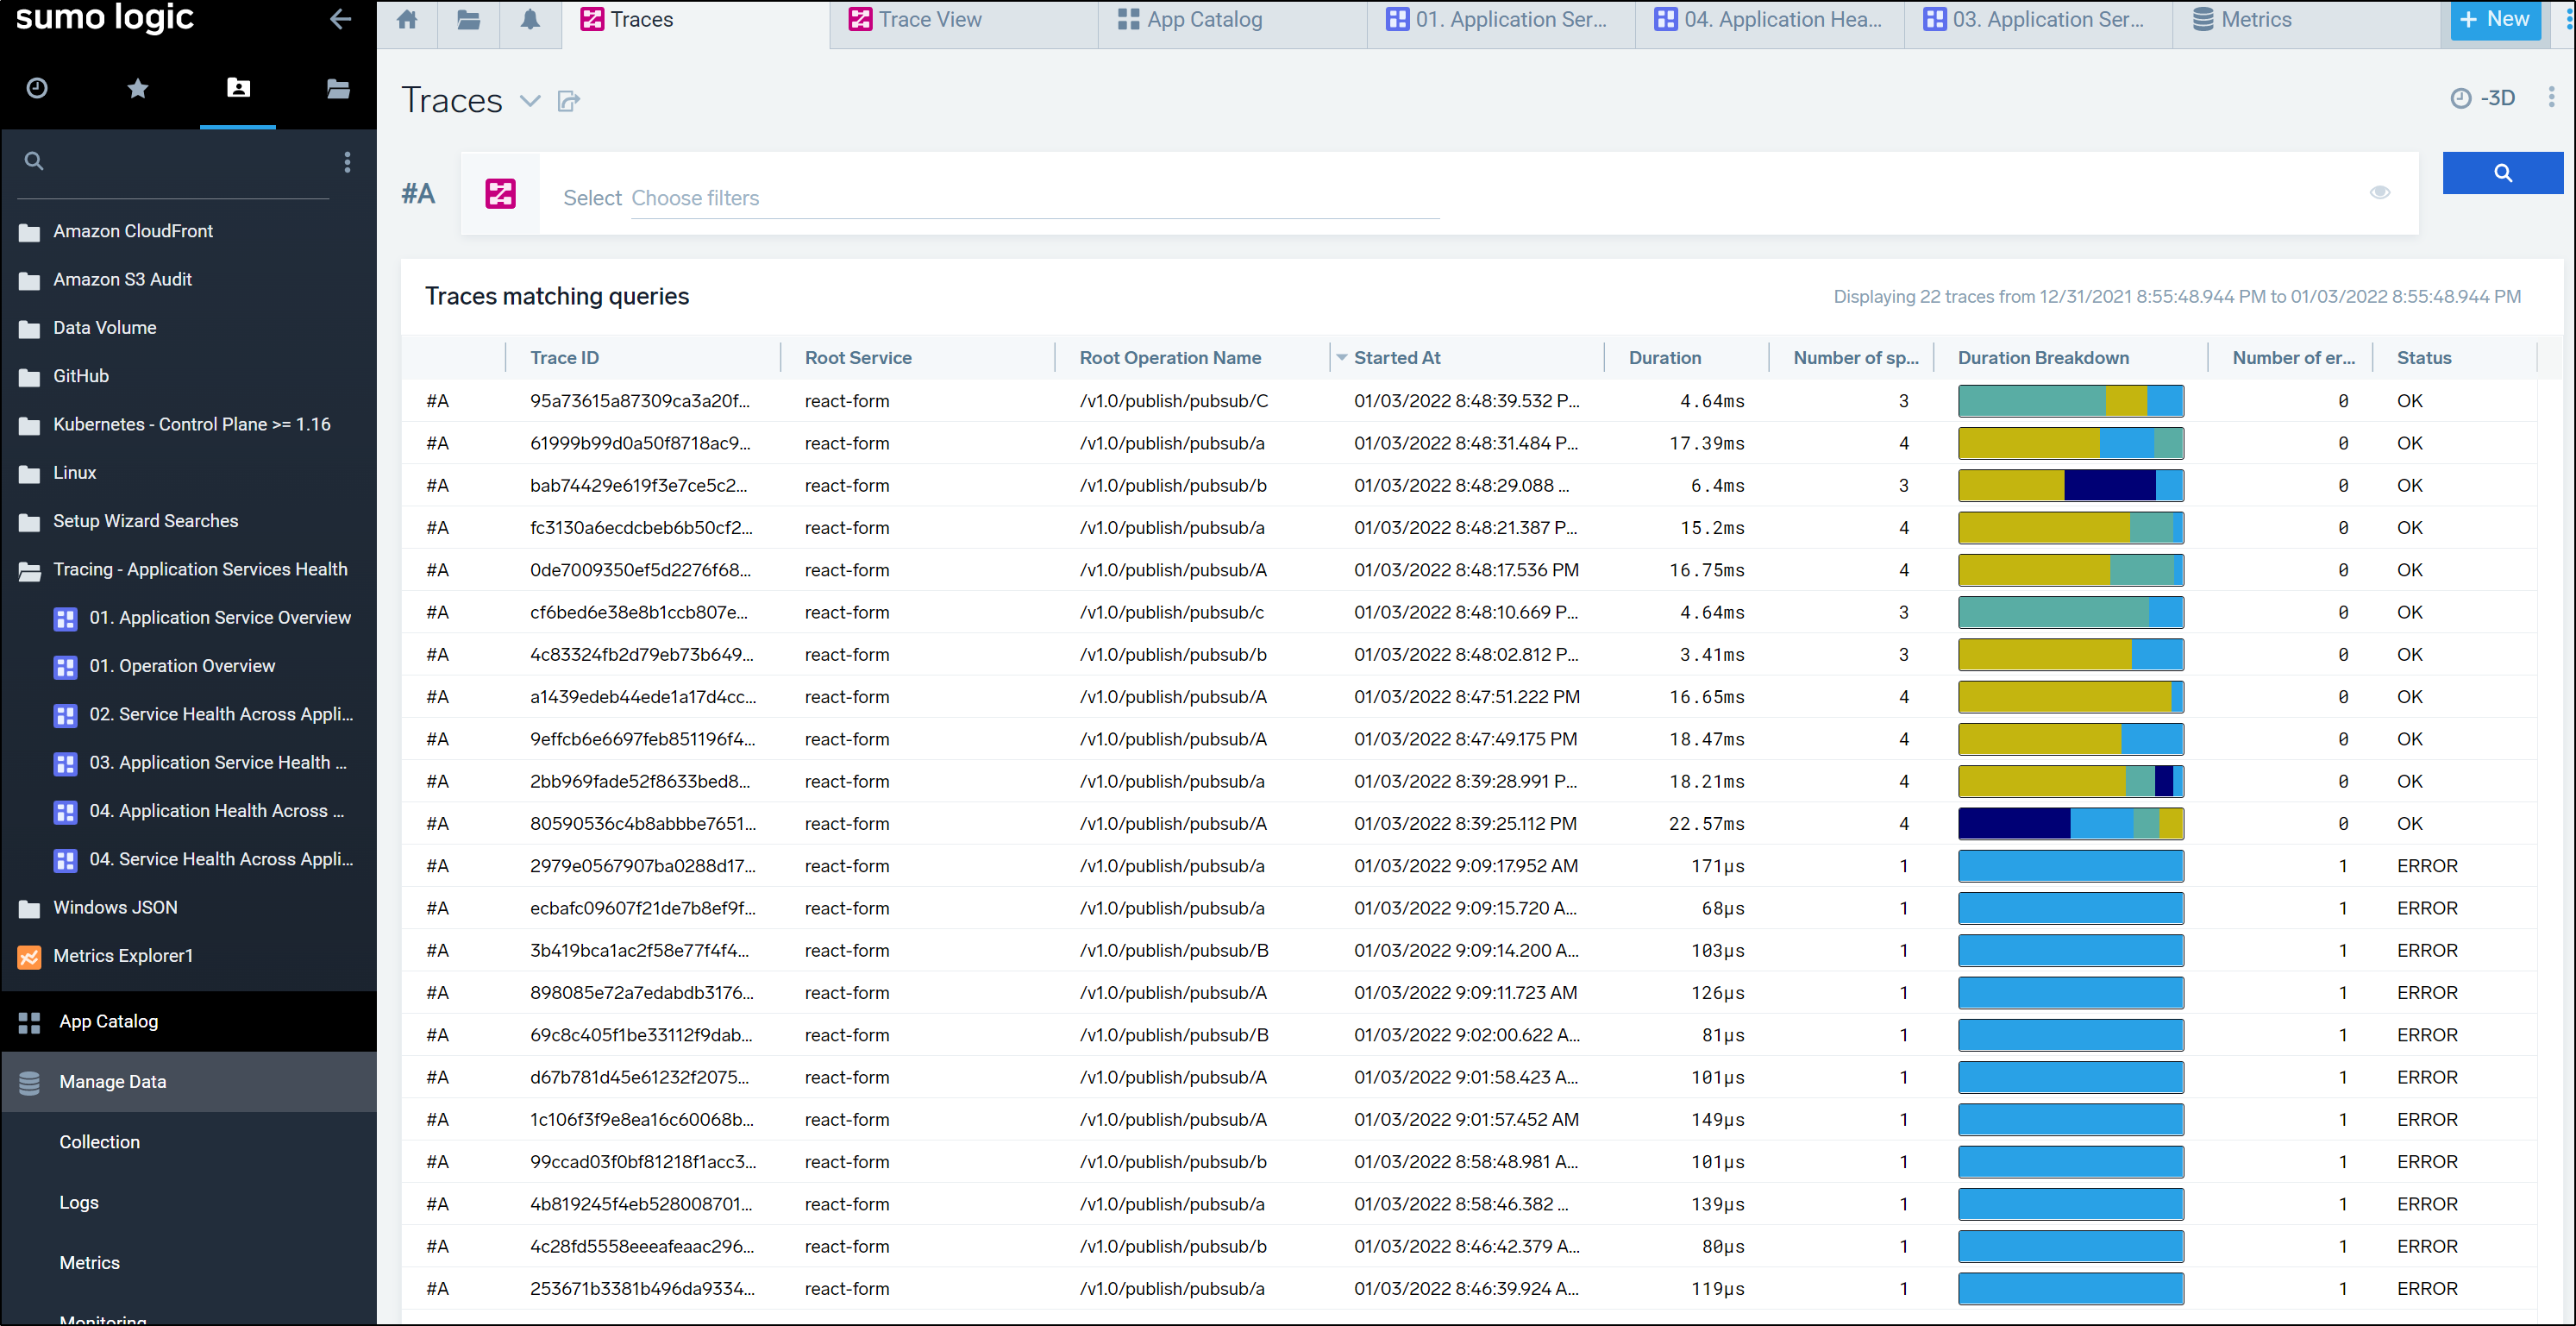
We can now see trace data:
One thing that threw me is that I thought “*” for application and service would show all. Instead, I needed to select the newly populated “default” and “react-form” values.
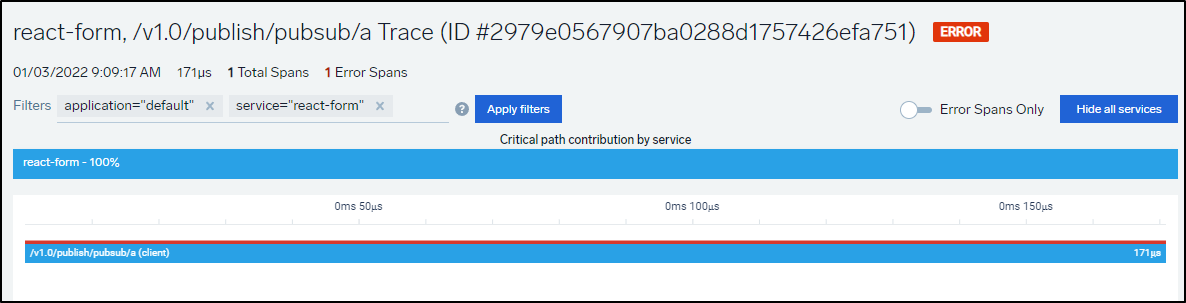
We can then use Traces to lookup details
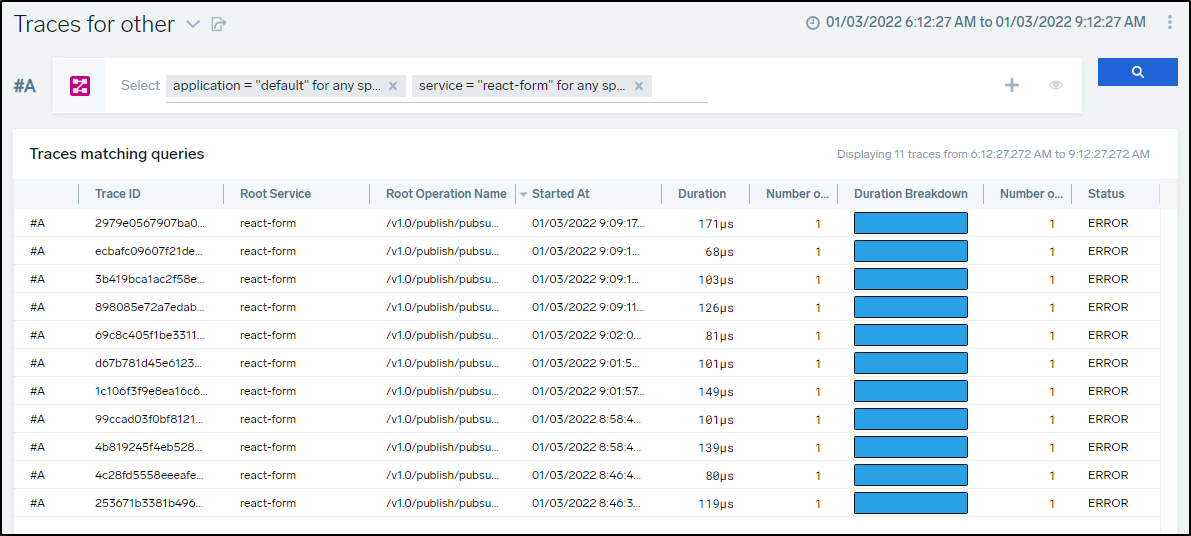
These are indeed in error as the Redis stack and the PubSub component have yet to be installed
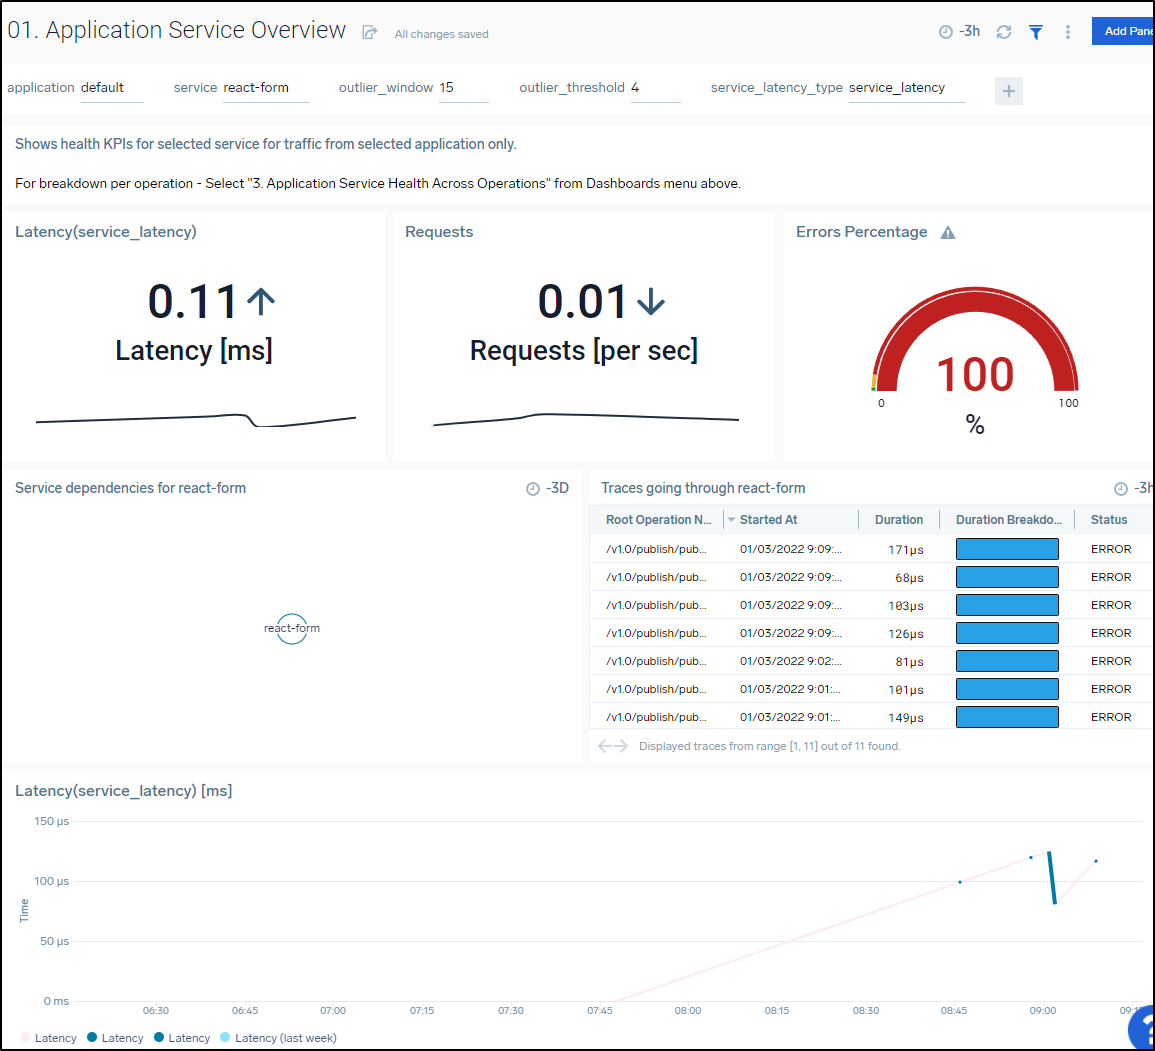
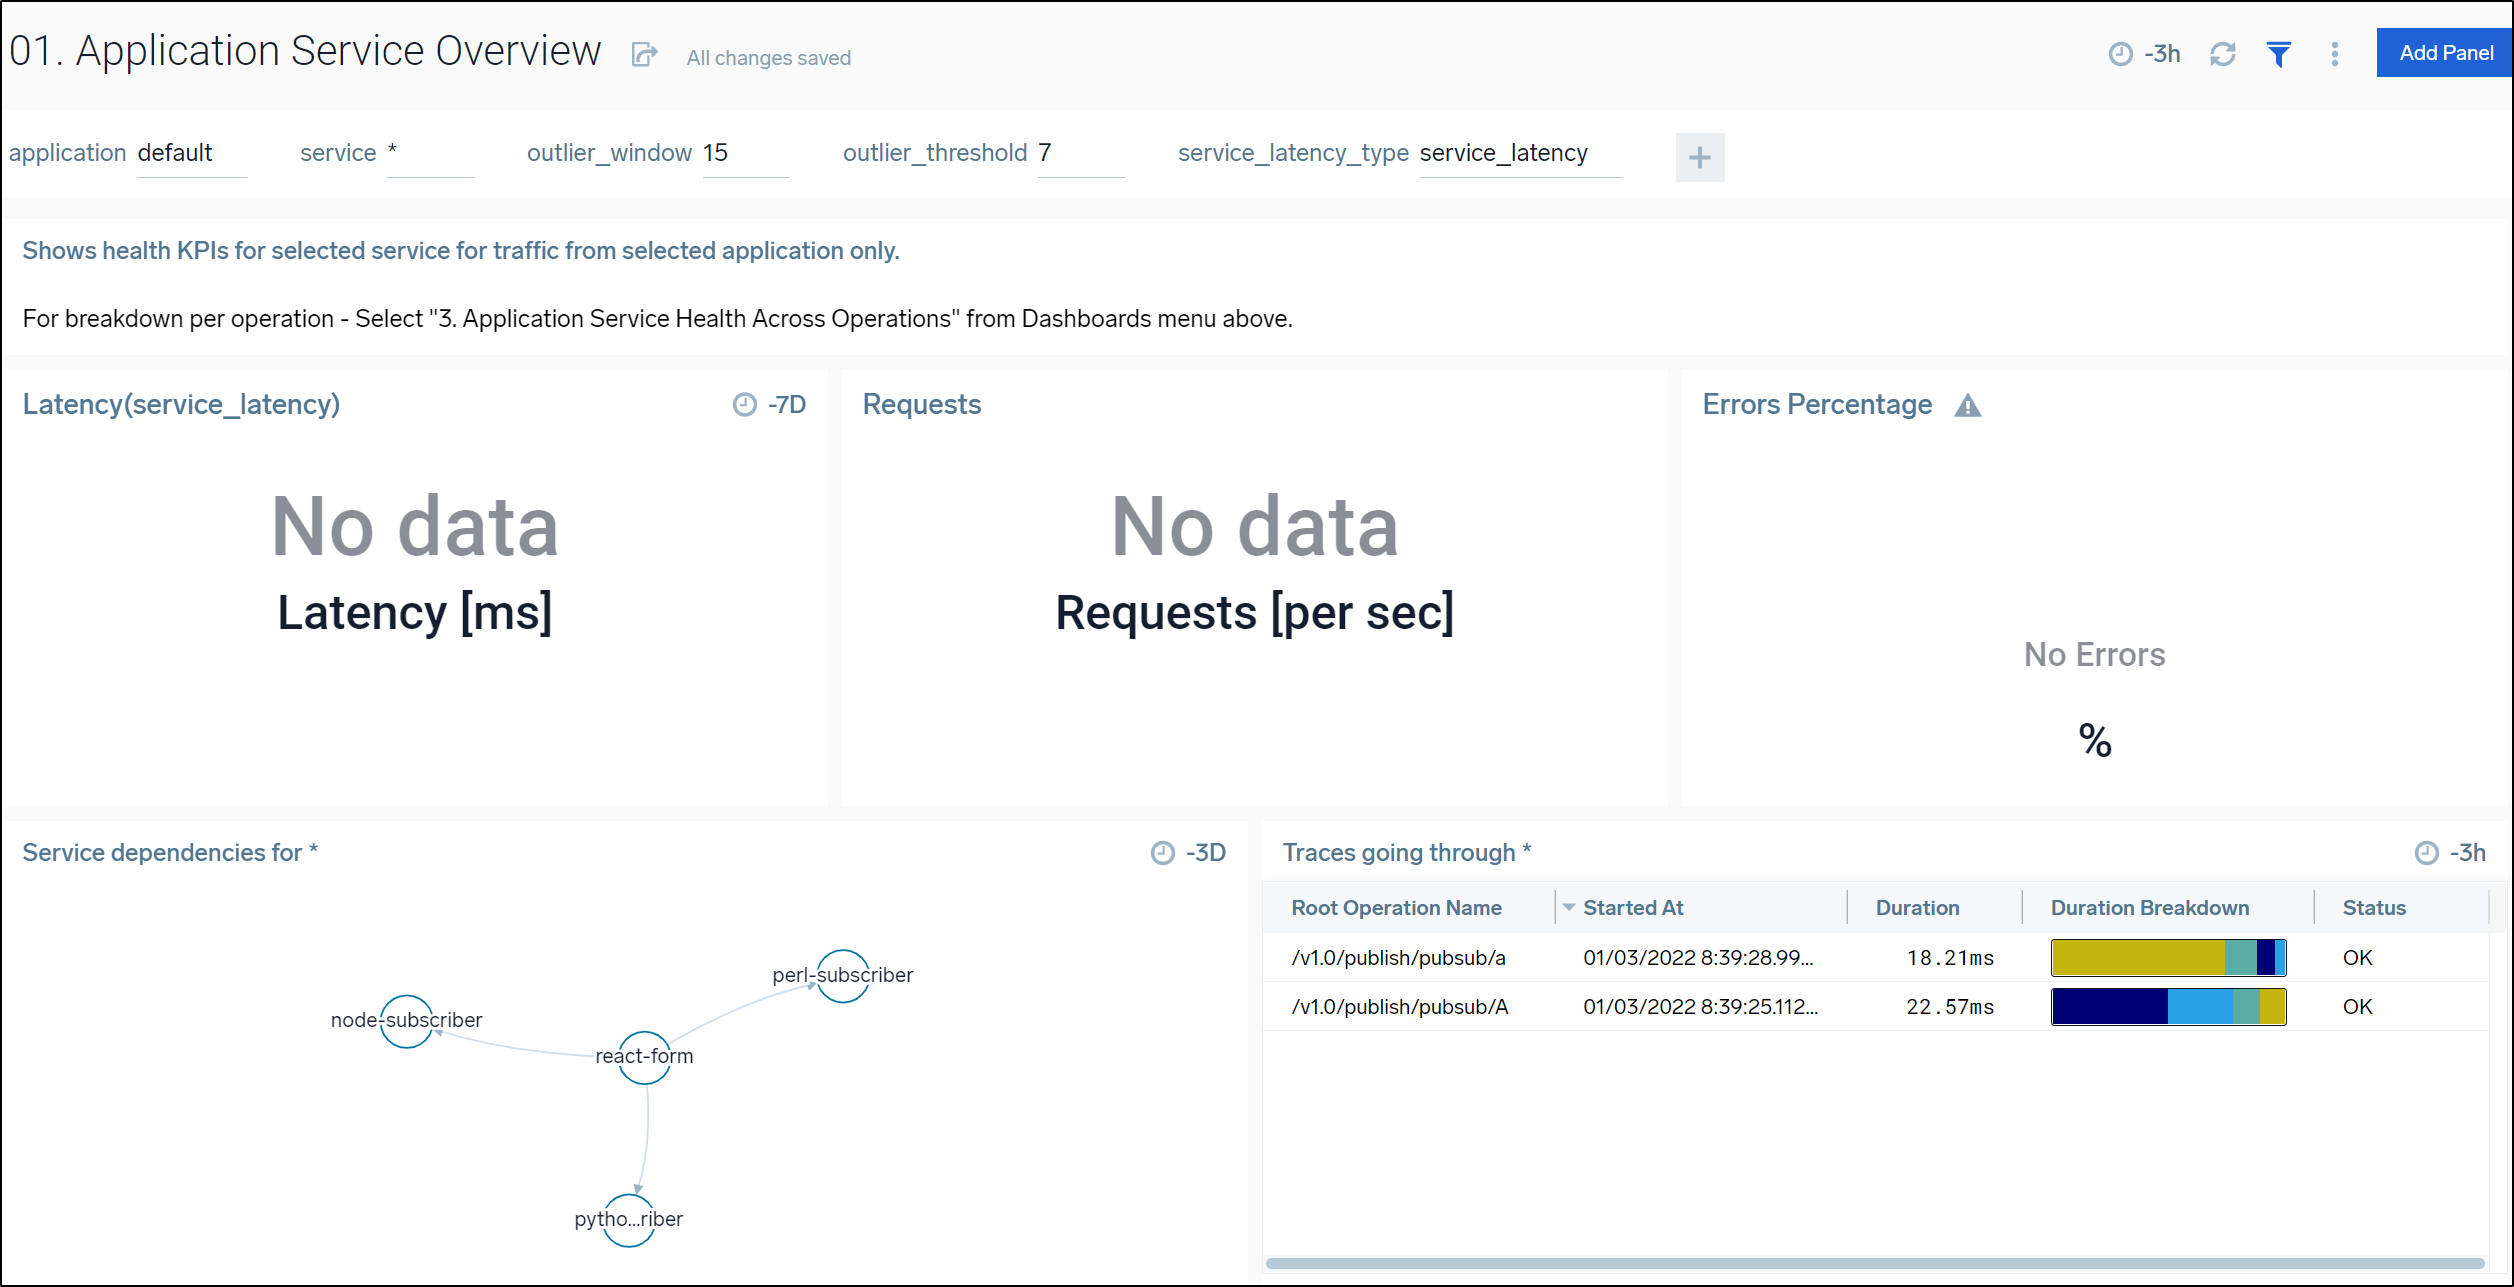
On our Application Service Overview page, we can see errors and requests
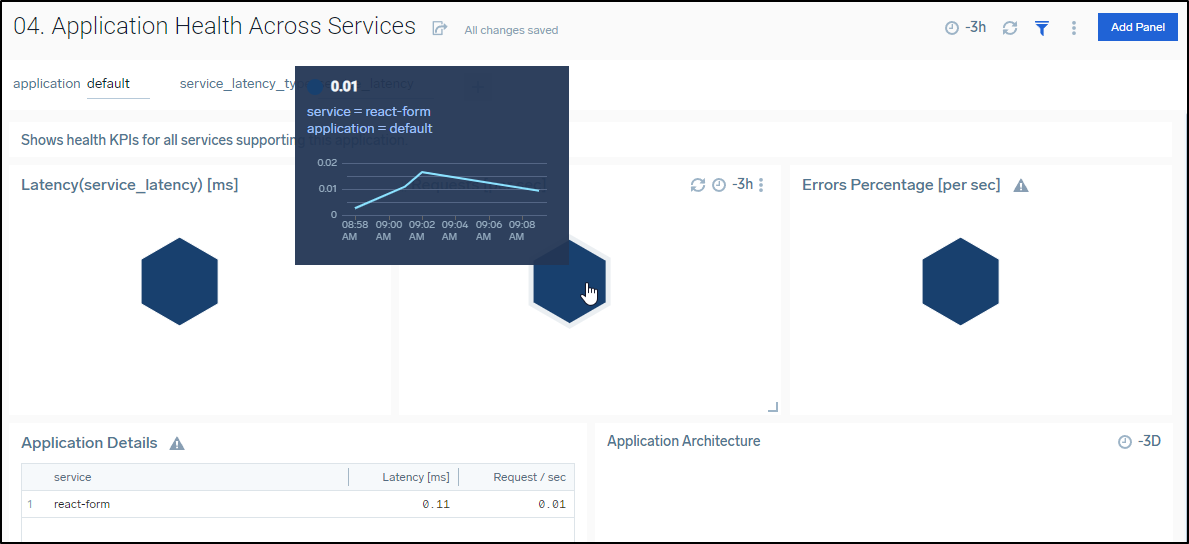
The “Application Health Across Services” lets us view all the services in “default” (just one right now)
Fixing the errors; Install Dapr quickstarts
These Dapr deploys mostly came from the Dapr quickstarts originally.
I used the pub-sub quickstart to setup proper node, python and react. I had hand copied the react from my on-prem cluster.
The Perl based one I added (that is, I created and it’s shared publicly):
$ kubectl get deployments perl-subscriber -o yaml
apiVersion: apps/v1
kind: Deployment
metadata:
  labels:
    app: perl-subscriber
  name: perl-subscriber
spec:
  replicas: 1
  selector:
    matchLabels:
      app: perl-subscriber
  template:
    metadata:
      annotations:
        dapr.io/app-id: perl-subscriber
        dapr.io/app-port: "8080"
        dapr.io/config: appconfig
        dapr.io/enabled: "true"
      creationTimestamp: null
      labels:
        app: perl-subscriber
    spec:
      containers:
      - env:
        - name: WEBHOOKURL
          valueFrom:
            secretKeyRef:
              key: hookURL
              name: teamshook
        image: idjohnson/dapr-perl:v18
        name: perl-subscriber
        ports:
        - containerPort: 8080
          protocol: TCP
      restartPolicy: Always
It does expect a Teams webhook e.g.
$ kubectl get secrets teamshook -o yaml
apiVersion: v1
data:
  hookURL: asdfasdfasdfasdfasdfasdfasdfasdfasfasfasfasdfasdfasdfasdf==
kind: Secret
metadata:
  name: teamshook
type: Opaque
Where the hookURL is the base64 value like https://princessking.webhook.office.com/webhookb2/c…etc etc (you can put garbage and just know it won’t update a Teams channel)
If you want to use existing containers and not have to build and store them (as the quick start says), you can use the following:
$ kubectl get deployments node-subscriber -o yaml
apiVersion: apps/v1
kind: Deployment
metadata:
  labels:
    app: node-subscriber
  name: node-subscriber
spec:
  replicas: 1
  selector:
    matchLabels:
      app: node-subscriber
  template:
    metadata:
      annotations:
        dapr.io/app-id: node-subscriber
        dapr.io/app-port: "3000"
        dapr.io/config: appconfig
        dapr.io/enabled: "true"
      labels:
        app: node-subscriber
    spec:
      containers:
      - image: dapriosamples/pubsub-node-subscriber:latest
        imagePullPolicy: Always
        name: node-subscriber
        ports:
        - containerPort: 3000
          protocol: TCP
      restartPolicy: Always


$ kubectl get deployments python-subscriber -o yaml
apiVersion: apps/v1
kind: Deployment
metadata:
  labels:
    app: python-subscriber
  name: python-subscriber
spec:
  replicas: 1
  selector:
    matchLabels:
      app: python-subscriber
  template:
    metadata:
      annotations:
        dapr.io/app-id: python-subscriber
        dapr.io/app-port: "5000"
        dapr.io/config: appconfig
        dapr.io/enabled: "true"
      labels:
        app: python-subscriber
    spec:
      containers:
      - image: dapriosamples/pubsub-python-subscriber:latest
        imagePullPolicy: Always
        name: python-subscriber
        ports:
        - containerPort: 5000
          protocol: TCP
      restartPolicy: Always
Once applied and after hitting the react form with a kubectl port-forward (react pod) 8080:8080 a few times, we can see some data. I also hit the perl subscriber as it is designed to hit several other services on “:8080/hello”.
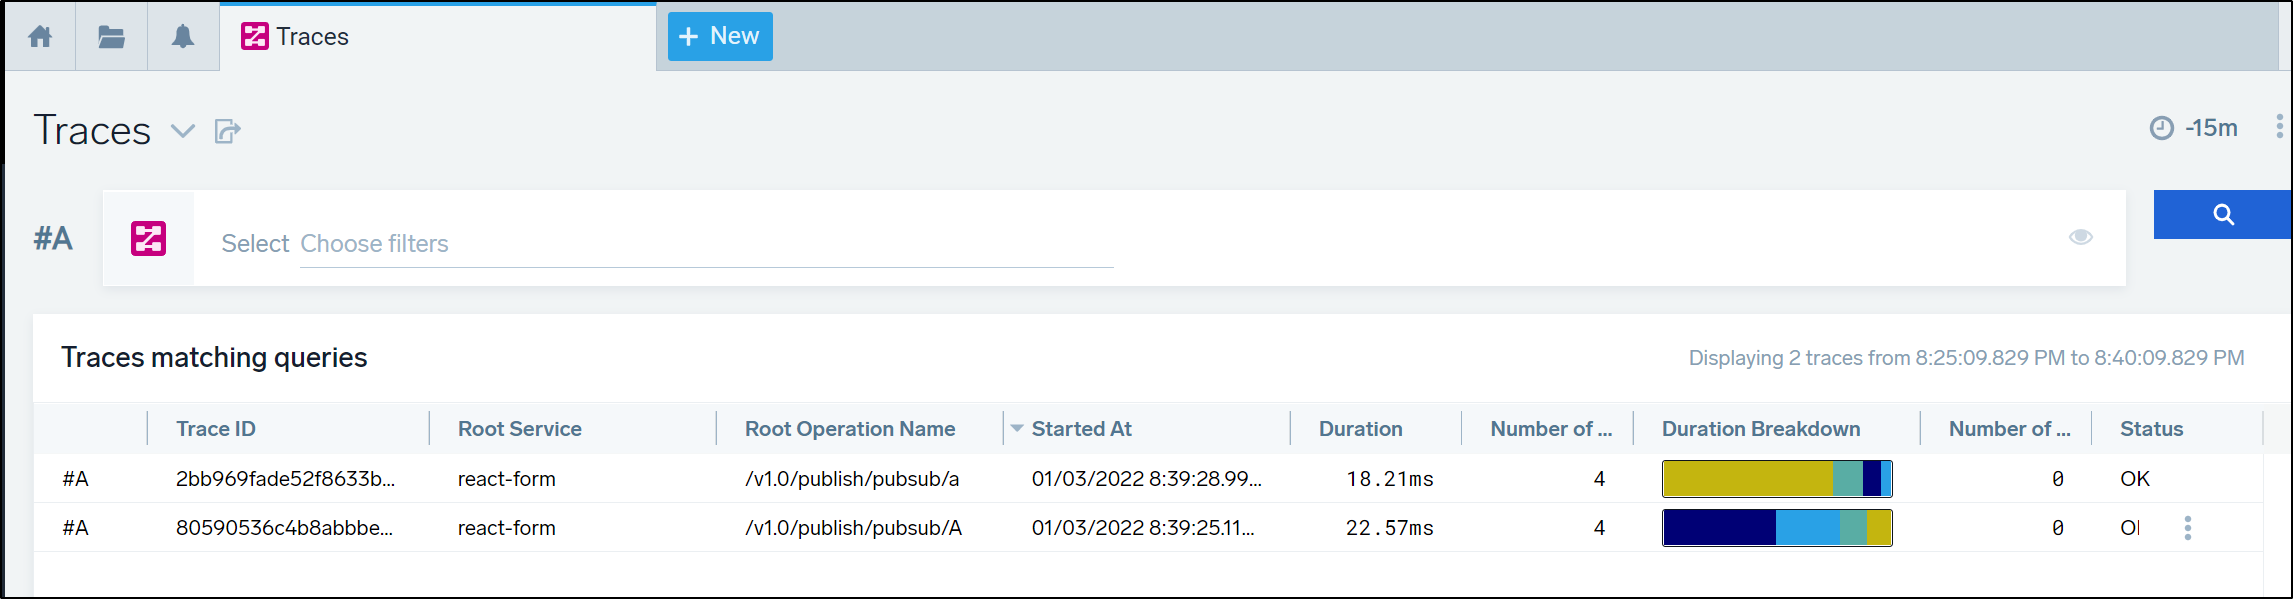
We can see traces now have real data in the Traces main menu.
If we look at current traces we can see the service name (react-form) and the service hit a number of other services. We see it now has the status of “OK” instead of “ERROR”:
we can expand a given trace and see that the pub-sub triggered the python-subscriber
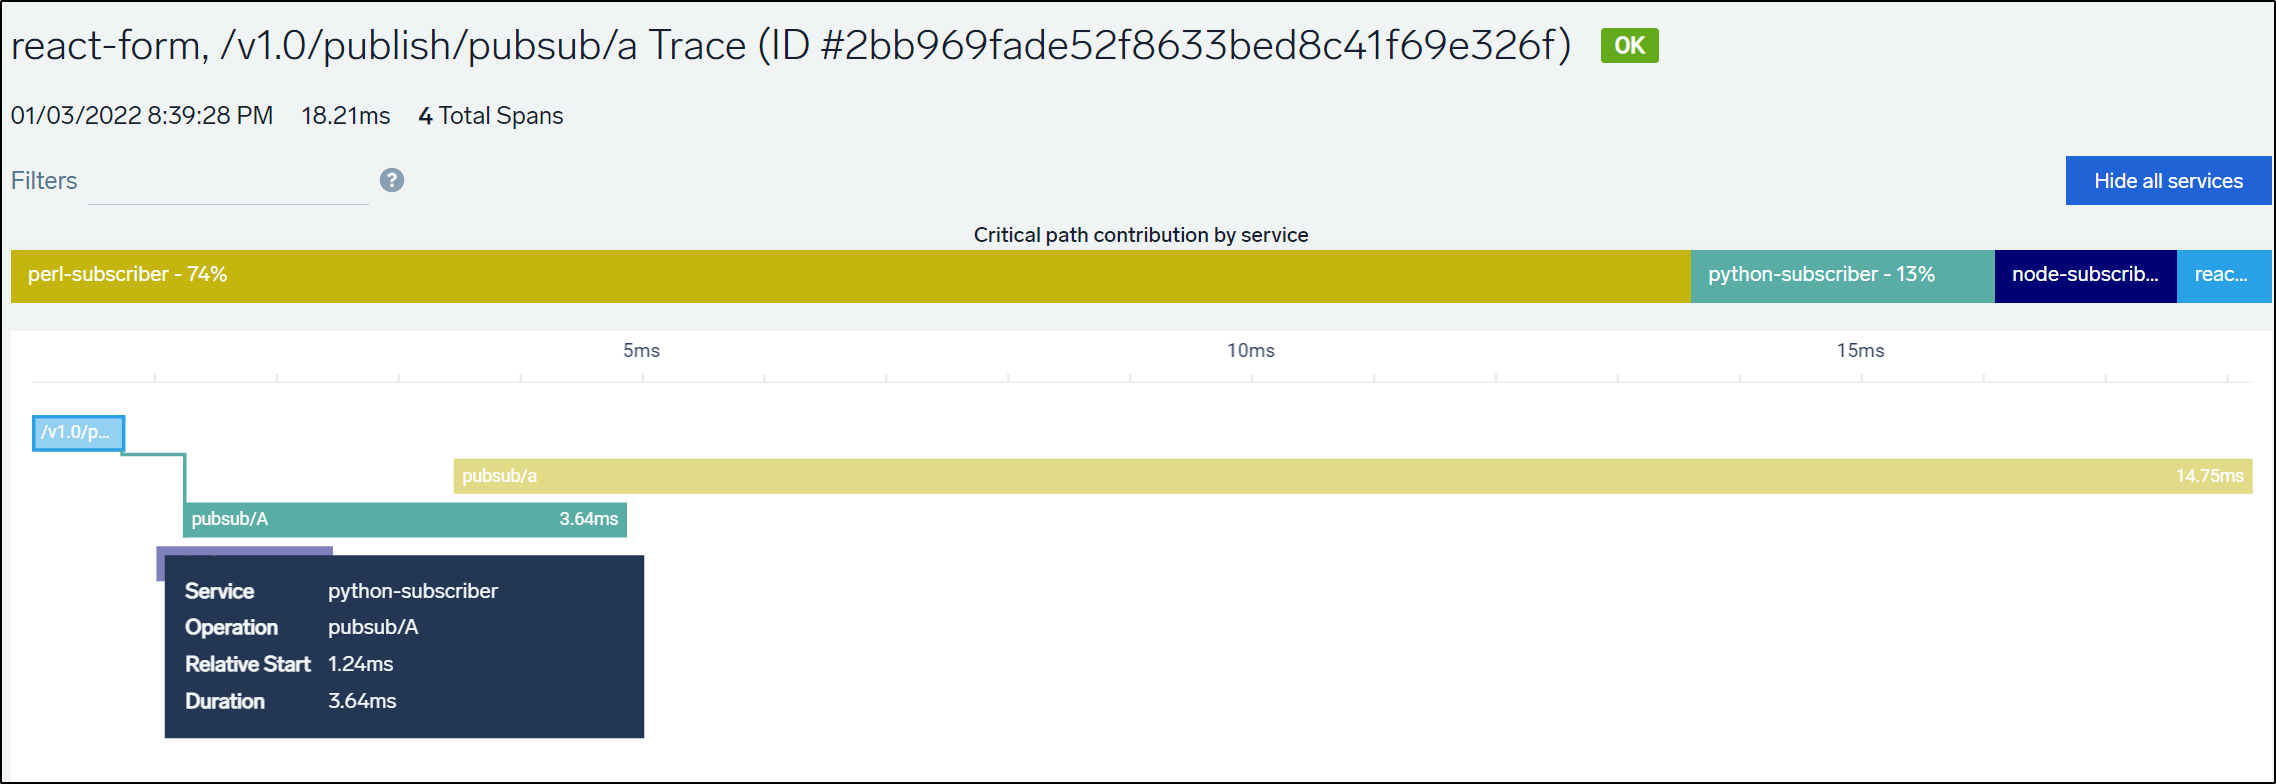
as well as the node-subscriber
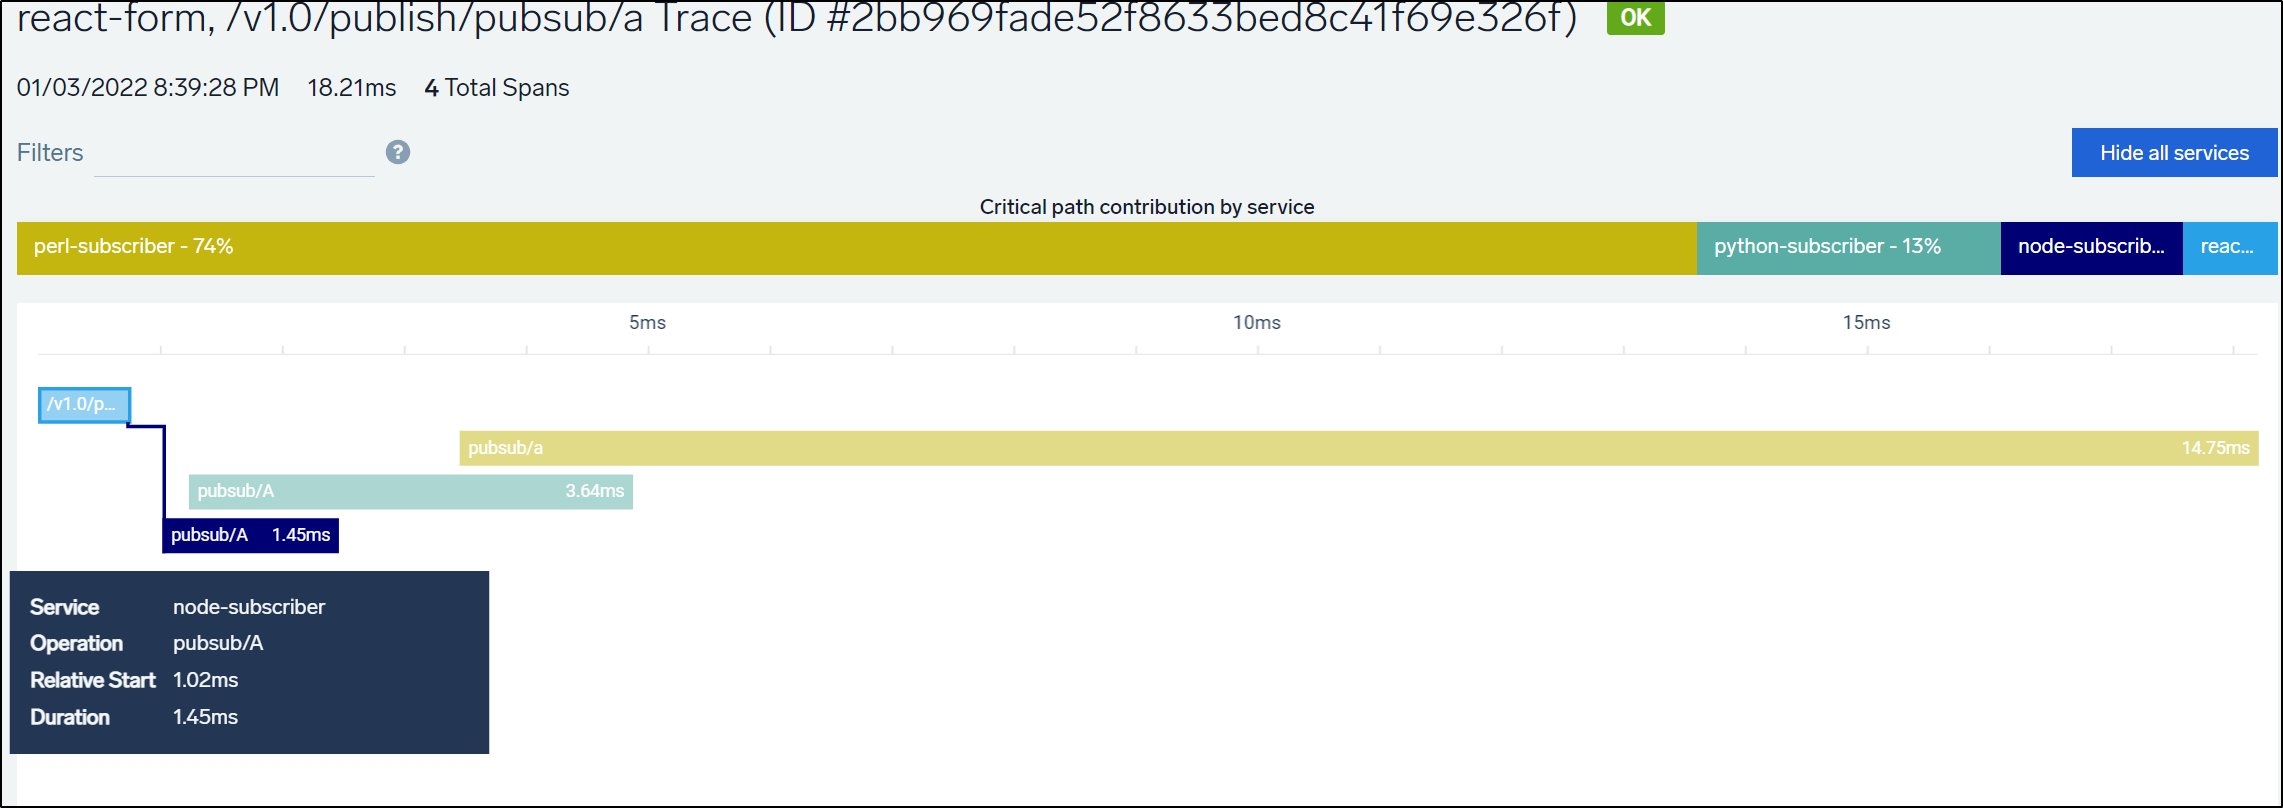
Looking at the Application Service Overview, we can see these traces (when selecting “default” application) and the Service Dependencies graph in the lower left shows us that relationship we saw in the trace window above; that react-form then triggers 3 different subscribers (node, perl and python).
Our Application Health menu shows are various services and relationship as well.
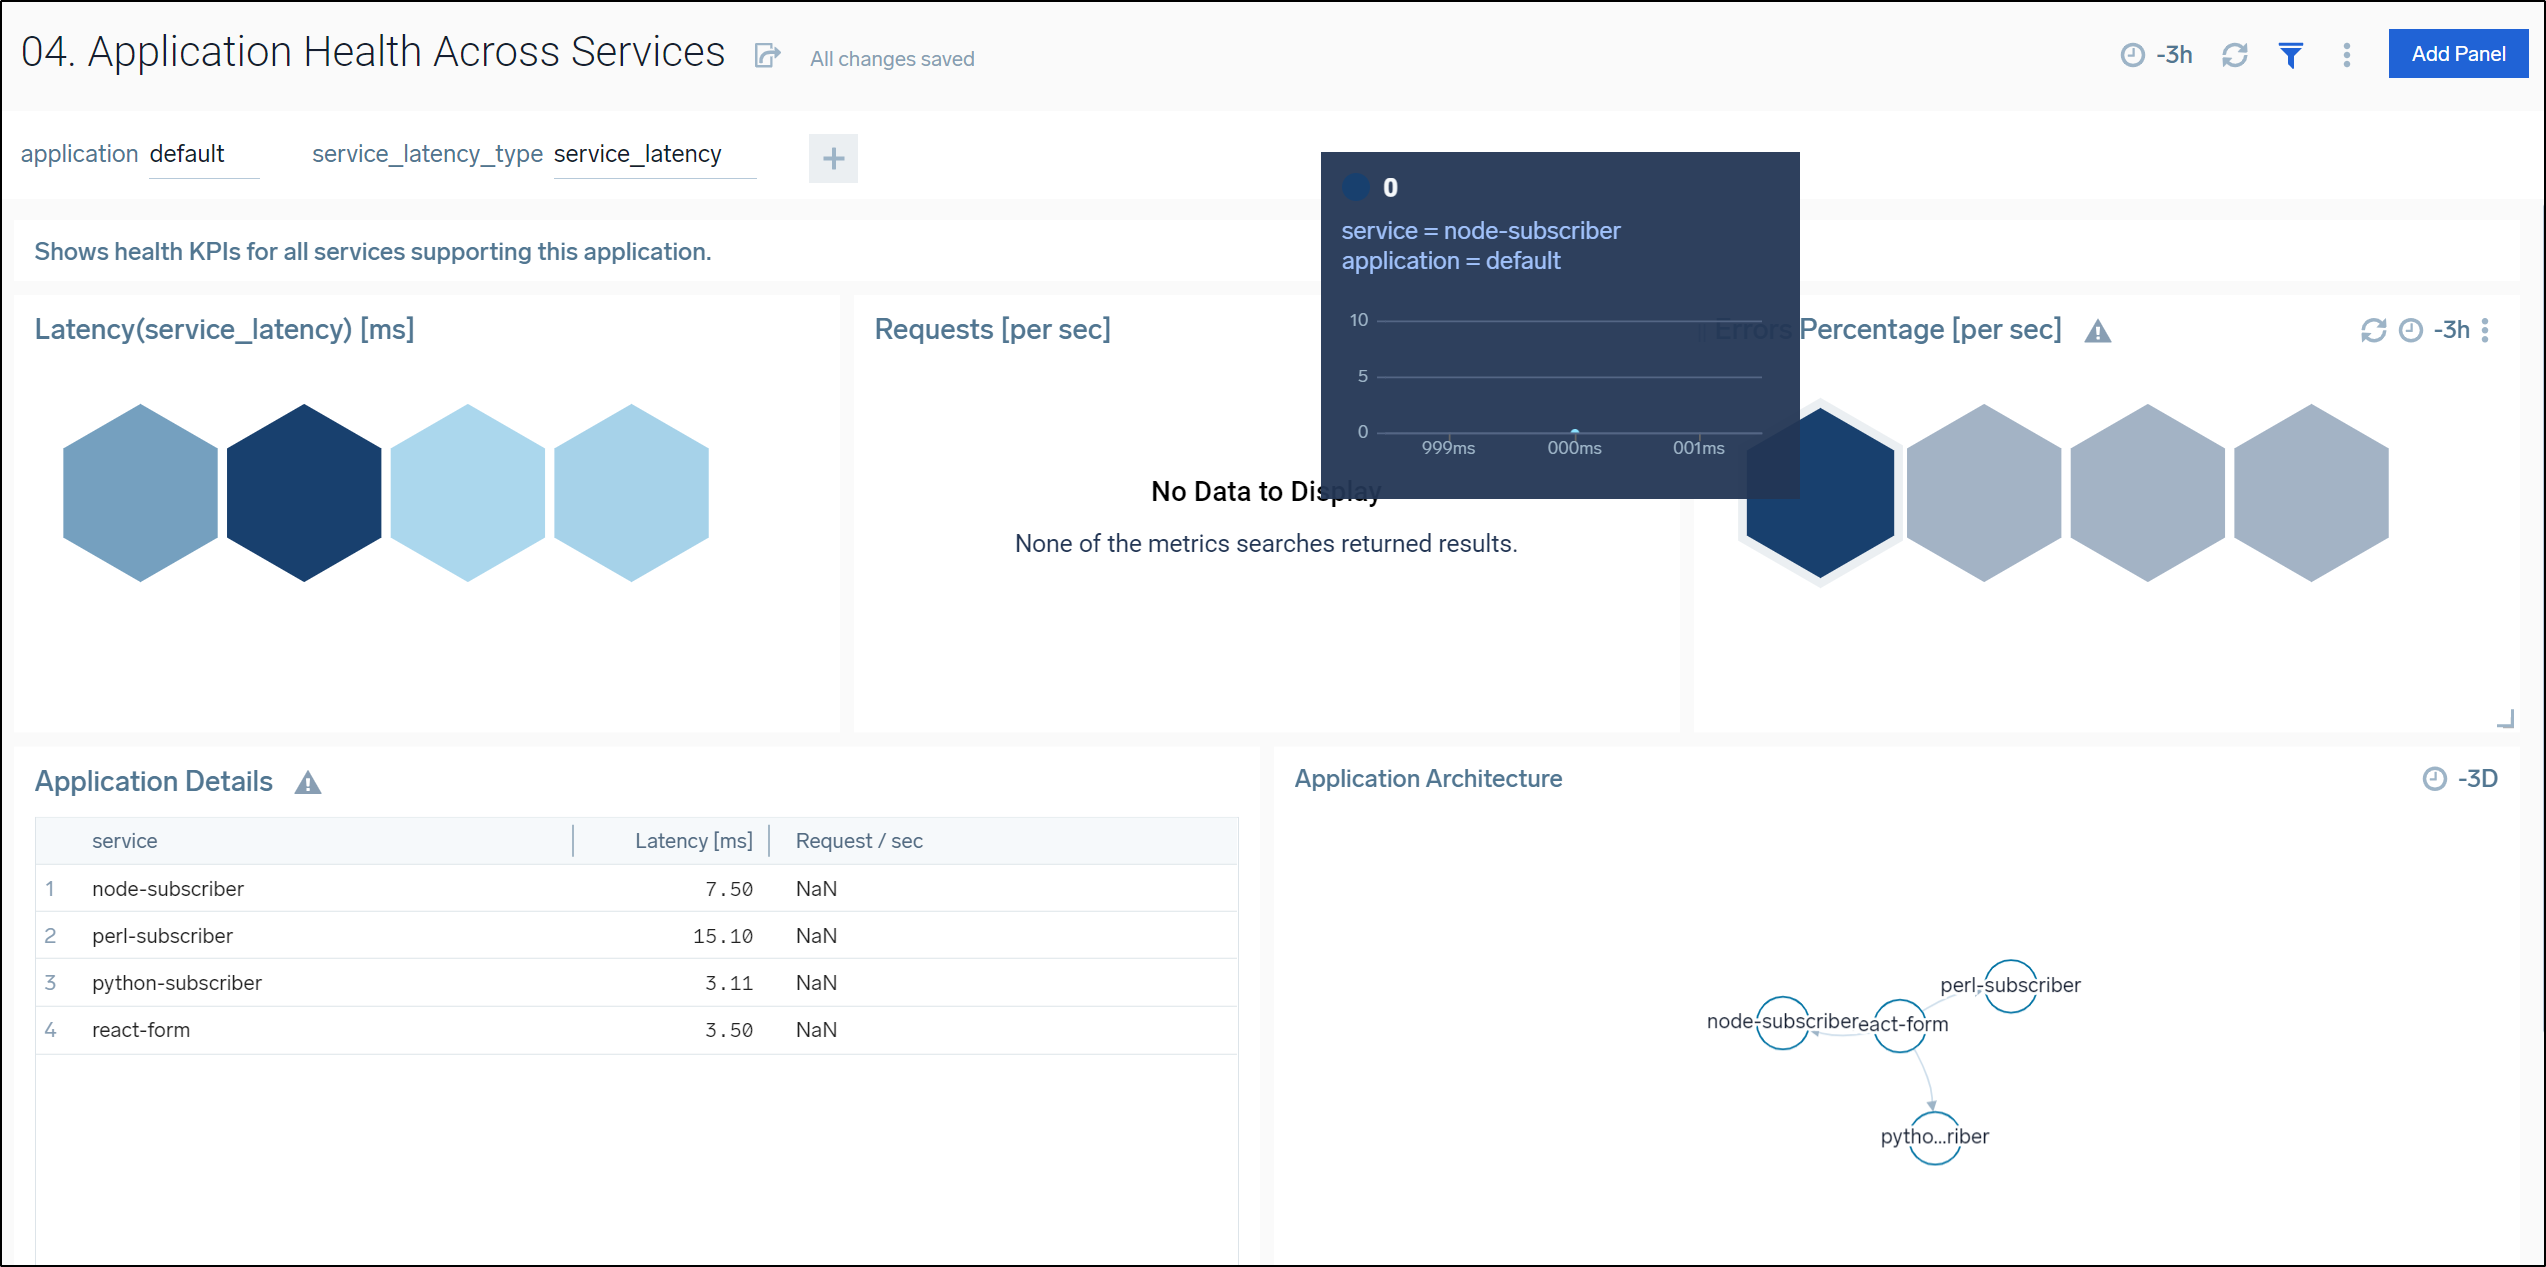
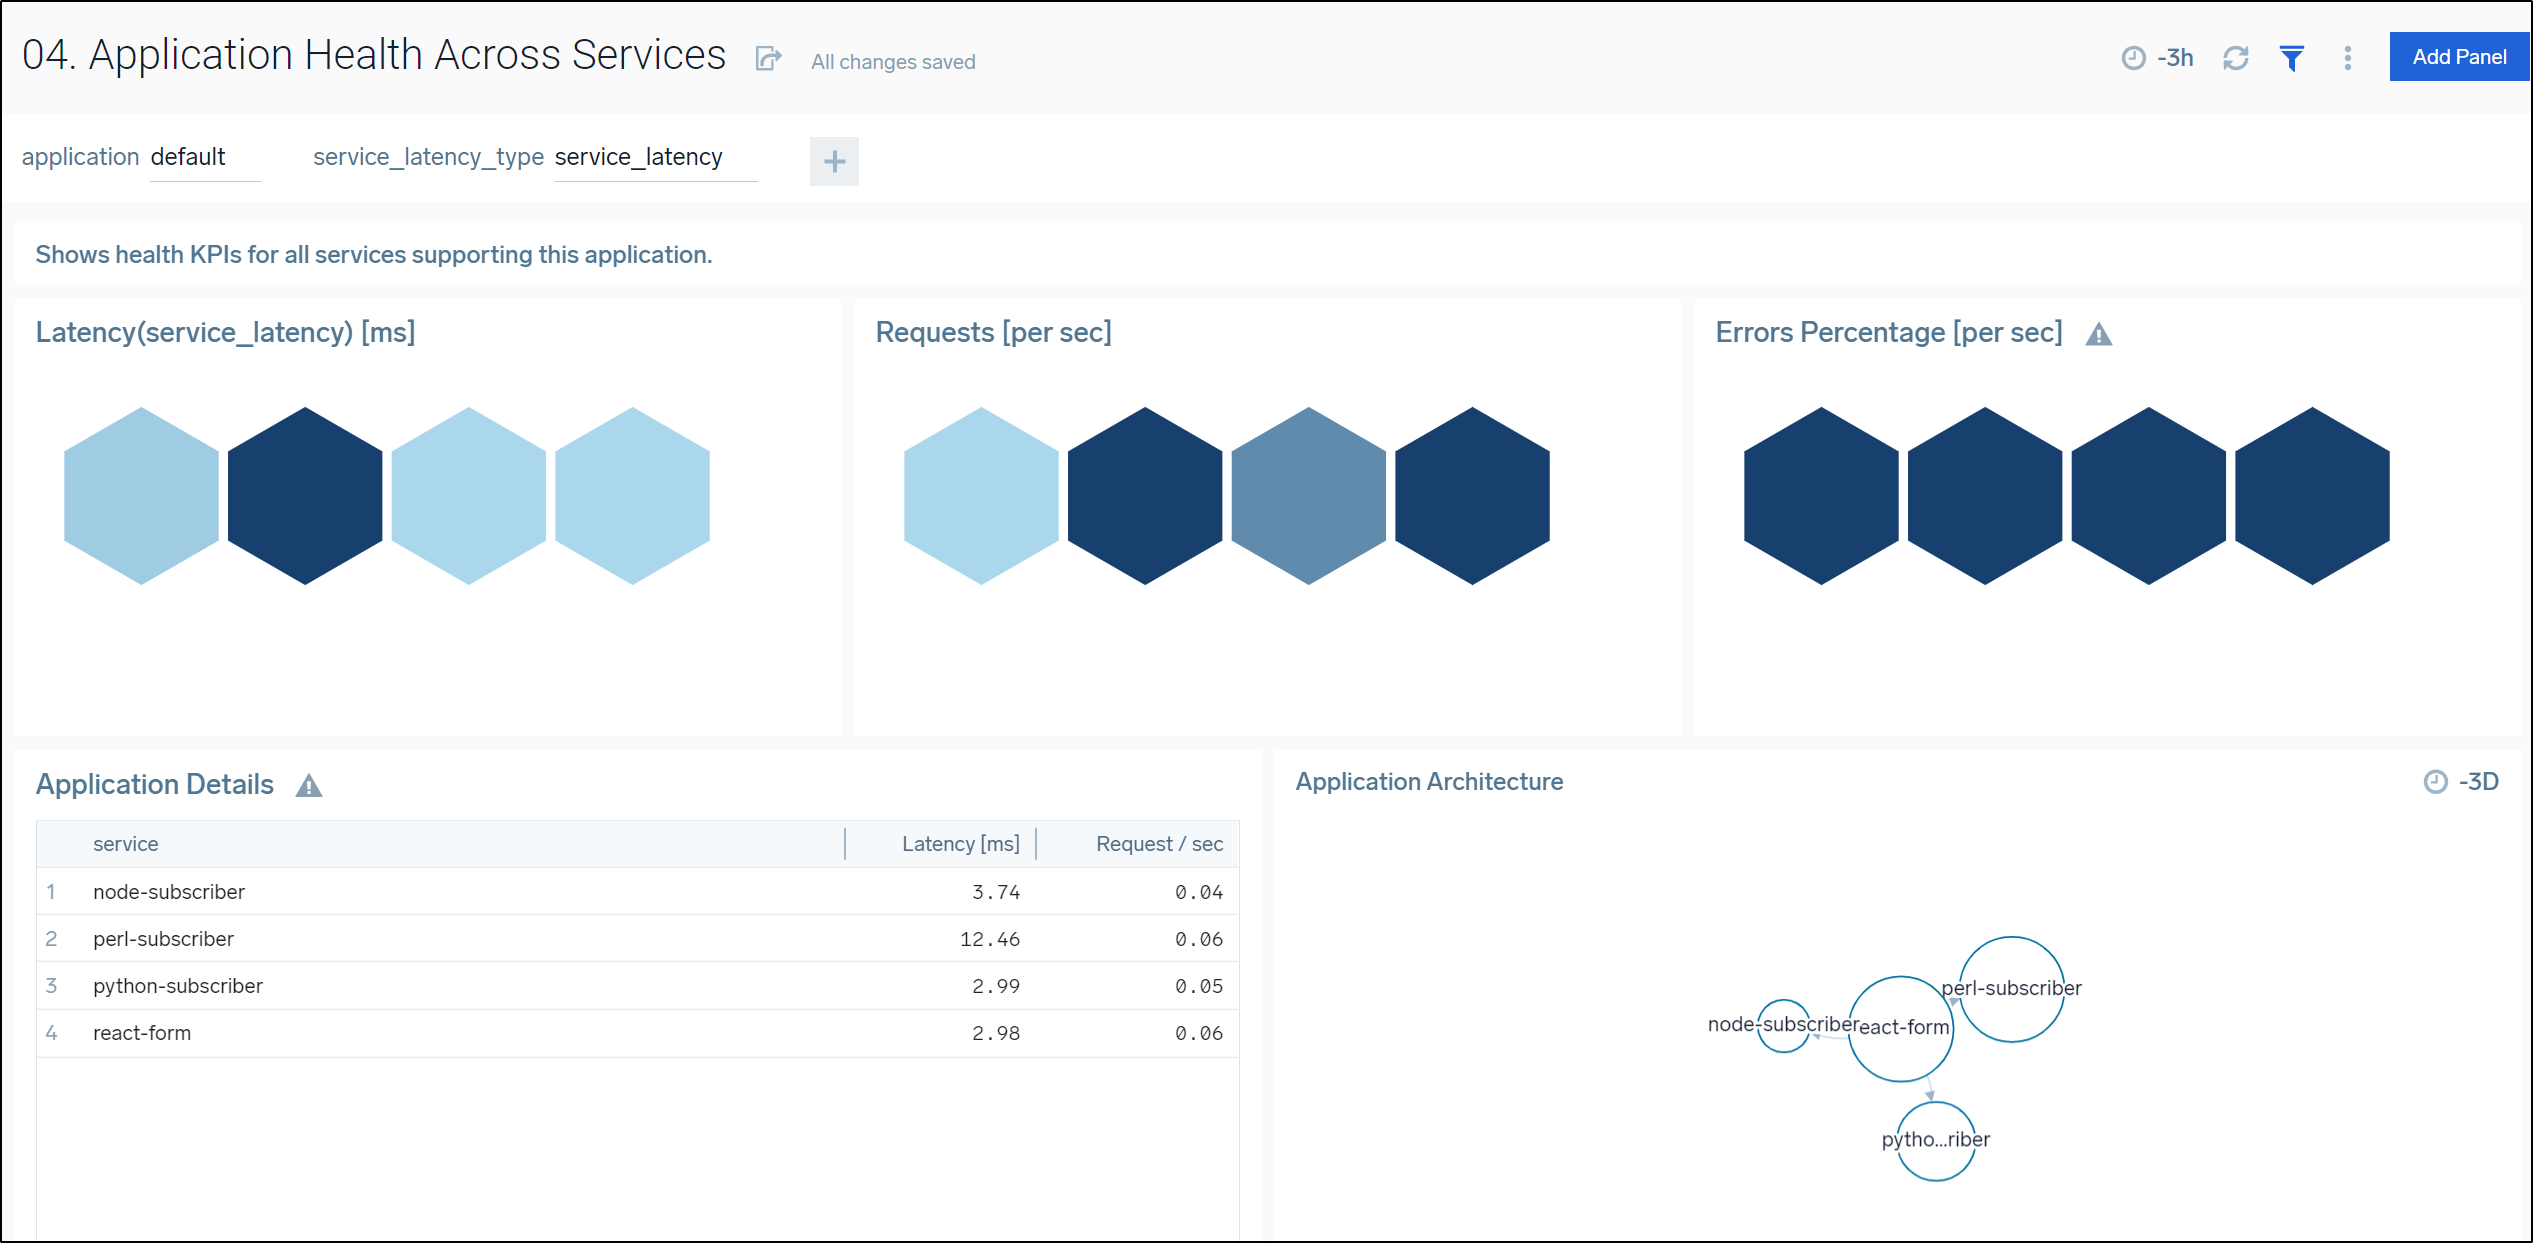
If I hammer the react app for a bit we can start to get request/sec numbers instead of NaN (not a number) values in the column. We also start to see the Application Architecture menu weight our services.
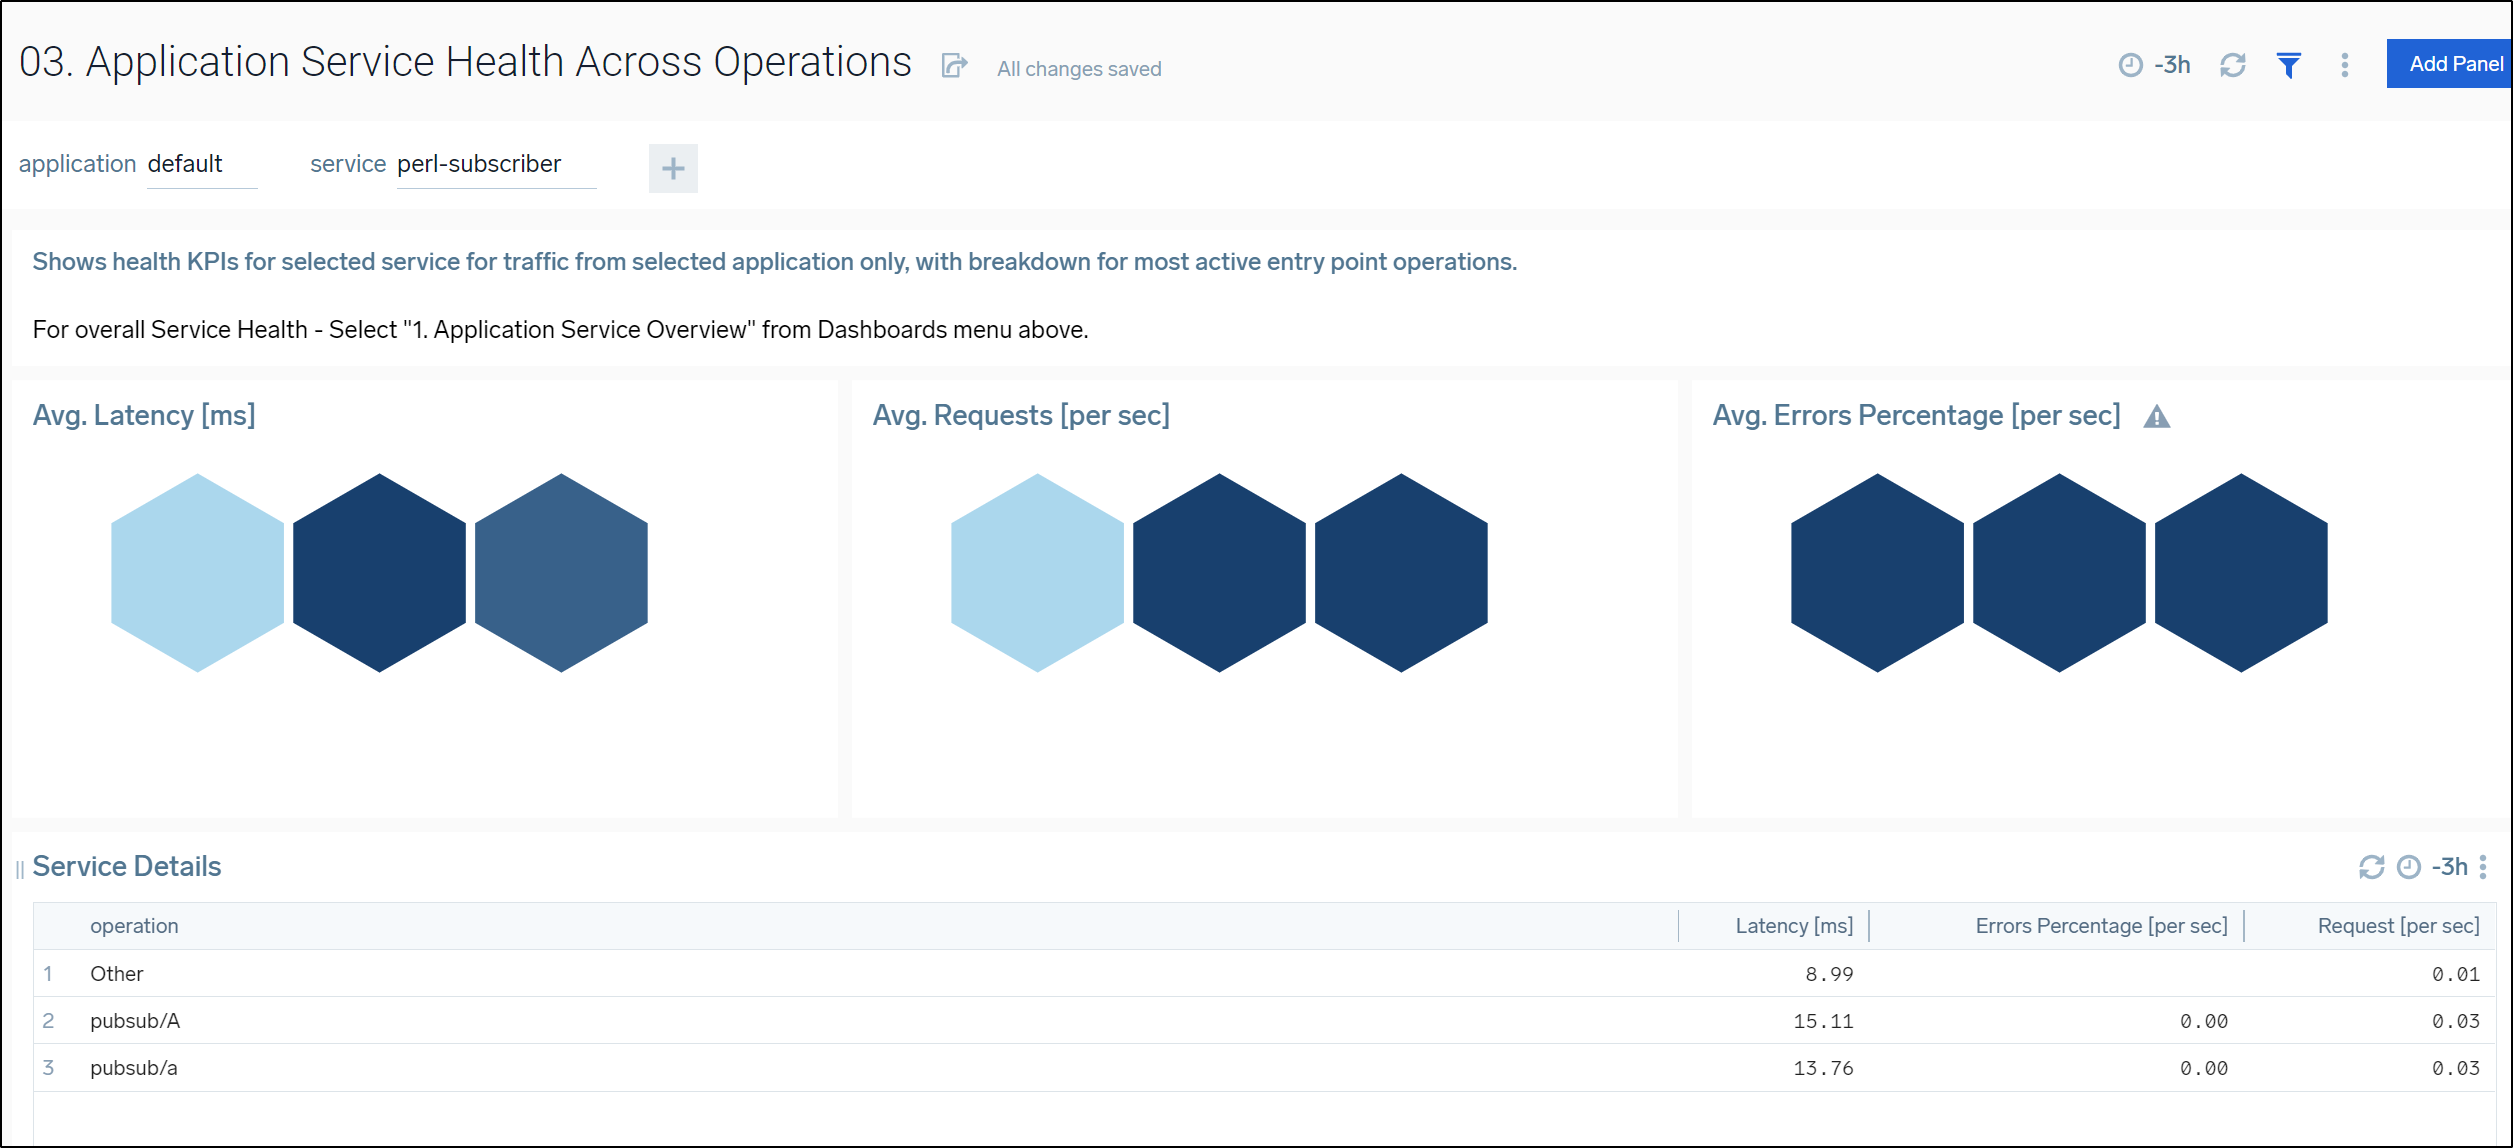
The “Application Service Health Across Operations” menu shows us similar details but slightly different metrics. Here we see Average Requests in the middle menu.
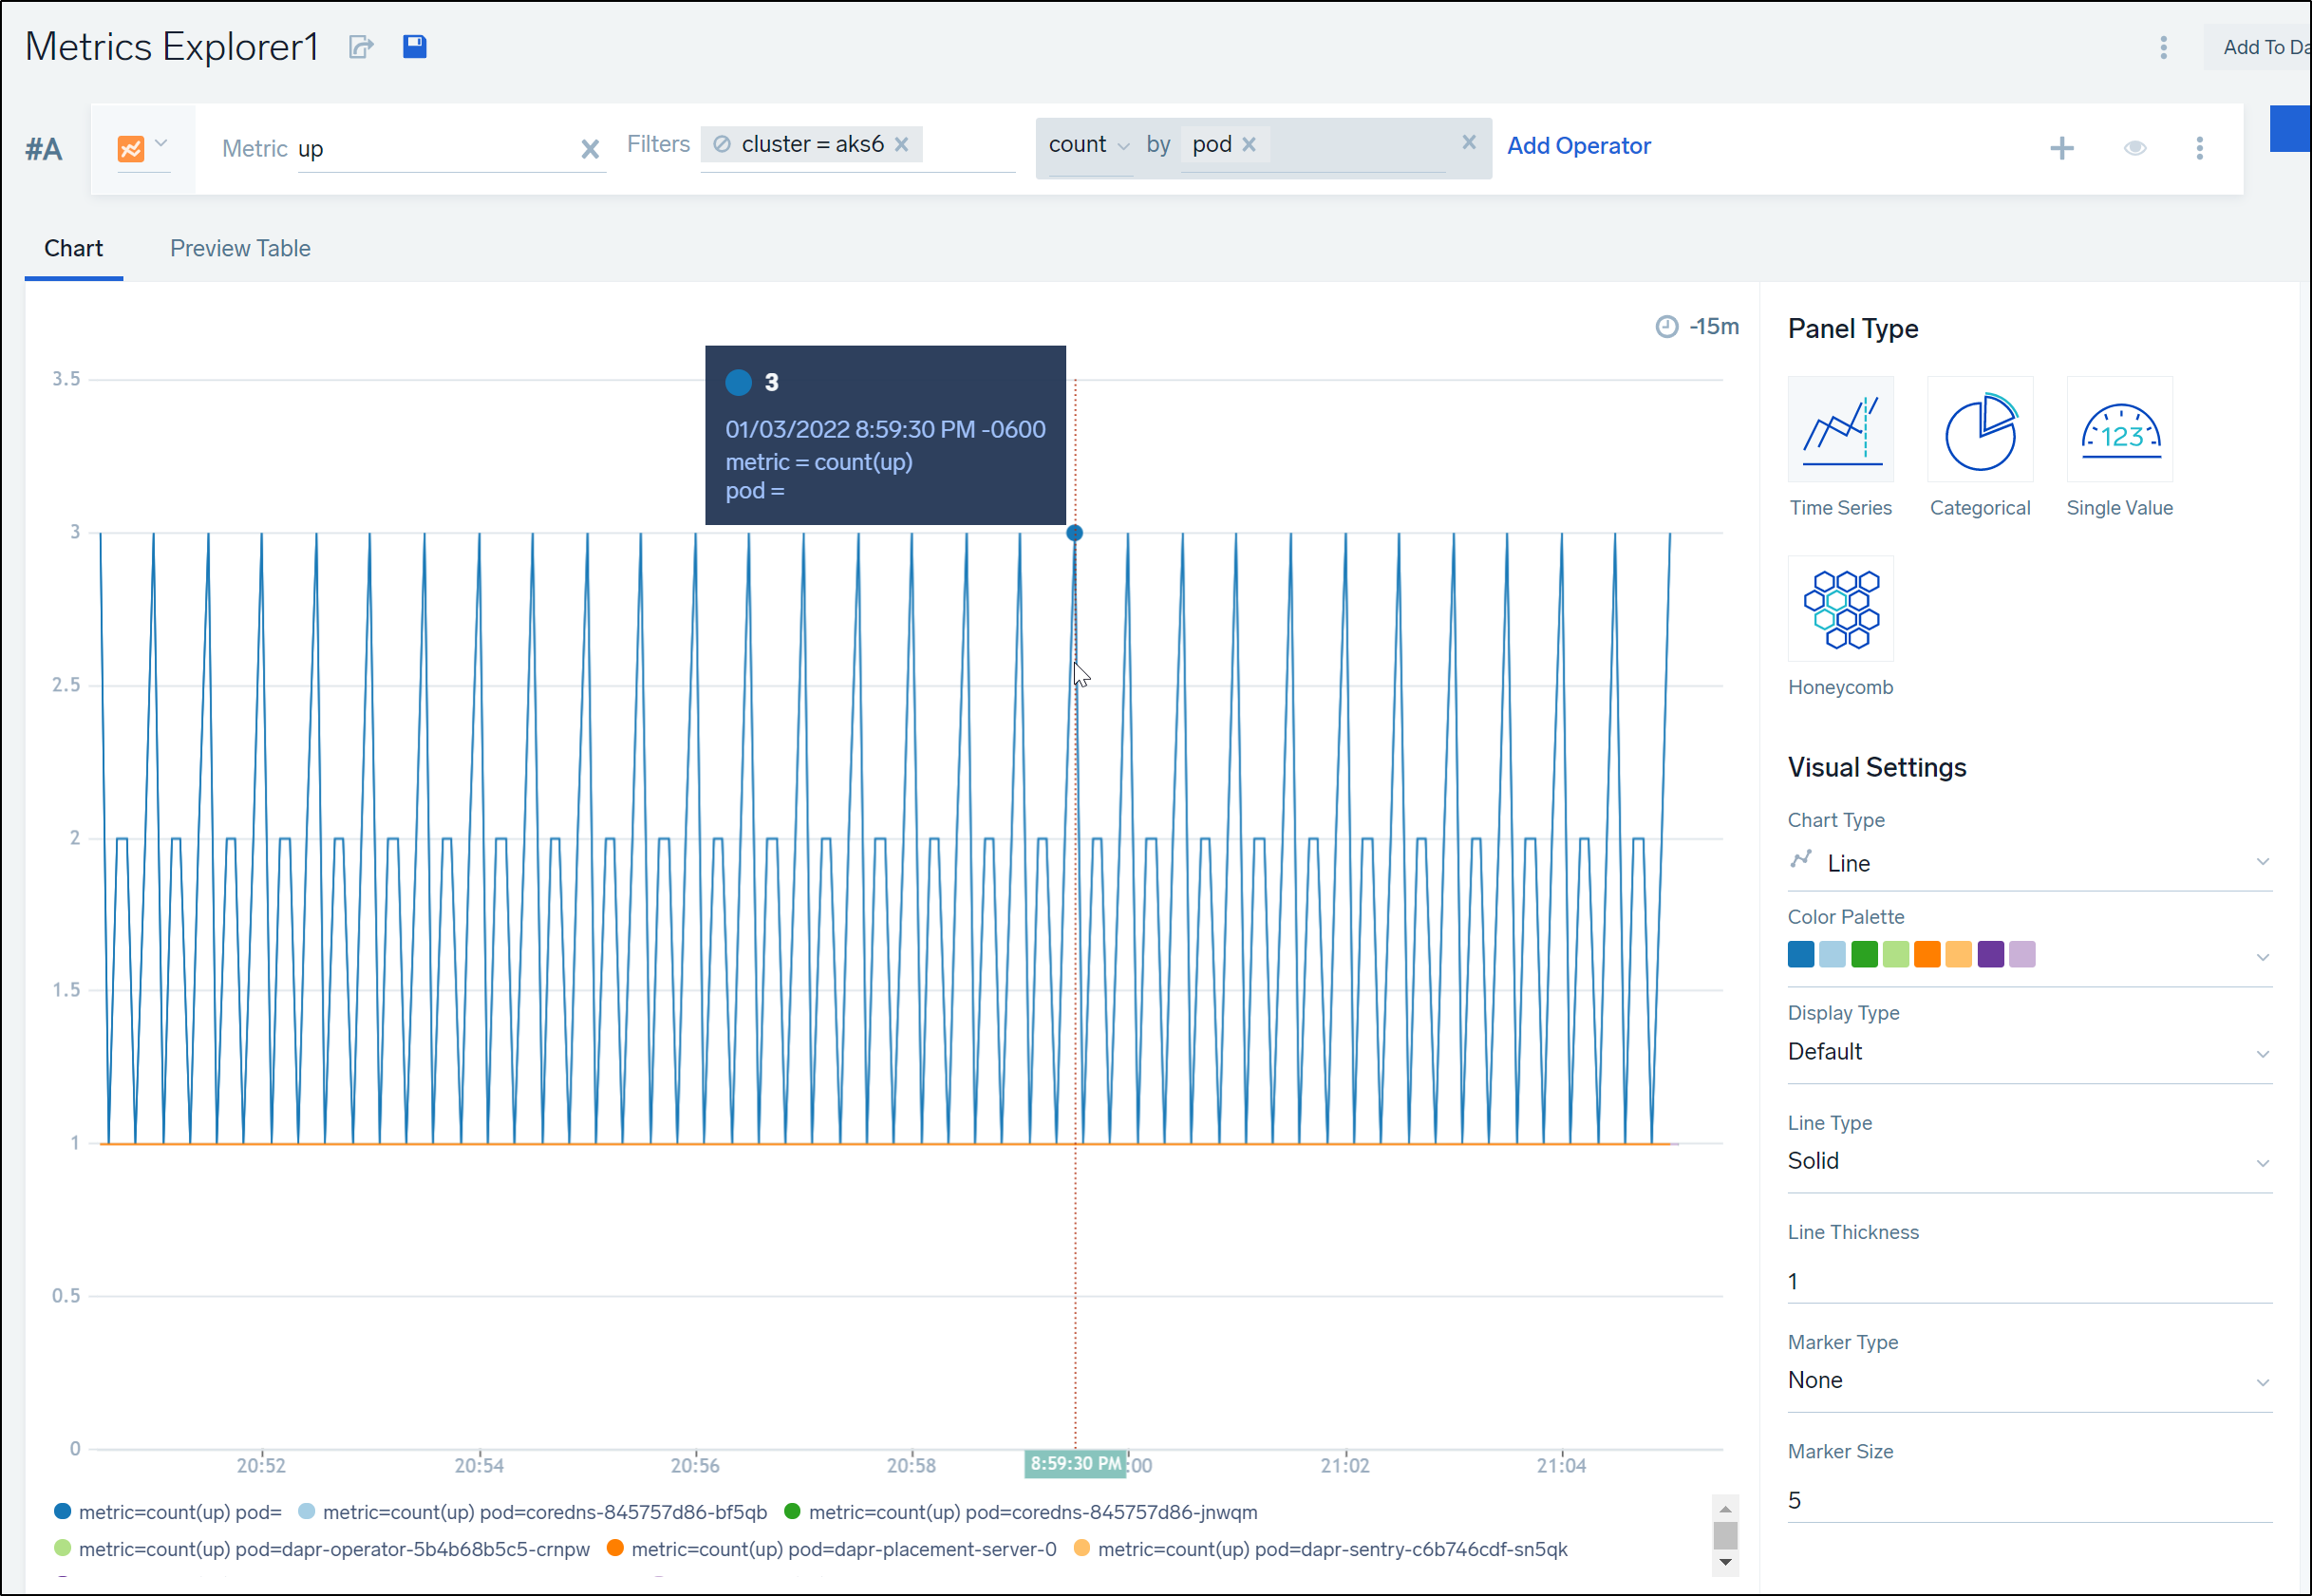
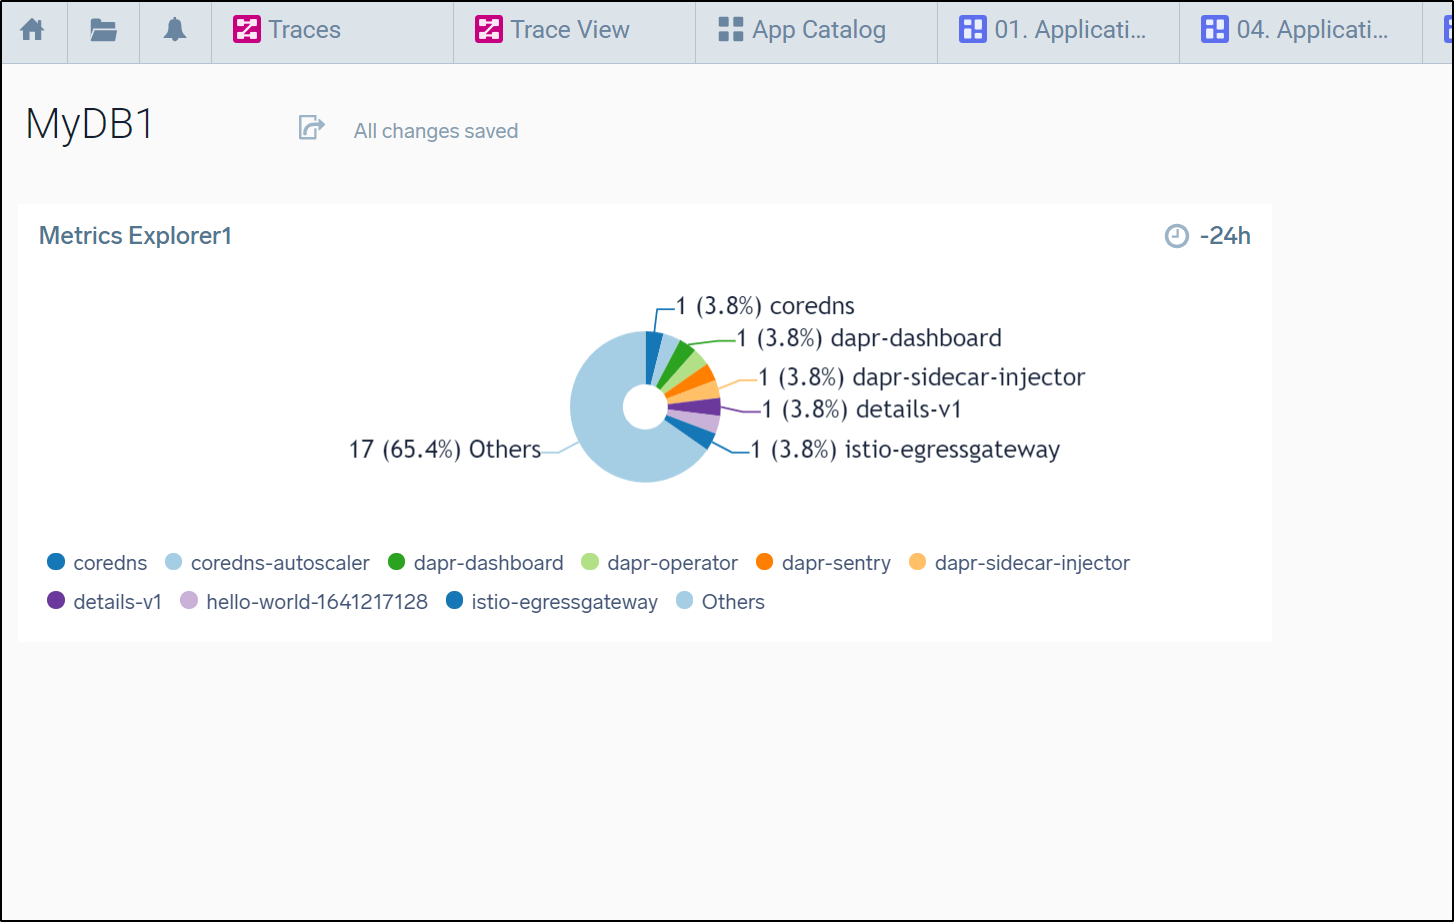
Metrics
Now that we’ve taken some time to look at Traces, let’s pivot for a bit and examine Metrics. We can look at Metrics we collect, such as pods up in a cluster, using the Metrics explorer.
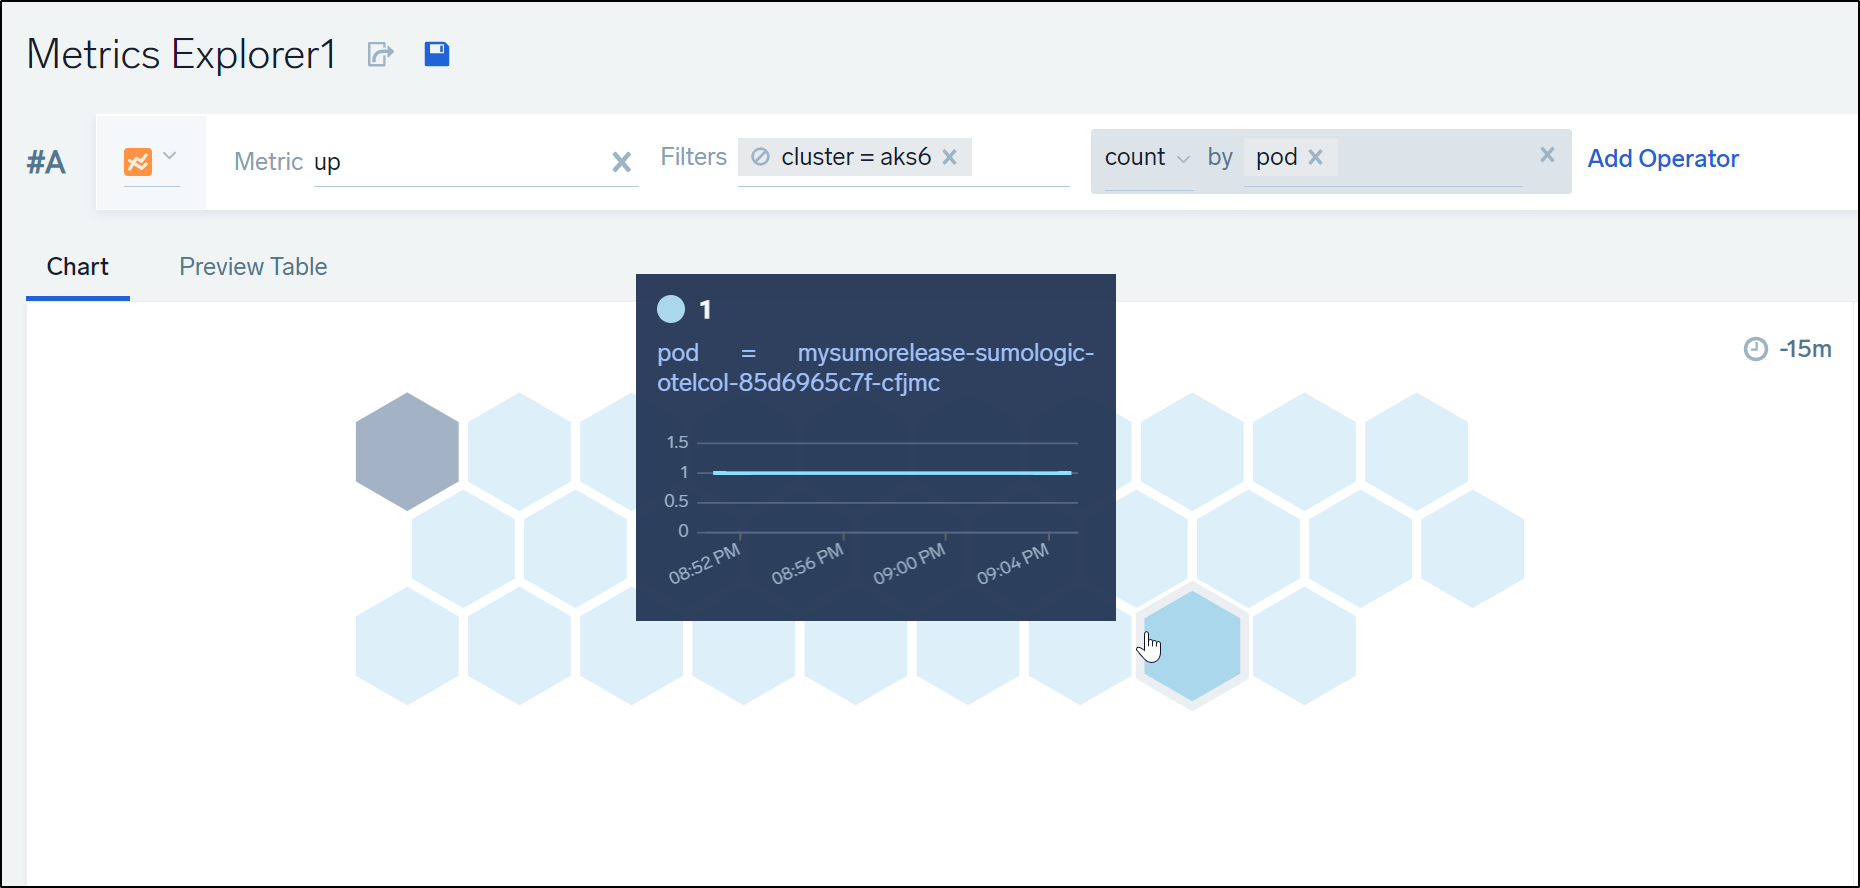
We can view data with a variety of graphs. Here we see the same data as above but this time in a Honeycomb graph
Any collected metric is available to us. Another interesting breakdown might be the deployments in a cluster broken down by replicas available.
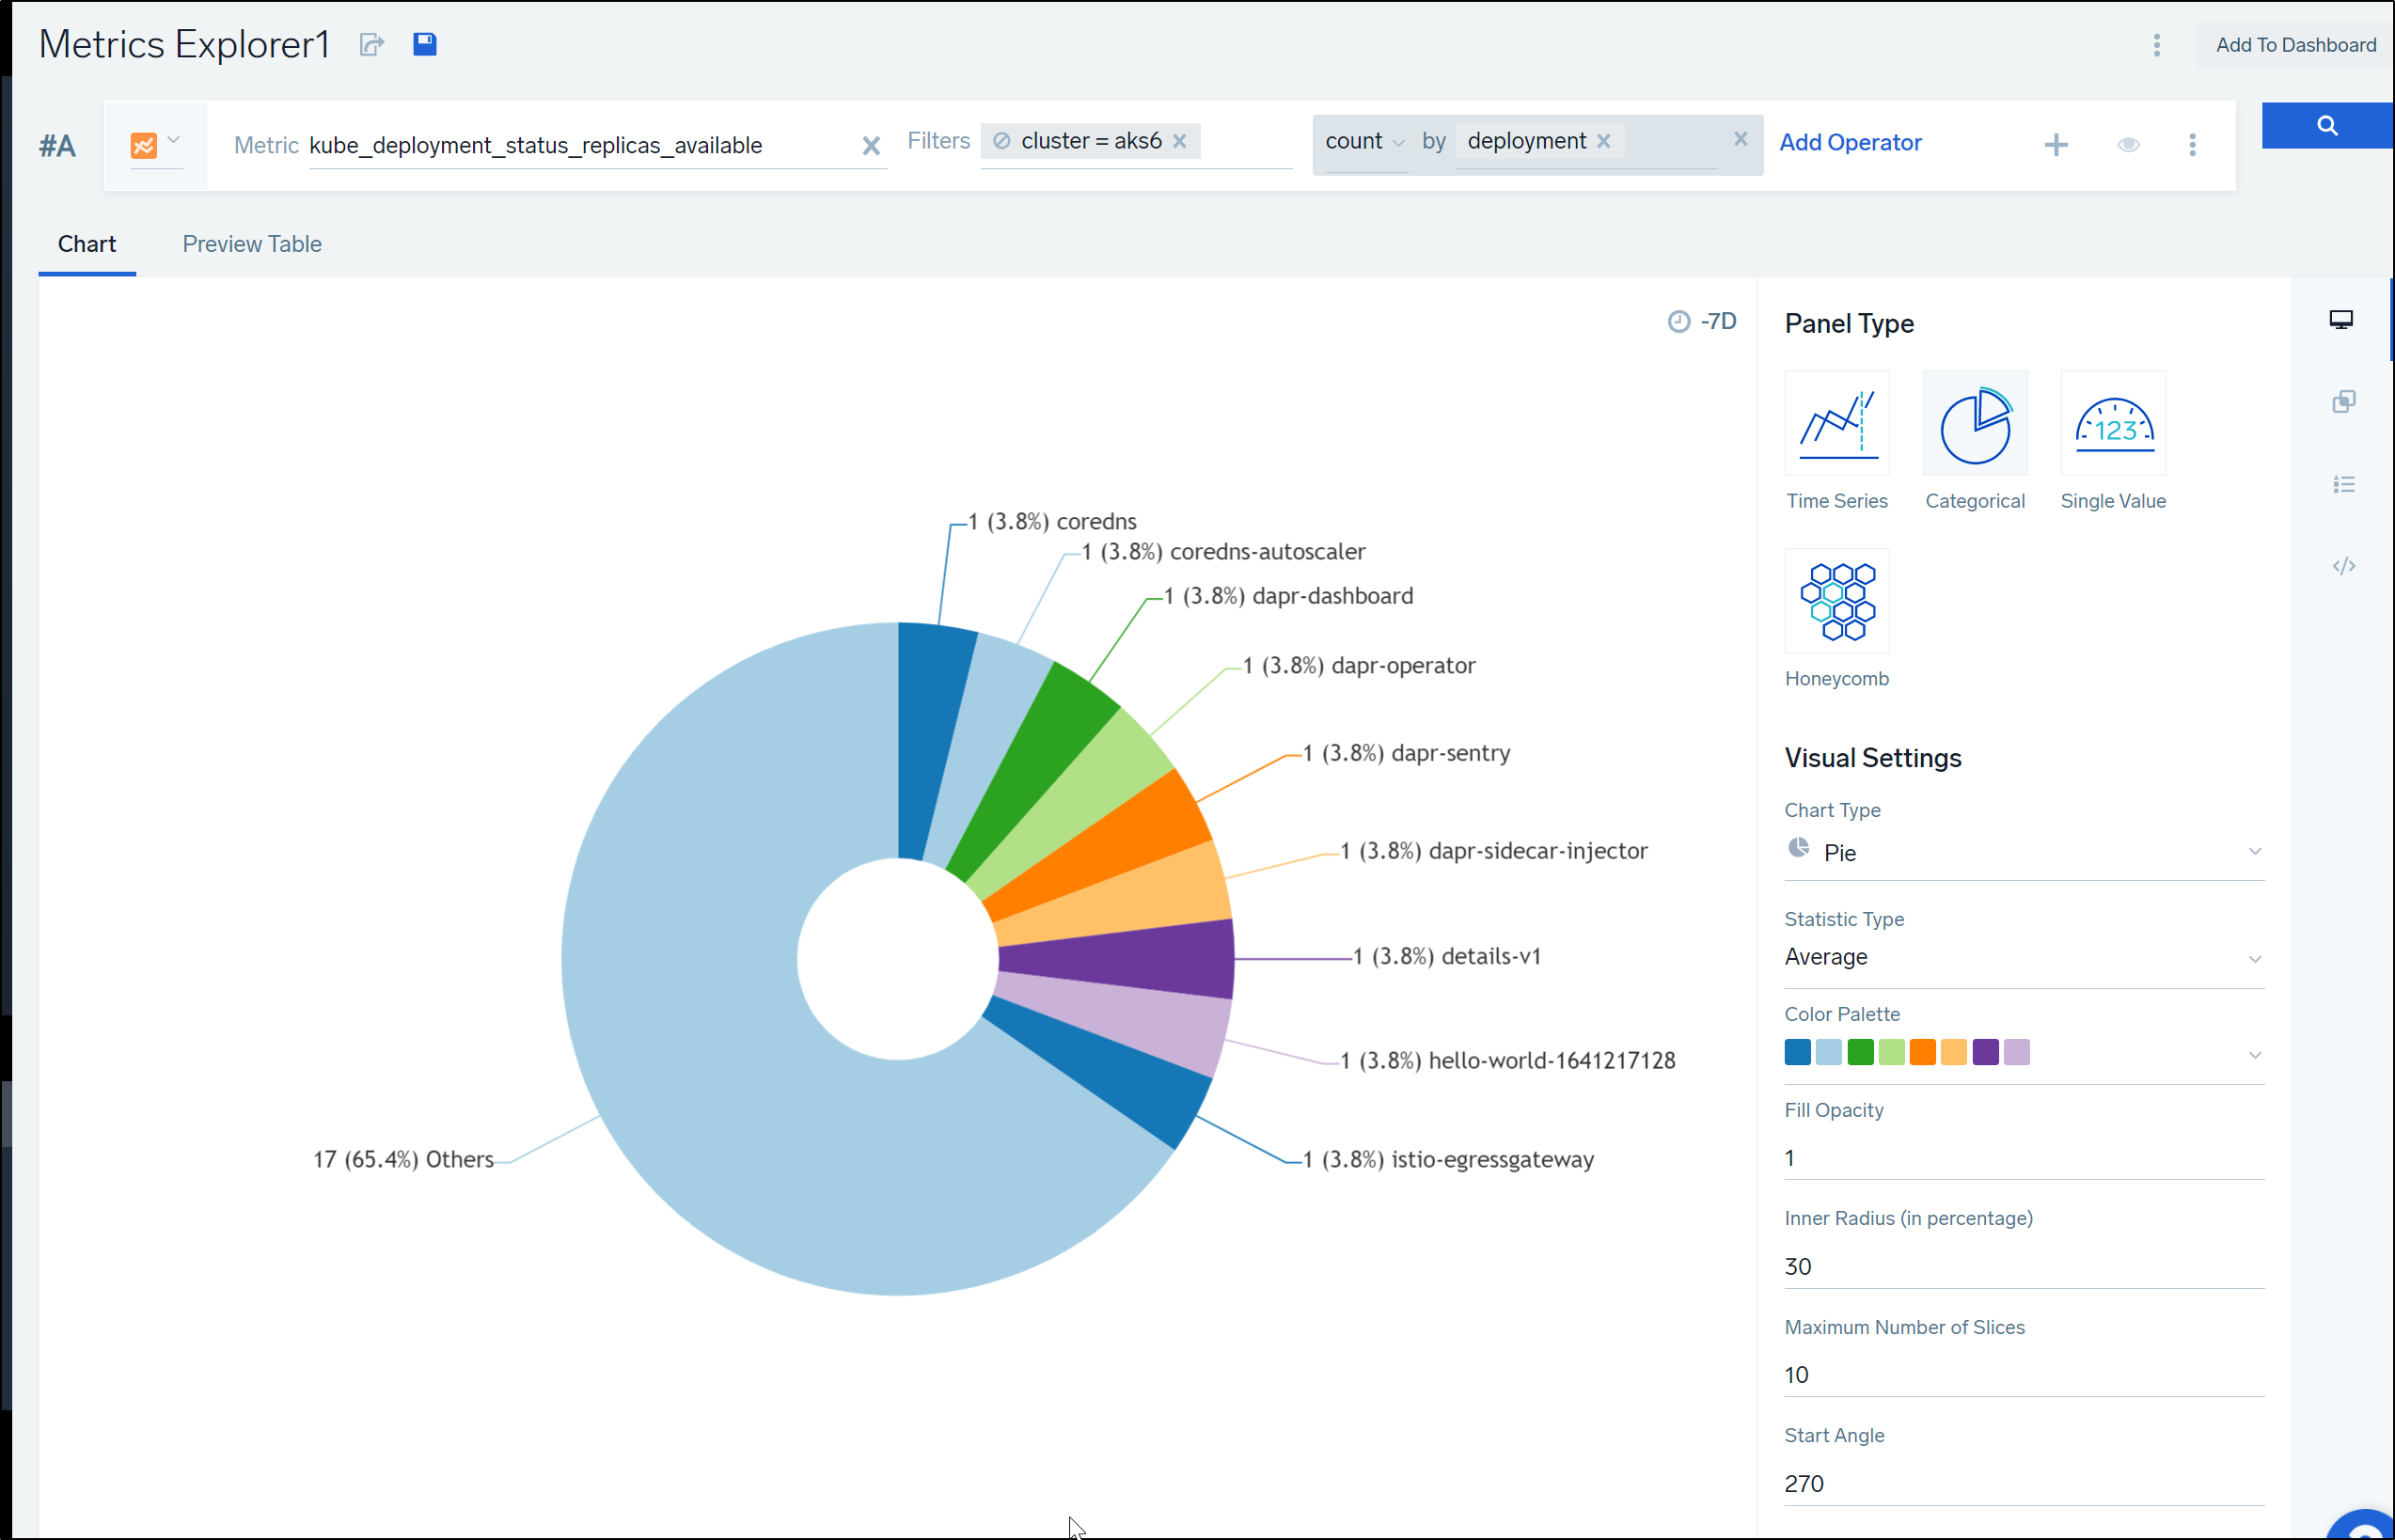
Any Metric can then be published to a new or existing dashboard (typing in a new name in the “Dashboard” menu prompts to create it).
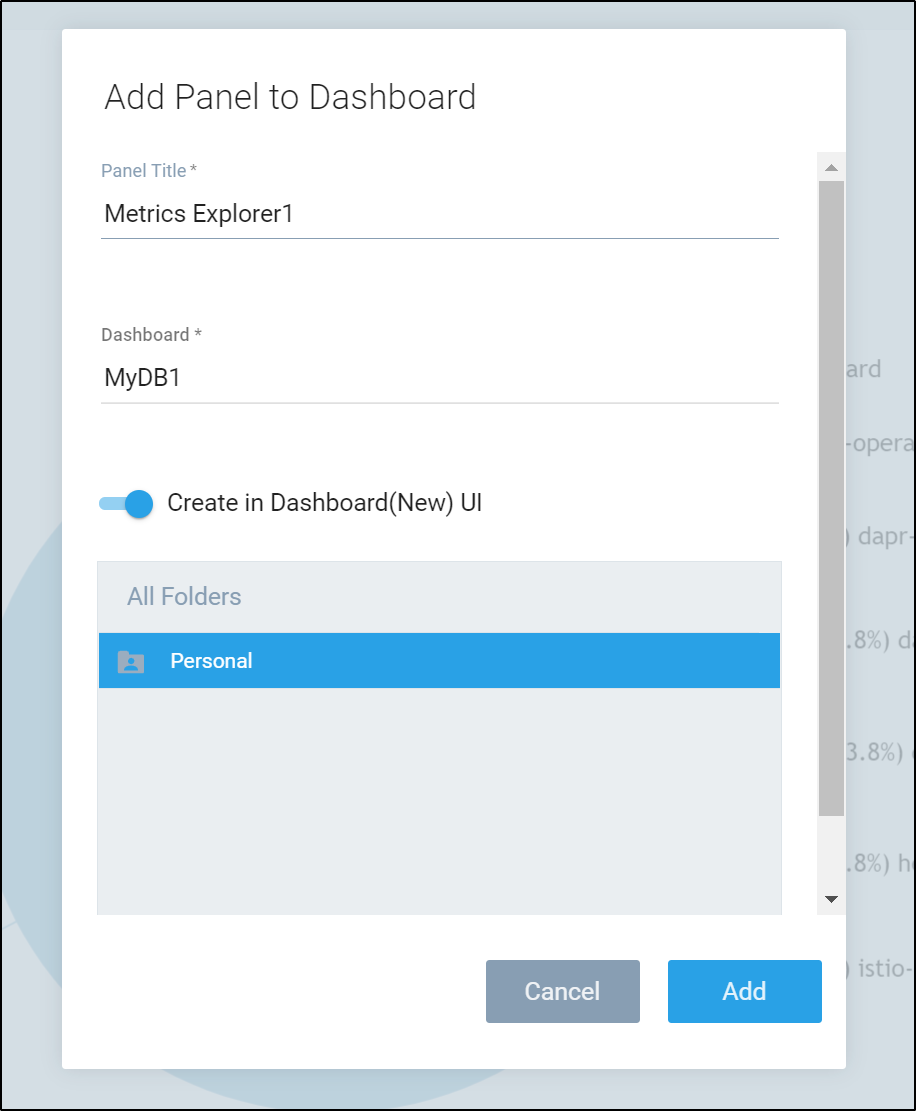
We can now see that Metrics graph has been added to a new “MyDB1” dashboard:
Azure Function
One topic we want to cover is how we can monitor serverless functions such as Azure Functions and AWS Lambdas. Let’s use Azure Functions to show how this can work:
First, we need .NET SDK on our WSL
$ wget https://packages.microsoft.com/config/debian/11/packages-microsoft-prod.deb -O packages-microsoft-prod.deb
...
2022-01-07 06:33:04 (1.24 GB/s) - ‘packages-microsoft-prod.deb’ saved [3134/3134]

$ sudo dpkg -i packages-microsoft-prod.deb && rm packages-microsoft-prod.deb
...
ian11.1) ...
Installing new version of config file /etc/apt/sources.list.d/microsoft-prod.list ...
Install SDK
$ sudo apt-get update

$ sudo apt-get install -y apt-transport-https && sudo apt-get update && sudo apt-get install -y dotnet-sdk-6.0
Reading package lists... Done
Building dependency tree
Reading state information... Done
apt-transport-https is already the newest version (2.0.6).
...

Please visit http://aka.ms/dotnet-cli-eula for more information.
Welcome to .NET!
---------------------
Learn more about .NET: https://aka.ms/dotnet-docs
Use 'dotnet --help' to see available commands or visit: https://aka.ms/dotnet-cli-docs

Telemetry
---------
The .NET tools collect usage data in order to help us improve your experience. It is collected by Microsoft and shared with the community. You can opt-out of telemetry by setting the DOTNET_CLI_TELEMETRY_OPTOUT environment variable to '1' or 'true' using your favorite shell.

Read more about .NET CLI Tools telemetry: https://aka.ms/dotnet-cli-telemetry

Configuring...
--------------
A command is running to populate your local package cache to improve restore speed and enable offline access. This command takes up to one minute to complete and only runs once.
Next, we can install the ASP.NET Core runtime
sudo apt-get update; \
  sudo apt-get install -y apt-transport-https && \
  sudo apt-get update && \
  sudo apt-get install -y aspnetcore-runtime-6.0
We need the Azure Functions Core Tools to build and deploy Azure Functions
$ curl https://packages.microsoft.com/keys/microsoft.asc | gpg --dearmor > microsoft.gpg

$ sudo mv microsoft.gpg /etc/apt/trusted.gpg.d/microsoft.gpg
Add the Apt sources:
$ sudo sh -c 'echo "deb [arch=amd64] https://packages.microsoft.com/repos/microsoft-ubuntu-$(lsb_release -cs)-prod $(lsb_release -cs) main" > /etc/apt/sources.list.d/dotnetdev.list'
Then install the Azure Functions Core:
$ sudo apt-get update && sudo apt-get install -y azure-functions-core-tools-4
Hit:1 https://apt.releases.hashicorp.com focal InRelease
Hit:2 http://security.ubuntu.com/ubuntu focal-security InRelease
Hit:3 http://archive.ubuntu.com/ubuntu focal InRelease
Hit:4 https://packages.microsoft.com/repos/azure-cli focal InRelease
Hit:5 https://packages.cloud.google.com/apt cloud-sdk InRelease
Hit:6 https://packages.microsoft.com/repos/microsoft-ubuntu-focal-prod focal InRelease
Hit:7 http://archive.ubuntu.com/ubuntu focal-updates InRelease
Hit:8 https://packages.microsoft.com/debian/11/prod bullseye InRelease
Hit:9 http://archive.ubuntu.com/ubuntu focal-backports InRelease
Reading package lists... Done
Reading package lists... Done
Building dependency tree
Reading state information... Done
The following packages were automatically installed and are no longer required:
  liblttng-ust-ctl4 liblttng-ust0
Use 'sudo apt autoremove' to remove them.
The following NEW packages will be installed:
  azure-functions-core-tools-4
0 upgraded, 1 newly installed, 0 to remove and 18 not upgraded.
Need to get 135 MB of archives.
After this operation, 0 B of additional disk space will be used.
Get:1 https://packages.microsoft.com/repos/microsoft-ubuntu-focal-prod focal/main amd64 azure-functions-core-tools-4 amd64 4.0.3971-1 [135 MB]
Fetched 135 MB in 5s (26.1 MB/s)
Selecting previously unselected package azure-functions-core-tools-4.
(Reading database ... 220498 files and directories currently installed.)
Preparing to unpack .../azure-functions-core-tools-4_4.0.3971-1_amd64.deb ...
Unpacking azure-functions-core-tools-4 (4.0.3971-1) ...
dpkg: error processing archive /var/cache/apt/archives/azure-functions-core-tools-4_4.0.3971-1_amd64.deb (--unpack):
 trying to overwrite '/usr/bin/func', which is also in package azure-functions-core-tools-3 3.0.3904-1
Errors were encountered while processing:
 /var/cache/apt/archives/azure-functions-core-tools-4_4.0.3971-1_amd64.deb
E: Sub-process /usr/bin/dpkg returned an error code (1)
As you see I got an error code:
Unpacking azure-functions-core-tools-4 (4.0.3971-1) ...
dpkg: error processing archive /var/cache/apt/archives/azure-functions-core-tools-4_4.0.3971-1_amd64.deb (--unpack):
 trying to overwrite '/usr/bin/func', which is also in package azure-functions-core-tools-3 3.0.3904-1
It could be Node installed a prior version blocking Apt, as noted in the docs we can use NPM to upgrade our tools.
Here is how I upgraded from 3 to 4 using NPM:
$ nvm list
->     v10.22.1
       v14.18.1
default -> 10.22.1 (-> v10.22.1)
iojs -> N/A (default)
unstable -> N/A (default)
node -> stable (-> v14.18.1) (default)
stable -> 14.18 (-> v14.18.1) (default)
lts/* -> lts/gallium (-> N/A)
lts/argon -> v4.9.1 (-> N/A)
lts/boron -> v6.17.1 (-> N/A)
lts/carbon -> v8.17.0 (-> N/A)
lts/dubnium -> v10.24.1 (-> N/A)
lts/erbium -> v12.22.7 (-> N/A)
lts/fermium -> v14.18.1
lts/gallium -> v16.13.0 (-> N/A)


$ npm install -g azure-functions-core-tools@4 --unsafe-perm true
/home/builder/.nvm/versions/node/v10.22.1/bin/func -> /home/builder/.nvm/versions/node/v10.22.1/lib/node_modules/azure-functions-core-tools/lib/main.js
/home/builder/.nvm/versions/node/v10.22.1/bin/azfun -> /home/builder/.nvm/versions/node/v10.22.1/lib/node_modules/azure-functions-core-tools/lib/main.js
/home/builder/.nvm/versions/node/v10.22.1/bin/azurefunctions -> /home/builder/.nvm/versions/node/v10.22.1/lib/node_modules/azure-functions-core-tools/lib/main.js

> azure-functions-core-tools@4.0.3971 postinstall /home/builder/.nvm/versions/node/v10.22.1/lib/node_modules/azure-functions-core-tools
> node lib/install.js

attempting to GET "https://functionscdn.azureedge.net/public/4.0.3971/Azure.Functions.Cli.linux-x64.4.0.3971.zip"
[==================] Downloading Azure Functions Core Tools

Telemetry
---------
The Azure Functions Core tools collect usage data in order to help us improve your experience.
The data is anonymous and doesn't include any user specific or personal information. The data is collected by Microsoft.

You can opt-out of telemetry by setting the FUNCTIONS_CORE_TOOLS_TELEMETRY_OPTOUT environment variable to '1' or 'true' using your favorite shell.

+ azure-functions-core-tools@4.0.3971
added 51 packages from 31 contributors in 8.691s
Lastly, we need the Azure CLI for which you can find steps here
verification:
$ az version
{
  "azure-cli": "2.31.0",
  "azure-cli-core": "2.31.0",
  "azure-cli-telemetry": "1.0.6",
  "extensions": {
    "storage-preview": "0.7.4"
  }
}
Now that we’ve sorted our pre-requisites, let’s create a quick HTTP Trigger Function:
~/Workspaces/dotnetfunc$ func init mySumoTestFunc --dotnet

Writing /home/builder/Workspaces/dotnetfunc/mySumoTestFunc/.vscode/extensions.json

~/Workspaces/dotnetfunc$ cd mySumoTestFunc/

~/Workspaces/dotnetfunc/mySumoTestFunc$ func new --name HttpExample --template "HTTP trigger" --authlevel "anonymous"
Select a number for template:Function name: HttpExample

The function "HttpExample" was created successfully from the "HTTP trigger" template.
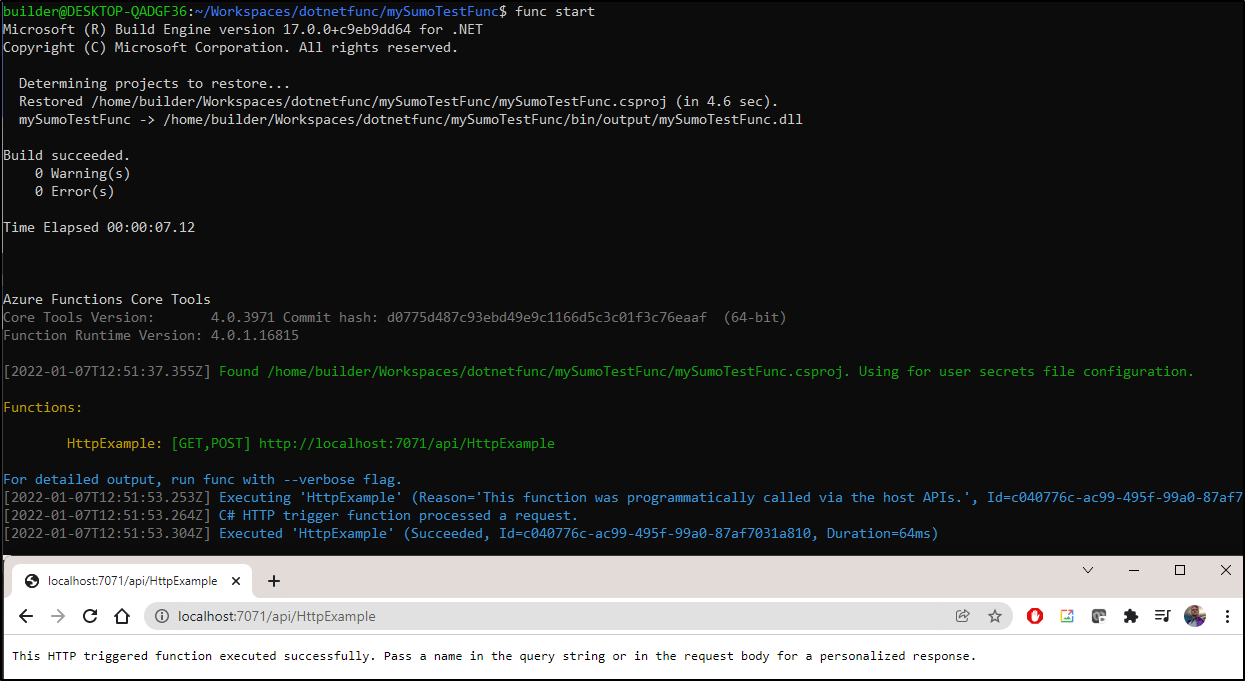
Once created, we can test locally:
$ func start
Microsoft (R) Build Engine version 17.0.0+c9eb9dd64 for .NET
Copyright (C) Microsoft Corporation. All rights reserved.

  Determining projects to restore...
  Restored /home/builder/Workspaces/dotnetfunc/mySumoTestFunc/mySumoTestFunc.csproj (in 4.6 sec).
  mySumoTestFunc -> /home/builder/Workspaces/dotnetfunc/mySumoTestFunc/bin/output/mySumoTestFunc.dll

Build succeeded.
    0 Warning(s)
    0 Error(s)

Time Elapsed 00:00:07.12


Azure Functions Core Tools
Core Tools Version:       4.0.3971 Commit hash: d0775d487c93ebd49e9c1166d5c3c01f3c76eaaf  (64-bit)
Function Runtime Version: 4.0.1.16815

[2022-01-07T12:51:37.355Z] Found /home/builder/Workspaces/dotnetfunc/mySumoTestFunc/mySumoTestFunc.csproj. Using for user secrets file configuration.

Functions:

        HttpExample: [GET,POST] http://localhost:7071/api/HttpExample

For detailed output, run func with --verbose flag.
[2022-01-07T12:51:53.253Z] Executing 'HttpExample' (Reason='This function was programmatically called via the host APIs.', Id=c040776c-ac99-495f-99a0-87af7031a810)
[2022-01-07T12:51:53.264Z] C# HTTP trigger function processed a request.
[2022-01-07T12:51:53.304Z] Executed 'HttpExample' (Succeeded, Id=c040776c-ac99-495f-99a0-87af7031a810, Duration=64ms)
http://localhost:7071/api/HttpExample
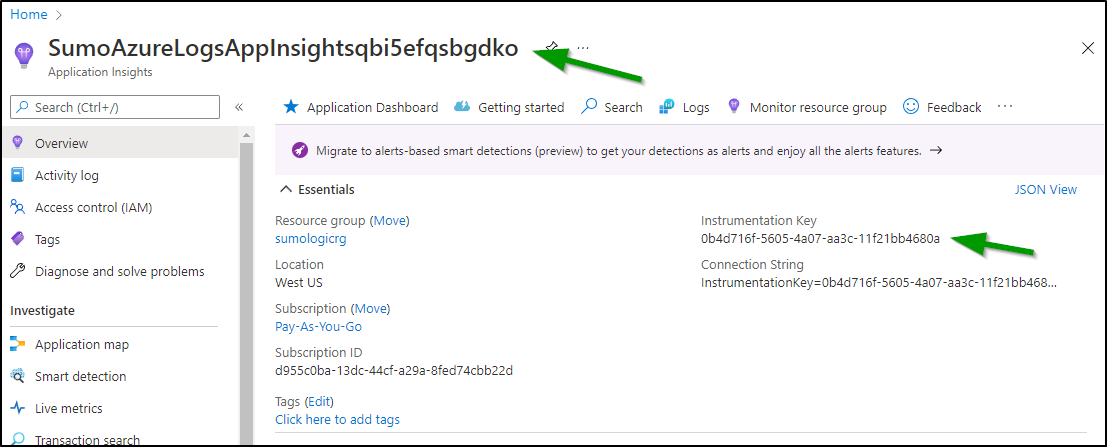
Before we deploy the function, we want to get the app insights name and key to use in the function create step. One easy way is to just get it from the Azure Portal:
Now we set up our Azure resources. Because we need the App Insights to be in the same RG as the function, we’ll set up both there. It makes it easier to create the SA in the same resource group (but not required, we would just need to use OID instead of name if it was in a different RG)
$ az account set --subscription Pay-As-You-Go

$ az storage account create -g sumologicrg -n sumologicfnsa2 --location centralus --sku Standard_LRS
{
  "accessTier": "Hot",
  "allowBlobPublicAccess": true,
  "allowCrossTenantReplication": null,
...

$ az functionapp create -g sumologicrg --consumption-plan-location centralus --runtime dotnet --functions-version 4 -n mysumofunction --storage-account su
mologicfnsa2 --app-insights SumoAzureLogsAppInsightsqbi5efqsbgdko --app-insights-key 0b4d716f-5605-4a07-aa3c-11f21bb4680a
--runtime-version is not supported for --runtime dotnet. Dotnet version is determined by --functions-version. Dotnet version will be 6.0 for this function app.

{
  "availabilityState": "Normal",
  "clientAffinityEnabled": false,
  "clientCertEnabled": false,
  "clientCertExclusionPaths": null,
  "clientCertMode": "Required",
  "cloningInfo": null,
  "containerSize": 1536,
  "customDomainVerificationId": "1B4C8E9BFA263939F5437F88623F1C0397DE707EB4D40A3AB2A7B071129D28ED",
  "dailyMemoryTimeQuota": 0,
  "defaultHostName": "mysumofunction.azurewebsites.net",
  "enabled": true,
  "enabledHostNames": [
    "mysumofunction.azurewebsites.net",
    "mysumofunction.scm.azurewebsites.net"
  ],

...

 "tags": null,
  "targetSwapSlot": null,
  "trafficManagerHostNames": null,
  "type": "Microsoft.Web/sites",
  "usageState": "Normal"
}
And testing the URL from the enabledHostNames
https://mysumofunction.azurewebsites.net/
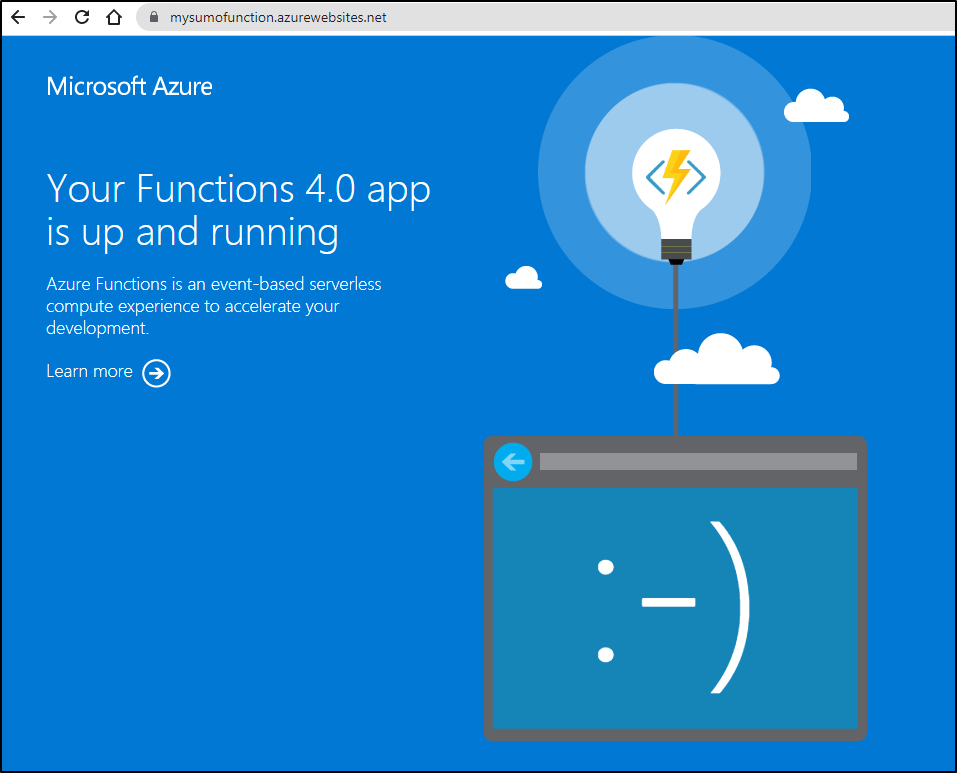
That means the function framework is running, but we still need to build and push the Function itself:
~/Workspaces/dotnetfunc/mySumoTestFunc$ func azure functionapp publish mysumofunction
Microsoft (R) Build Engine version 17.0.0+c9eb9dd64 for .NET
Copyright (C) Microsoft Corporation. All rights reserved.

  Determining projects to restore...
  All projects are up-to-date for restore.
  mySumoTestFunc -> /home/builder/Workspaces/dotnetfunc/mySumoTestFunc/bin/publish/mySumoTestFunc.dll

Build succeeded.
    0 Warning(s)
    0 Error(s)

Time Elapsed 00:00:02.50


Getting site publishing info...
Creating archive for current directory...
Uploading 2.34 MB [###############################################################################]
Upload completed successfully.
Deployment completed successfully.
Syncing triggers...
Functions in mysumofunction:
    HttpExample - [httpTrigger]
        Invoke url: https://mysumofunction.azurewebsites.net/api/httpexample
https://mysumofunction.azurewebsites.net/api/httpexample
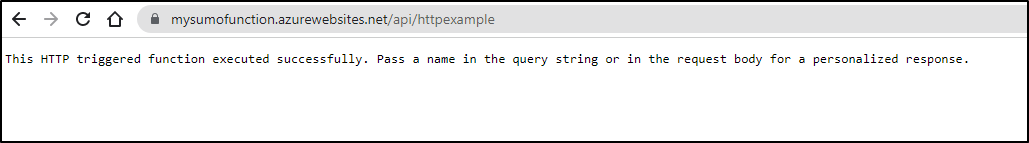
we can hit our endpoint a few times and see results in the Monitoring/Metrics
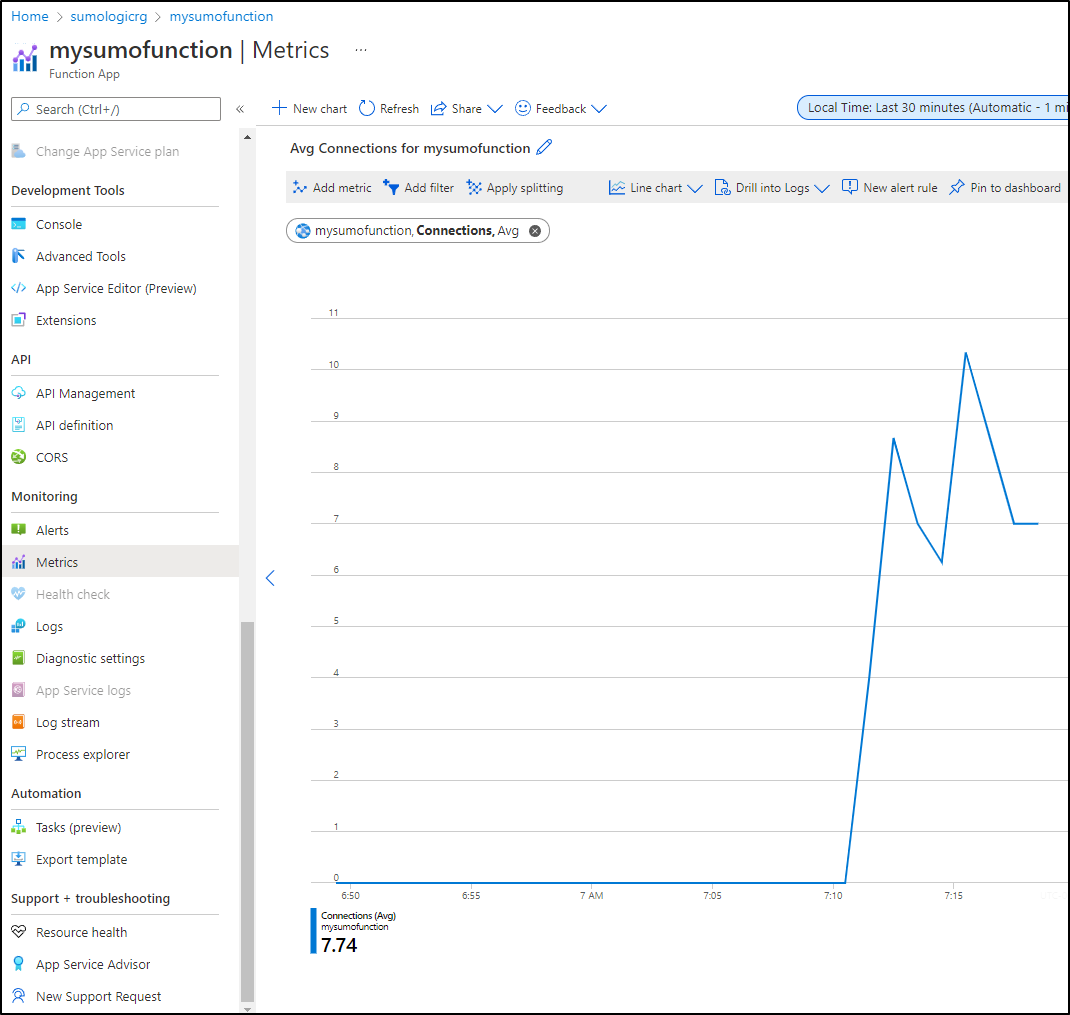
Since I was unable to select an Event Hub cross region, i redid the steps using the same Region and RG as my App Insights and Event Hub instance; westus
$ az storage account create -g sumologicrg -n sumologicfnsa4 --location westus --sku Standard_LRS && az functionapp create -g sumologicrg --consumption-plan-location westus --runtime dotnet --functions-version 4 -n  mysumofunction4 --storage-account sumologicfnsa4 --app-insights SumoAzureLogsAppInsightsqbi5efqsbgdko --app-insights-key 0b4d716f-5605-4a07-aa3c-11f21bb4680a

$ func azure functionapp publish mysumofunction4
Microsoft (R) Build Engine version 17.0.0+c9eb9dd64 for .NET
Copyright (C) Microsoft Corporation. All rights reserved.

  Determining projects to restore...
  All projects are up-to-date for restore.
  mySumoTestFunc -> /home/builder/Workspaces/dotnetfunc/mySumoTestFunc/bin/publish/mySumoTestFunc.dll

Build succeeded.
    0 Warning(s)
    0 Error(s)

Time Elapsed 00:00:01.52


Getting site publishing info...
Creating archive for current directory...
Uploading 2.34 MB [###############################################################################]
Upload completed successfully.
Deployment completed successfully.
Syncing triggers...
Functions in mysumofunction4:
    HttpExample - [httpTrigger]
        Invoke url: https://mysumofunction4.azurewebsites.net/api/httpexample
Now we can select our Event Hub:
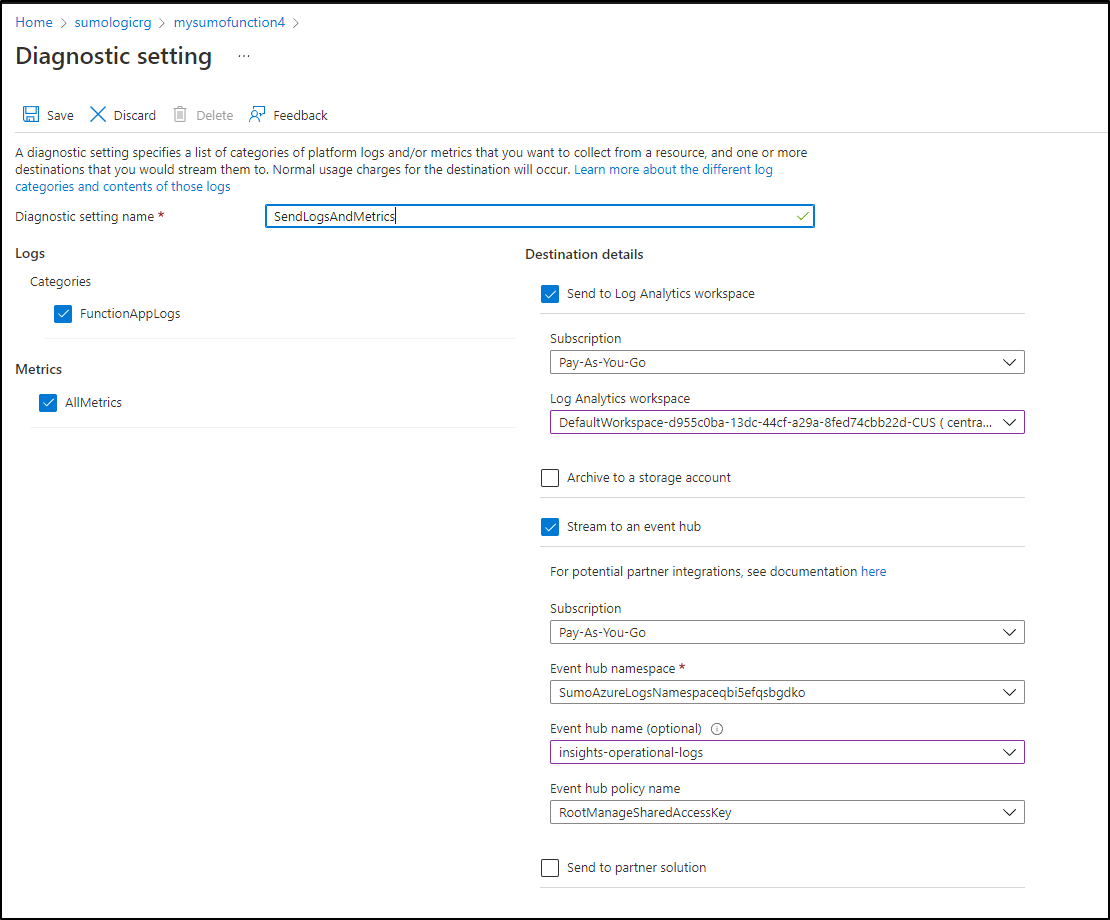
I’ll hit the endpoint a few times
https://mysumofunction4.azurewebsites.net/api/httpexample
And i can see data in my App Insights overview
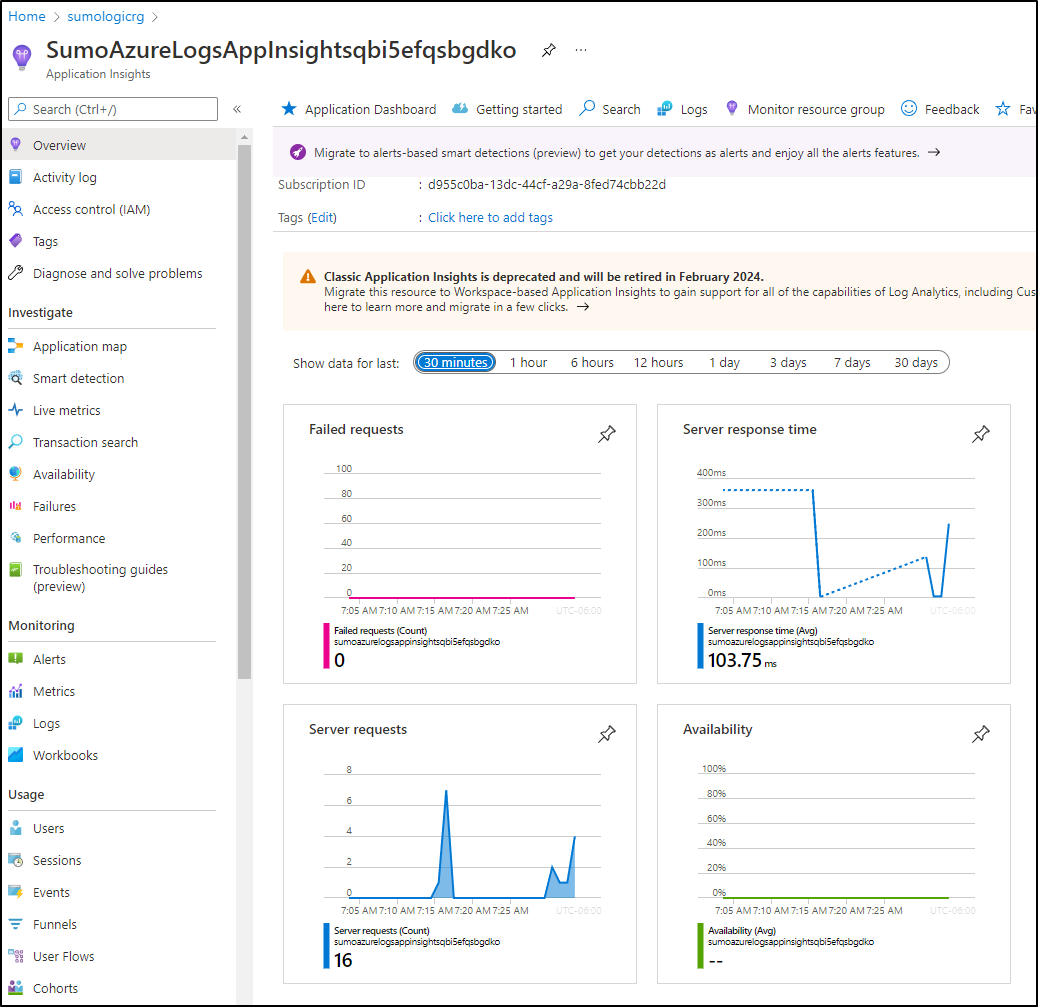
Note: It did take a few minutes for the data to sync and show up in Sumo
Here we see logs as sent from the Function via Azure Event Hub to Sumo Logic
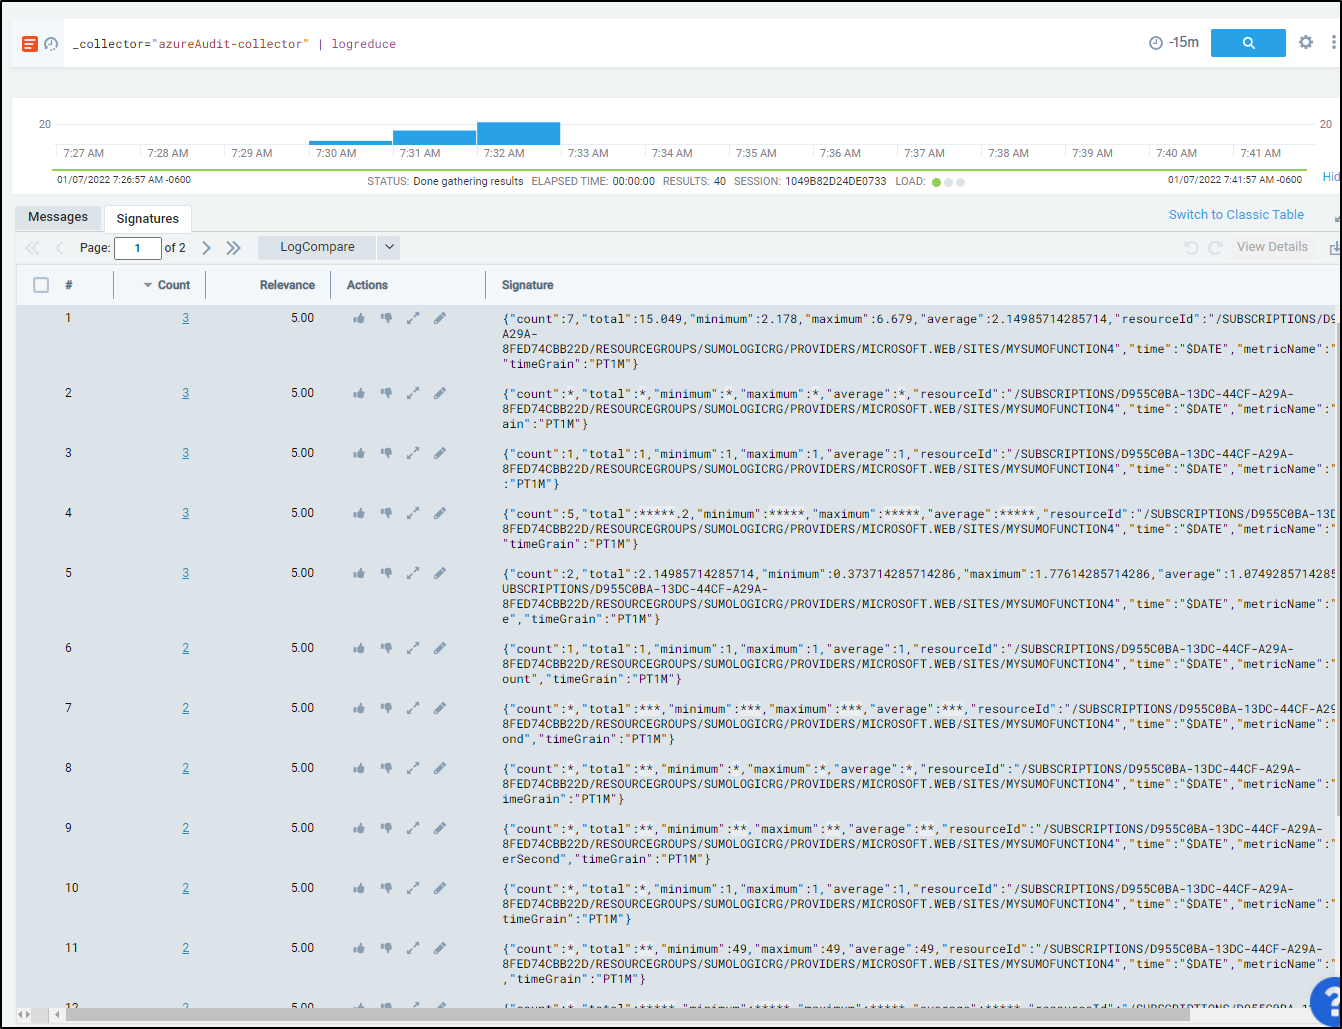
At first, I only see Metrics and Not logs (later I realized under the messages tab, we see them in “properties.messages”):
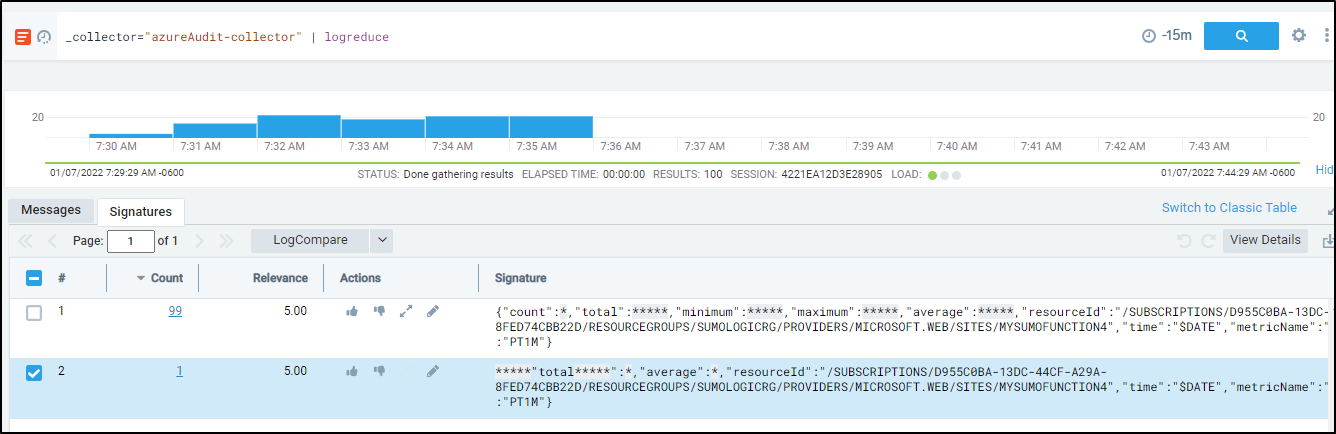
Let’s add an Error log line:
log.LogError("C# HTTP trigger function - not an error.");
In context, HttpExamples.cs
using System;
using System.IO;
using System.Threading.Tasks;
using Microsoft.AspNetCore.Mvc;
using Microsoft.Azure.WebJobs;
using Microsoft.Azure.WebJobs.Extensions.Http;
using Microsoft.AspNetCore.Http;
using Microsoft.Extensions.Logging;
using Newtonsoft.Json;

namespace mySumoTestFunc
{
    public static class HttpExample
    {
        [FunctionName("HttpExample")]
        public static async Task<IActionResult> Run(
            [HttpTrigger(AuthorizationLevel.Anonymous, "get", "post", Route = null)] HttpRequest req,
            ILogger log)
        {
            log.LogInformation("C# HTTP trigger function processed a request.");

            string name = req.Query["name"];

            string requestBody = await new StreamReader(req.Body).ReadToEndAsync();
            dynamic data = JsonConvert.DeserializeObject(requestBody);
            name = name ?? data?.name;

            string responseMessage = string.IsNullOrEmpty(name)
                ? "This HTTP triggered function executed successfully. Pass a name in the query string or in the request body for a personalized response."
                : $"Hello, {name}. This HTTP triggered function executed successfully.";

            log.LogError("C# HTTP trigger function - not an error.");

            return new OkObjectResult(responseMessage);
        }


    }
}
Testing:
$ func start
Microsoft (R) Build Engine version 17.0.0+c9eb9dd64 for .NET
Copyright (C) Microsoft Corporation. All rights reserved.

  Determining projects to restore...
  All projects are up-to-date for restore.
  mySumoTestFunc -> /home/builder/Workspaces/dotnetfunc/mySumoTestFunc/bin/output/mySumoTestFunc.dll

Build succeeded.
    0 Warning(s)
    0 Error(s)

Time Elapsed 00:00:01.84


Azure Functions Core Tools
Core Tools Version:       4.0.3971 Commit hash: d0775d487c93ebd49e9c1166d5c3c01f3c76eaaf  (64-bit)
Function Runtime Version: 4.0.1.16815

[2022-01-07T13:58:13.558Z] Found /home/builder/Workspaces/dotnetfunc/mySumoTestFunc/mySumoTestFunc.csproj. Using for user secrets file configuration.

Functions:

        HttpExample: [GET,POST] http://localhost:7071/api/HttpExample

For detailed output, run func with --verbose flag.
[2022-01-07T13:58:20.707Z] Executing 'HttpExample' (Reason='This function was programmatically called via the host APIs.', Id=474506cc-5136-4f96-8431-52687158c932)
[2022-01-07T13:58:20.718Z] C# HTTP trigger function processed a request.
[2022-01-07T13:58:20.747Z] C# HTTP trigger function - not an error.
[2022-01-07T13:58:20.762Z] Executed 'HttpExample' (Succeeded, Id=474506cc-5136-4f96-8431-52687158c932, Duration=67ms)
Then let’s push and hit the URL a few times
$ func azure functionapp publish mysumofunction4
Microsoft (R) Build Engine version 17.0.0+c9eb9dd64 for .NET
Copyright (C) Microsoft Corporation. All rights reserved.

  Determining projects to restore...
  All projects are up-to-date for restore.
  mySumoTestFunc -> /home/builder/Workspaces/dotnetfunc/mySumoTestFunc/bin/publish/mySumoTestFunc.dll

Build succeeded.
    0 Warning(s)
    0 Error(s)

Time Elapsed 00:00:01.66


Getting site publishing info...
Creating archive for current directory...
Uploading 2.34 MB [###############################################################################]
Upload completed successfully.
Deployment completed successfully.
Syncing triggers...
Functions in mysumofunction4:
    HttpExample - [httpTrigger]
        Invoke url: https://mysumofunction4.azurewebsites.net/api/httpexample
And indeed we can now see the error log line
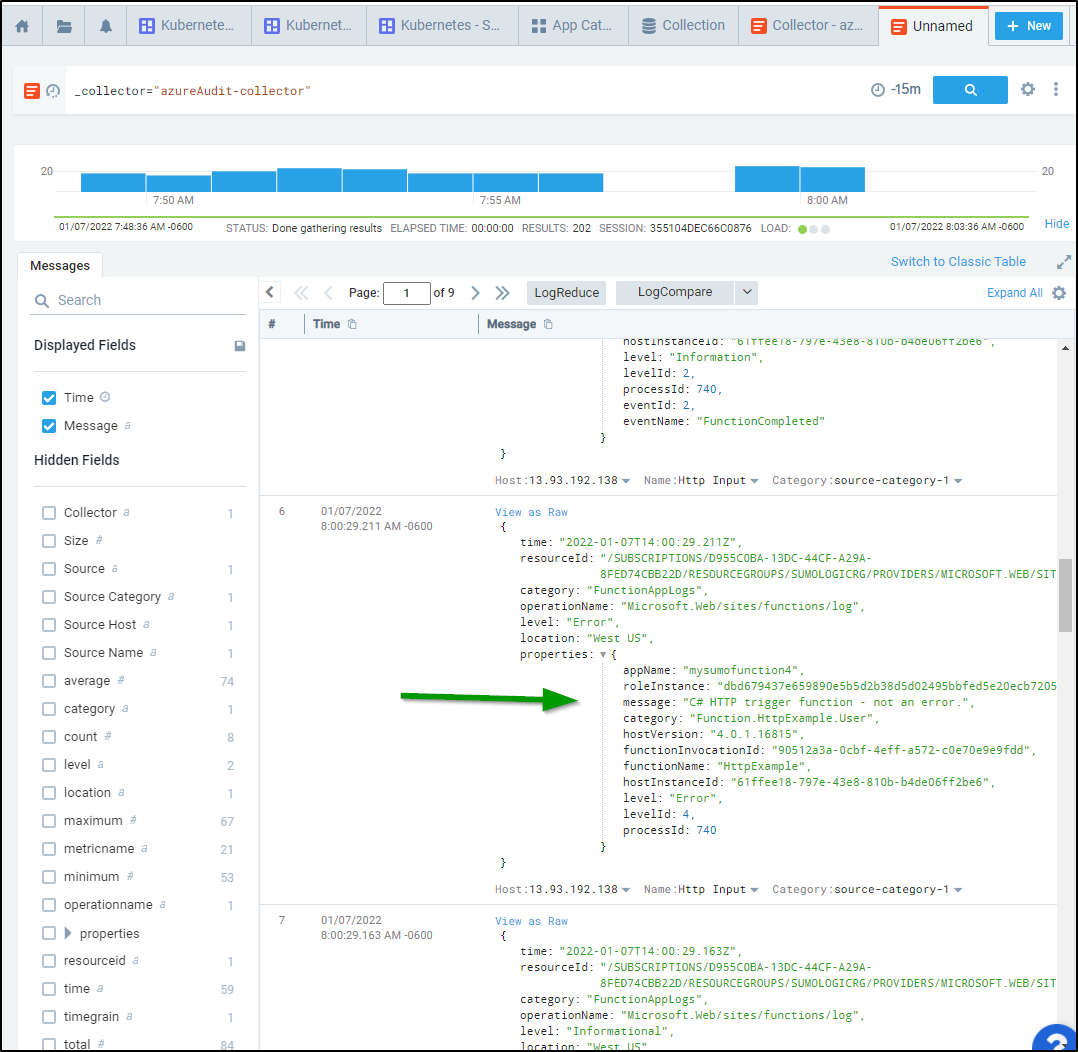
If we wanted, we could use logreduce with the field selector to get the top 10 values..
For instance, in a 3 hour window, here were my most common logs and error messages
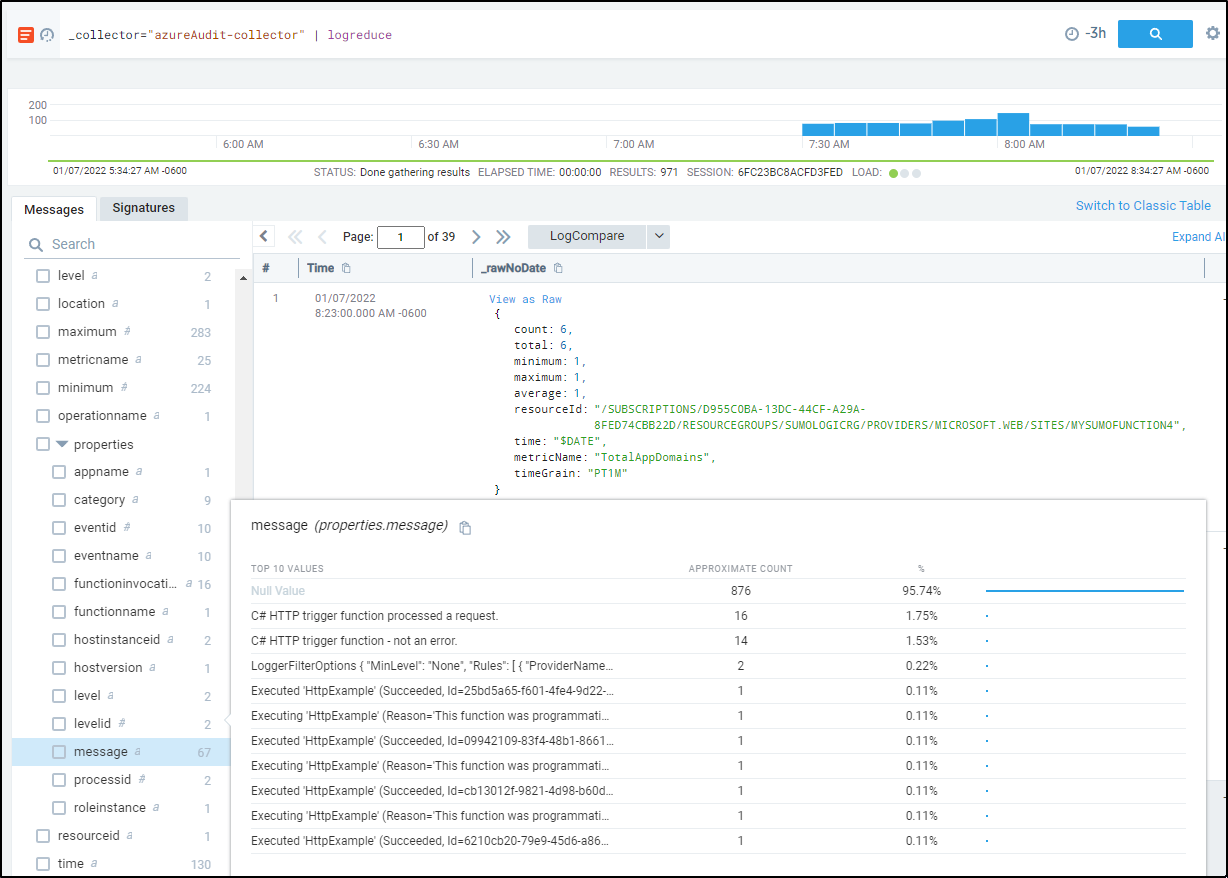
If you click the field, you can get the actual logs:
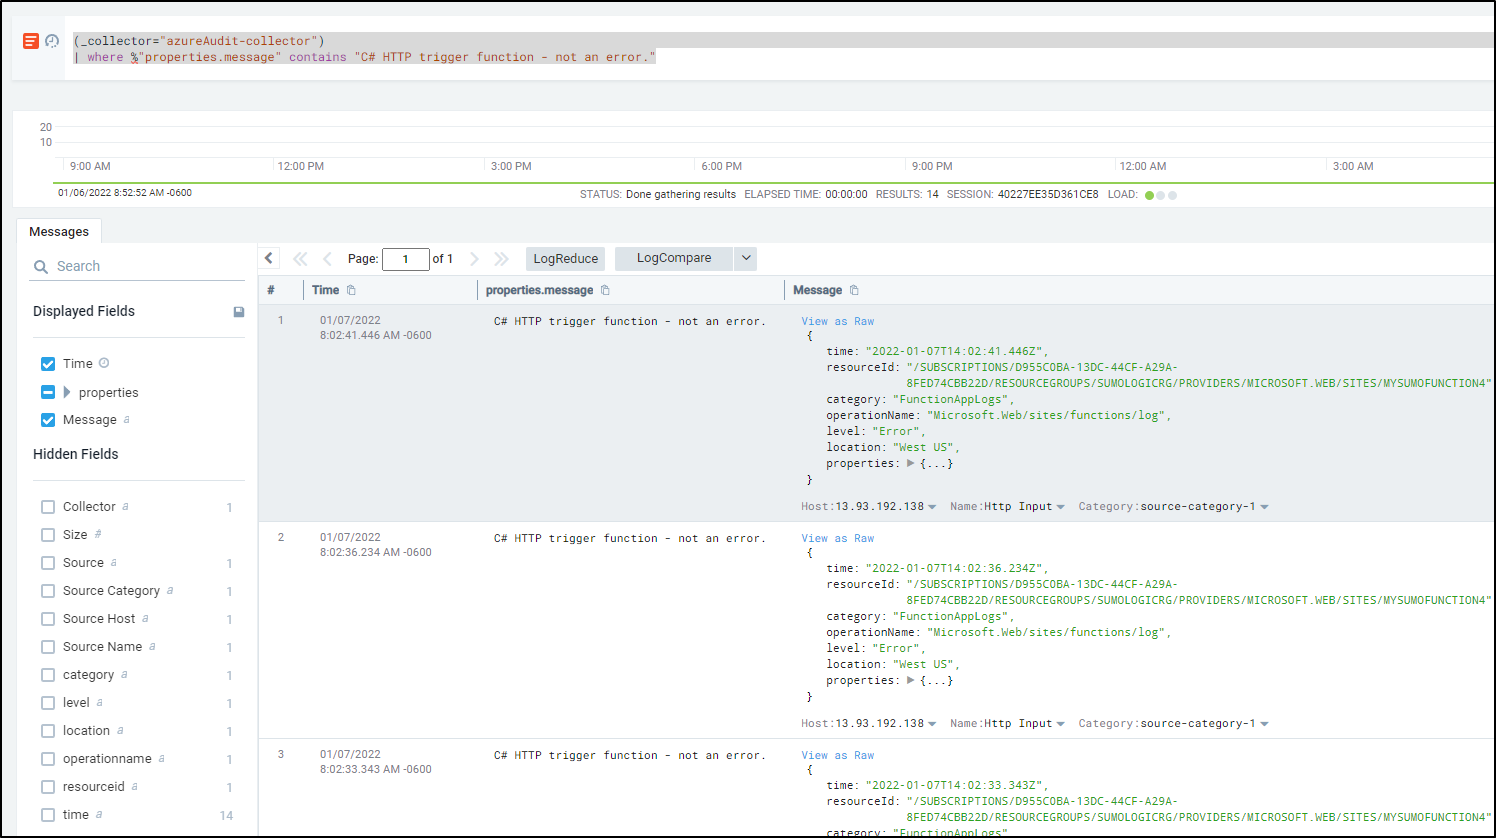
Note: By default it still adds "| logreduce" in the query which will generate an error, just remove that filter and you’ll be fine
At this point we’ve had our fun in Azure.. I’m on track to $15-20 of spend So I’ll likely wrap by removing the Resource Group
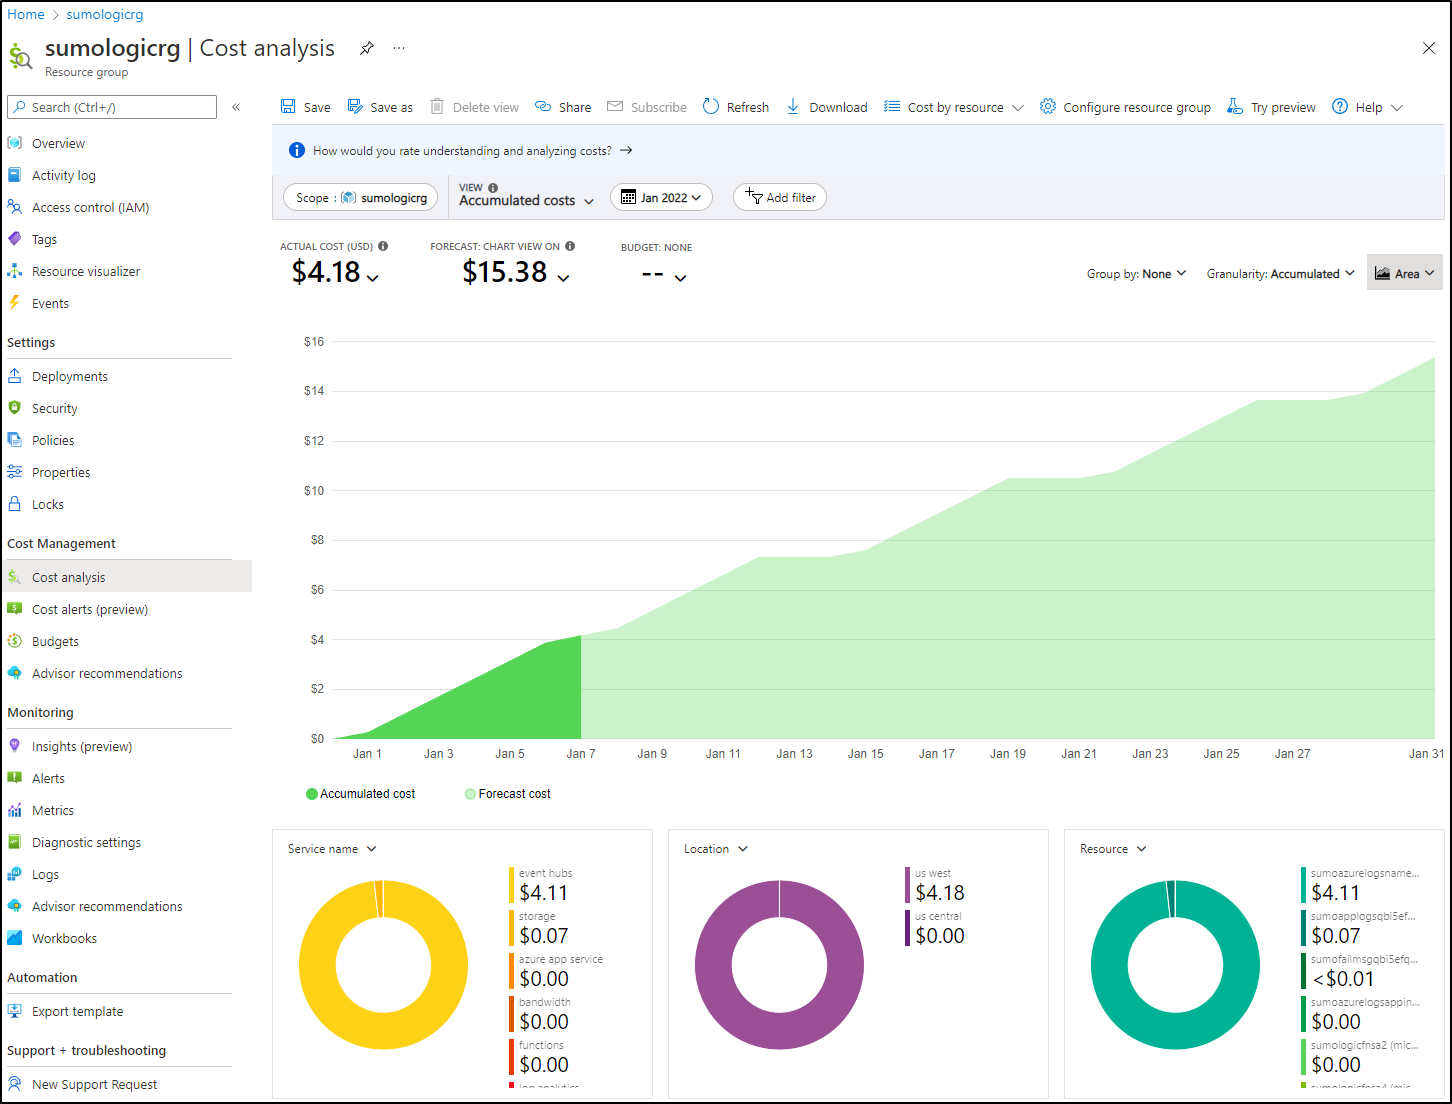
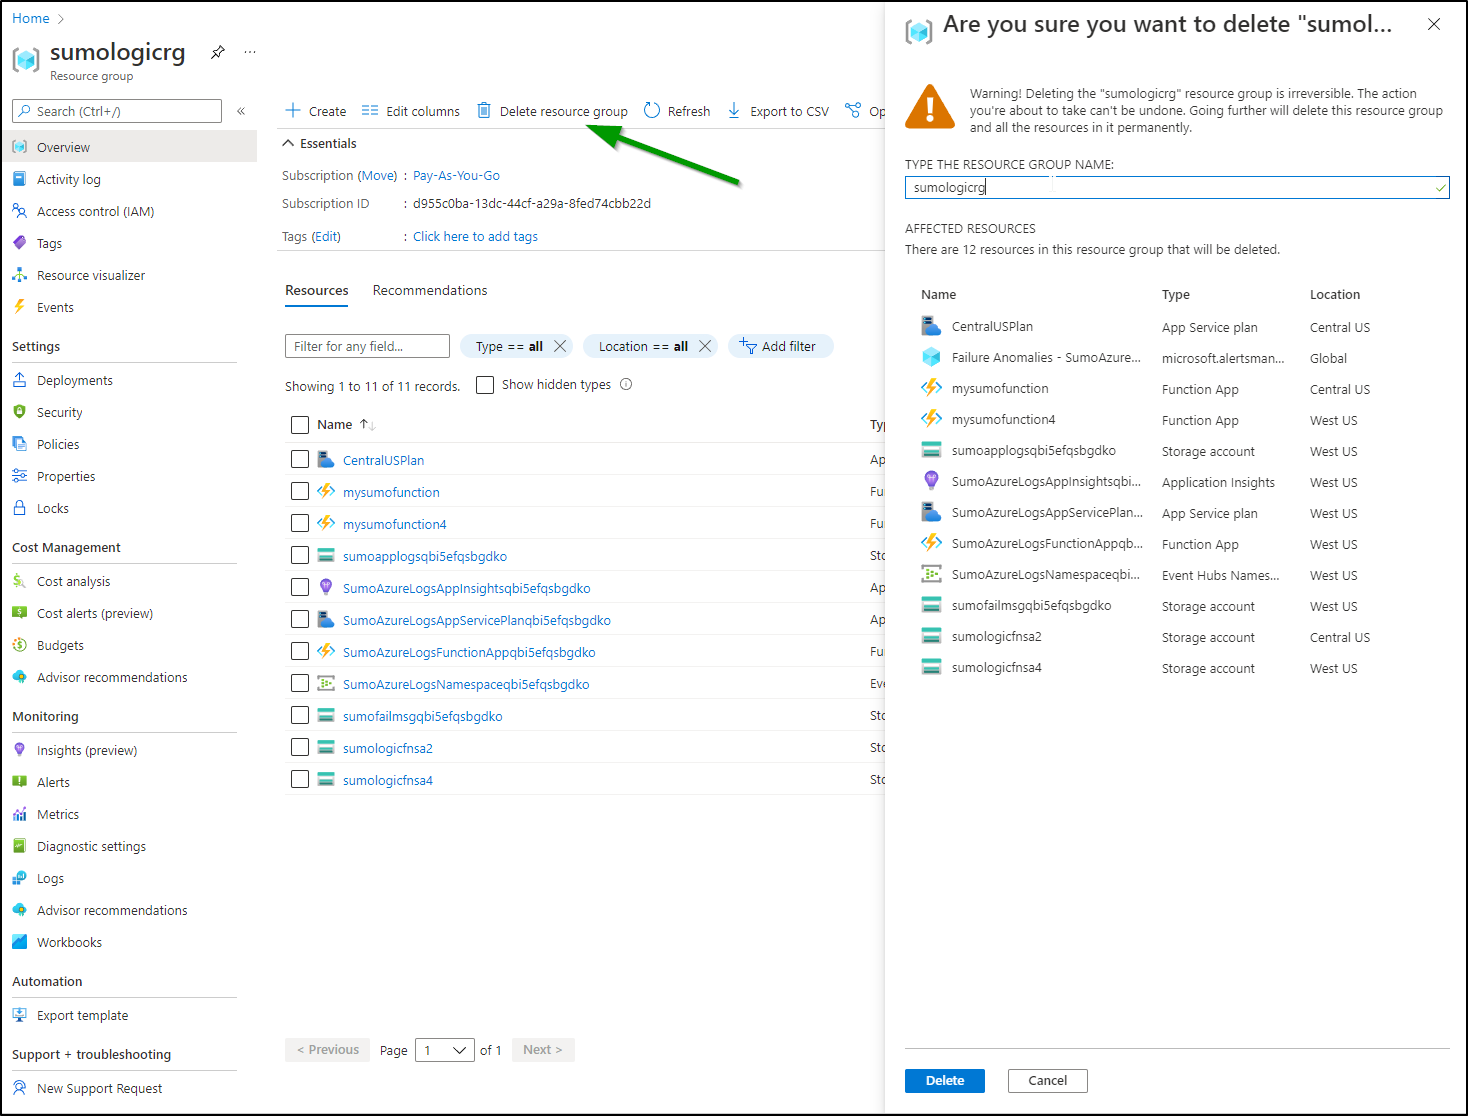
Responding to Data Volume Spikes
Over the weekend I received alerts about data limits from Sumo
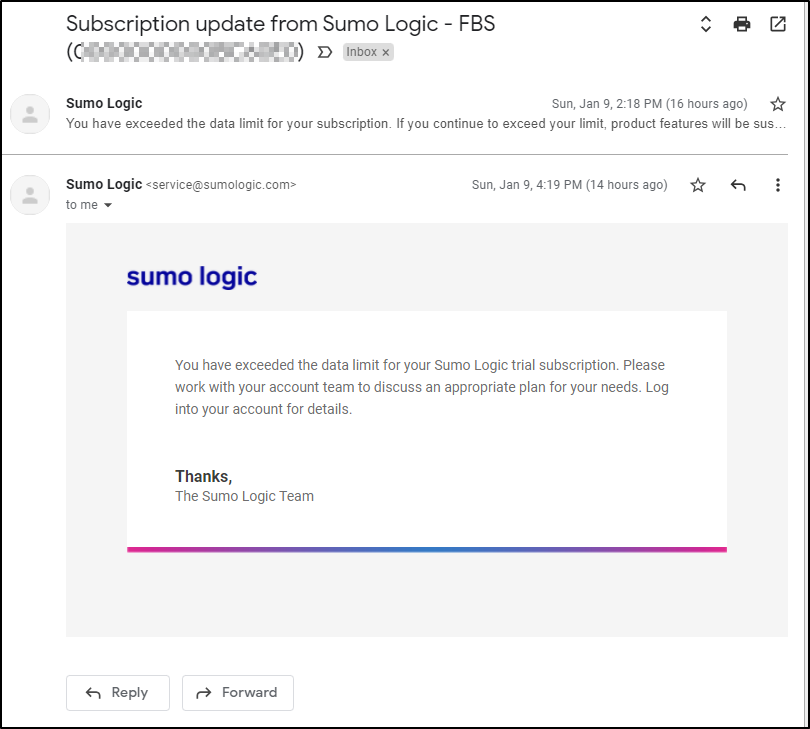
Since we have the Data Volume integration, I went there first to see from where my spikes were coming.
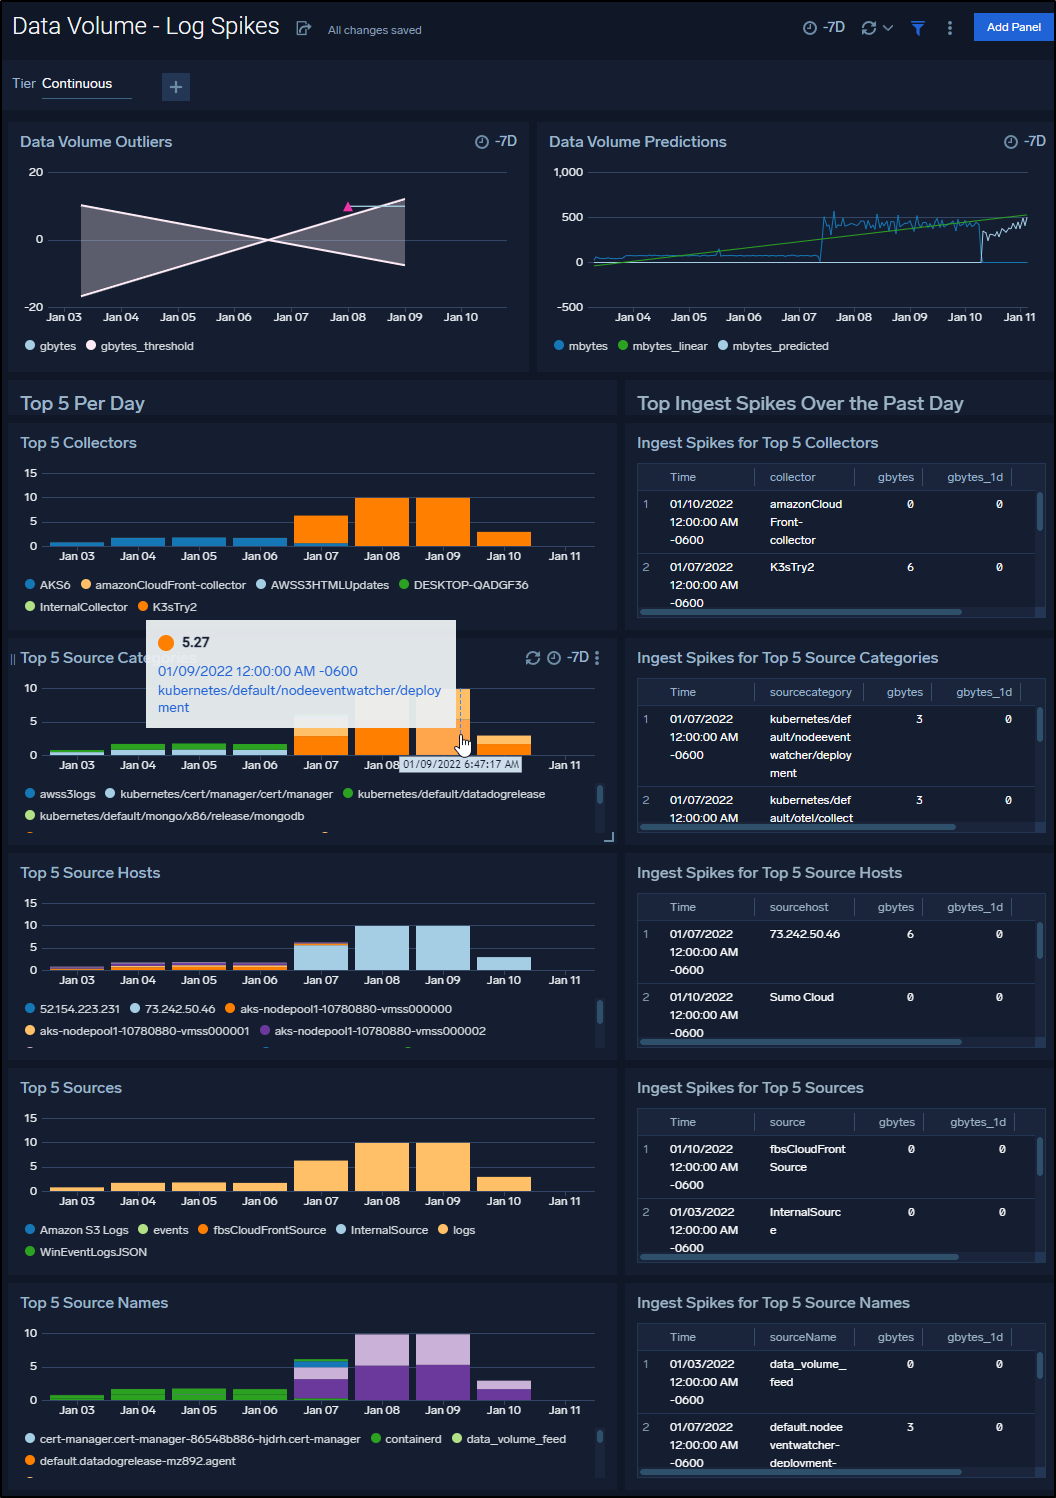
It is clear it’s my onprem cluster and more important, the NodeEventWatcher. Looking at the logs
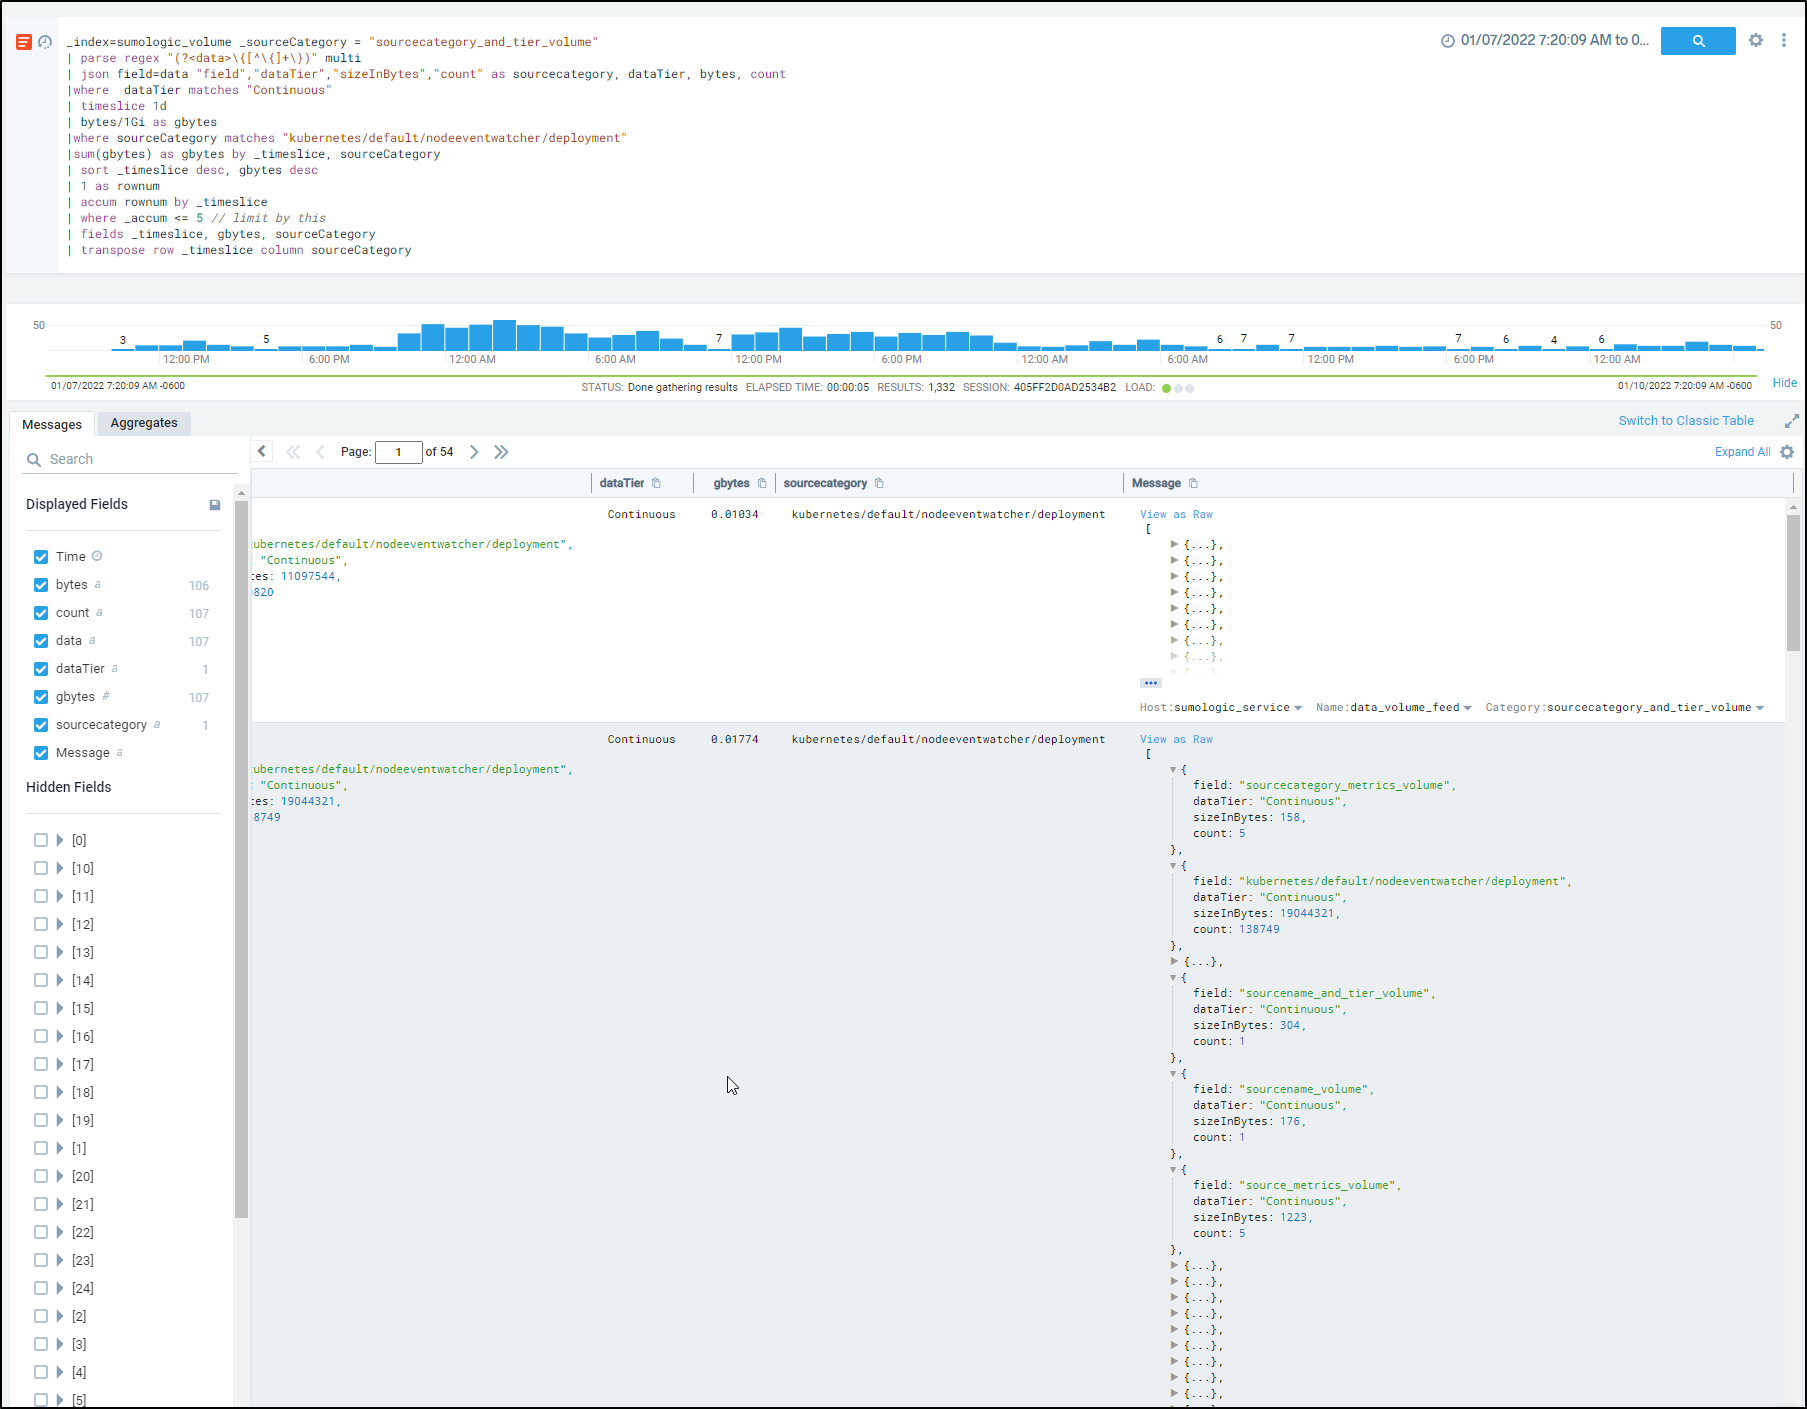
It seems to be catching all the metrics generated.
If we go back to the blog where we created NodeEventWatcher we see it was basically a NodeJS container to watch and report on events. We need not send that to Otel.
We can see it just listens to events and does not tie to anything else via the Service Health Dashboard
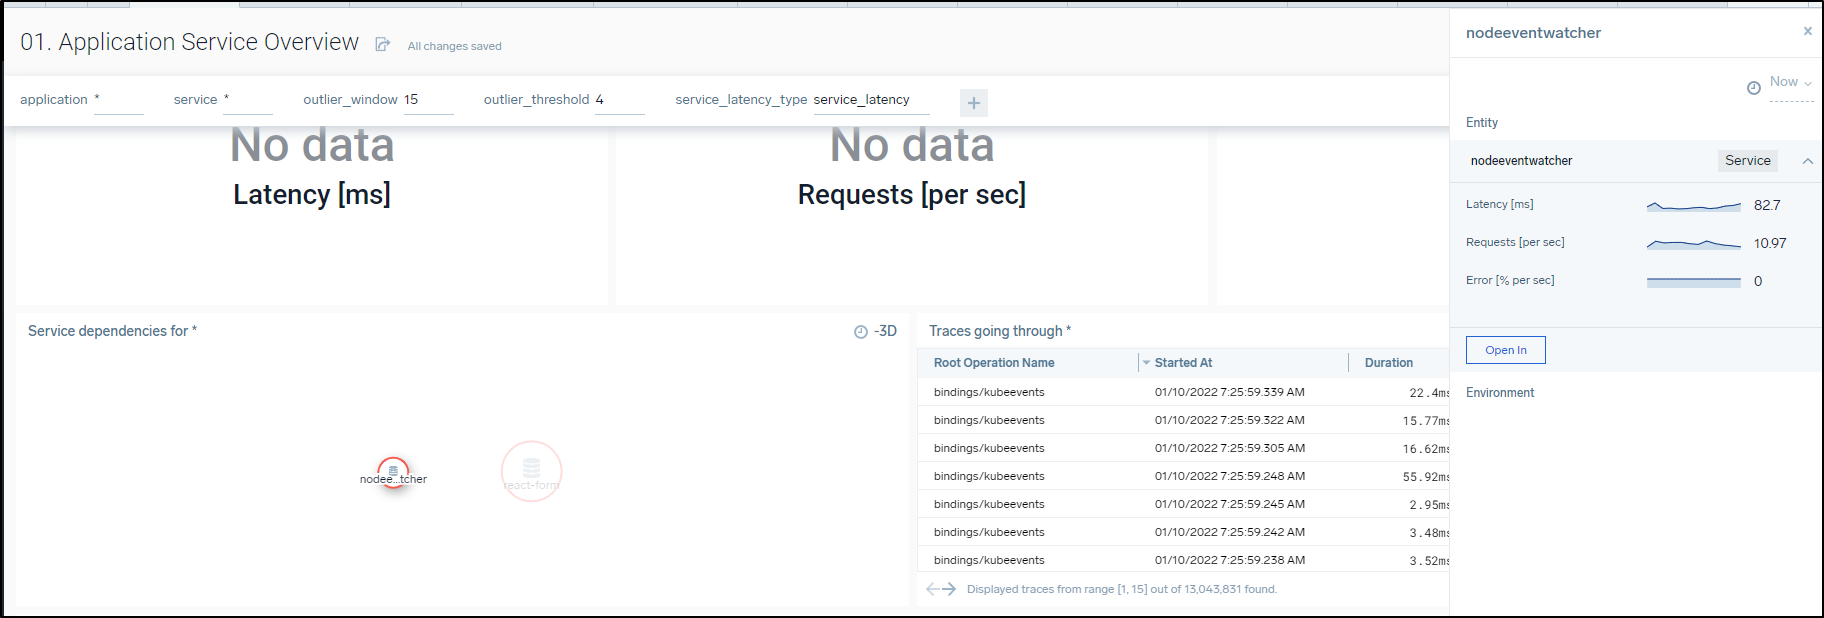
So there are four ways we could reduce this:
- Limit ingest on this collector with a Sumo Logic Budget
- Disable Dapr on this deployment
- Change the kubeevents polling
- Create a new Configuration that doesn’t send trace data
To show each of these:
Limit Ingest with a Sumo Logic Budget
This is the fastest way to reduce Sumo Credit burn and return to health. However, it comes at the penalty of likely loosing some ingest data.
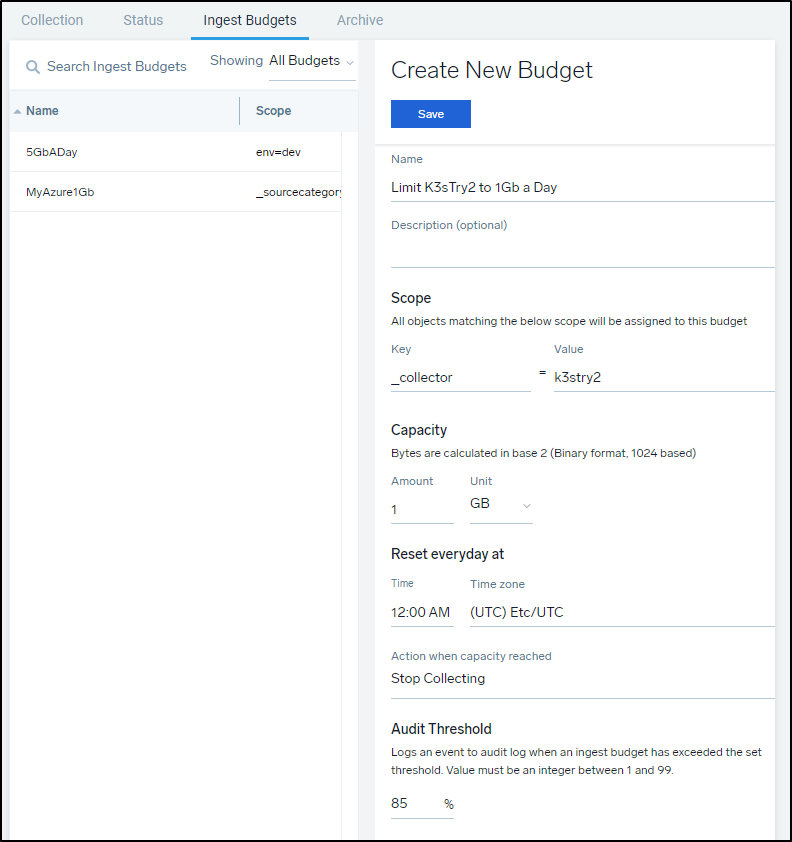
We won’t do this since we know we can address this one noisy service
Disable Dapr on the Deployment
We can see we set Dapr enabled on this deployment:
$ kubectl get deployment nodeeventwatcher-deployment -o yaml | head -n 37 | tail -n10
  template:
    metadata:
      annotations:
        dapr.io/app-id: nodeeventwatcher
        dapr.io/app-port: "8080"
        dapr.io/config: appconfig
        dapr.io/enabled: "true"
      creationTimestamp: null
      labels:
        app: nodeeventwatcher
We can simply set “dapr.io/enabled” to “false” (or just remove all those Dapr annotations) and it will stop instrumenting this and disable the sidecar.
However, this breaks the service and I would rather remove it then have it broken.
Change the Kubeevents Polling
This would likely reduce noise and might be the best option.
$ kubectl get Component kubeevents -o yaml
apiVersion: dapr.io/v1alpha1
kind: Component
metadata:
  annotations:
    kubectl.kubernetes.io/last-applied-configuration: |
      {"apiVersion":"dapr.io/v1alpha1","kind":"Component","metadata":{"annotations":{},"name":"kubeevents","namespace":"default"},"spec":{"metadata":[{"name":"namespace","value":"default"},{"name":"resyncPeriodInSec","value":"5"}],"type":"bindings.kubernetes","version":"v1"}}
  creationTimestamp: "2021-06-13T19:05:32Z"
  generation: 1
  name: kubeevents
  namespace: default
  resourceVersion: "45547915"
  uid: d9a7e29e-0275-4a01-8424-16fcf5d5e173
spec:
  metadata:
  - name: namespace
    value: default
  - name: resyncPeriodInSec
    value: "5"
  type: bindings.kubernetes
  version: v1
If we look up the docs on the Event Binding we see normally it defaults to 10 seconds. We’ve had it syncing events every 5s (and notifying the KubeEvent endpoint that triggers the container)
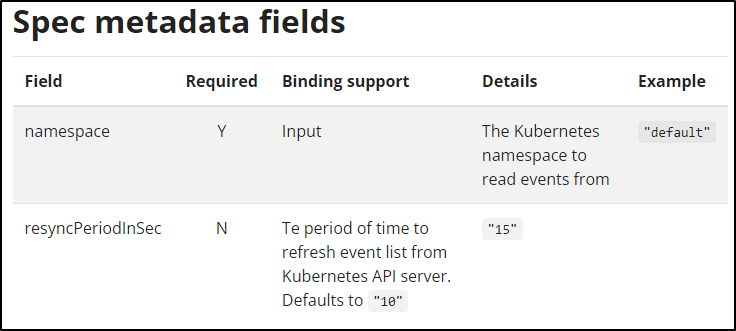
I’ll first change that:
$ kubectl get Component kubeevents -o yaml > kec.yaml
$ kubectl get Component kubeevents -o yaml > kec.yaml.bak
$ vi kec.yaml
$ diff -c kec.yaml.bak kec.yaml
*** kec.yaml.bak        2022-01-10 07:38:12.907111948 -0600
--- kec.yaml    2022-01-10 07:38:22.347111952 -0600
***************
*** 15,20 ****
    - name: namespace
      value: default
    - name: resyncPeriodInSec
!     value: "5"
    type: bindings.kubernetes
    version: v1
--- 15,20 ----
    - name: namespace
      value: default
    - name: resyncPeriodInSec
!     value: "10"
    type: bindings.kubernetes
    version: v1
$ kubectl apply -f kec.yaml
component.dapr.io/kubeevents configured
Disable Tracing on NodeEventWatcher
The trace data only comes because we shared a single app configuration on all the Dapr services. Let’s create one that doesn’t add zipkin tracing.
$ kubectl get configuration.dapr.io appconfig -o yaml | tail -n7
spec:
  metric:
    enabled: true
  tracing:
    samplingRate: "1"
    zipkin:
      endpointAddress: http://otel-collector.default.svc.cluster.local:9411/api/v2/spans
First we can create a new config based on appconfig. We will leave in metric set to true as that enables the metrics exporter.
$ cat eventconfig.yaml
apiVersion: dapr.io/v1alpha1
kind: Configuration
metadata:
  name: eventconfig
spec:
  metric:
    enabled: true
$ kubectl apply -f eventconfig.yaml
configuration.dapr.io/eventconfig created
Next, we want to update the NodeEventWatcher deployment to use this Dapr Configuration
$ kubectl get deployment nodeeventwatcher-deployment -o yaml > new.yaml
$ kubectl get deployment nodeeventwatcher-deployment -o yaml > new.yaml.bak
$ vi new.yaml
$ diff -c new.yaml.bak new.yaml
*** new.yaml.bak        2022-01-10 07:45:00.877112094 -0600
--- new.yaml    2022-01-10 07:45:22.657112102 -0600
***************
*** 30,36 ****
        annotations:
          dapr.io/app-id: nodeeventwatcher
          dapr.io/app-port: "8080"
!         dapr.io/config: appconfig
          dapr.io/enabled: "true"
        creationTimestamp: null
        labels:
--- 30,36 ----
        annotations:
          dapr.io/app-id: nodeeventwatcher
          dapr.io/app-port: "8080"
!         dapr.io/config: eventconfig
          dapr.io/enabled: "true"
        creationTimestamp: null
        labels:
$ kubectl apply -f new.yaml
deployment.apps/nodeeventwatcher-deployment configured
$ kubectl get pods | grep event
mysumorelease-sumologic-fluentd-events-0                1/1     Running                0          2d20h
nodeeventwatcher-deployment-6dddc4858c-dgm76            1/2     CreateContainerError   1          8d
nodeeventwatcher-deployment-75b446899b-t5pcl            0/2     ContainerCreating      0          5s
Custom Logs
Sometimes we have logs that don’t fit a standard collector. Since Sumo Logic basically ingests Logs or Metrics with HTTP, it’s easy to use something like curl to POST logs from any system.
First, let’s create a collector for this activity. Create a new Hosted Collector
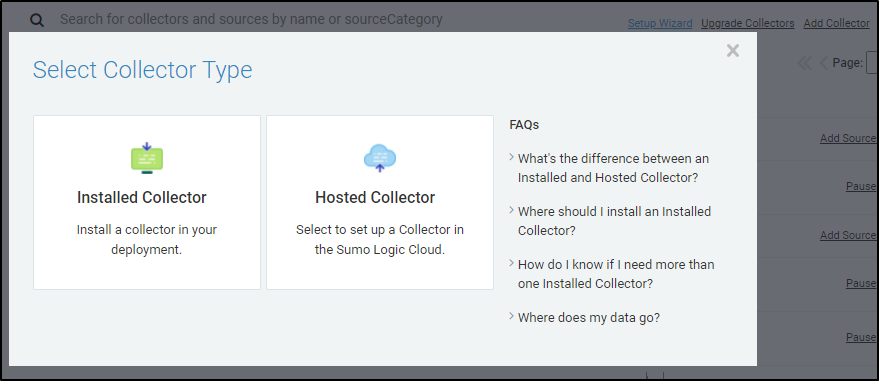
Give it a reasonable name and set the timezone
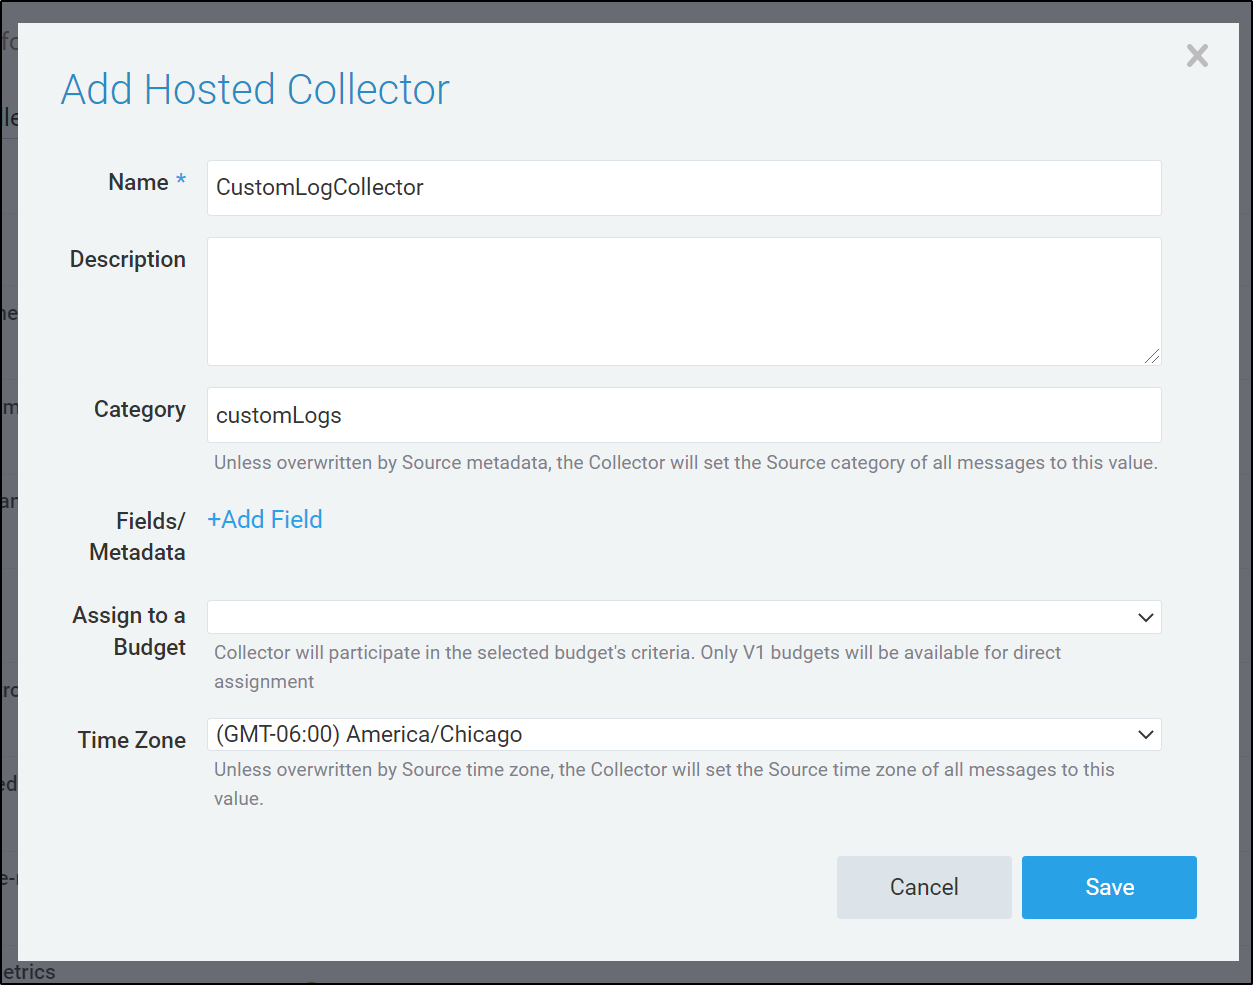
We need to add an “HTTP Logs & Metrics” source to it next
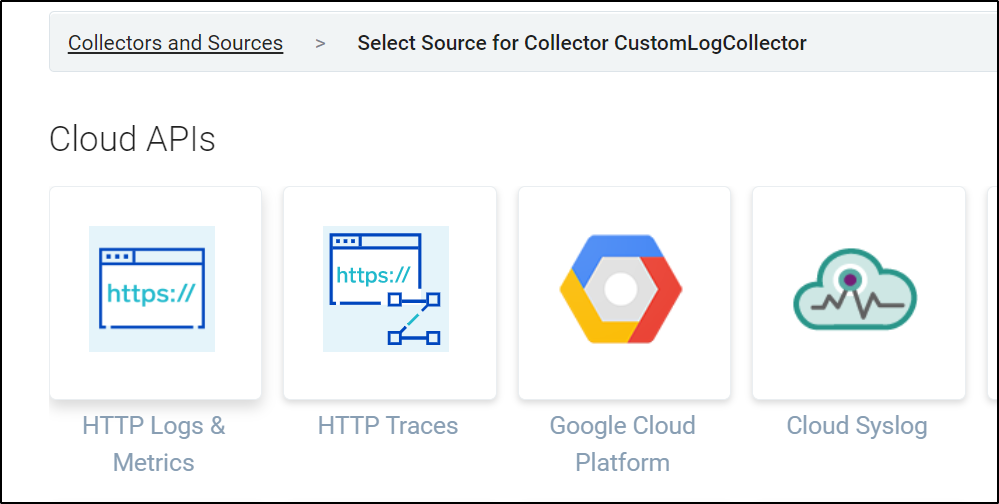
Here we add the source “CustomLogSource”
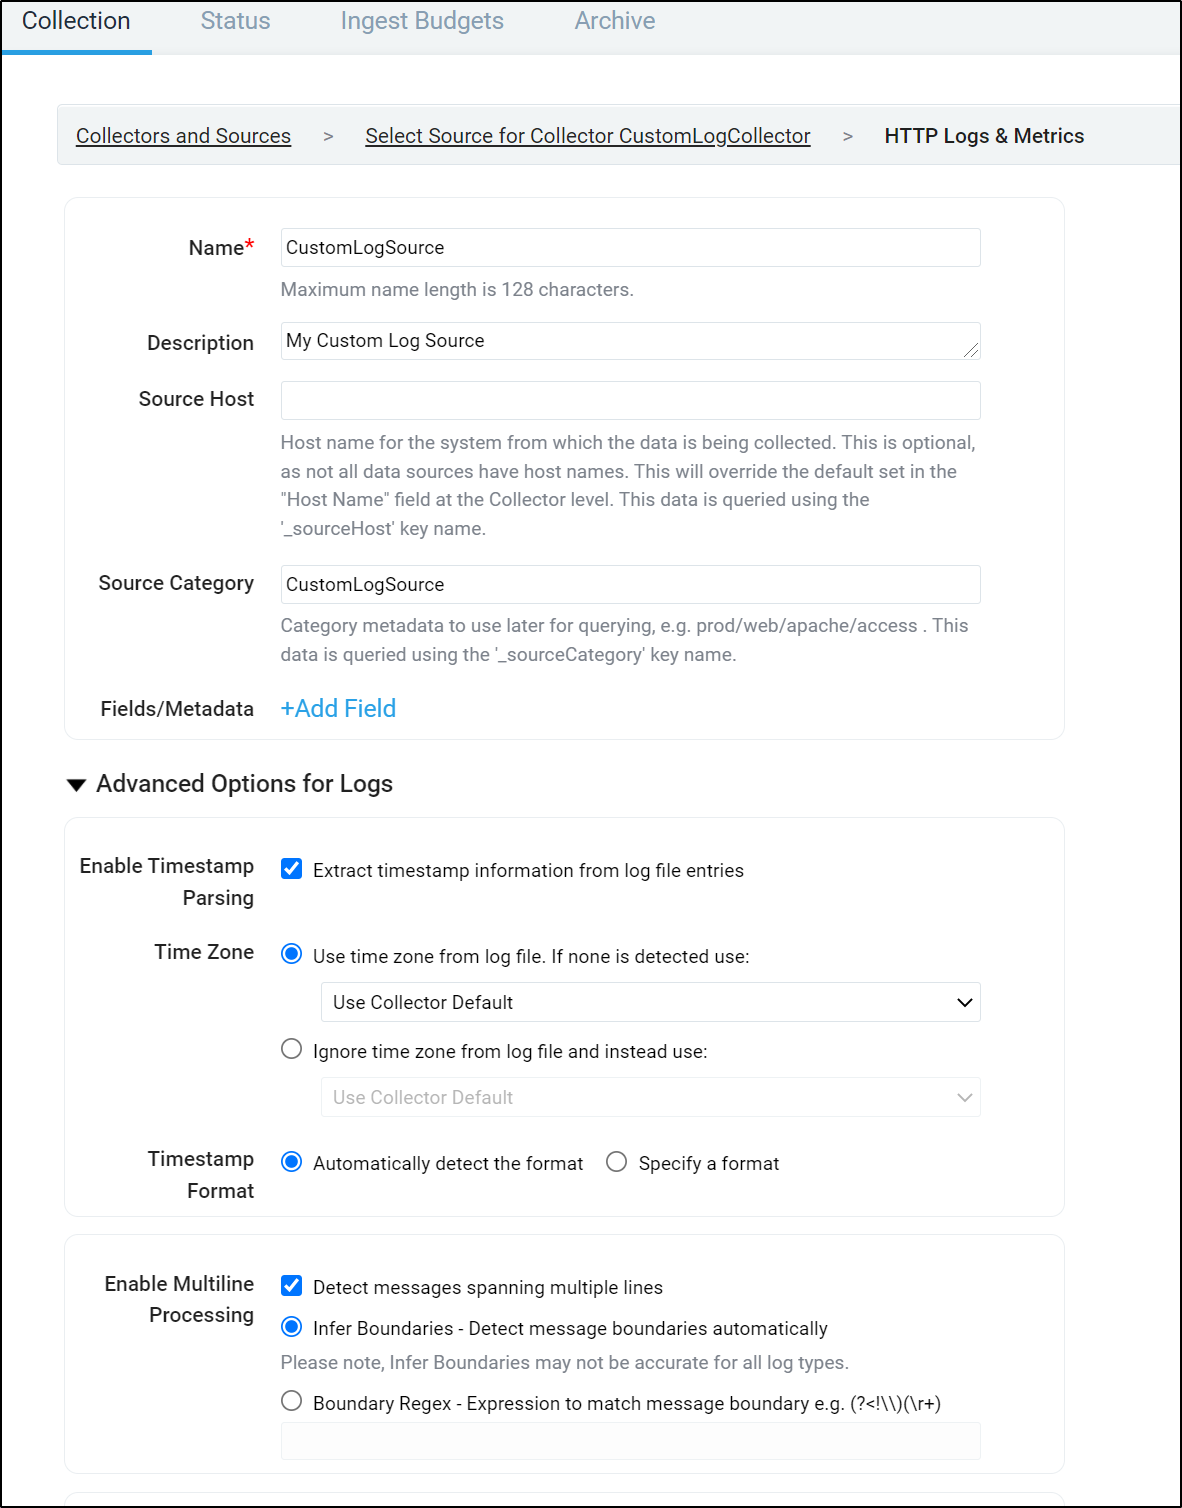
This, upon save, gives us the endpoint:
https://endpoint4.collection.sumologic.com/receiver/v1/http/ZaVnC4dhaV0aUDPPpHY4gvDM4oNwgwi9TajMZ36ILDkreVEXGNV3S1MA46r9p1aIhBHFUgNoDs_3p5MOCn7QhcZ7SF1qjOC4duOH38jKGjKE8Bo6PtjXKw==
Now we want to POST a log to it.
For an example, we can just use a random log out of /var/log
$ cat /var/log/alternatives.log | tail -n 10
update-alternatives 2021-12-04 14:24:17: run with --quiet --install /lib/cpp cpp /usr/bin/cpp 10
update-alternatives 2021-12-04 14:24:17: link group cpp updated to point to /usr/bin/cpp
update-alternatives 2021-12-04 14:24:17: run with --quiet --install /usr/bin/cc cc /usr/bin/gcc 20 --slave /usr/share/man/man1/cc.1.gz cc.1.gz /usr/share/man/man1/gcc.1.gz
update-alternatives 2021-12-04 14:24:17: link group cc updated to point to /usr/bin/gcc
update-alternatives 2021-12-04 14:24:17: run with --quiet --install /usr/bin/c89 c89 /usr/bin/c89-gcc 20 --slave /usr/share/man/man1/c89.1.gz c89.1.gz /usr/share/man/man1/c89-gcc.1.gz
update-alternatives 2021-12-04 14:24:17: link group c89 updated to point to /usr/bin/c89-gcc
update-alternatives 2021-12-04 14:24:17: run with --quiet --install /usr/bin/c99 c99 /usr/bin/c99-gcc 20 --slave /usr/share/man/man1/c99.1.gz c99.1.gz /usr/share/man/man1/c99-gcc.1.gz
update-alternatives 2021-12-04 14:24:17: link group c99 updated to point to /usr/bin/c99-gcc
update-alternatives 2021-12-04 14:24:17: run with --install /usr/bin/c++ c++ /usr/bin/g++ 20 --slave /usr/share/man/man1/c++.1.gz c++.1.gz /usr/share/man/man1/g++.1.gz
update-alternatives 2021-12-04 14:24:17: link group c++ updated to point to /usr/bin/g++
Unfortunately, im still hampered by some quota issues
$ curl -v -X POST -T /var/log/alternatives.log https://endpoint4.collection.sumologic.com/receiver/v1/http/ZaVnC4dhaV0aUDPPpHY4gvDM4oNwgwi9TajMZ36ILDkreVEXGNV3S1MA46r9p1aIhBHFUgNoDs_3p5MOCn7QhcZ7SF1qjOC4duOH38jKGjKE8Bo6PtjXKw==
*   Trying 3.210.121.77:443...
* TCP_NODELAY set
* Connected to endpoint4.collection.sumologic.com (3.210.121.77) port 443 (#0)
* ALPN, offering h2
* ALPN, offering http/1.1
* successfully set certificate verify locations:
*   CAfile: /etc/ssl/certs/ca-certificates.crt
  CApath: /etc/ssl/certs
* TLSv1.3 (OUT), TLS handshake, Client hello (1):
* TLSv1.3 (IN), TLS handshake, Server hello (2):
* TLSv1.2 (IN), TLS handshake, Certificate (11):
* TLSv1.2 (IN), TLS handshake, Server key exchange (12):
* TLSv1.2 (IN), TLS handshake, Server finished (14):
* TLSv1.2 (OUT), TLS handshake, Client key exchange (16):
* TLSv1.2 (OUT), TLS change cipher, Change cipher spec (1):
* TLSv1.2 (OUT), TLS handshake, Finished (20):
* TLSv1.2 (IN), TLS handshake, Finished (20):
* SSL connection using TLSv1.2 / ECDHE-RSA-AES128-GCM-SHA256
* ALPN, server accepted to use h2
* Server certificate:
*  subject: C=US; ST=California; L=Redwood City; O=Sumo Logic Inc.; OU=Information Technology; CN=endpoint1.collection.sumologic.com
*  start date: Feb  7 00:00:00 2020 GMT
*  expire date: Feb  6 12:00:00 2022 GMT
*  subjectAltName: host "endpoint4.collection.sumologic.com" matched cert's "endpoint4.collection.sumologic.com"
*  issuer: C=US; O=DigiCert Inc; OU=www.digicert.com; CN=GeoTrust RSA CA 2018
*  SSL certificate verify ok.
* Using HTTP2, server supports multi-use
* Connection state changed (HTTP/2 confirmed)
* Copying HTTP/2 data in stream buffer to connection buffer after upgrade: len=0
* Using Stream ID: 1 (easy handle 0x558fb2850b60)
> POST /receiver/v1/http/ZaVnC4dhaV0aUDPPpHY4gvDM4oNwgwi9TajMZ36ILDkreVEXGNV3S1MA46r9p1aIhBHFUgNoDs_3p5MOCn7QhcZ7SF1qjOC4duOH38jKGjKE8Bo6PtjXKw== HTTP/2
> Host: endpoint4.collection.sumologic.com
> user-agent: curl/7.68.0
> accept: */*
> content-length: 11837
>
* Connection state changed (MAX_CONCURRENT_STREAMS == 128)!
* We are completely uploaded and fine
< HTTP/2 429
< date: Mon, 10 Jan 2022 23:10:45 GMT
< content-type: text/html;charset=iso-8859-1
< content-length: 733
< set-cookie: AWSALB=4Y/U4lfY2T5QlPVsQRq0/w7mILBjL4gD2JxwxoifUqAayE63BSDNj0Gw0fpSl84g/zXowy99r+VtKRi8g6aHQ5SCCkVnNw78H1XAzs7J8Gak2CdzhNozvfAKDk5p; Expires=Mon, 17 Jan 2022 23:10:44 GMT; Path=/
< set-cookie: AWSALBCORS=4Y/U4lfY2T5QlPVsQRq0/w7mILBjL4gD2JxwxoifUqAayE63BSDNj0Gw0fpSl84g/zXowy99r+VtKRi8g6aHQ5SCCkVnNw78H1XAzs7J8Gak2CdzhNozvfAKDk5p; Expires=Mon, 17 Jan 2022 23:10:44 GMT; Path=/; SameSite=None; Secure
< cache-control: must-revalidate,no-cache,no-store
<
<html>
<head>
<meta http-equiv="Content-Type" content="text/html;charset=utf-8"/>
<title>Error 429 You have temporarily exceeded your Sumo Logic quota. Please try again at a later time.</title>
</head>
<body><h2>HTTP ERROR 429 You have temporarily exceeded your Sumo Logic quota. Please try again at a later time.</h2>
<table>
<tr><th>URI:</th><td>/receiver/v1/http/ZaVnC4dhaV0aUDPPpHY4gvDM4oNwgwi9TajMZ36ILDkreVEXGNV3S1MA46r9p1aIhBHFUgNoDs_3p5MOCn7QhcZ7SF1qjOC4duOH38jKGjKE8Bo6PtjXKw==</td></tr>
<tr><th>STATUS:</th><td>429</td></tr>
<tr><th>MESSAGE:</th><td>You have temporarily exceeded your Sumo Logic quota. Please try again at a later time.</td></tr>
<tr><th>SERVLET:</th><td>collector-http</td></tr>
</table>

</body>
</html>
* Connection #0 to host endpoint4.collection.sumologic.com left intact
We could also gzip a log and send that
builder@DESKTOP-72D2D9T:~/Workspaces/jekyll-blog$ gzip -c /var/log/alternatives.log > /tmp/my_gzipped_log.gz
builder@DESKTOP-72D2D9T:~/Workspaces/jekyll-blog$ curl -v -H 'Content-Encoding:gzip' -X POST -T /tmp/my_gzipped_log.gz https://endpoint4.collection.sumolog
ic.com/receiver/v1/http/ZaVnC4dhaV0aUDPPpHY4gvDM4oNwgwi9TajMZ36ILDkreVEXGNV3S1MA46r9p1aIhBHFUgNoDs_3p5MOCn7QhcZ7SF1qjOC4duOH38jKGjKE8Bo6PtjXKw==
I was actually blocked by an ingestion budget that set things to stop collecting. Once I removed that (changed it to “Keep Collecting”), then i was able to proceed:
$ curl -v -H 'Content-Encoding:gzip' -X POST -T /tmp/my_gzipped_log.gz https://endpoint4.collection.sumologic.com/receiver/v1/http/ZaVnC4dhaV0aUDPPpHY4gvDM4oNwgwi9TajMZ36ILDkreVEXGNV3S1MA46r9p1aIhBHFUgNoDs_3p5MOCn7QhcZ7SF1qjOC4duOH38jKGjKE8Bo6PtjXKw==
*   Trying 54.225.121.218:443...
* TCP_NODELAY set
* Connected to endpoint4.collection.sumologic.com (54.225.121.218) port 443 (#0)
* ALPN, offering h2
* ALPN, offering http/1.1
* successfully set certificate verify locations:
*   CAfile: /etc/ssl/certs/ca-certificates.crt
  CApath: /etc/ssl/certs
* TLSv1.3 (OUT), TLS handshake, Client hello (1):
* TLSv1.3 (IN), TLS handshake, Server hello (2):
* TLSv1.2 (IN), TLS handshake, Certificate (11):
* TLSv1.2 (IN), TLS handshake, Server key exchange (12):
* TLSv1.2 (IN), TLS handshake, Server finished (14):
* TLSv1.2 (OUT), TLS handshake, Client key exchange (16):
* TLSv1.2 (OUT), TLS change cipher, Change cipher spec (1):
* TLSv1.2 (OUT), TLS handshake, Finished (20):
* TLSv1.2 (IN), TLS handshake, Finished (20):
* SSL connection using TLSv1.2 / ECDHE-RSA-AES128-GCM-SHA256
* ALPN, server accepted to use h2
* Server certificate:
*  subject: C=US; ST=California; L=Redwood City; O=Sumo Logic Inc.; OU=Information Technology; CN=endpoint1.collection.sumologic.com
*  start date: Feb  7 00:00:00 2020 GMT
*  expire date: Feb  6 12:00:00 2022 GMT
*  subjectAltName: host "endpoint4.collection.sumologic.com" matched cert's "endpoint4.collection.sumologic.com"
*  issuer: C=US; O=DigiCert Inc; OU=www.digicert.com; CN=GeoTrust RSA CA 2018
*  SSL certificate verify ok.
* Using HTTP2, server supports multi-use
* Connection state changed (HTTP/2 confirmed)
* Copying HTTP/2 data in stream buffer to connection buffer after upgrade: len=0
* Using Stream ID: 1 (easy handle 0x563750279b60)
> POST /receiver/v1/http/ZaVnC4dhaV0aUDPPpHY4gvDM4oNwgwi9TajMZ36ILDkreVEXGNV3S1MA46r9p1aIhBHFUgNoDs_3p5MOCn7QhcZ7SF1qjOC4duOH38jKGjKE8Bo6PtjXKw== HTTP/2
> Host: endpoint4.collection.sumologic.com
> user-agent: curl/7.68.0
> accept: */*
> content-encoding:gzip
> content-length: 1140
>
* Connection state changed (MAX_CONCURRENT_STREAMS == 128)!
* We are completely uploaded and fine
< HTTP/2 200
< date: Mon, 10 Jan 2022 23:20:40 GMT
< content-type: text/plain
< content-length: 0
< set-cookie: AWSALB=iw7DWeO1ZjAtT60FFImWFDnsFYqLc3+cBtnEEG+YfDrwOkEnmmFjLwyoaJ//cZWOHPHinLto4c8XDenRWXFRnm9XhVts6afA8IaE9zHtL9mlpOKnEu/qepVpdYok; Expires=Mon, 17 Jan 2022 23:20:40 GMT; Path=/
< set-cookie: AWSALBCORS=iw7DWeO1ZjAtT60FFImWFDnsFYqLc3+cBtnEEG+YfDrwOkEnmmFjLwyoaJ//cZWOHPHinLto4c8XDenRWXFRnm9XhVts6afA8IaE9zHtL9mlpOKnEu/qepVpdYok; Expires=Mon, 17 Jan 2022 23:20:40 GMT; Path=/; SameSite=None; Secure
< x-content-type-options: nosniff
< x-frame-options: SAMEORIGIN
< x-xss-protection: 1; mode=block
< strict-transport-security: max-age=15552000
<
* Connection #0 to host endpoint4.collection.sumologic.com left intact
And now I see at least one log line
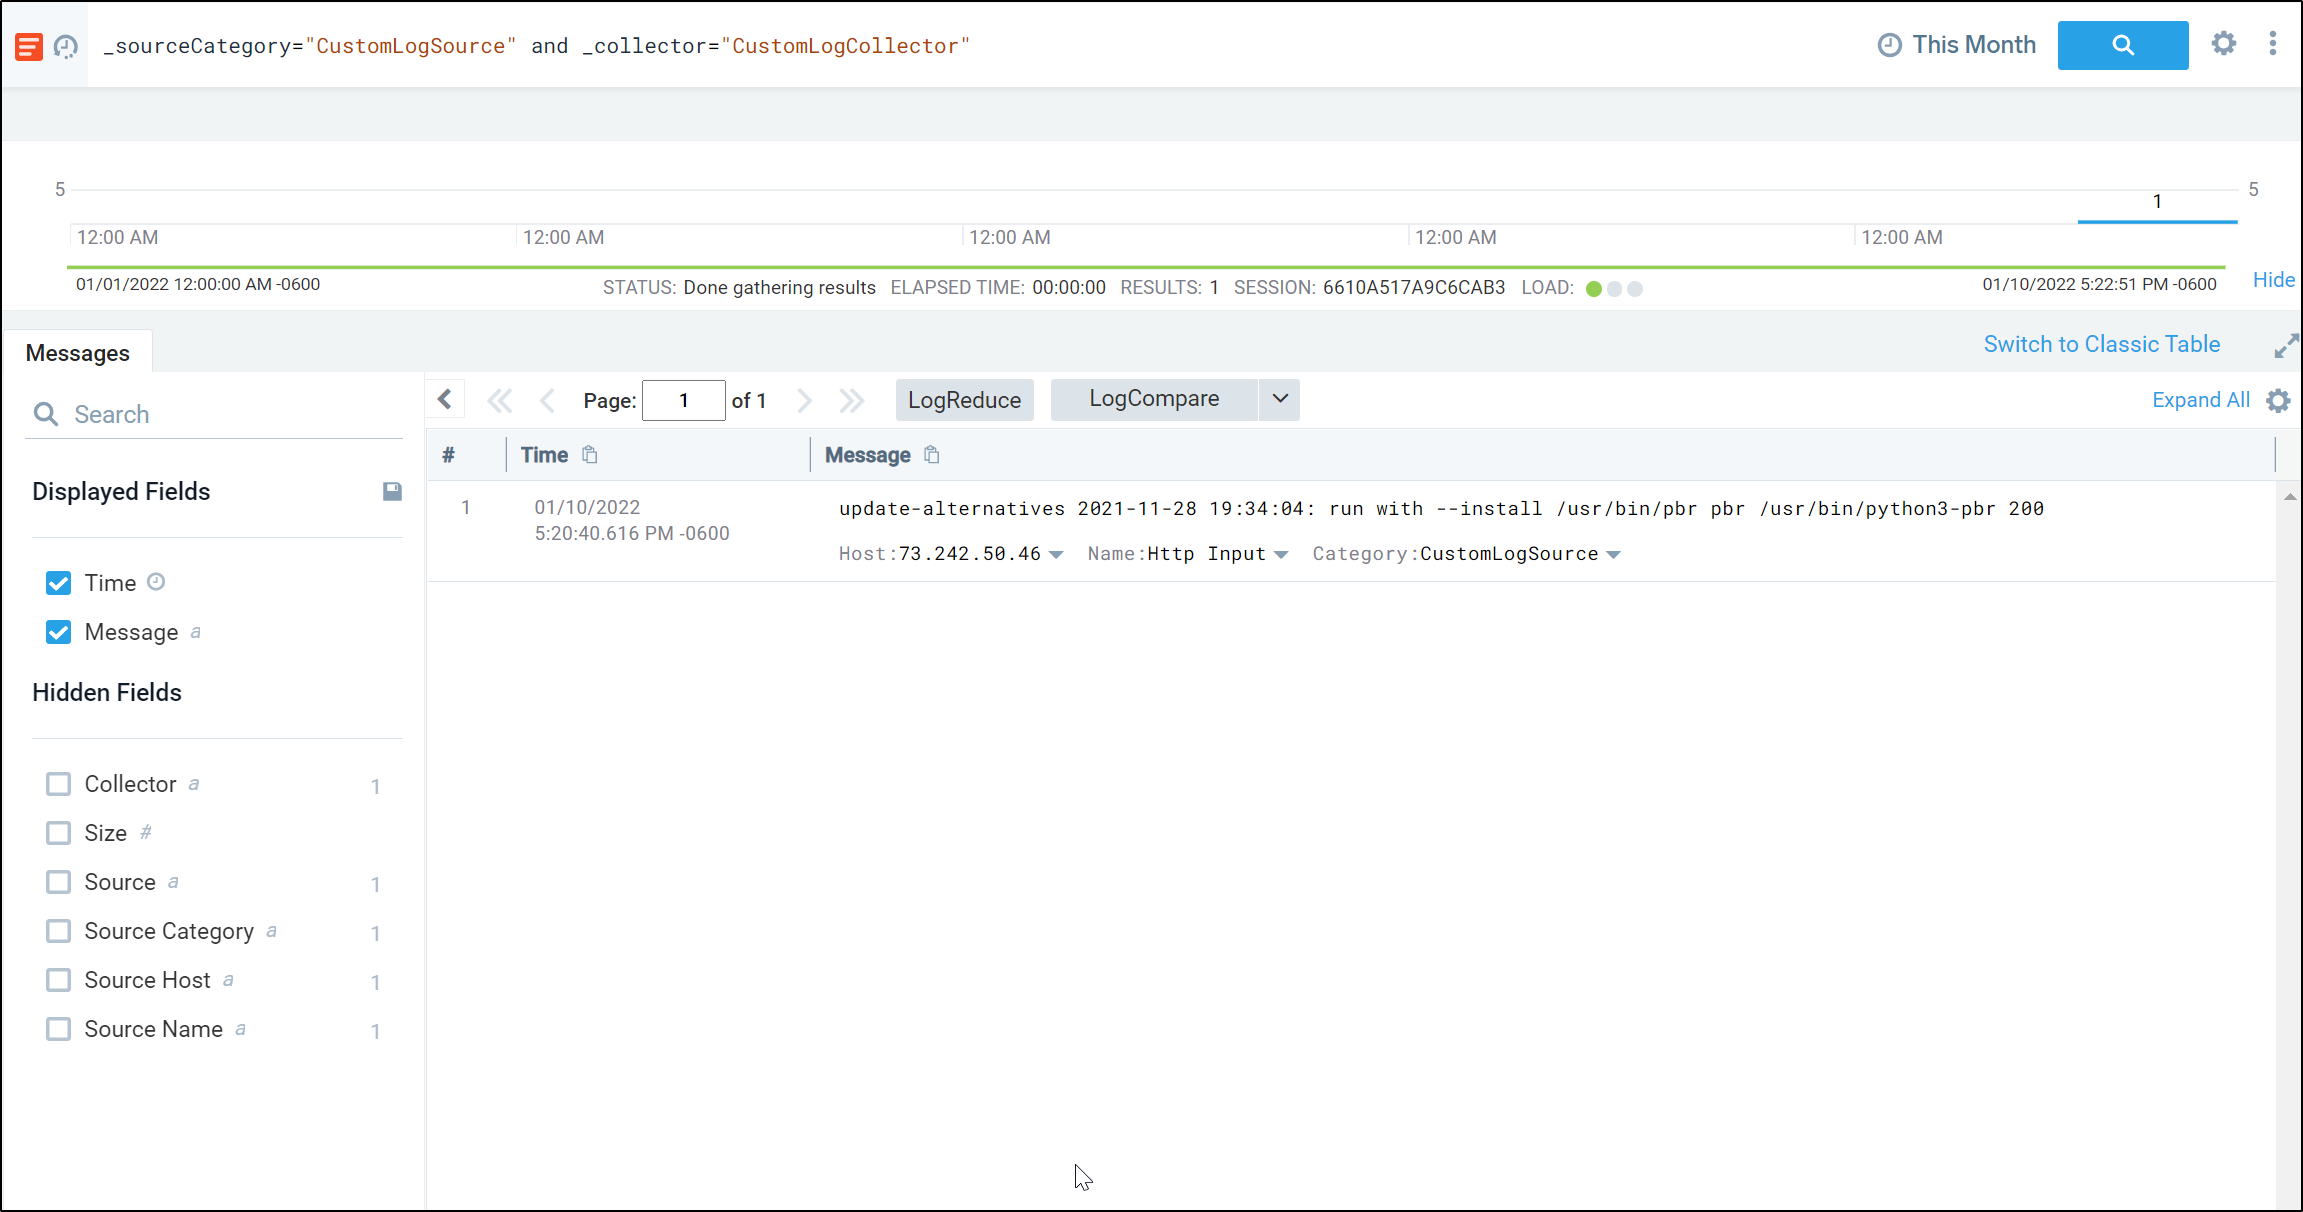
If we look at “Previous Month”, we see it parsed the dates from the log (which were all from Dec 14th)
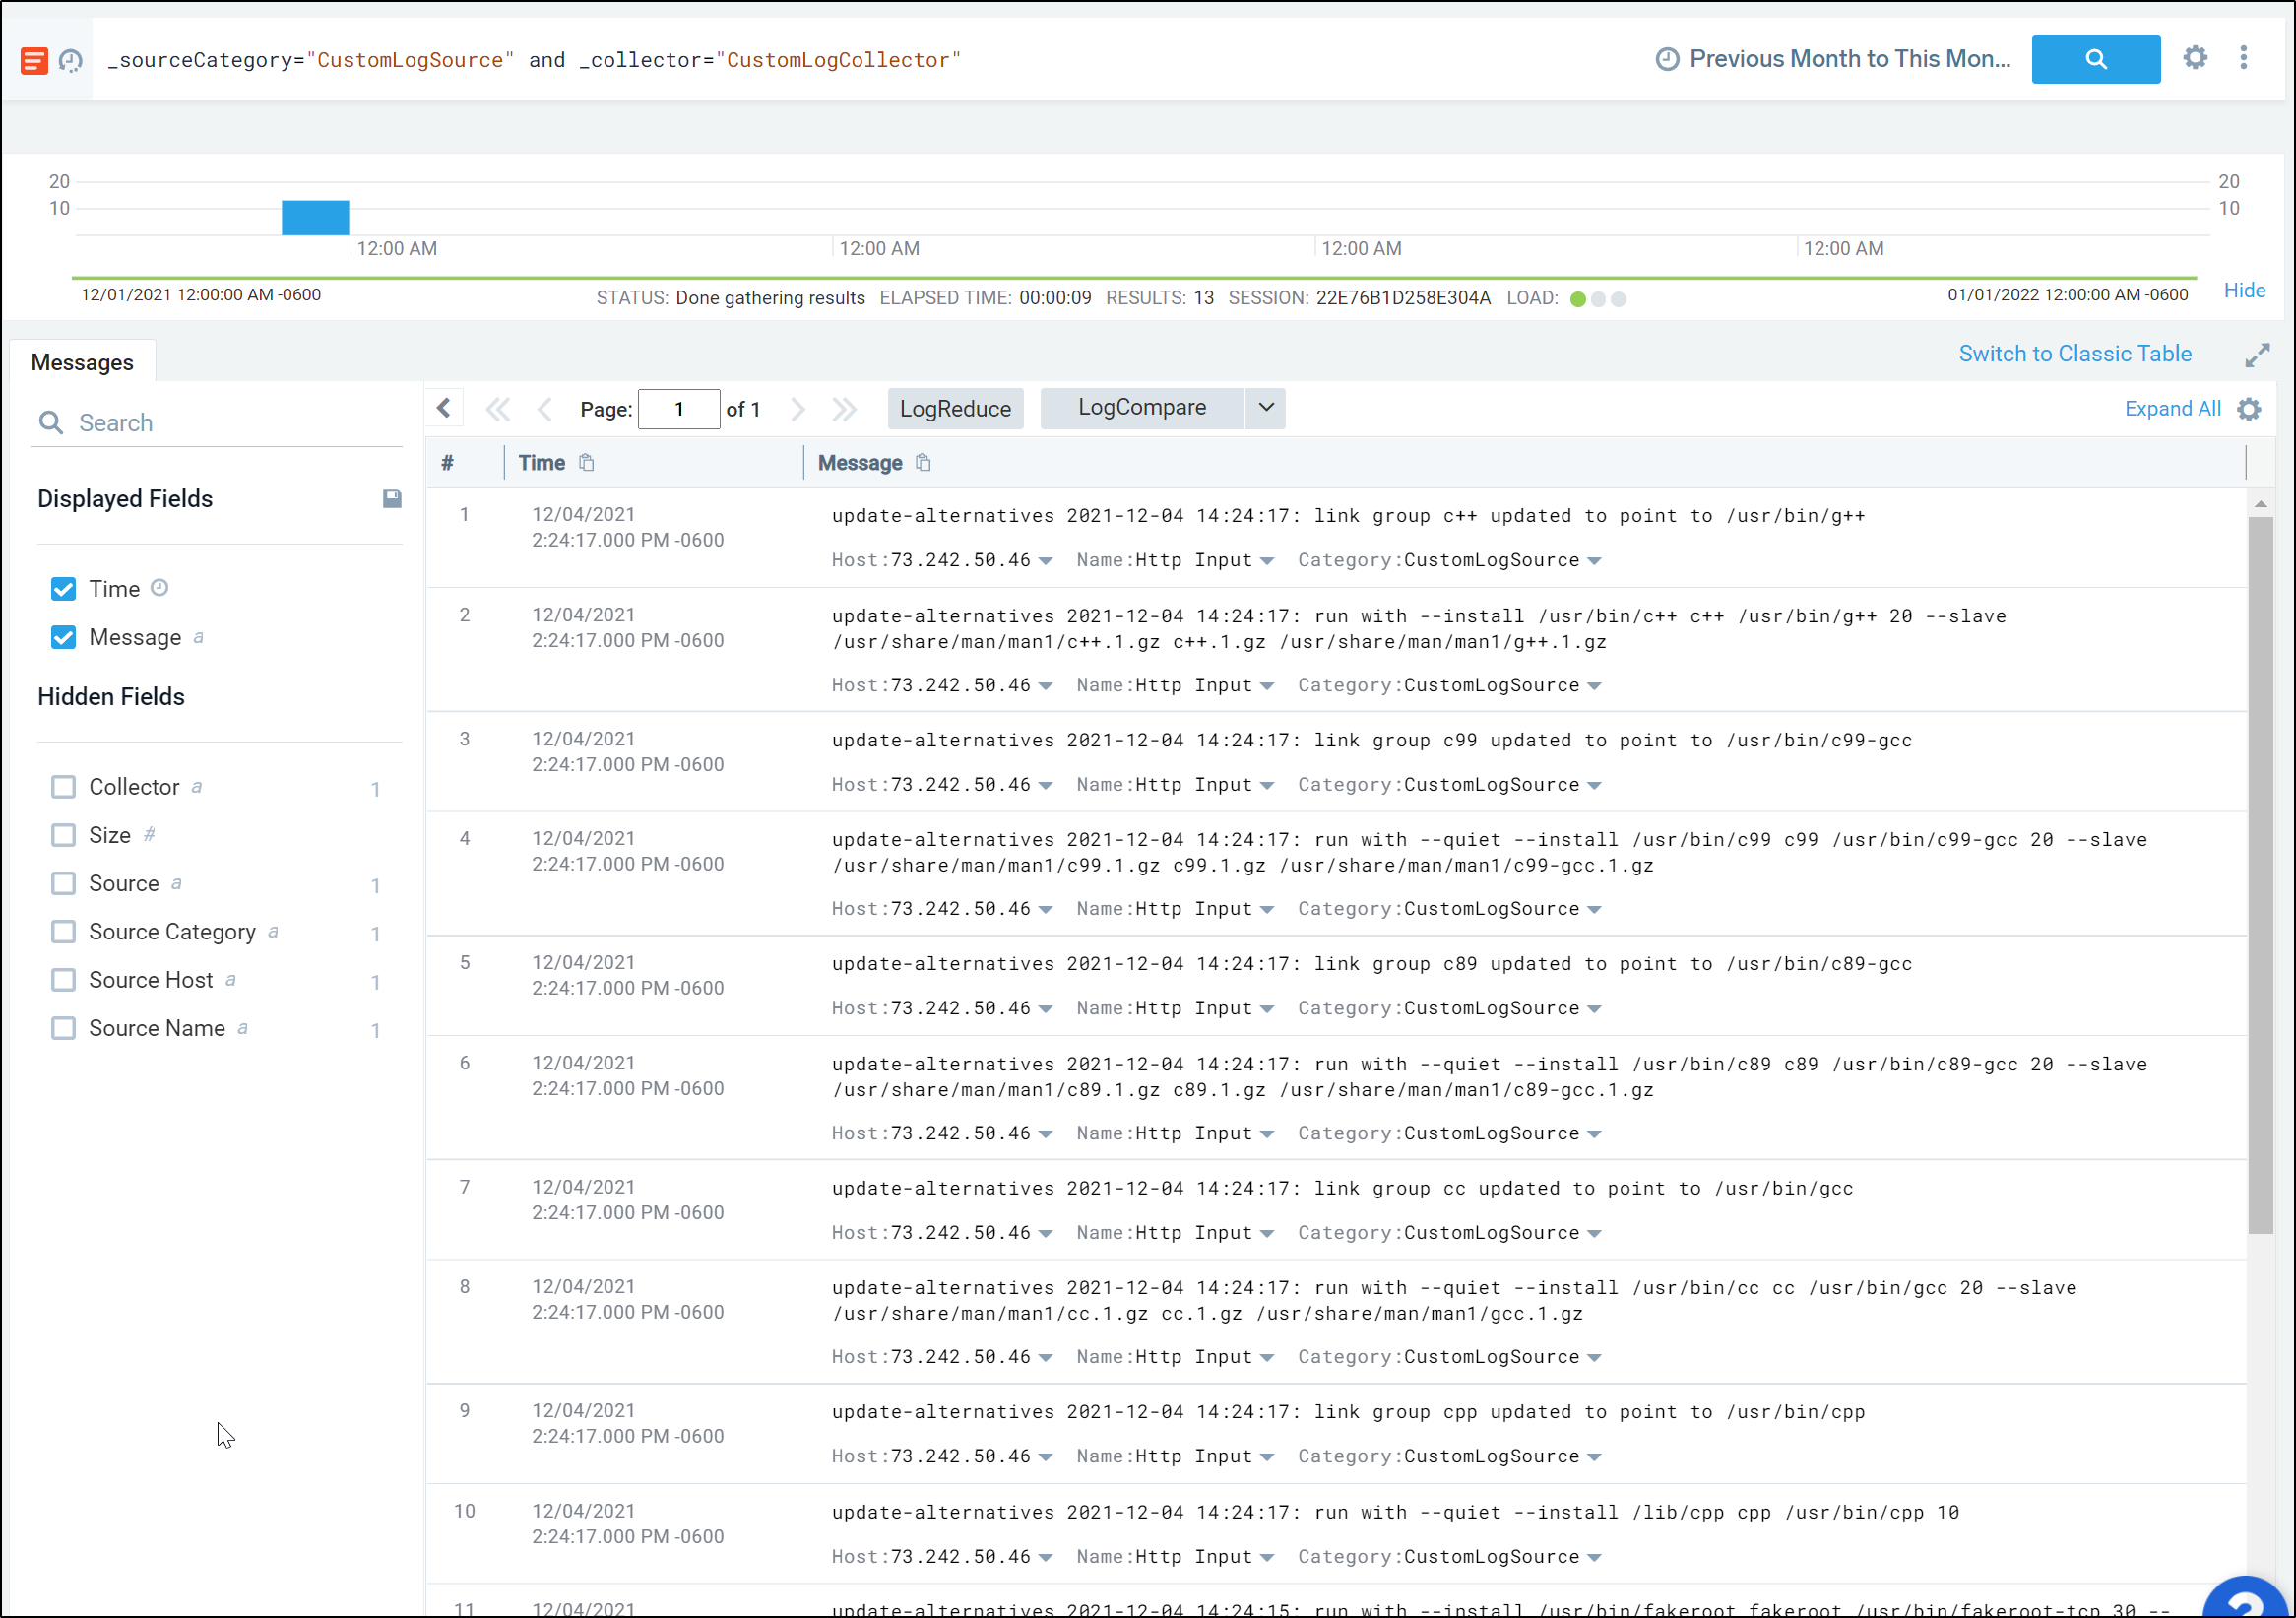
$ echo "Hello World" > Testing.log
$ curl -v -X POST -T ./Testing.log https://endpoint4.collection.sumologic.com/receiver/v1/http/ZaVnC4dhaV0a
UDPPpHY4gvDM4oNwgwi9TajMZ36ILDkreVEXGNV3S1MA46r9p1aIhBHFUgNoDs_3p5MOCn7QhcZ7SF1qjOC4duOH38jKGjKE8Bo6PtjXKw==
*   Trying 52.202.151.101:443...
Posting a log:
$ curl -v -X POST -T /home/builder/Workspaces/jekyll-blog/Testing.log https://endpoint4.collection.sumologic.com/receiver/v1/http/ZaVnC4dhaV0aUDPPpHY4gtnYyy3Kdm9D4gThU9P_vcnB4ZUePtZQOKtu66adyWT4W-DwqHFpMd9JmpV3wGSnQPkCUTky4dxpiM7i6uQ5riiVFf-x_cTtMQ==
*   Trying 3.94.38.95:443...
* TCP_NODELAY set
* Connected to endpoint4.collection.sumologic.com (3.94.38.95) port 443 (#0)
* ALPN, offering h2
* ALPN, offering http/1.1
* successfully set certificate verify locations:
*   CAfile: /etc/ssl/certs/ca-certificates.crt
  CApath: /etc/ssl/certs
* TLSv1.3 (OUT), TLS handshake, Client hello (1):
* TLSv1.3 (IN), TLS handshake, Server hello (2):
* TLSv1.2 (IN), TLS handshake, Certificate (11):
* TLSv1.2 (IN), TLS handshake, Server key exchange (12):
* TLSv1.2 (IN), TLS handshake, Server finished (14):
* TLSv1.2 (OUT), TLS handshake, Client key exchange (16):
* TLSv1.2 (OUT), TLS change cipher, Change cipher spec (1):
* TLSv1.2 (OUT), TLS handshake, Finished (20):
* TLSv1.2 (IN), TLS handshake, Finished (20):
* SSL connection using TLSv1.2 / ECDHE-RSA-AES128-GCM-SHA256
* ALPN, server accepted to use h2
* Server certificate:
*  subject: C=US; ST=California; L=Redwood City; O=Sumo Logic Inc.; OU=Information Technology; CN=endpoint1.collection.sumologic.com
*  start date: Feb  7 00:00:00 2020 GMT
*  expire date: Feb  6 12:00:00 2022 GMT
*  subjectAltName: host "endpoint4.collection.sumologic.com" matched cert's "endpoint4.collection.sumologic.com"
*  issuer: C=US; O=DigiCert Inc; OU=www.digicert.com; CN=GeoTrust RSA CA 2018
*  SSL certificate verify ok.
* Using HTTP2, server supports multi-use
* Connection state changed (HTTP/2 confirmed)
* Copying HTTP/2 data in stream buffer to connection buffer after upgrade: len=0
* Using Stream ID: 1 (easy handle 0x5641ee39ab60)
> POST /receiver/v1/http/ZaVnC4dhaV0aUDPPpHY4gtnYyy3Kdm9D4gThU9P_vcnB4ZUePtZQOKtu66adyWT4W-DwqHFpMd9JmpV3wGSnQPkCUTky4dxpiM7i6uQ5riiVFf-x_cTtMQ== HTTP/2
> Host: endpoint4.collection.sumologic.com
> user-agent: curl/7.68.0
> accept: */*
> content-length: 12
>
* Connection state changed (MAX_CONCURRENT_STREAMS == 128)!
* We are completely uploaded and fine
< HTTP/2 200
< date: Tue, 11 Jan 2022 00:58:37 GMT
< content-type: text/plain
< content-length: 0
< set-cookie: AWSALB=9C3oOQHupLUoFc35ETOH+b474c/h7R1Us/HwmJkv3QkrvbsKUfgnPX/Mrwgww8Ec/eBCj/ZEN8x71fZg/gmu2qgLxQ9oaRb6yZL+mO6pCdQGjphxzXeeDCFCn57i; Expires=Tue, 18 Jan 2022 00:58:37 GMT; Path=/
< set-cookie: AWSALBCORS=9C3oOQHupLUoFc35ETOH+b474c/h7R1Us/HwmJkv3QkrvbsKUfgnPX/Mrwgww8Ec/eBCj/ZEN8x71fZg/gmu2qgLxQ9oaRb6yZL+mO6pCdQGjphxzXeeDCFCn57i; Expires=Tue, 18 Jan 2022 00:58:37 GMT; Path=/; SameSite=None; Secure
< x-content-type-options: nosniff
< x-frame-options: SAMEORIGIN
< x-xss-protection: 1; mode=block
< strict-transport-security: max-age=15552000
<
* Connection #0 to host endpoint4.collection.sumologic.com left intact
And now we can see it posted into the logs:
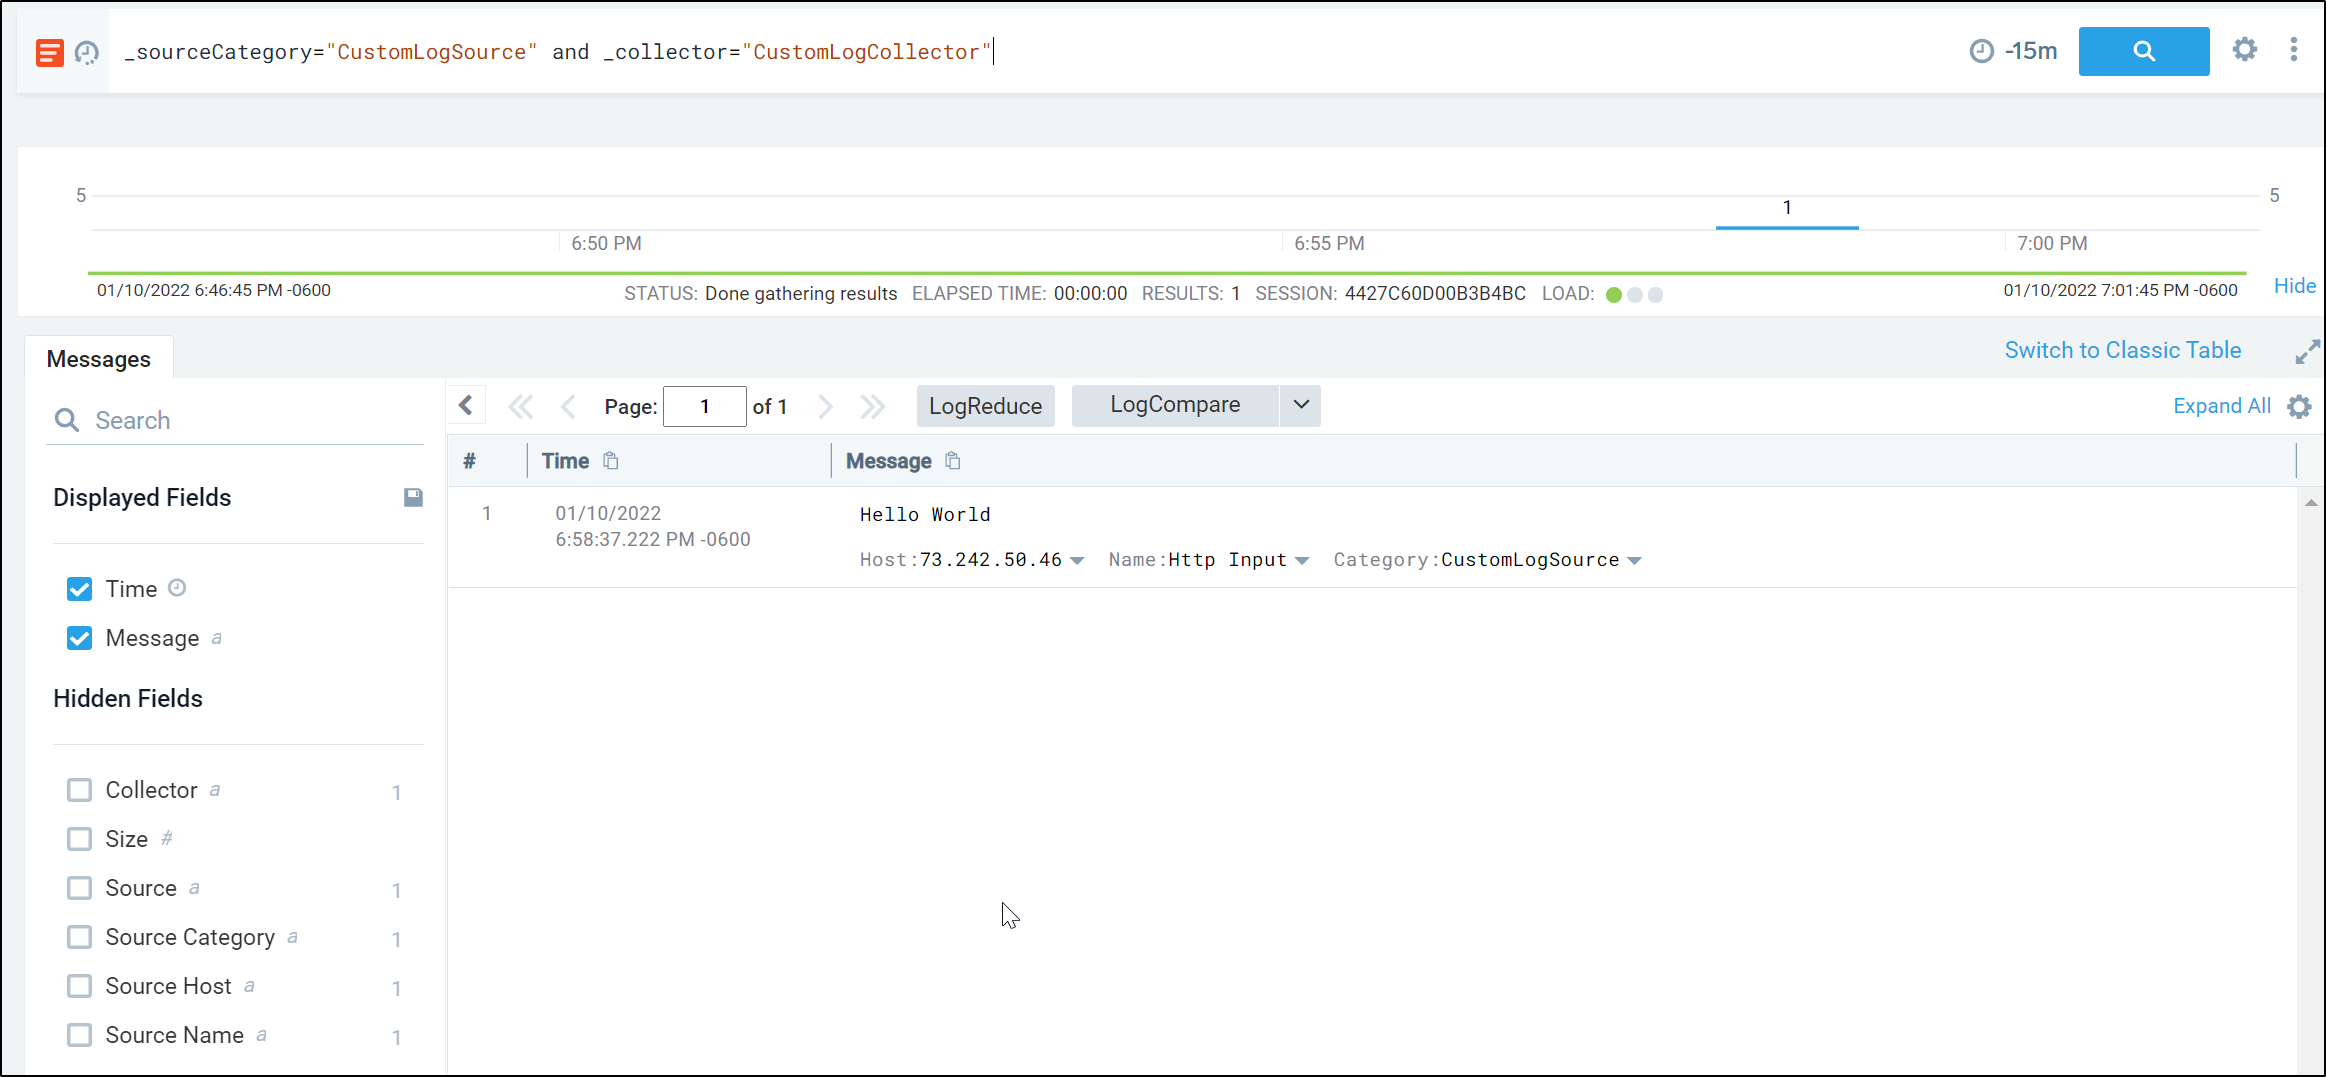
429 errors
Despite removing budgets and lowering ingest from k8s, i continue to get 429 errors:
HTTP ERROR 429 You have temporarily exceeded your Sumo Logic quota. Please try again at a later time.
I see from the “Days When Ingestion Exceeded Capacity” dashboard info pane that indeed, the last 3 days all hit the limit
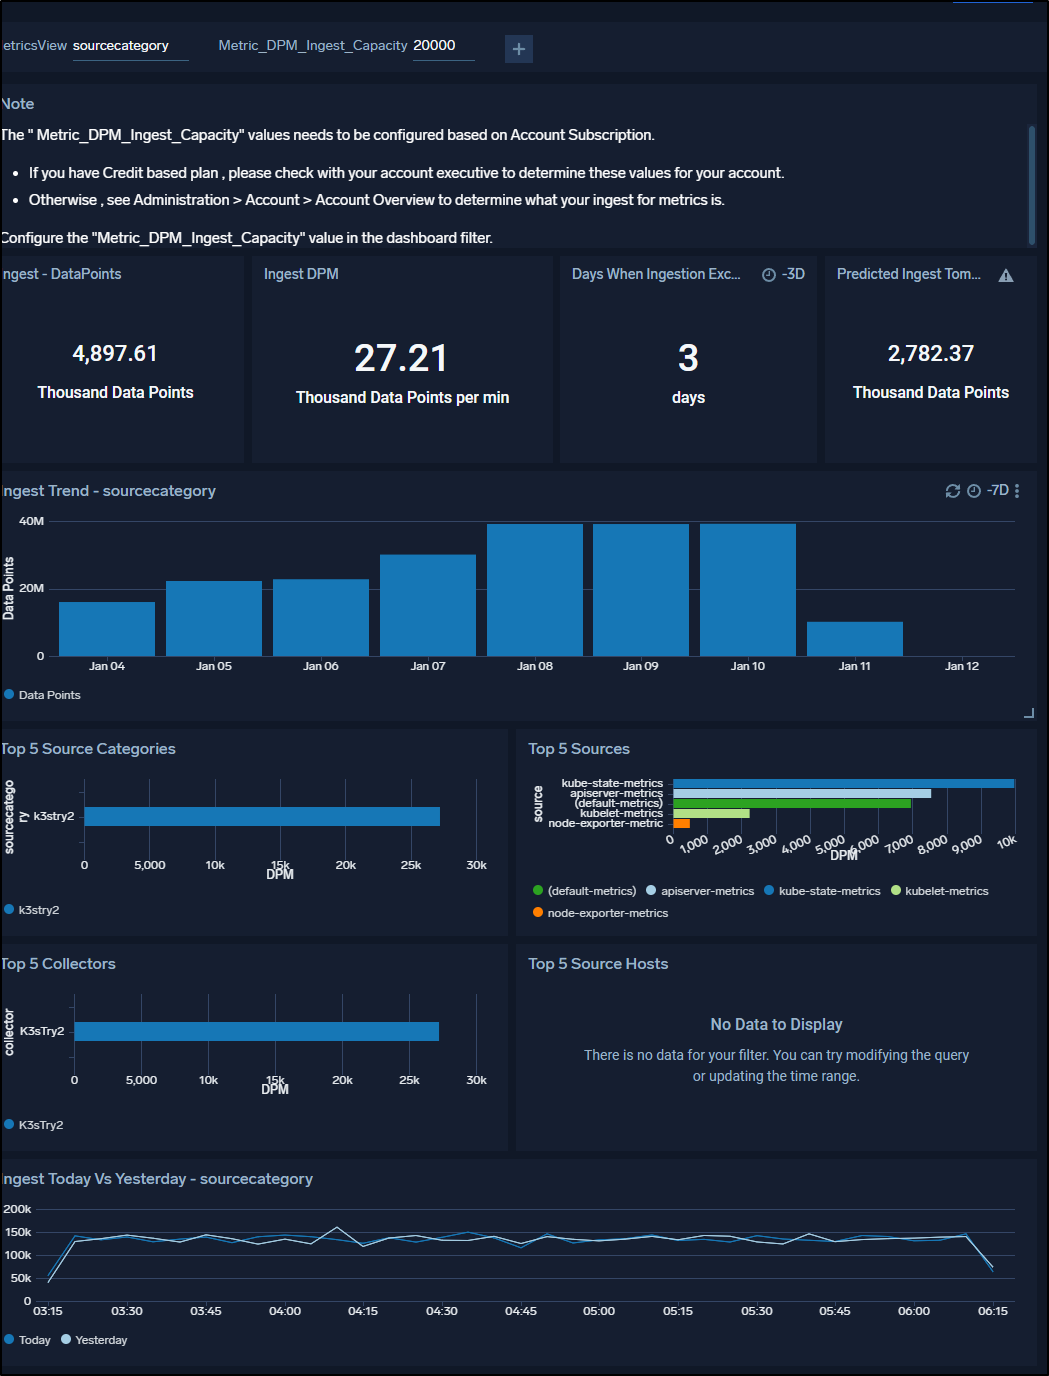
I can also see with the Summary it is still the Otel collector and nodeevent watcher that are consuming my log and metric volumes
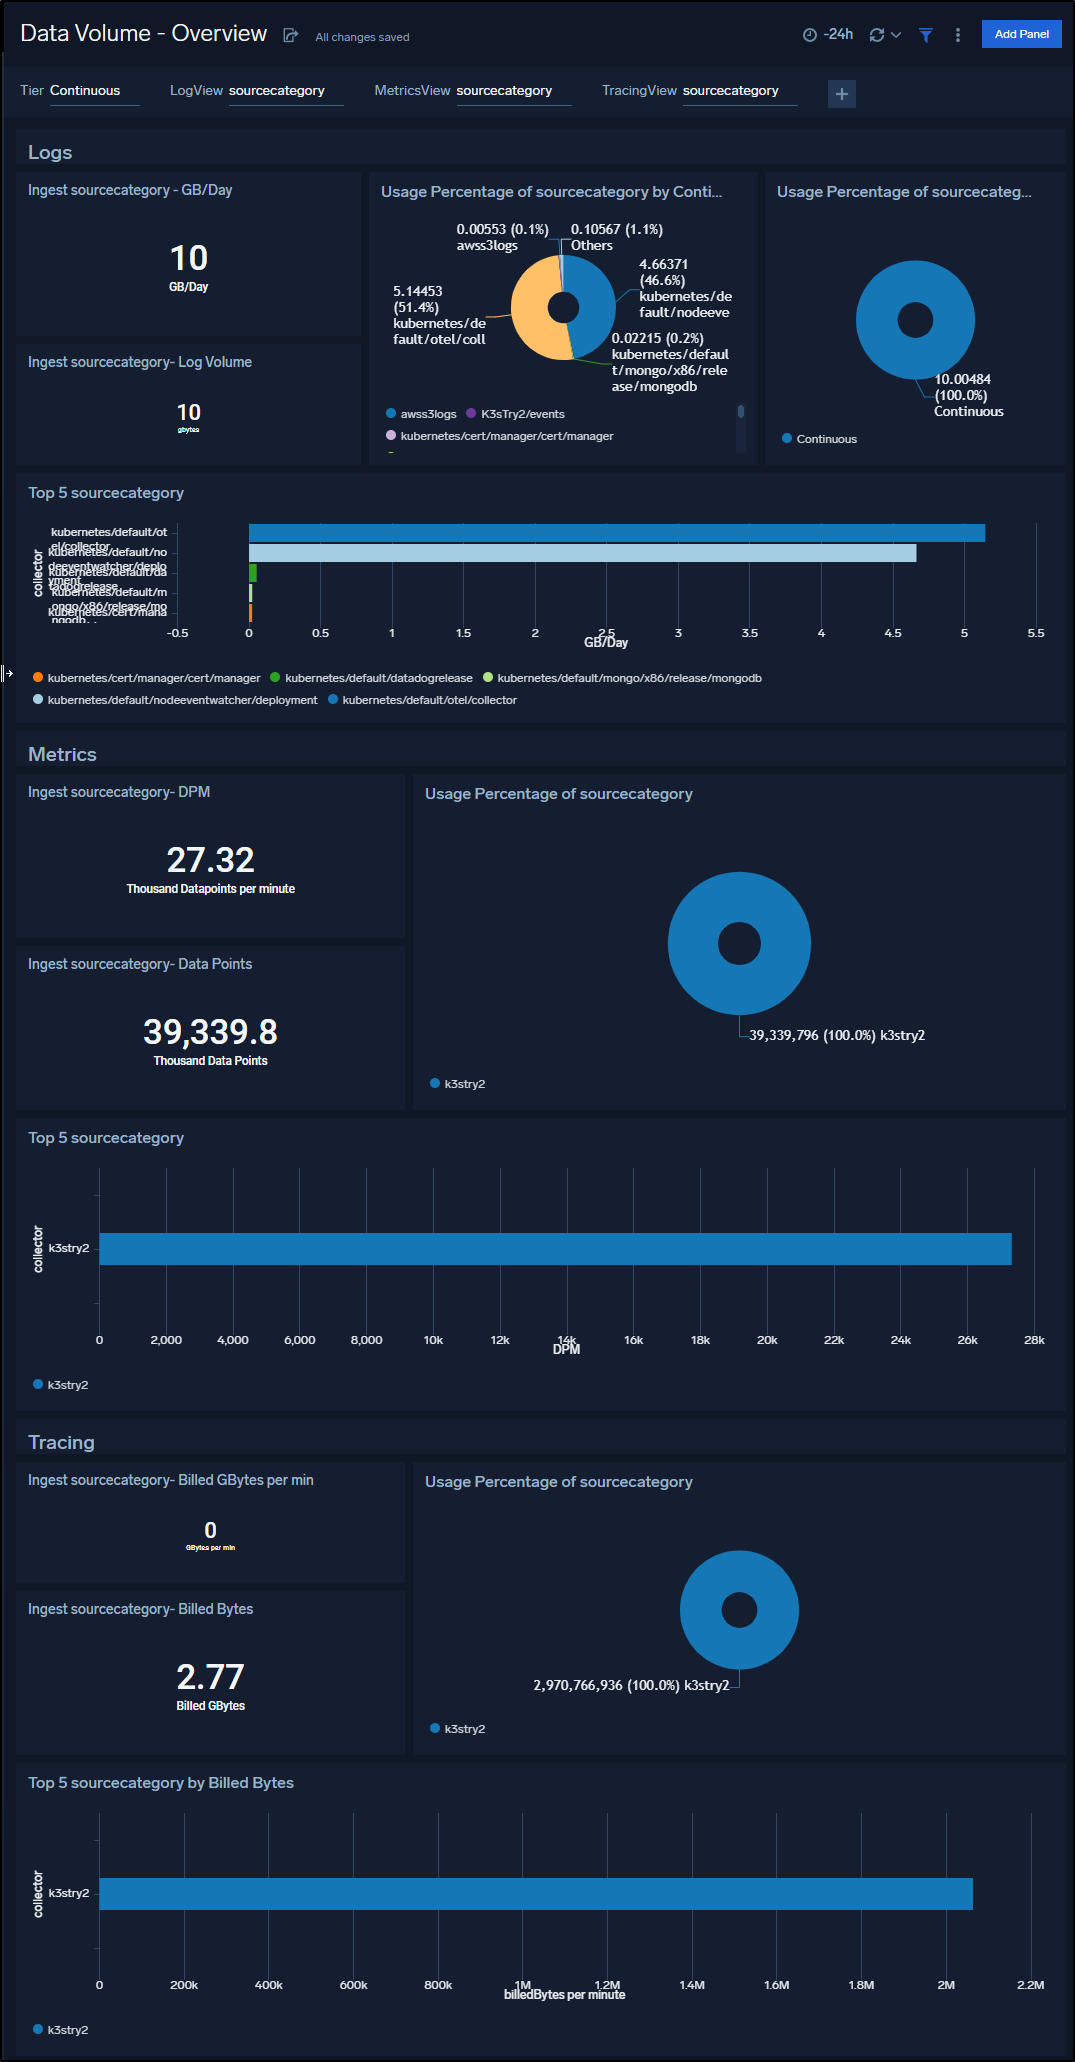
Looking at my cluster, I have things in crash loops
harbor-registry-harbor-database-0                       0/1     CrashLoopBackOff    1002       3d16h
nodeeventwatcher-deployment-75b446899b-t5pcl            0/2     CrashLoopBackOff    321        22h
my-runner-deployment-njn2k-c6kt5                        0/2     ContainerCreating   0          67s
I can see yesterday at 5a was when the pods started to crash. This was when i started to change the Dapr Configuration for the node event watcher.
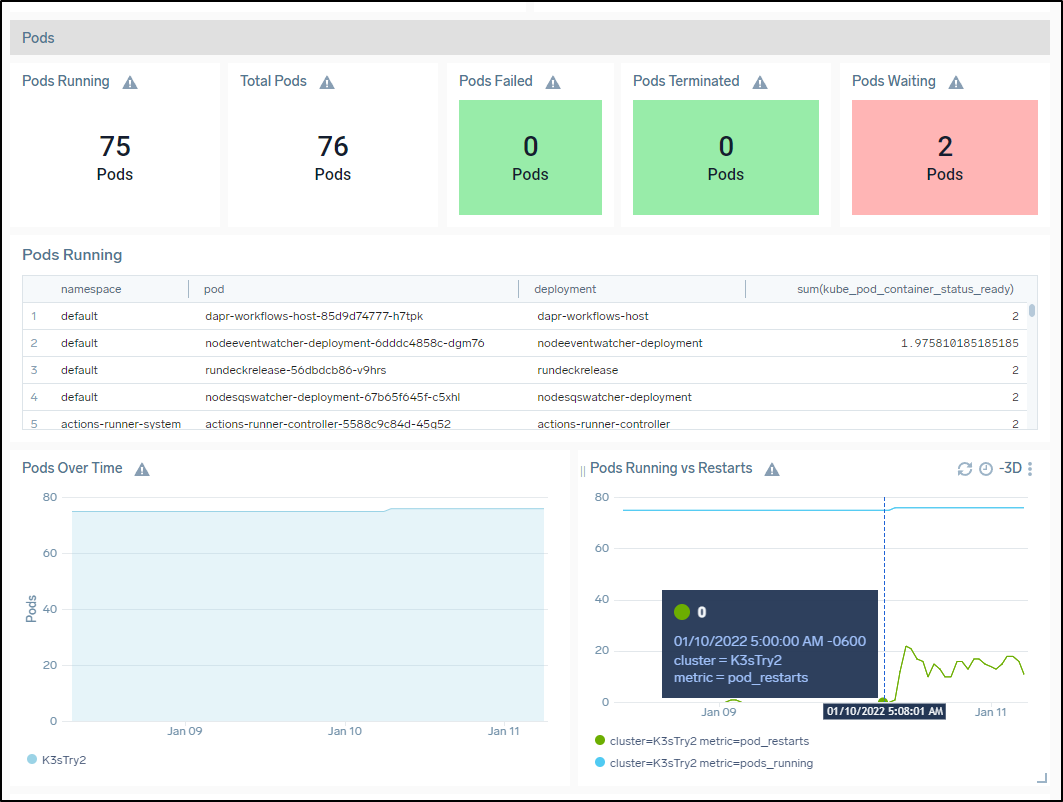
Cleanup
I generally backup my helm values first (in case I change my mind)
$ helm get values mysumorelease > sumo_values.yaml
Then remove
$ helm delete mysumorelease
W0111 06:53:43.783345    7599 warnings.go:70] policy/v1beta1 PodSecurityPolicy is deprecated in v1.21+, unavailable in v1.25+
W0111 06:53:43.827098    7599 warnings.go:70] policy/v1beta1 PodSecurityPolicy is deprecated in v1.21+, unavailable in v1.25+
W0111 06:53:43.831946    7599 warnings.go:70] policy/v1beta1 PodSecurityPolicy is deprecated in v1.21+, unavailable in v1.25+
W0111 06:53:43.850719    7599 warnings.go:70] policy/v1beta1 PodSecurityPolicy is deprecated in v1.21+, unavailable in v1.25+
release "mysumorelease" uninstalled
Note: If you had been following along the whole time, you’ll also want to remove the entry from the Open Telemetry conf:
$ kubectl get cm otel-collector-conf -o yaml > otel-collector-conf.yaml
$ cat otel-collector-conf.yaml
apiVersion: v1
data:
  otel-collector-config: |
    receivers:
      otlp:
        protocols:
          grpc:
            endpoint: 0.0.0.0:55680
          http:
            endpoint: 0.0.0.0:55681
      zipkin:
        endpoint: 0.0.0.0:9411
      prometheus:
        config:
          scrape_configs:
            - job_name: 'otel-collector'
              scrape_interval: 10s
              static_configs:
                - targets: [ '0.0.0.0:8888' ]
    extensions:
      health_check:
      pprof:
        endpoint: :1888
      zpages:
        endpoint: :55679
    exporters:
      otlp/insecure:
        endpoint: 192.168.1.32:4317
        tls:
          insecure: true
      logging:
        loglevel: debug

      # otlp:
      #   endpoint: "10.43.182.221:4317"
      #   tls:
      #     insecure: true
      # zipkin:
      #   endpoint: "http://10.43.182.221:9411/api/v2/spans"
      # Depending on where you want to export your trace, use the
      # correct OpenTelemetry trace exporter here.
      #
      # Refer to
      # https://github.com/open-telemetry/opentelemetry-collector/tree/main/exporter
      # and
      # https://github.com/open-telemetry/opentelemetry-collector-contrib/tree/main/exporter
      # for full lists of trace exporters that you can use, and how to
      # configure them.
      azuremonitor:
        instrumentation_key: "7db4a1e8-asdf-asfd-asdf-4575551c80da"
        endpoint: "https://centralus-2.in.applicationinsights.azure.com/v2/track"
      datadog:
        api:
          key: "asdfasdfasdfasdfasdfasdfsadf"

    service:
      extensions: [pprof, zpages, health_check]
      pipelines:
        traces:
          receivers: [zipkin]
          # List your exporter here.
          exporters: [azuremonitor, datadog, otlp/insecure, logging]
        metrics:
          receivers: [prometheus]
          exporters: [otlp/insecure]
kind: ConfigMap
metadata:
  annotations:
    kubectl.kubernetes.io/last-applied-configuration: |
      {"apiVersion":"v1","data":{"otel-collector-config":"receivers:\n  otlp:\n    protocols:\n      grpc:\n        endpoint: 0.0.0.0:55680\n      http:\n        endpoint: 0.0.0.0:55681\n  zipkin:\n    endpoint: 0.0.0.0:9411\n  prometheus:\n    config:\n      scrape_configs:\n        - job_name: 'otel-collector'\n          scrape_interval: 10s\n          static_configs:\n            - targets: [ '0.0.0.0:8888' ]\nextensions:\n  health_check:\n  pprof:\n    endpoint: :1888\n  zpages:\n    endpoint: :55679\nexporters:\n  otlp/insecure:\n    endpoint: 192.168.1.32:4317\n    tls:\n      insecure: true\n  logging:\n    loglevel: debug\n    \n  otlp:\n    endpoint: \"10.43.182.221:4317\"\n    tls:\n      insecure: true\n  zipkin:\n    endpoint: \"http://10.43.182.221:9411/api/v2/spans\"\n  # Depending on where you want to export your trace, use the\n  # correct OpenTelemetry trace exporter here.\n  #\n  # Refer to\n  # https://github.com/open-telemetry/opentelemetry-collector/tree/main/exporter\n  # and\n  # https://github.com/open-telemetry/opentelemetry-collector-contrib/tree/main/exporter\n  # for full lists of trace exporters that you can use, and how to\n  # configure them.\n  azuremonitor:\n    instrumentation_key: \"7db4a1e8-asdf-asfd-asdf-4575551c80da\"\n    endpoint: \"https://centralus-2.in.applicationinsights.azure.com/v2/track\"\n  datadog:\n    api:\n      key: \"asdfasdfasdfasdfasdfasdfsadf\"\n\nservice:\n  extensions: [pprof, zpages, health_check]\n  pipelines:\n    traces:\n      receivers: [zipkin]\n      # List your exporter here.\n      exporters: [azuremonitor, datadog, otlp/insecure, otlp, zipkin, logging]\n    metrics:\n      receivers: [prometheus]\n      exporters: [otlp/insecure]\n"},"kind":"ConfigMap","metadata":{"annotations":{},"creationTimestamp":"2021-04-16T01:10:08Z","labels":{"app":"opentelemetry","component":"otel-collector-conf"},"name":"otel-collector-conf","namespace":"default","resourceVersion":"144977871","uid":"caae6b5c-b4ea-44f6-8ede-4824a51e2563"}}
  creationTimestamp: "2021-04-16T01:10:08Z"
  labels:
    app: opentelemetry
    component: otel-collector-conf
  name: otel-collector-conf
  namespace: default
  resourceVersion: "159241135"
  uid: caae6b5c-b4ea-44f6-8ede-4824a51e2563
$ kubectl apply -f otel-collector-conf.yaml
configmap/otel-collector-conf configured
Rotate the Otel pod to take effect
$ kubectl get pods | grep otel
otel-collector-85b54fbfdc-d4j2z                         1/1     Running            0          3d17h
$ kubectl delete pod otel-collector-85b54fbfdc-d4j2z
pod "otel-collector-85b54fbfdc-d4j2z" deleted
If we change our minds, adding back Sumo is as simple as a helm install (note, remove the “USER SUPPLIED VALUES:” first line in the yaml if you just did a helm values to file)
$ helm upgrade --install mysumorelease -f sumo_values.yaml sumologic/sumologic
Release "mysumorelease" does not exist. Installing it now.
W0111 07:06:35.971607    8334 warnings.go:70] policy/v1beta1 PodSecurityPolicy is deprecated in v1.21+, unavailable in v1.25+
W0111 07:06:35.976512    8334 warnings.go:70] policy/v1beta1 PodSecurityPolicy is deprecated in v1.21+, unavailable in v1.25+
W0111 07:06:35.984005    8334 warnings.go:70] policy/v1beta1 PodSecurityPolicy is deprecated in v1.21+, unavailable in v1.25+
W0111 07:06:35.990539    8334 warnings.go:70] policy/v1beta1 PodSecurityPolicy is deprecated in v1.21+, unavailable in v1.25+
W0111 07:07:33.665984    8334 warnings.go:70] policy/v1beta1 PodSecurityPolicy is deprecated in v1.21+, unavailable in v1.25+
W0111 07:07:33.671001    8334 warnings.go:70] policy/v1beta1 PodSecurityPolicy is deprecated in v1.21+, unavailable in v1.25+
W0111 07:07:33.673449    8334 warnings.go:70] policy/v1beta1 PodSecurityPolicy is deprecated in v1.21+, unavailable in v1.25+
W0111 07:07:33.677923    8334 warnings.go:70] policy/v1beta1 PodSecurityPolicy is deprecated in v1.21+, unavailable in v1.25+
NAME: mysumorelease
LAST DEPLOYED: Tue Jan 11 07:06:34 2022
NAMESPACE: default
STATUS: deployed
REVISION: 1
NOTES:
Thank you for installing sumologic.

A Collector with the name "K3sTry2" has been created in your Sumo Logic account.

Check the release status by running:
  kubectl --namespace default get pods -l "release=mysumorelease"

We've tried to automatically create fields. In an unlikely scenario that this
fails please refer to the following to create them manually:
https://github.com/SumoLogic/sumologic-kubernetes-collection/blob/2b3ca63/deploy/docs/Installation_with_Helm.md#prerequisite
If we go to the “Kubernetes - Deployment” Dashboard we can actually see the 20 minute dip in monitoring from when i removed the chart:
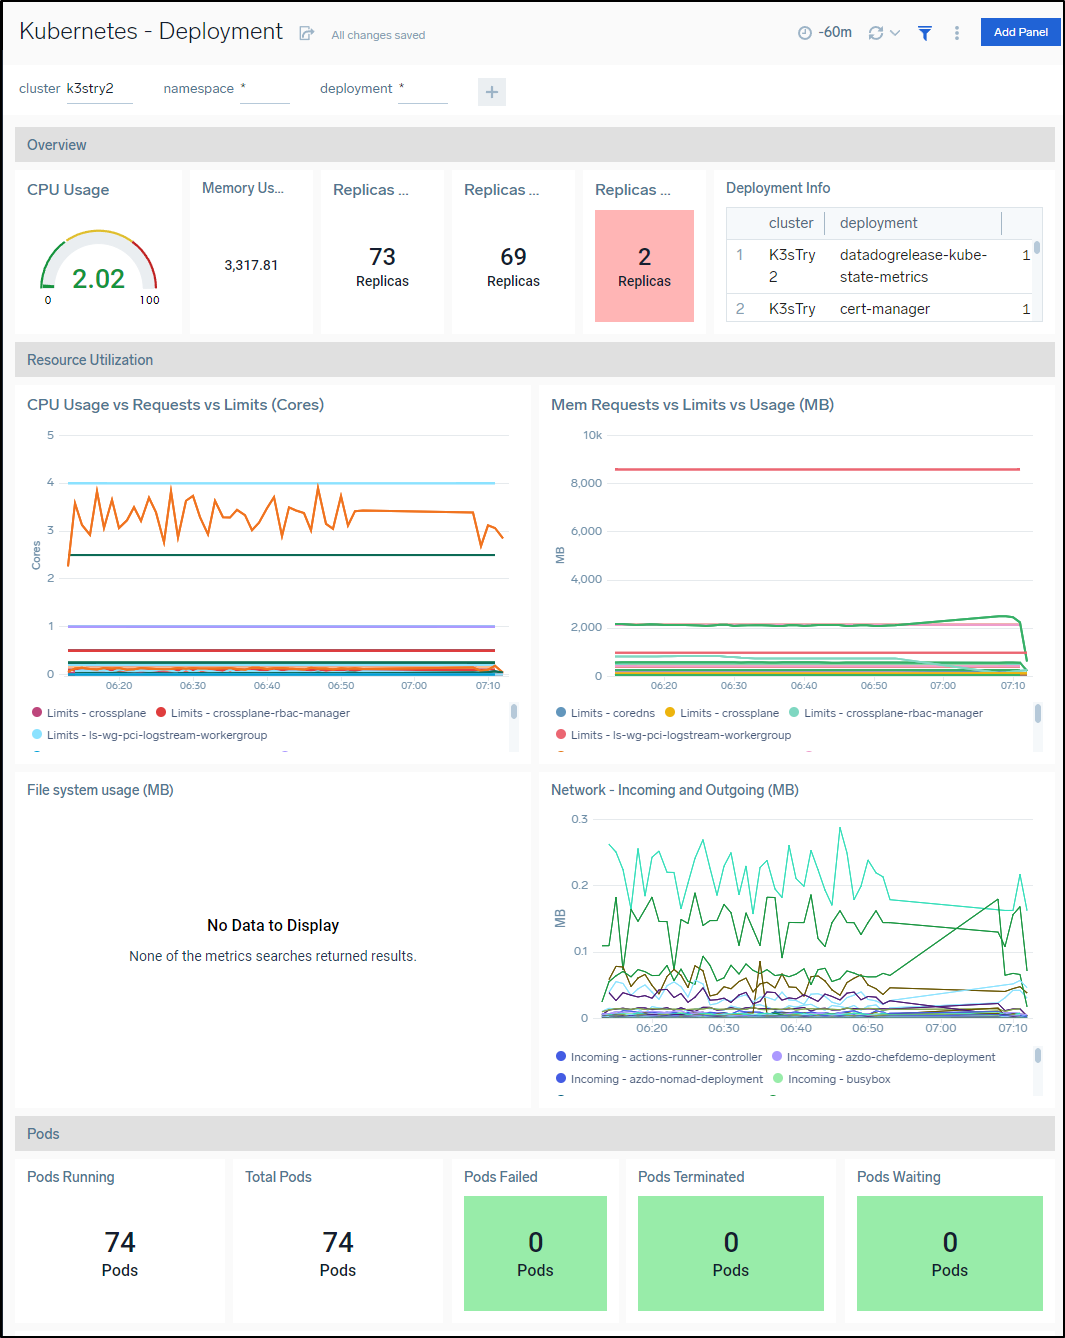
Note: In the end, I did remove the deployment as it overwhelmed my cluster and caused Harbor to crash which had many downstream effects
Summary
Sumo Logic has some really great features and a few limitations worth mentioning.
The Helm deployment, when including the Metrics and Otel Agent creates around 32 pods on a 7 node cluster
mysumorelease-fluent-bit-btvbx
mysumorelease-fluent-bit-f984m
mysumorelease-fluent-bit-gbmqc
mysumorelease-fluent-bit-gt57n
mysumorelease-fluent-bit-h98rk
mysumorelease-fluent-bit-knbqc
mysumorelease-fluent-bit-zjmp5
mysumorelease-kube-prometh-operator-77fb54985d-b7hz4
mysumorelease-kube-state-metrics-5fb7b7b599-p95v7
mysumorelease-prometheus-node-exporter-2pqhj
mysumorelease-prometheus-node-exporter-2ztfp
mysumorelease-prometheus-node-exporter-f47qm
mysumorelease-prometheus-node-exporter-hwstb
mysumorelease-prometheus-node-exporter-khnkr
mysumorelease-prometheus-node-exporter-m9mf8
mysumorelease-prometheus-node-exporter-vfddl
mysumorelease-sumologic-fluentd-events-0
mysumorelease-sumologic-fluentd-logs-0
mysumorelease-sumologic-fluentd-logs-1
mysumorelease-sumologic-fluentd-logs-2
mysumorelease-sumologic-fluentd-metrics-0
mysumorelease-sumologic-fluentd-metrics-1
mysumorelease-sumologic-fluentd-metrics-2
mysumorelease-sumologic-otelagent-9ftm9
mysumorelease-sumologic-otelagent-cwg6j
mysumorelease-sumologic-otelagent-p4hw9
mysumorelease-sumologic-otelagent-qs45w
mysumorelease-sumologic-otelagent-sxdjn
mysumorelease-sumologic-otelagent-xlsfm
mysumorelease-sumologic-otelagent-zrf8k
mysumorelease-sumologic-otelcol-64f44bd759-wmncq
prometheus-mysumorelease-kube-prometh-prometheus-0
I found in AKS that required at least 4 worker nodes. And at home, I added the 7th node to accommodate the deployment, but it was testy and I often had to tweak settings.
Additionally, I got 429 errors far more than I would like, whether that was from the command line:
HTTP ERROR 429 You have temporarily exceeded your Sumo Logic quota. Please try again at a later time.
or via Webhook deliveries
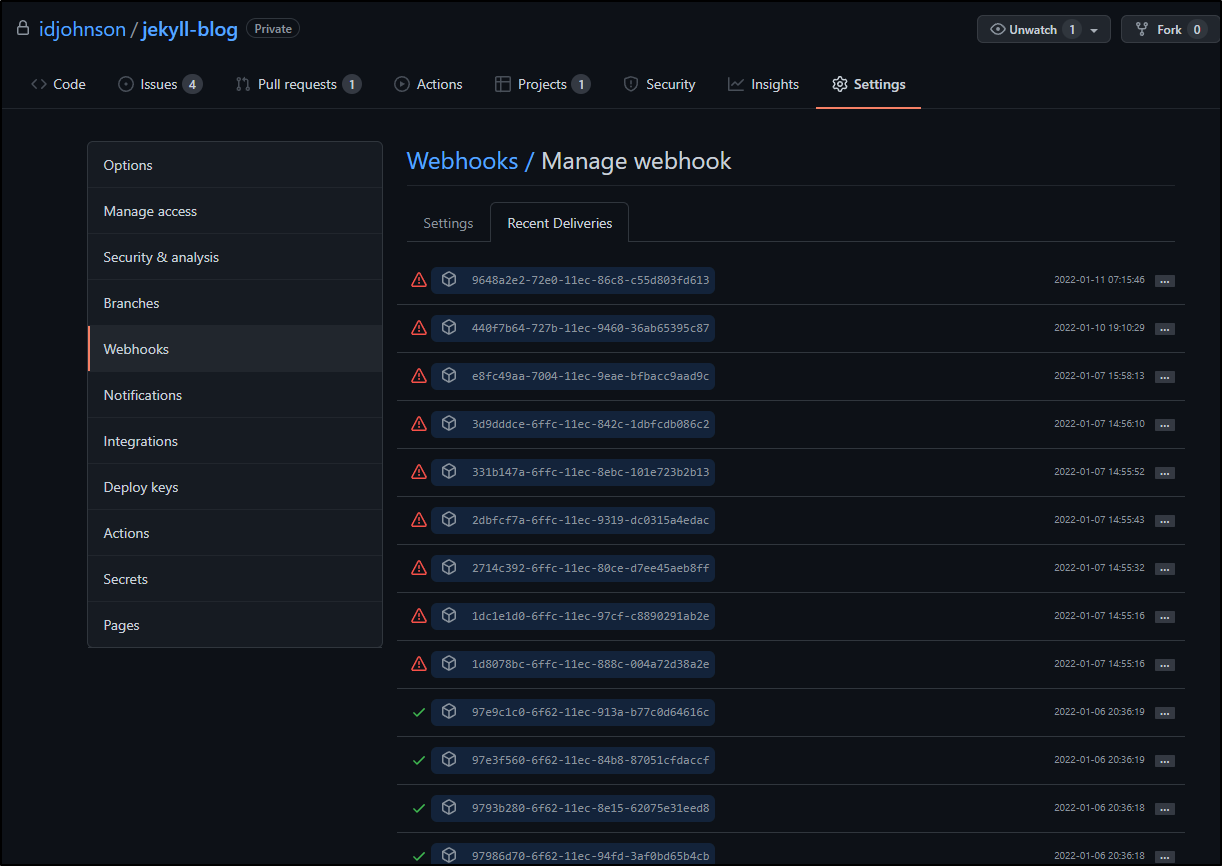
I would not call that a deal breaker. There are limits in a free trial and since I was beating the snot out of Sumo trying everything I could imagine, I’m guessing I push the trial a bit harder than most.
I still find it frustrating that if I had used the curl method for delivery of build logs, i would have missed them and my github data would be incomplete due to failed deliveries. I would have preferred ingestion get slowed.
But again, I assume in a paid version, these issues could get sorted out.
I had heard anecdotally that the max period for log retention was some small number. The Sumo Docs show that the minimum is 1 day and the maximum is 5000 days (over 13.5y)
Just to test, I found it easy to change from the default 30d to 60d without issue
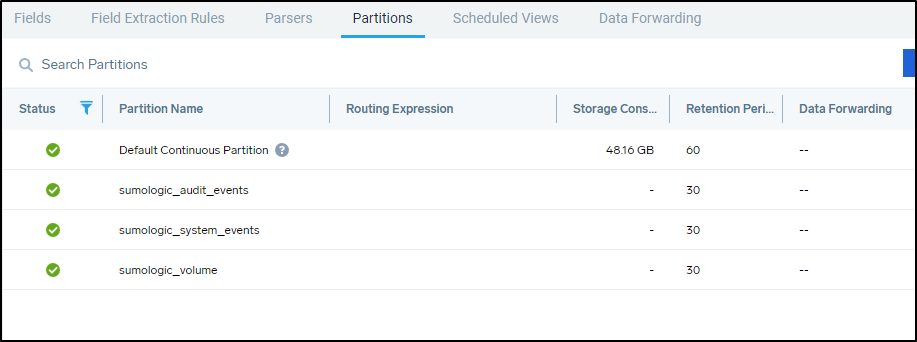
The good parts of Sumo Logic are the many ways we can ingest data, visualize it and lastly action upon it. Throughout this three part deep dive we have integrated with linux, windows and container schedulers like Kubernetes. We have triggered alerts to Teams, emails and even actionable runbooks in Pagerduty Rundeck. We created custom ingestion with curl and (attempted) to minimize credit overspend with budgets.
Overall, I find Sumo Logic incredibly functional, but requiring a fair amount of tinkering. I could imagine comparing SumoLogic and Datadog like comparing a VW Type 2 Bus and a Mercedez-Benz Sprinter. Both are going to deliver your business needs. The Sprinter will just work. You could put a million miles on that engine without issue. It has the power to get anywhere and the support to always work. But you aren’t going to be messing under the hood. You can wrap the Sprinter with some logo’ed graphics, but a Sprinter is a Sprinter. The VW Bus is going to take work. You have to source some parts. You have to be good in the garage and okay if it sometimes stalls on the Interstate. However, you can customize the snot out of it. It has style, it has flair. If you know what you are doing, you can run it for pennies a mile on McDonalds fry oil. You have to want to tinker though. You have to be comfortable getting dirty.
And maybe to draw that analogy up a level. If you’re a group or a company with tighter budgets, or a really well-oiled DevOps or Operations group that, frankly, is just itching for an excuse to script things, then send them to Sumologic. However, if you are looking to Ron Popeil it; ‘set it and forget it’.. then get something like Datadog. If you have a fat budget and care more about scalability than cost optimization, I would lean towards the larger players like Datadog, NewRelic or Dynatrace.
If the Kubernetes deployment didn’t continue to crash my cluster (and I will revisit that), I personally might opt to pay for Sumo out of pocket. I really had fun. When can you say that about an APM product? ; that you had fun. None too often. I have had legitimate fun with Datadog and Sumo Logic thus far and both will be my first picks when asked for APM and Logging options.