

Published: Jan 7, 2022 by Isaac Johnson
In our last post we covered the History, Setup and usage with a Linux collector. We then moved onto monitoring Kubernetes, AWS S3 and Cloudfront, Azure Event Hub and lastly touched on Monitors.
Today we will look at more integrations including monitoring Pipelines in Github, the “Usage” integration for Data Volume usage (which can help on price estimations). We will revisit our Linux collector and look at a Windows Collector as well including Performance Monitors. Circling back to monitors, we will dig into more integration connectors including Microsoft Teams, Integration with Rundeck and Datadog (events), and lastly look at Users and Roles before moving into a breakdown on Pricing and Budgets (with a commentary on optimizing S3 Logs).
Github
Let’s try monitoring our Github Pull Requests. We will follow this guide for the most part (albeit focus on a Repo first).
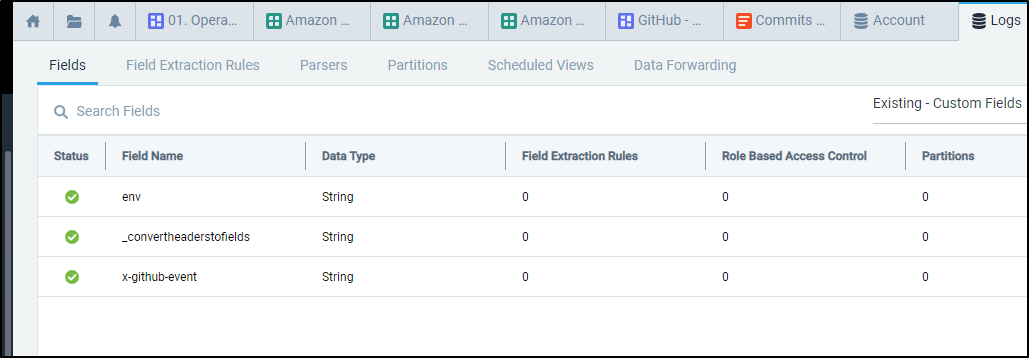
We need to add a Field (x-github-event) first to properly parse events.
We can now start the collector wizard up for the Github app
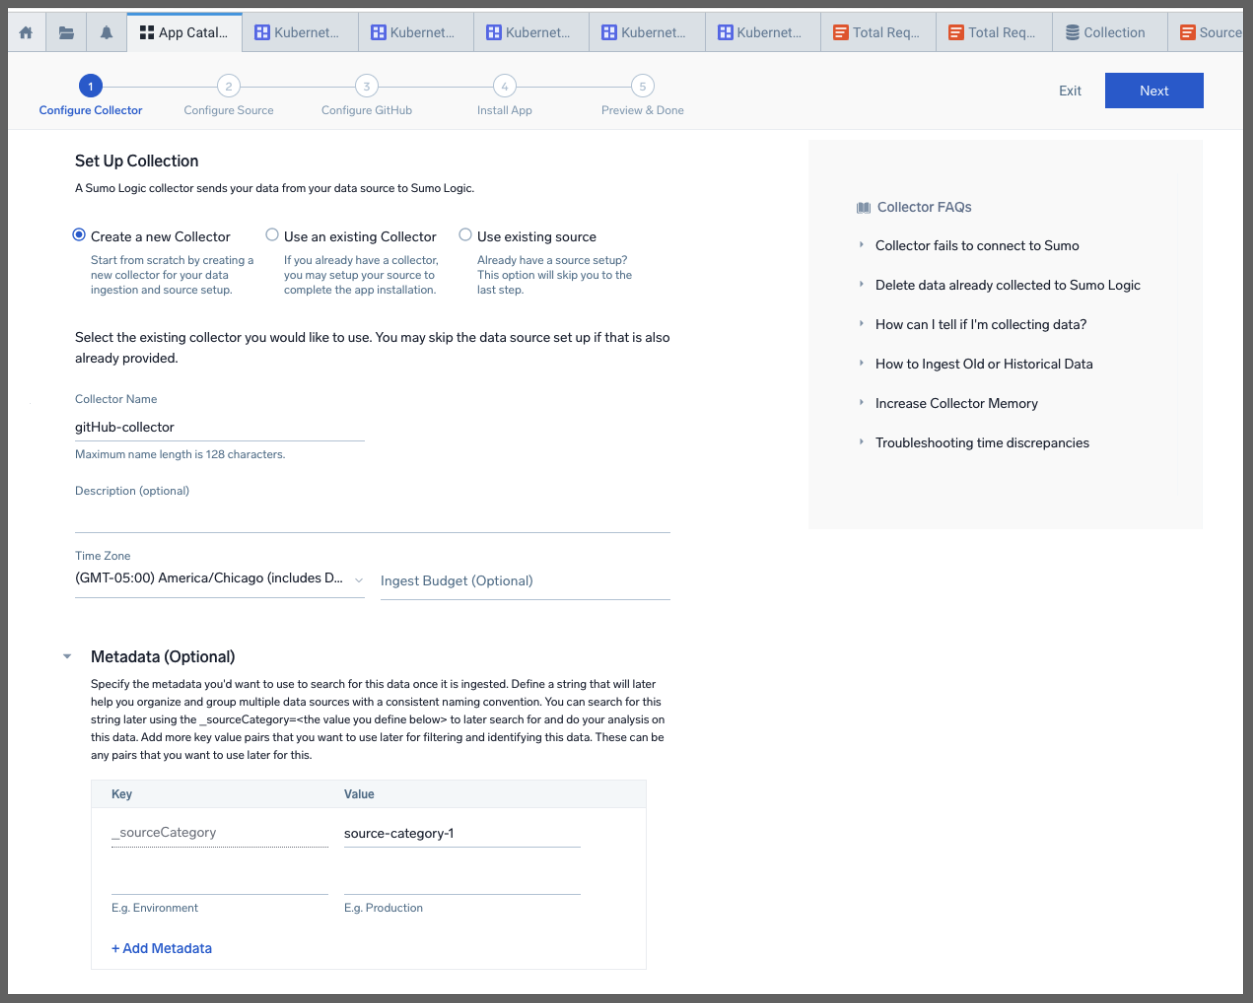
We can give it a name and description
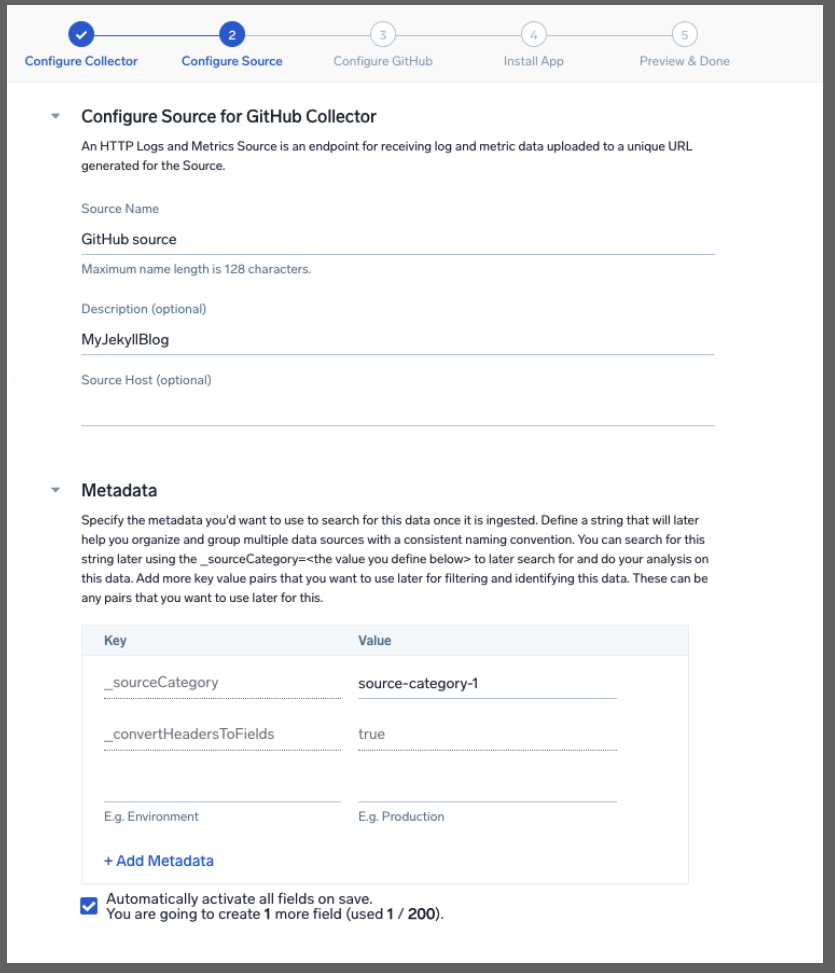
The next steps in the wizard speak to adding it for an Organization. However, for this test, we’ll just add to one repo
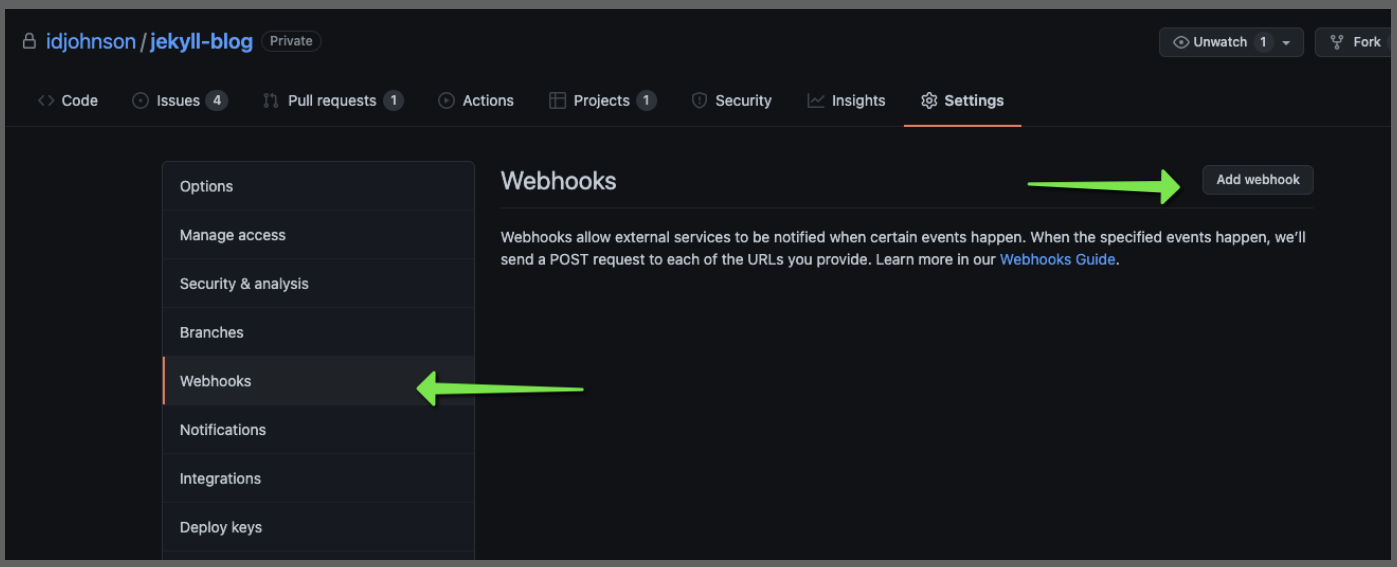
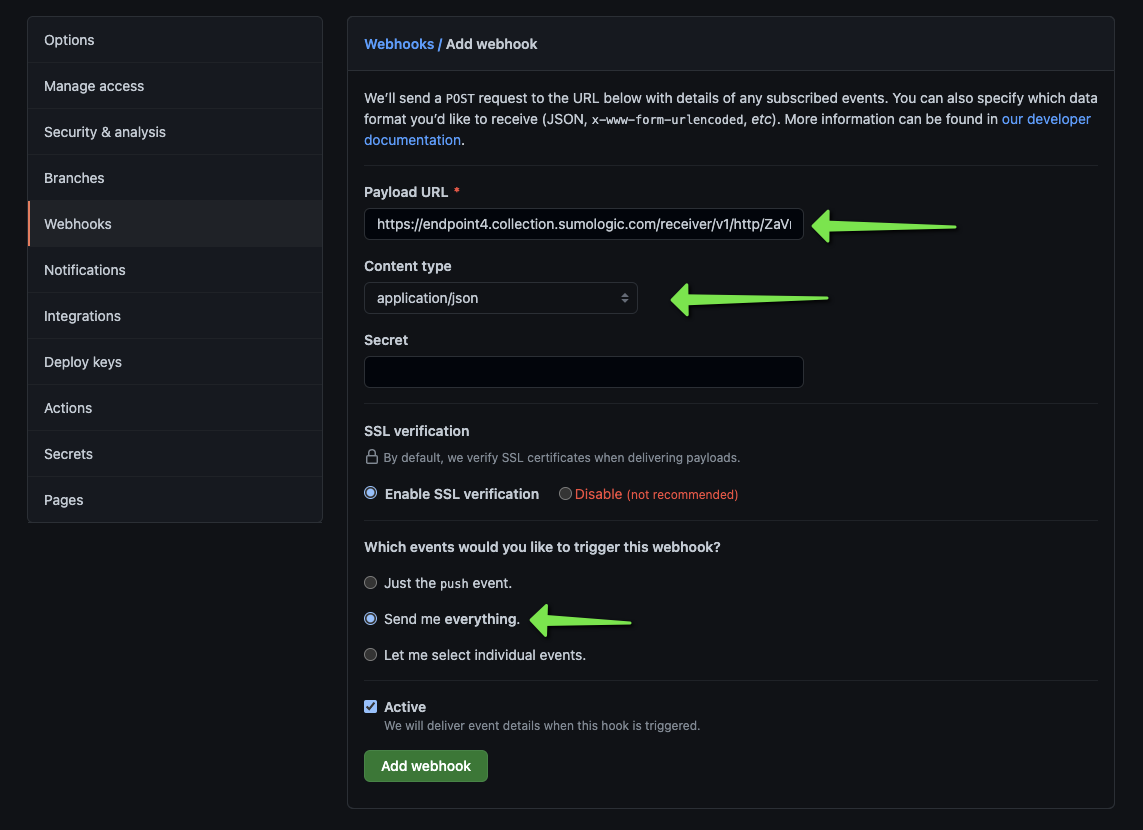
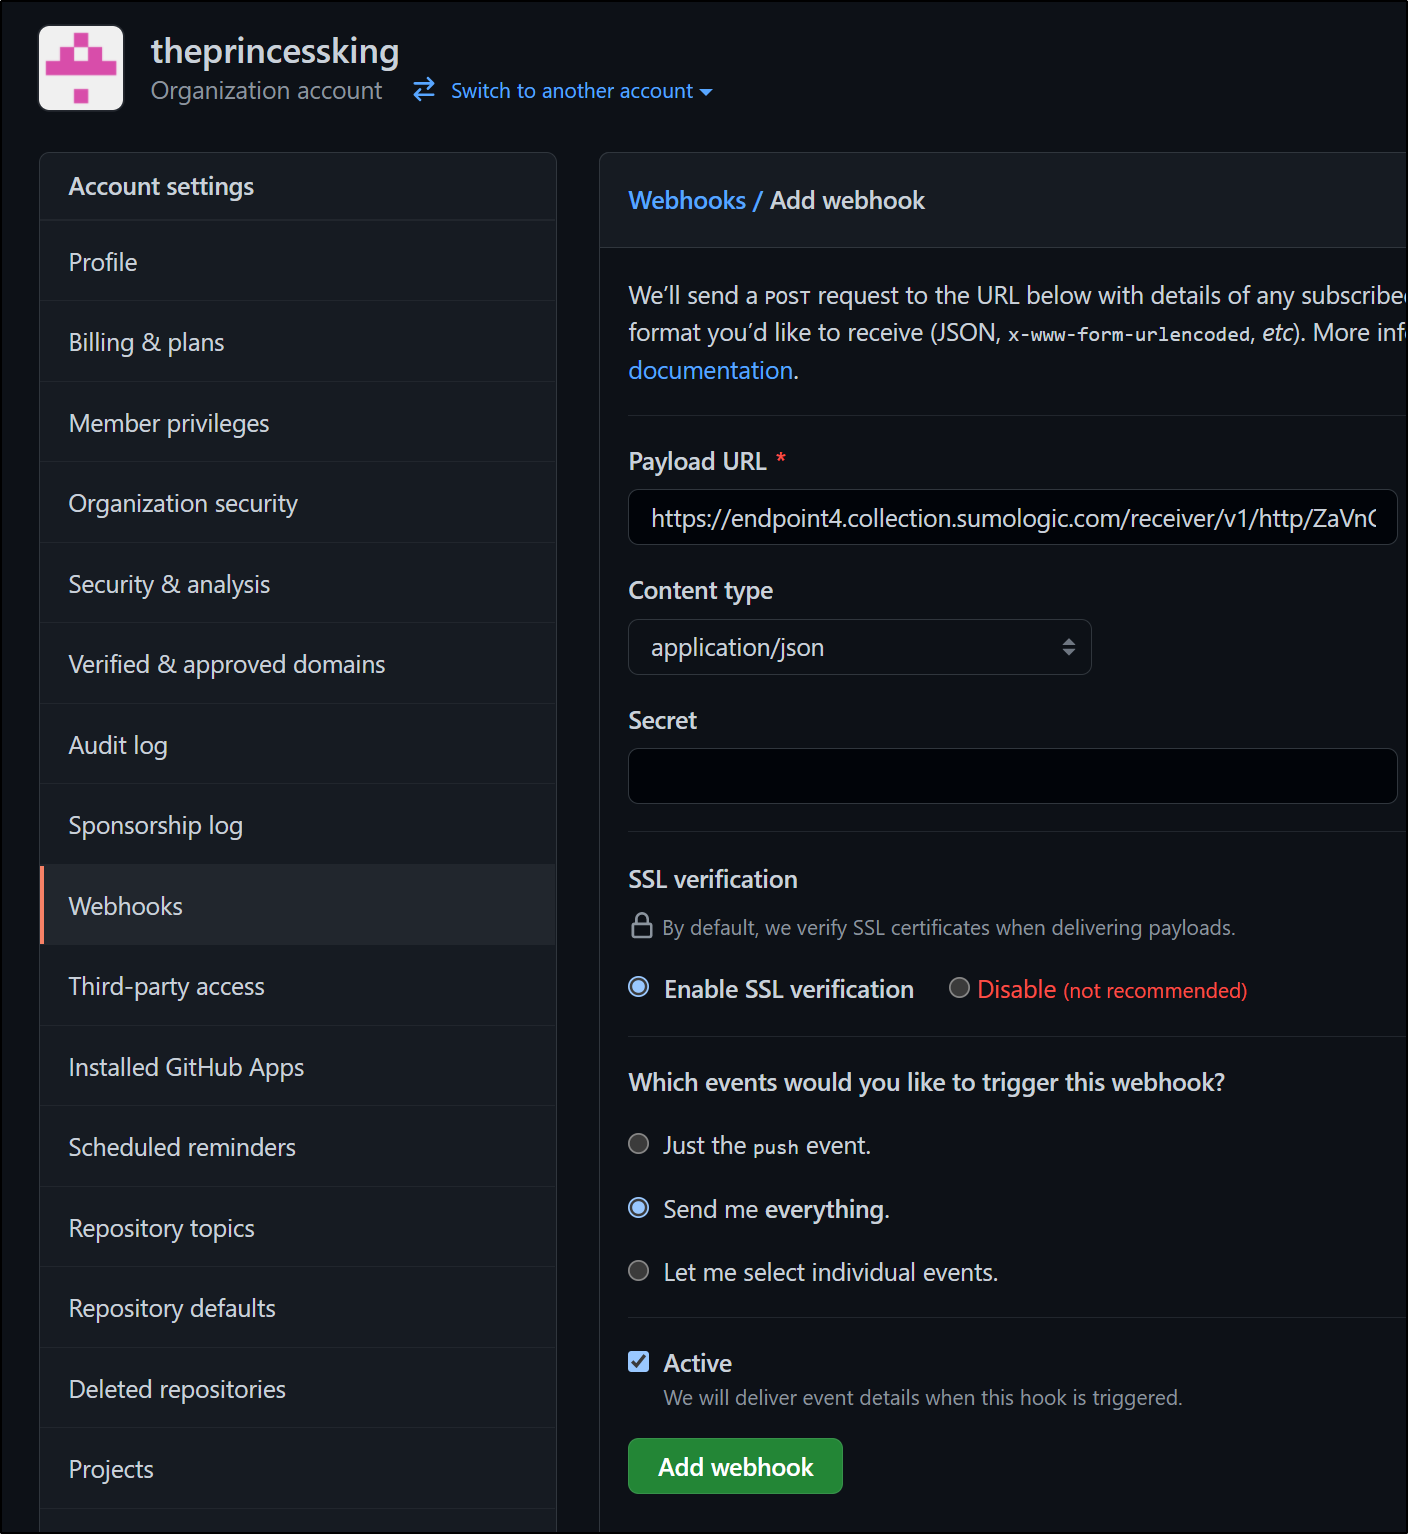
Paste in the webhook URL from the Sumo Wizard and change the other fields accordingly
I am concerned that after saving it, the webhook gave a 429 (Too Many Requests) response
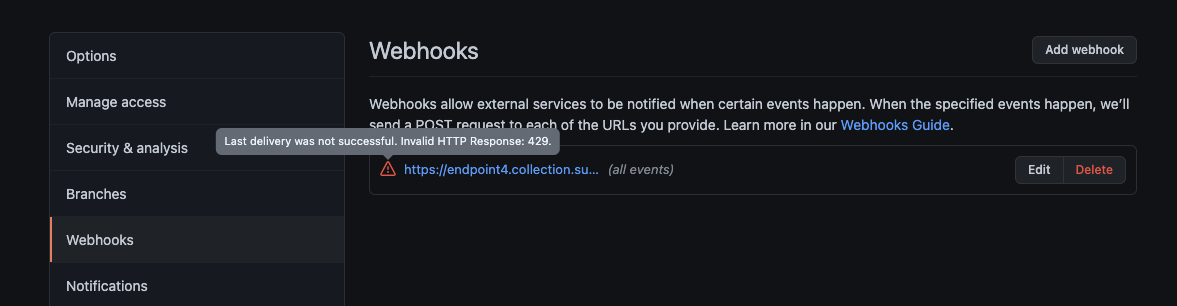
The Github dashboard in Sumo Logic stayed blank.
I looked up the webhook responses in Github only to see I hit some sort of rate limit
This, as the Sumo Logic person and I figured out, was from my massive S3 ingestion which consumed all the ingest GBs I had for the period.
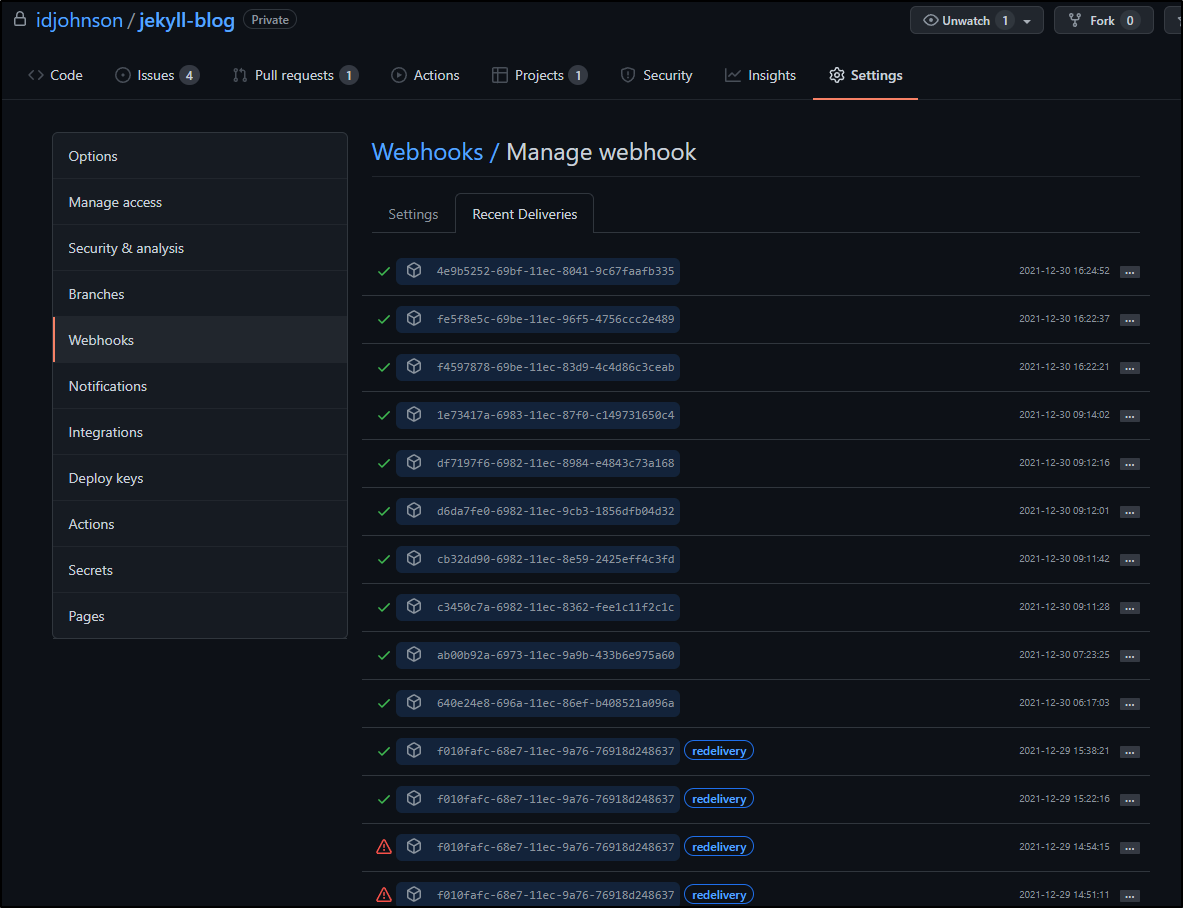
After it calmed down, I started to get regular webhook pushes and 200 receipts.
Despite following the guide, The times and events do not quite line up.
I did see some results, however:
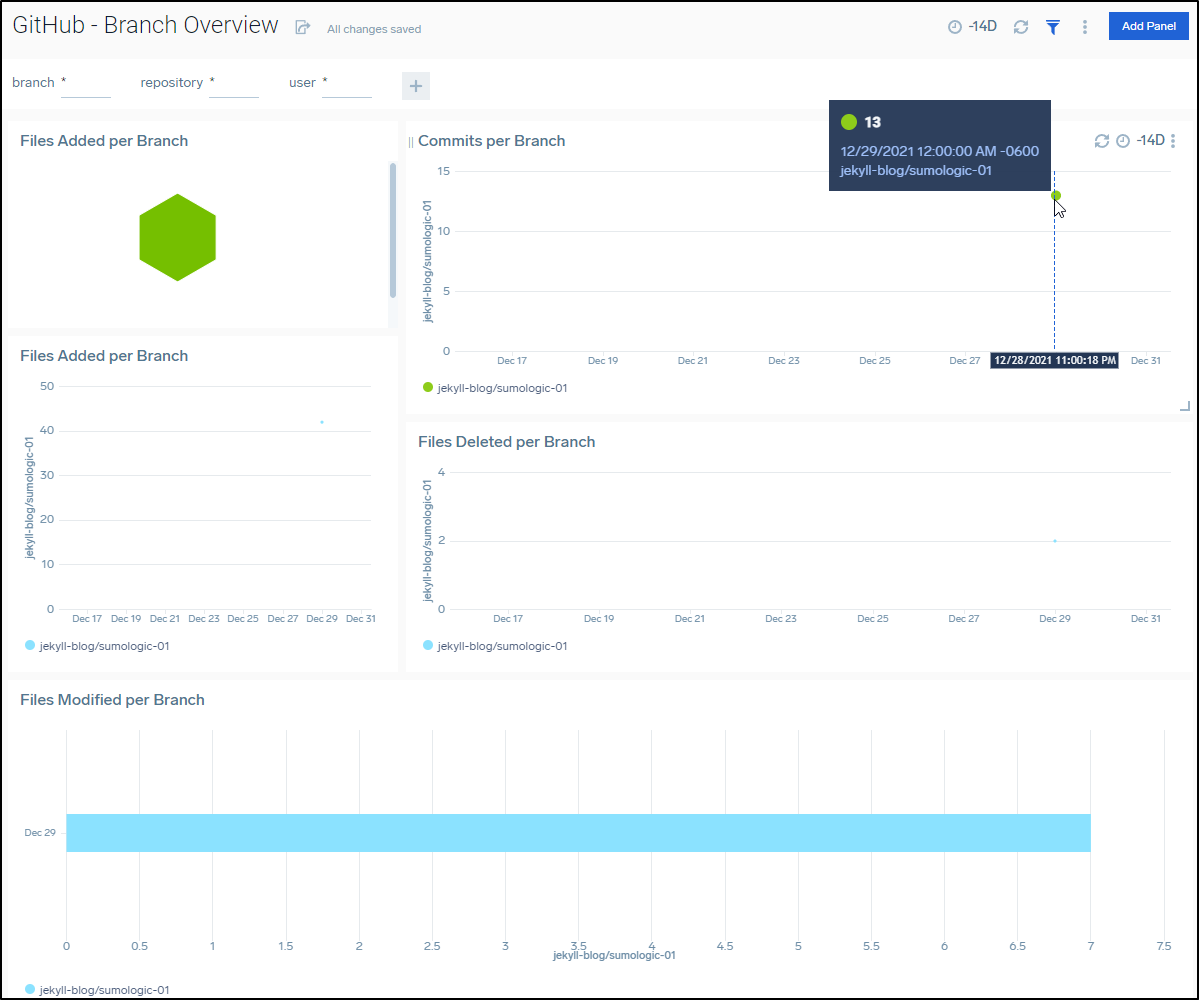
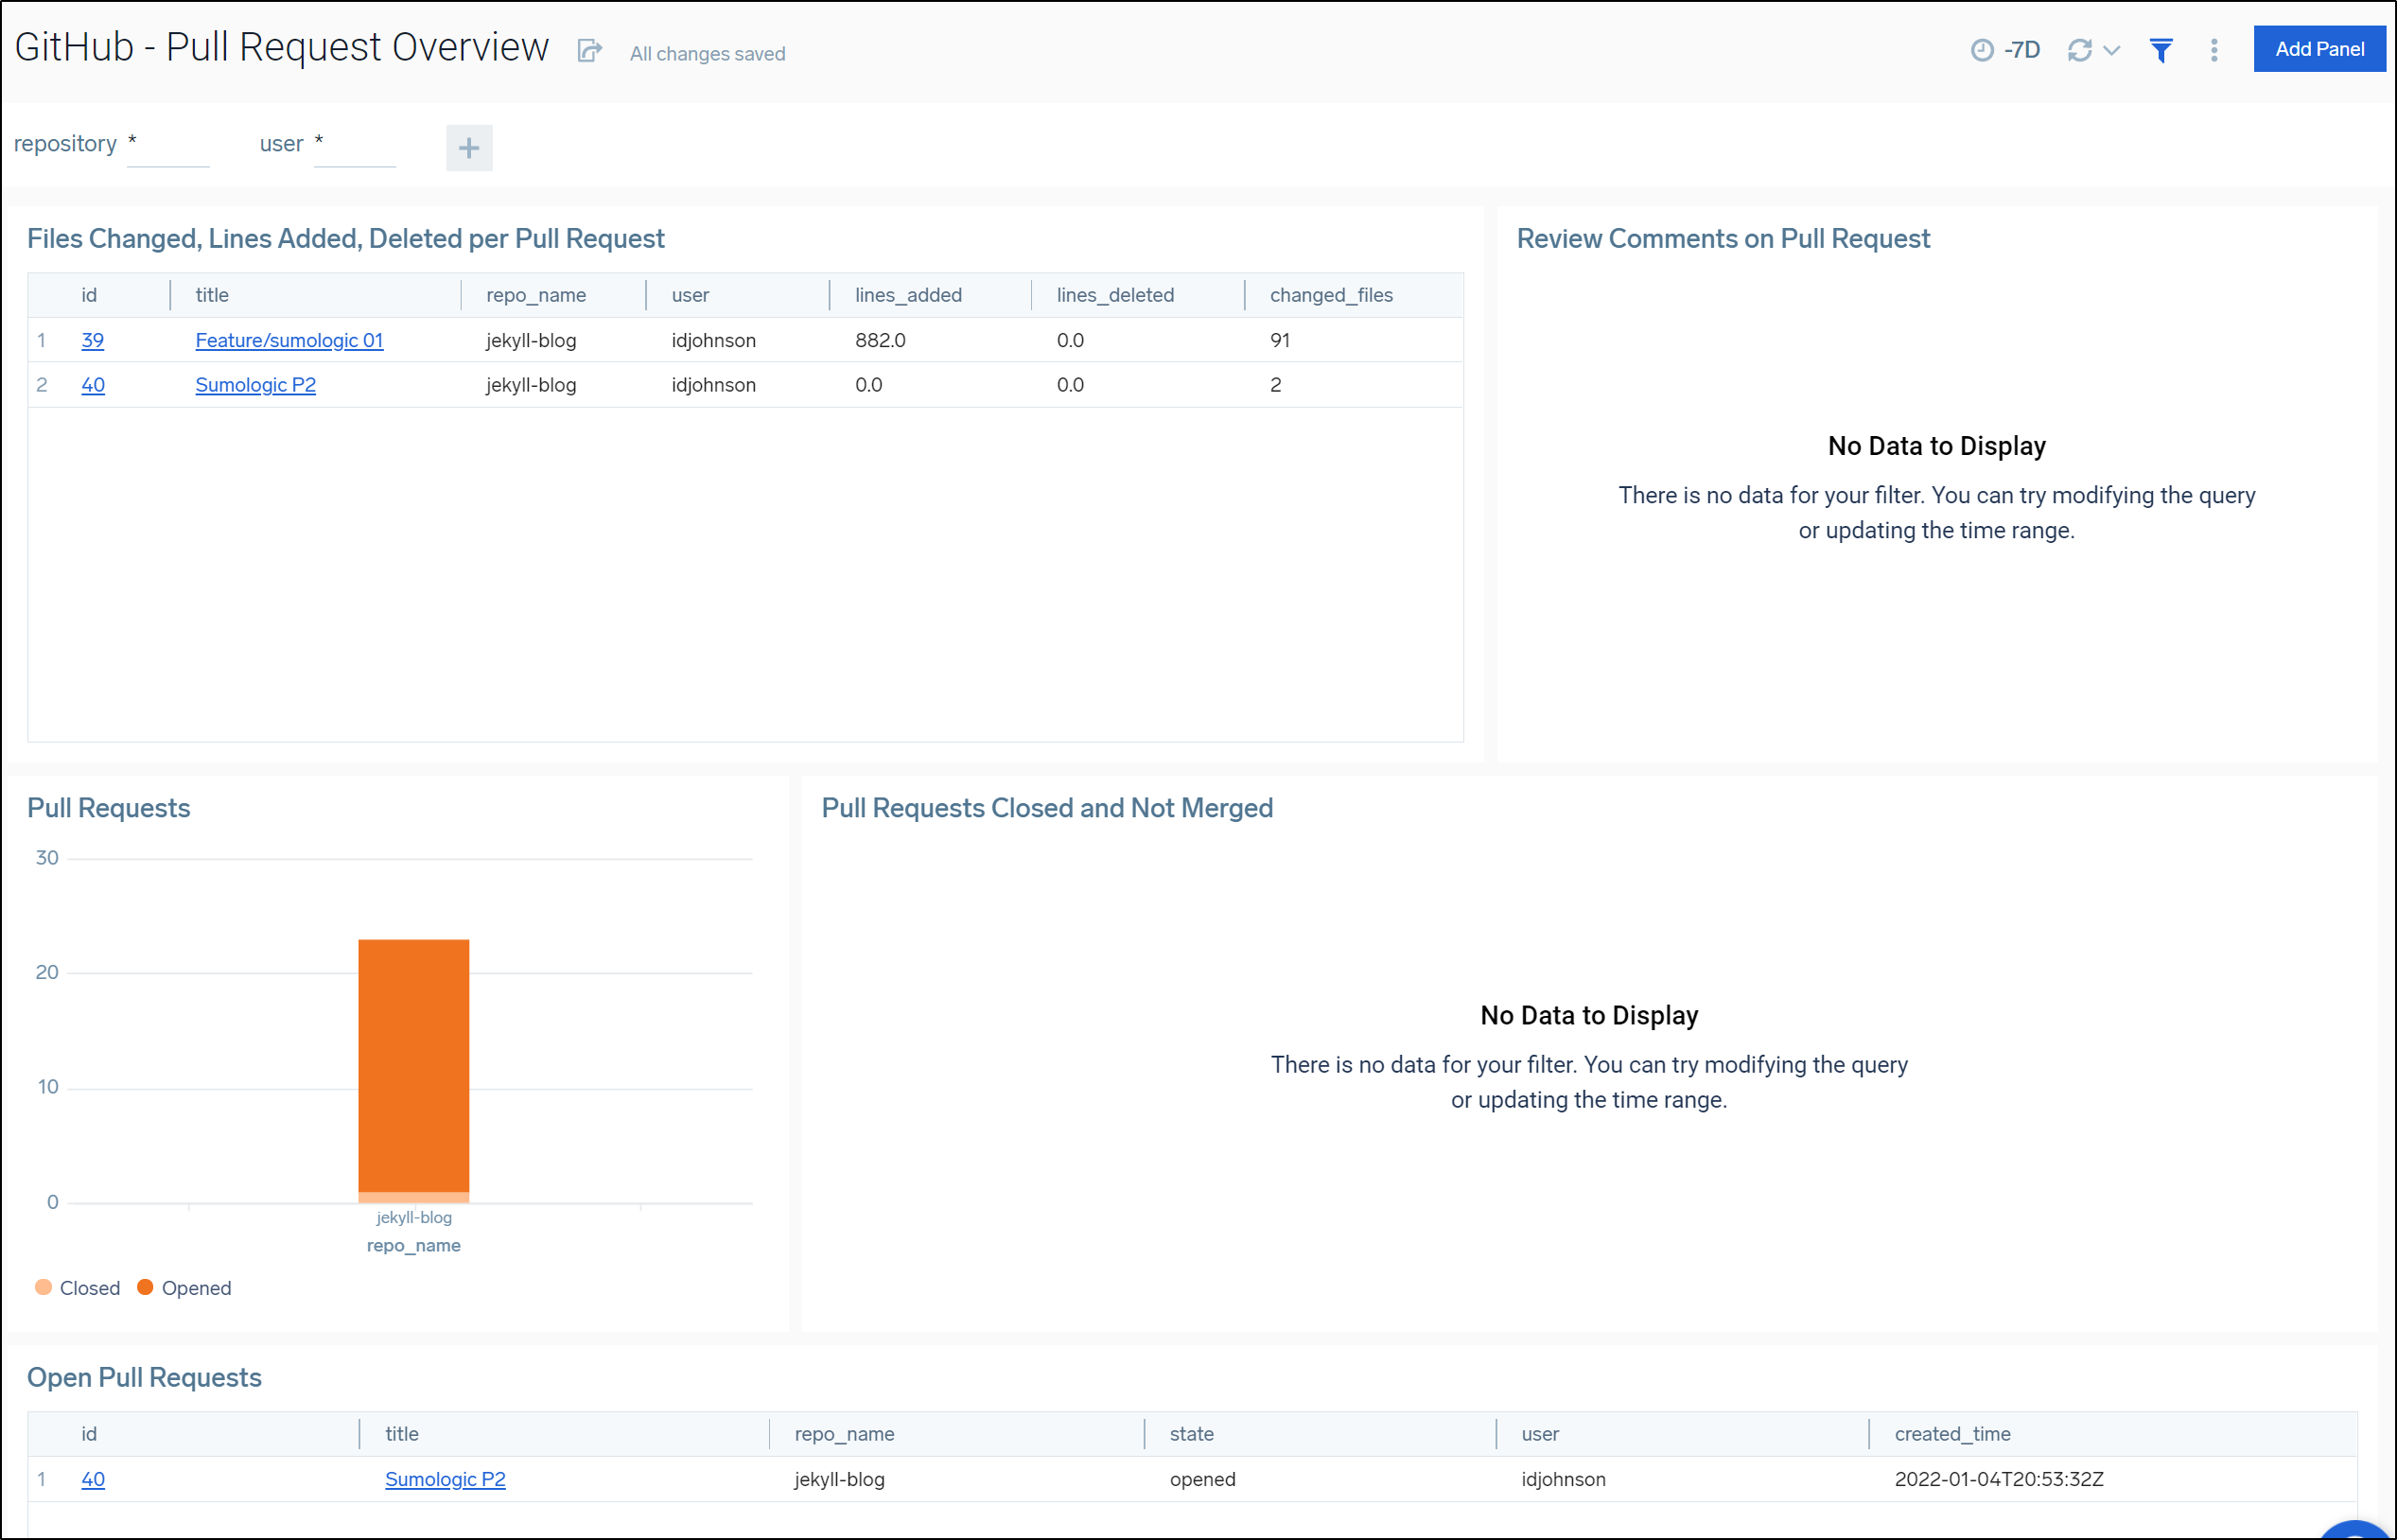
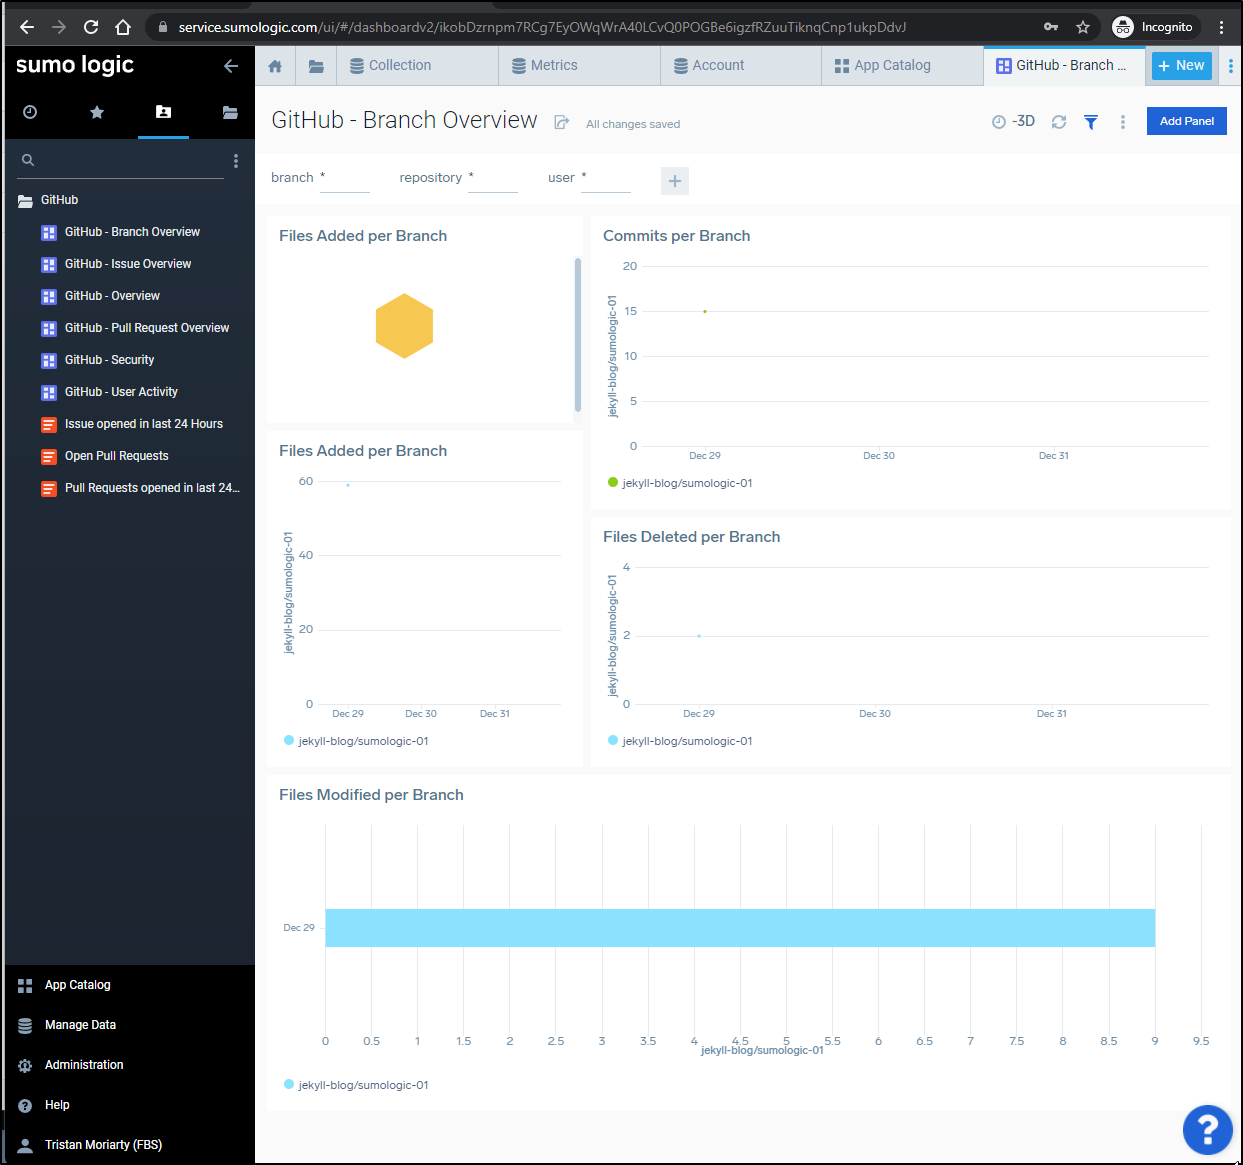
After a few days I could see results such as PRs in my repos
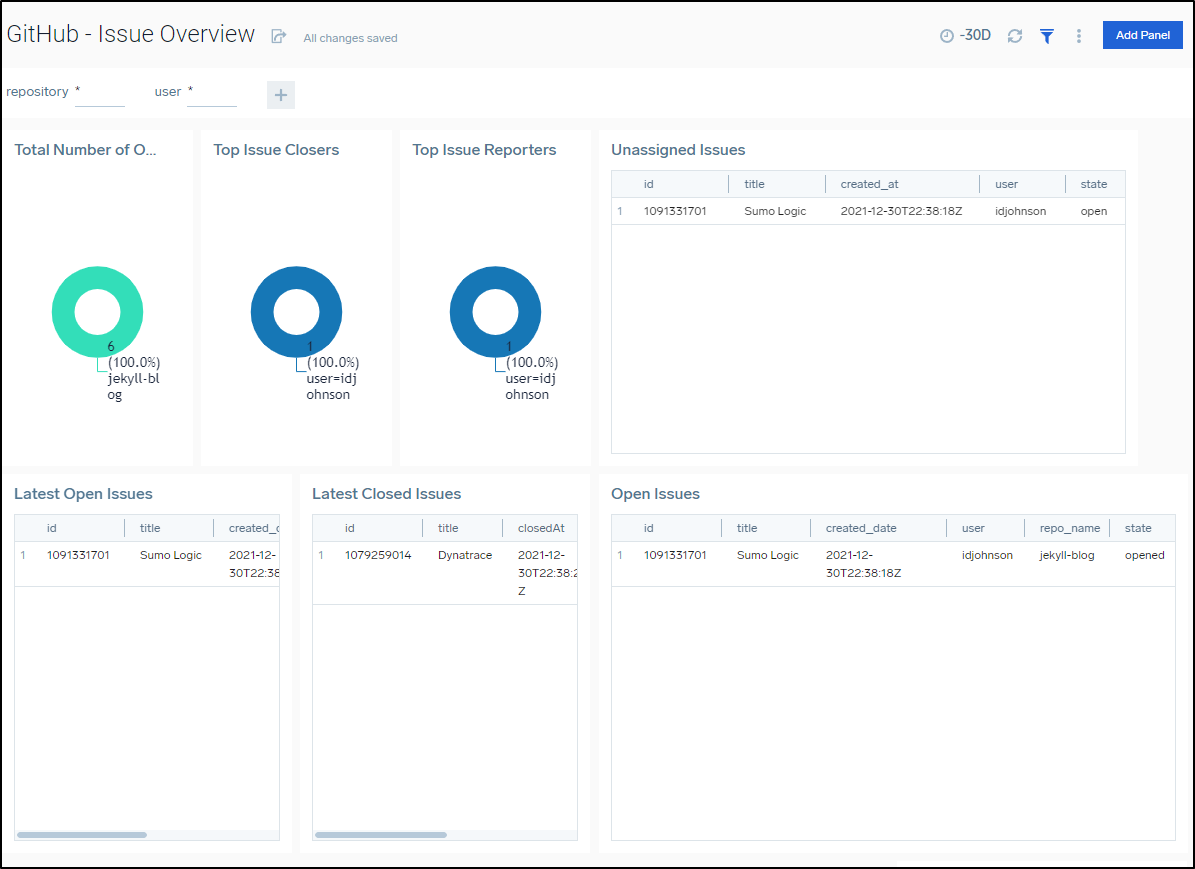
Including accurate Issue reporting metrics
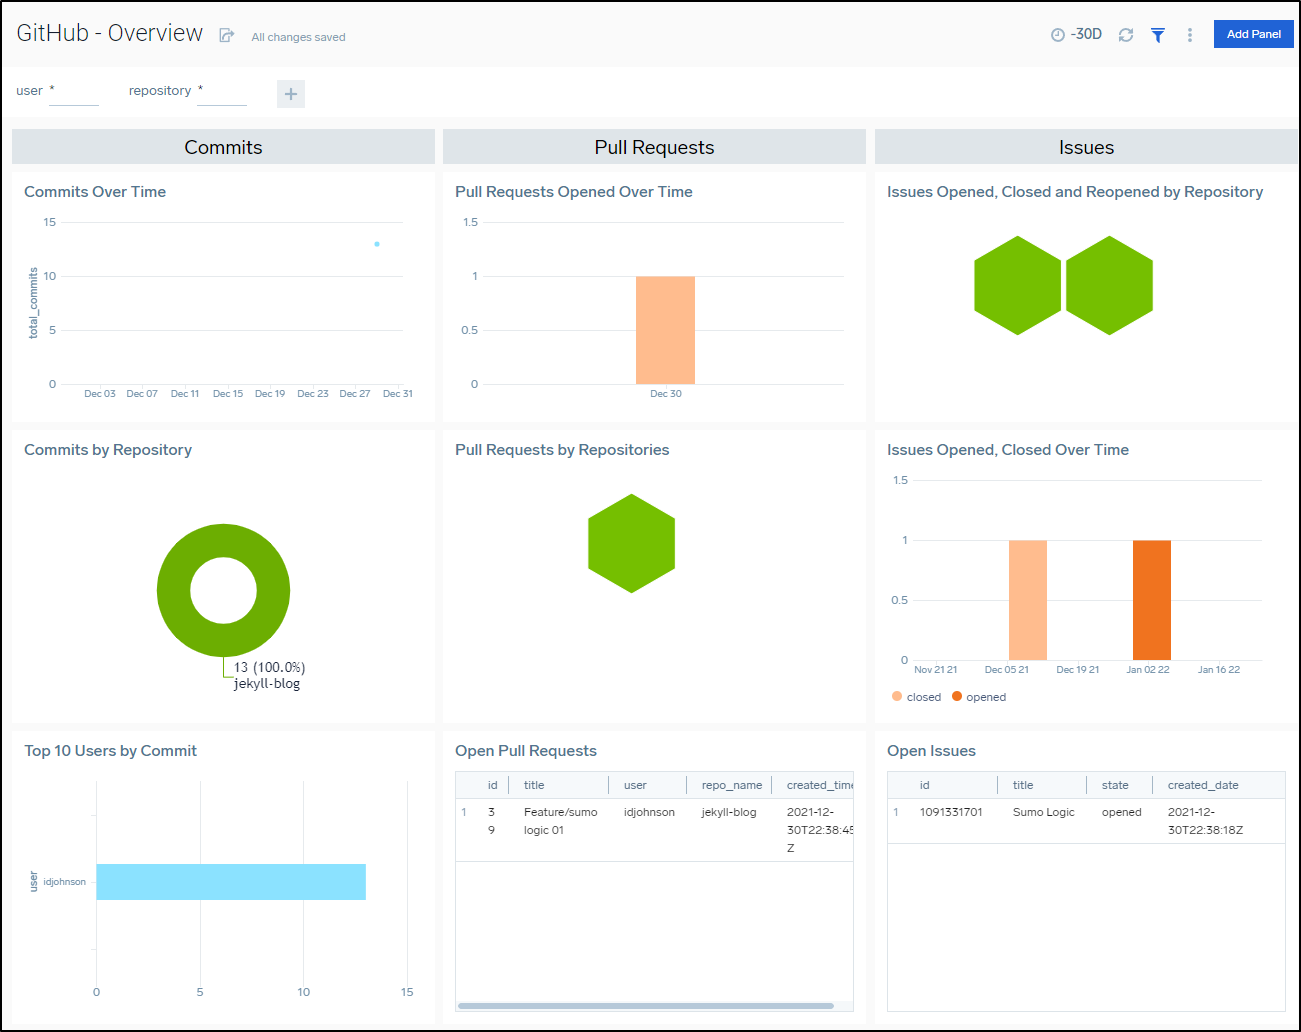
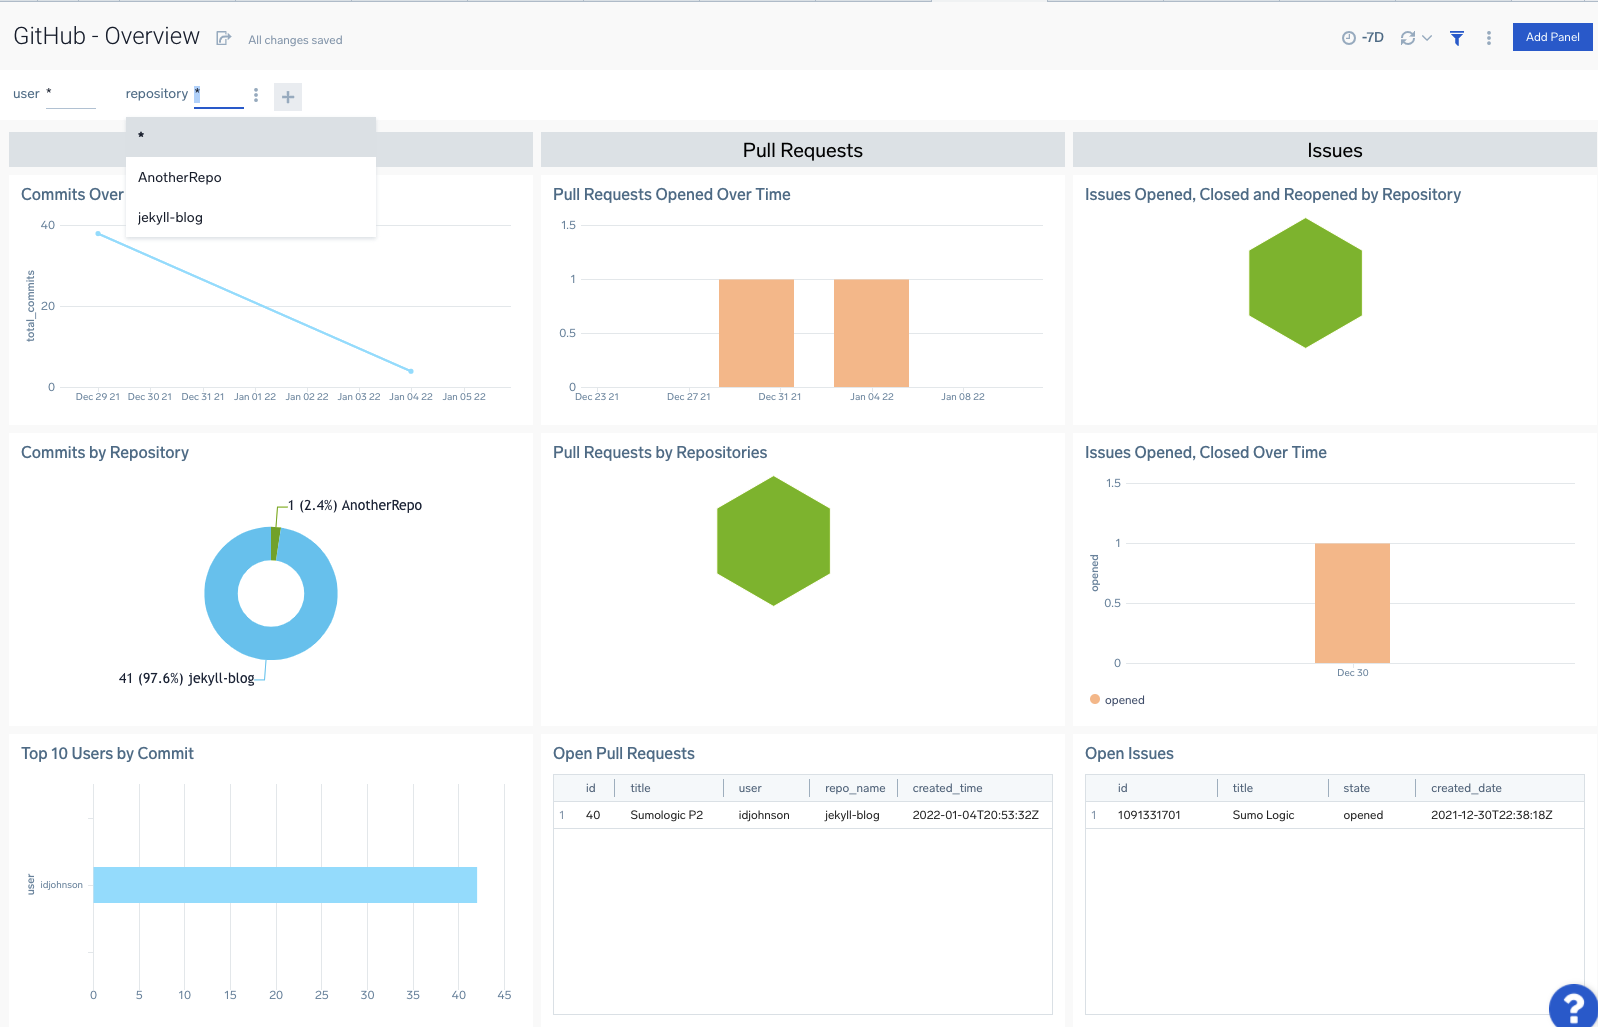
An Overview includes Commits, PRs and Issues over time
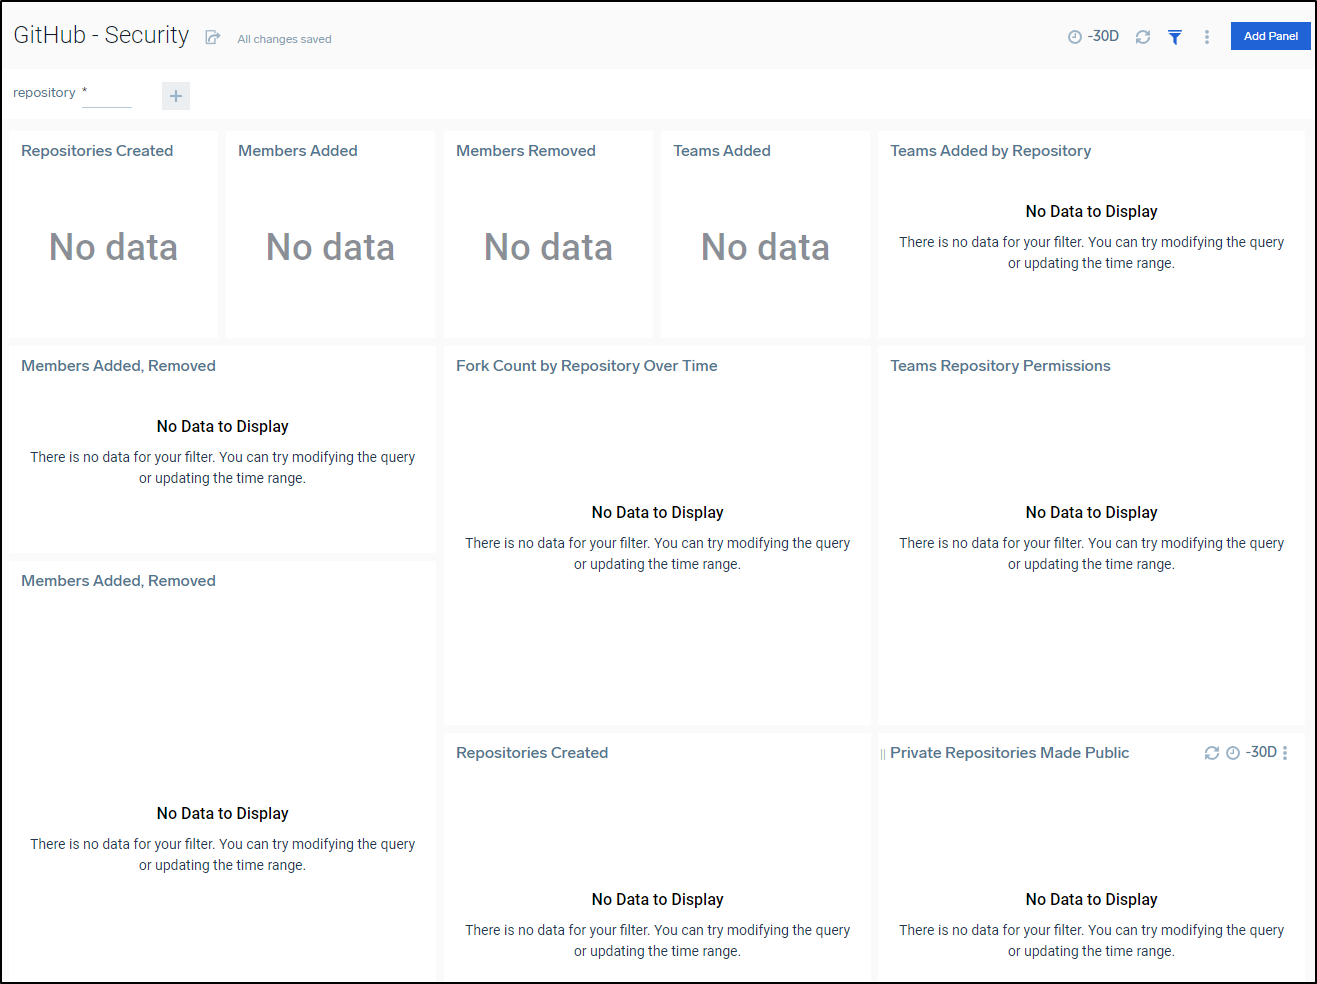
Some of the Github Dashboards really only make sense in the context of monitoring an Organization such as the Security dashboard:
Setting up in Organization
We can add a webhook at the Organization Level just as we did at the Repo level
We can now see “AnotherRepo” I created in the Organization level show up in my Github Overview dashboard
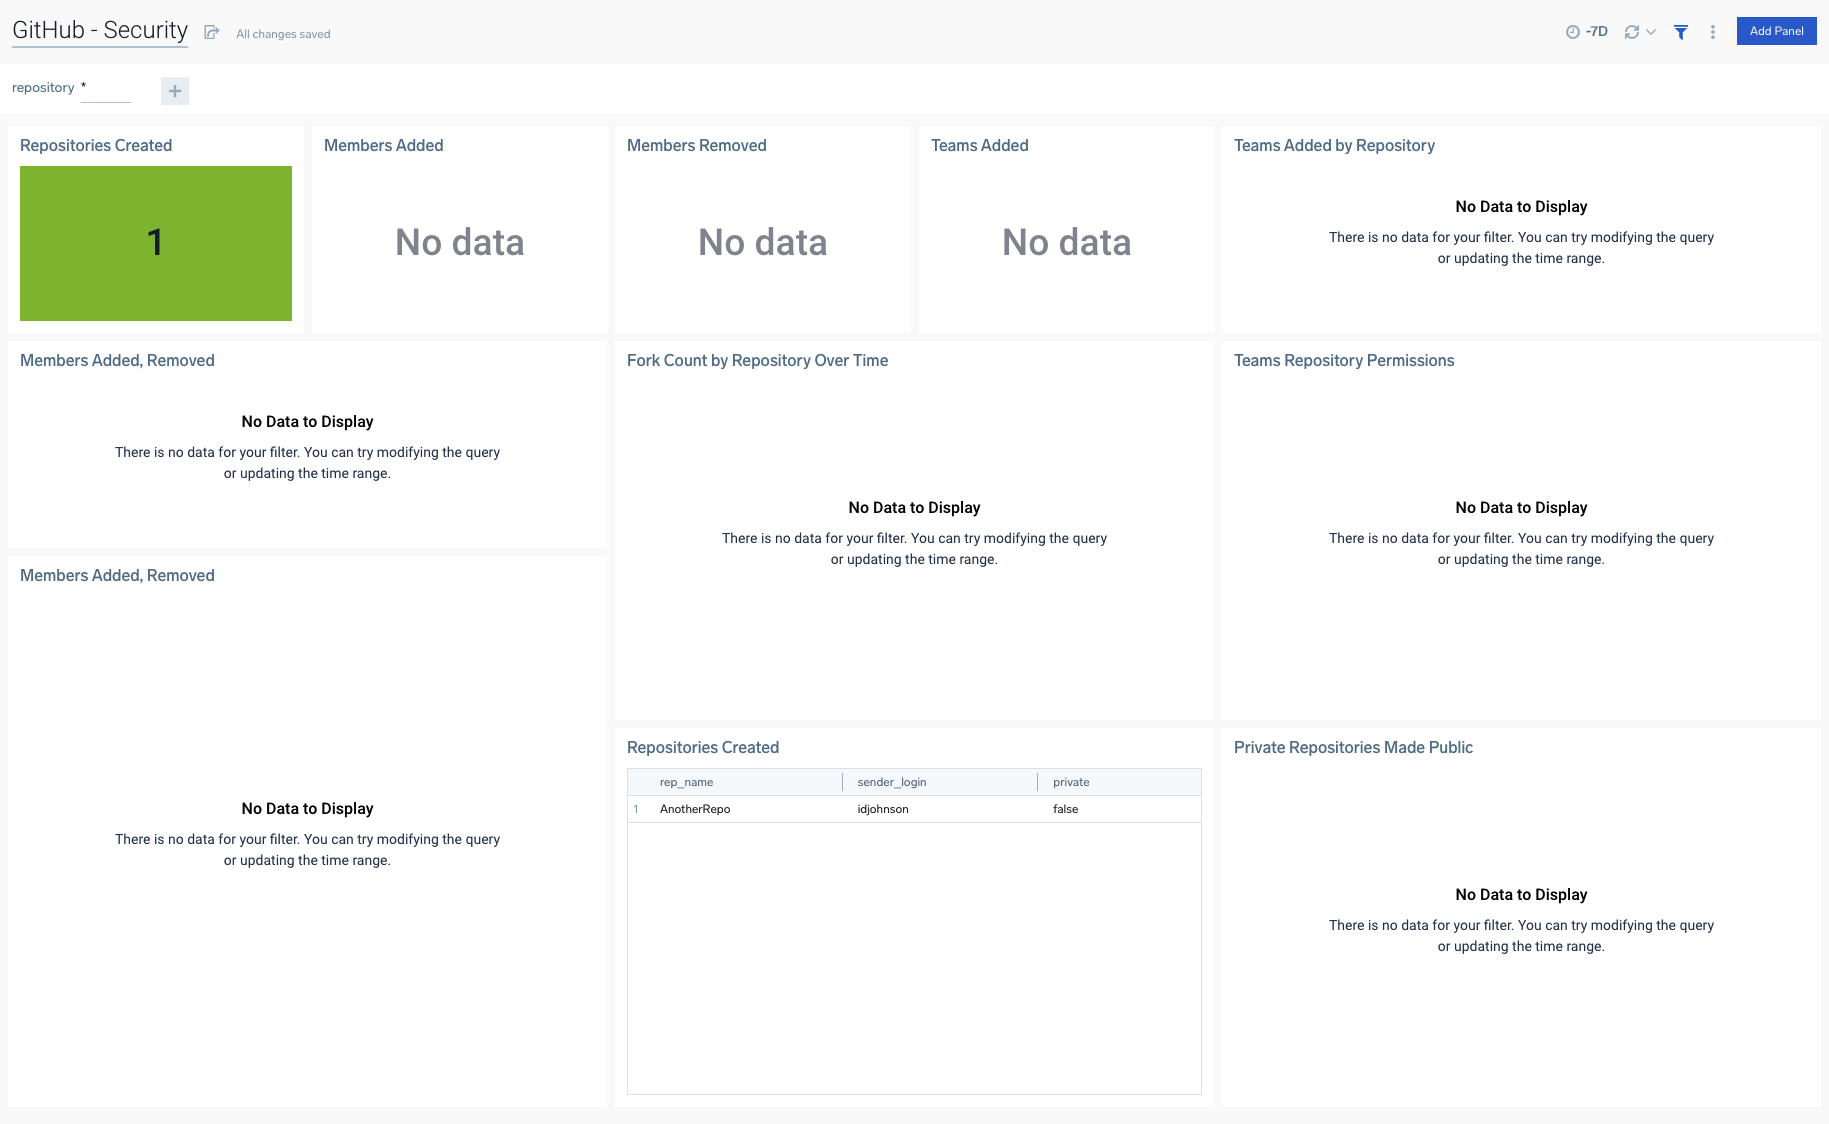
Now that I have an Organization monitored, we can see results in the Security Dashboard
Data Volume Usage
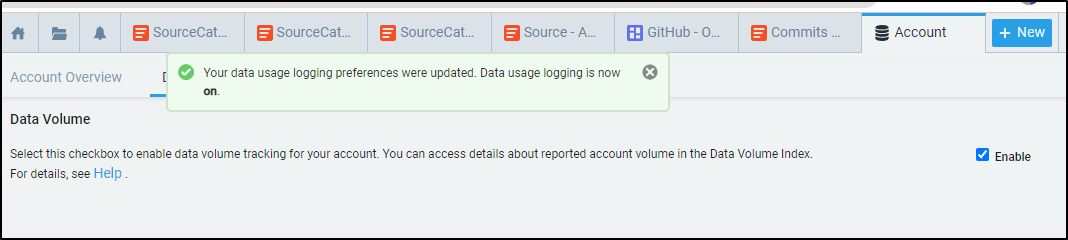
You can get better details on usage by enabling Data Volume in your settings.
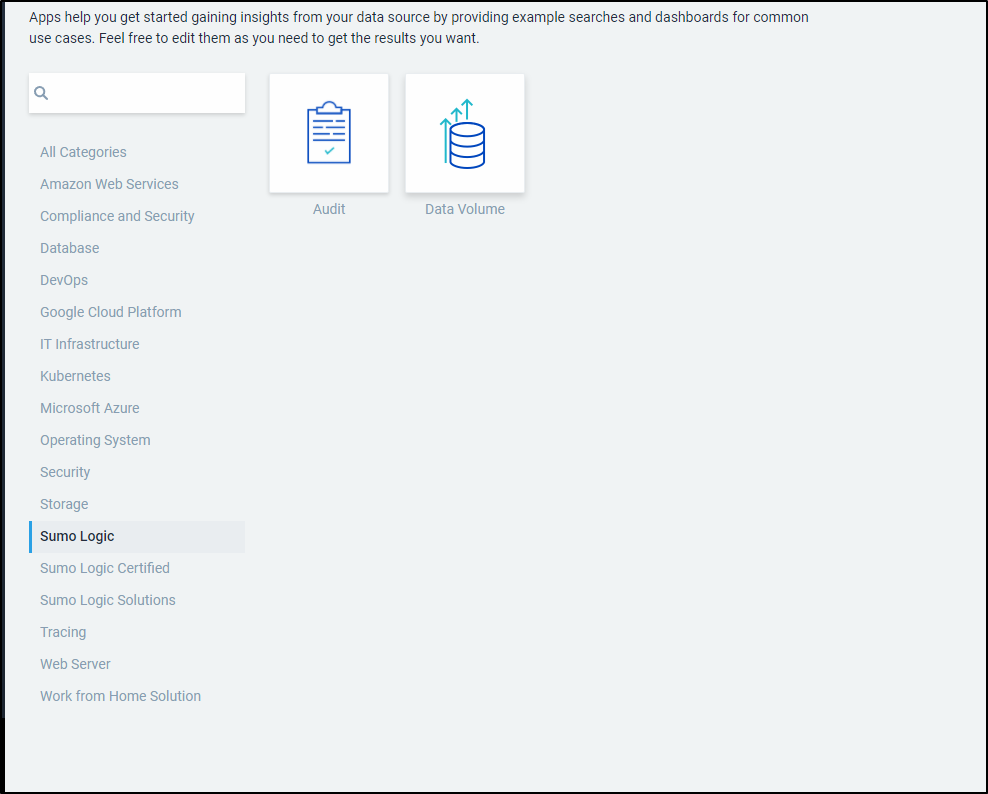
Then adding the Data Volume App from the Sumo Logic category in Apps
It will start to collage usage data from that point forward.
After a half a day, I was able to see details from the Apps
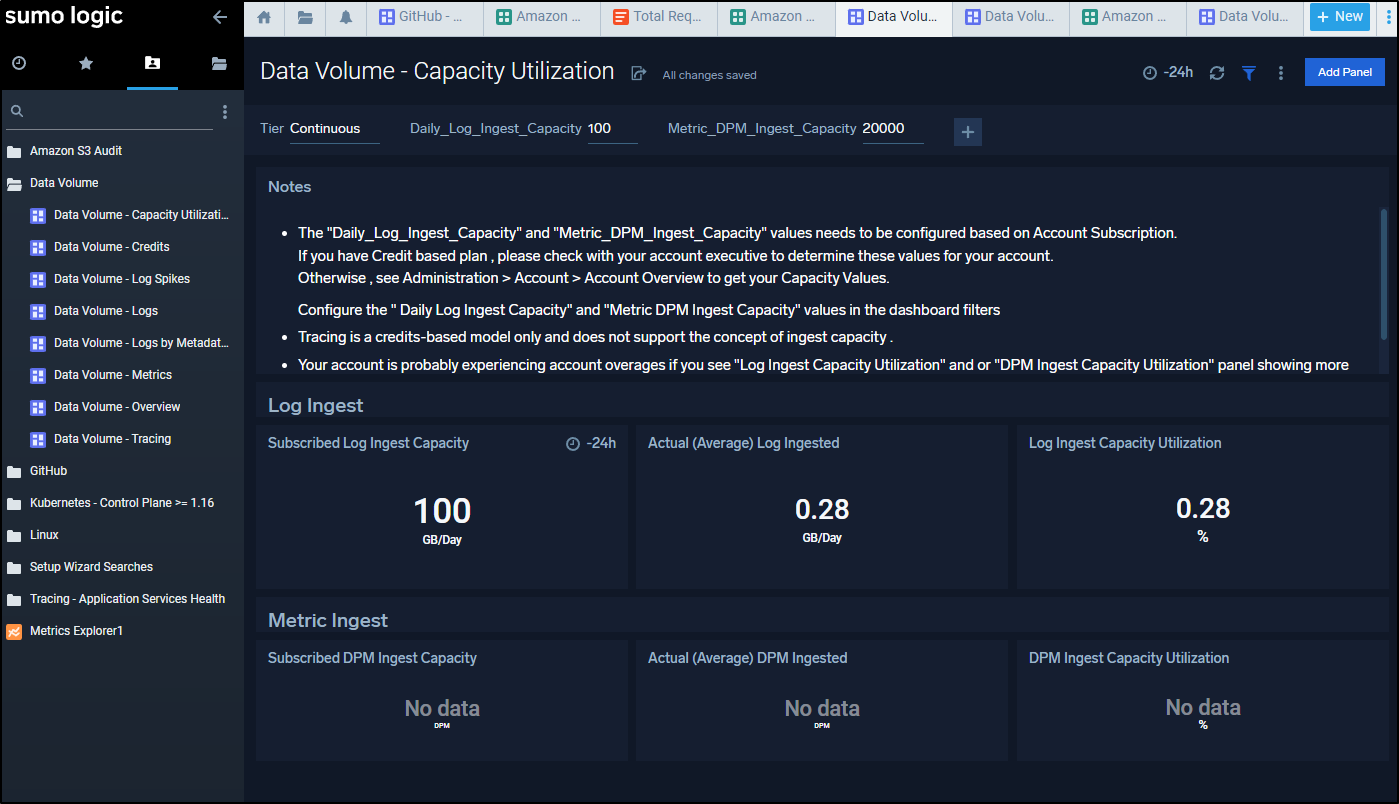
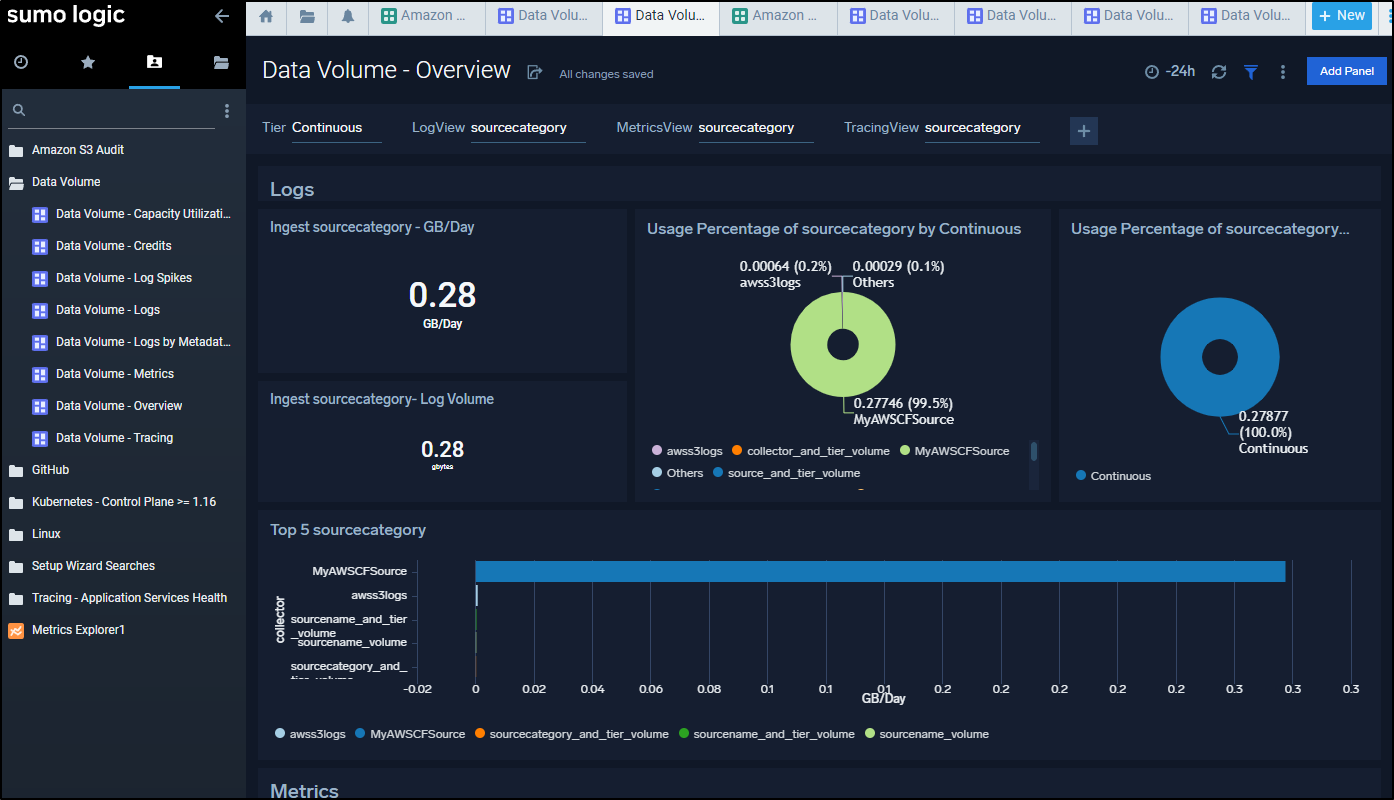
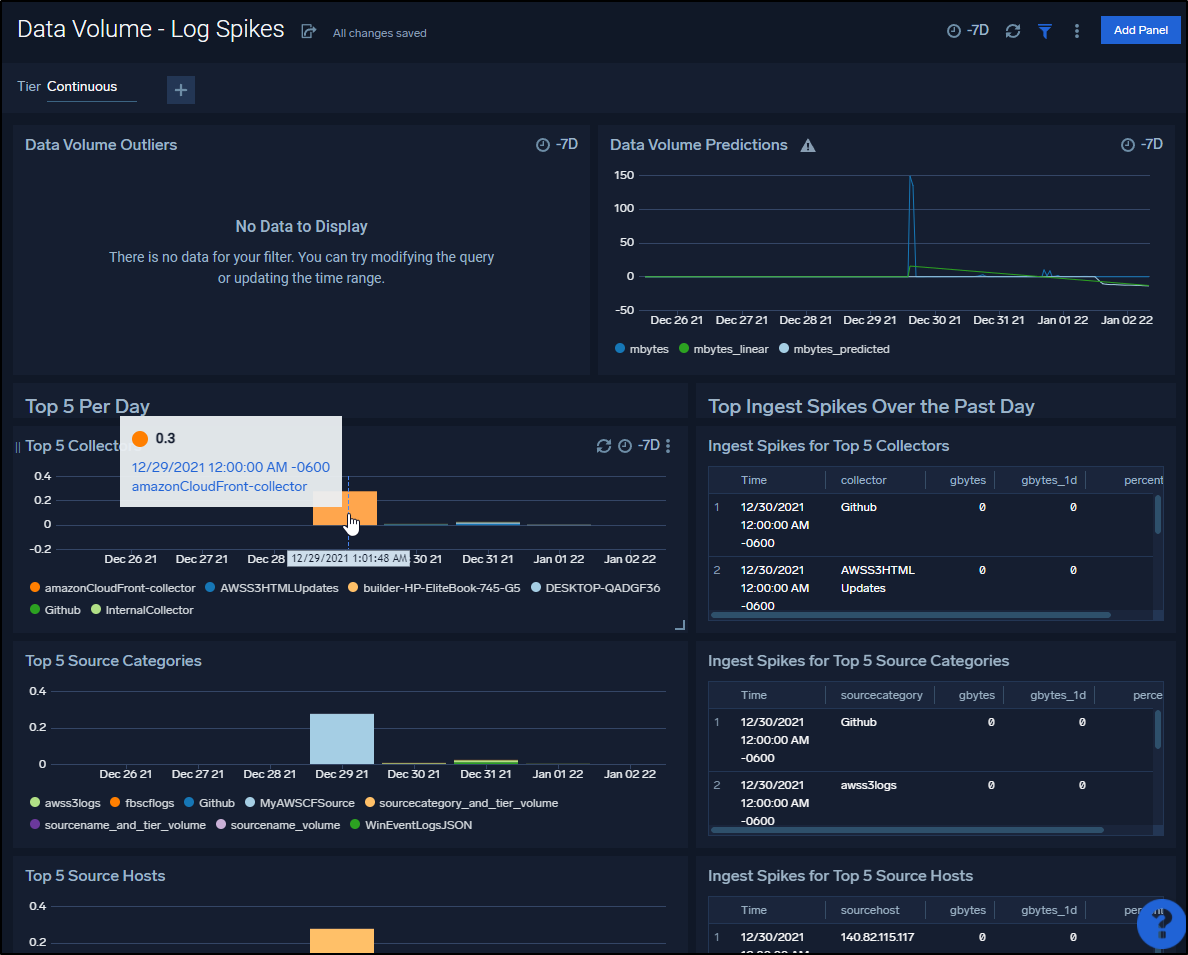
We can bring up the Overview to see what collectors are consuming how much ingest data
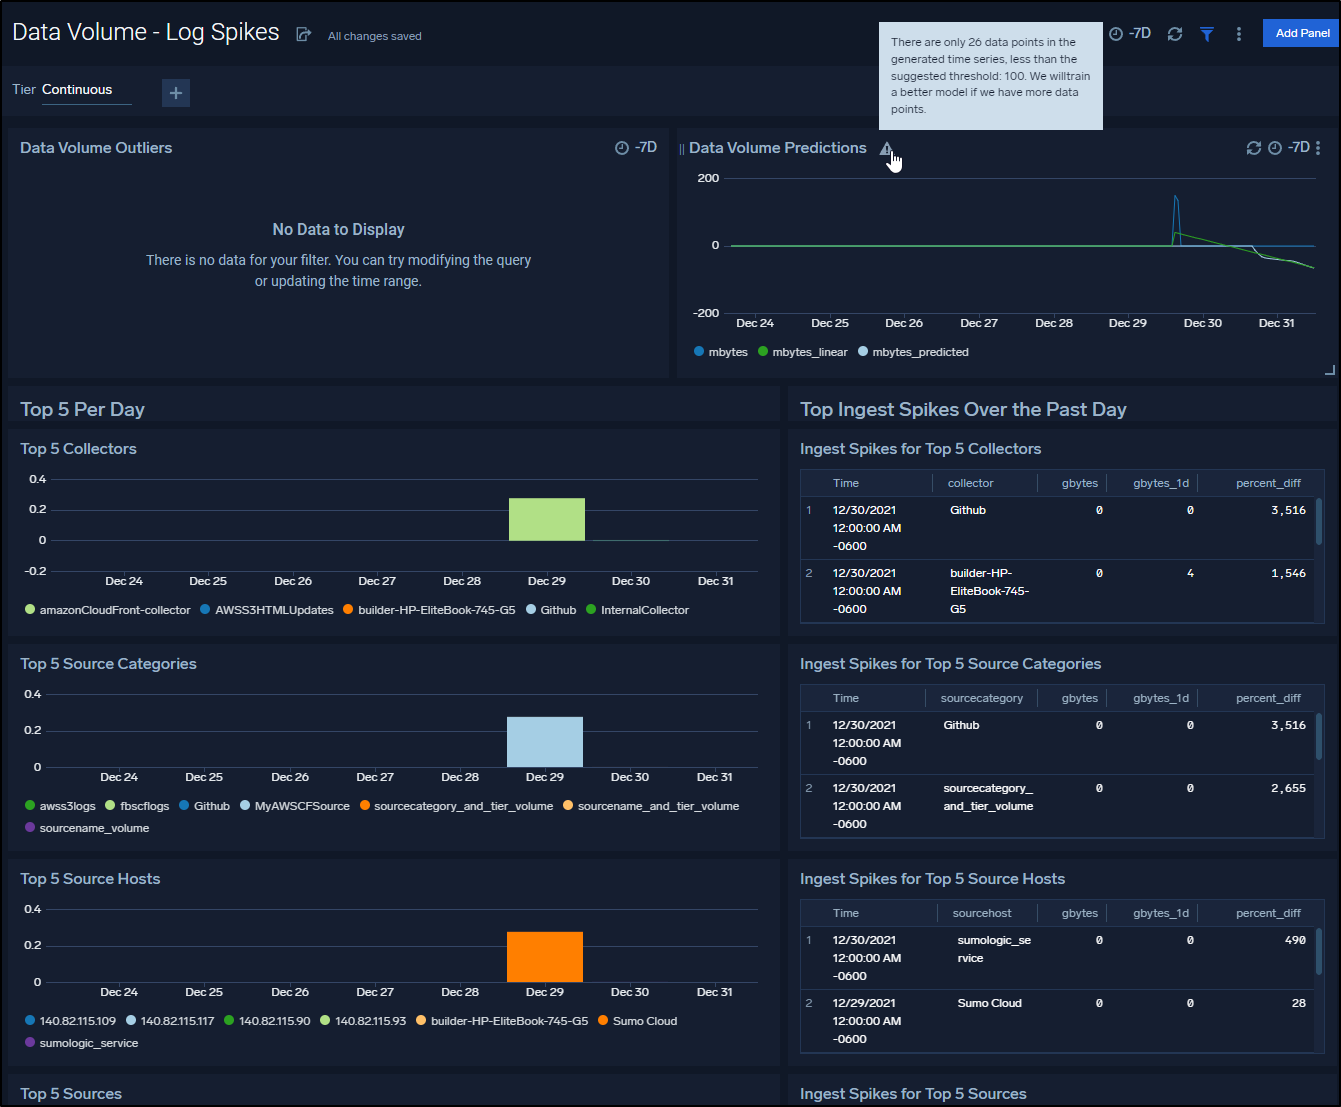
Given a day, we can see some pretty interesting spikes and data including a Data Volume Prediction panel (presently warning me it needs more data points to train the model)
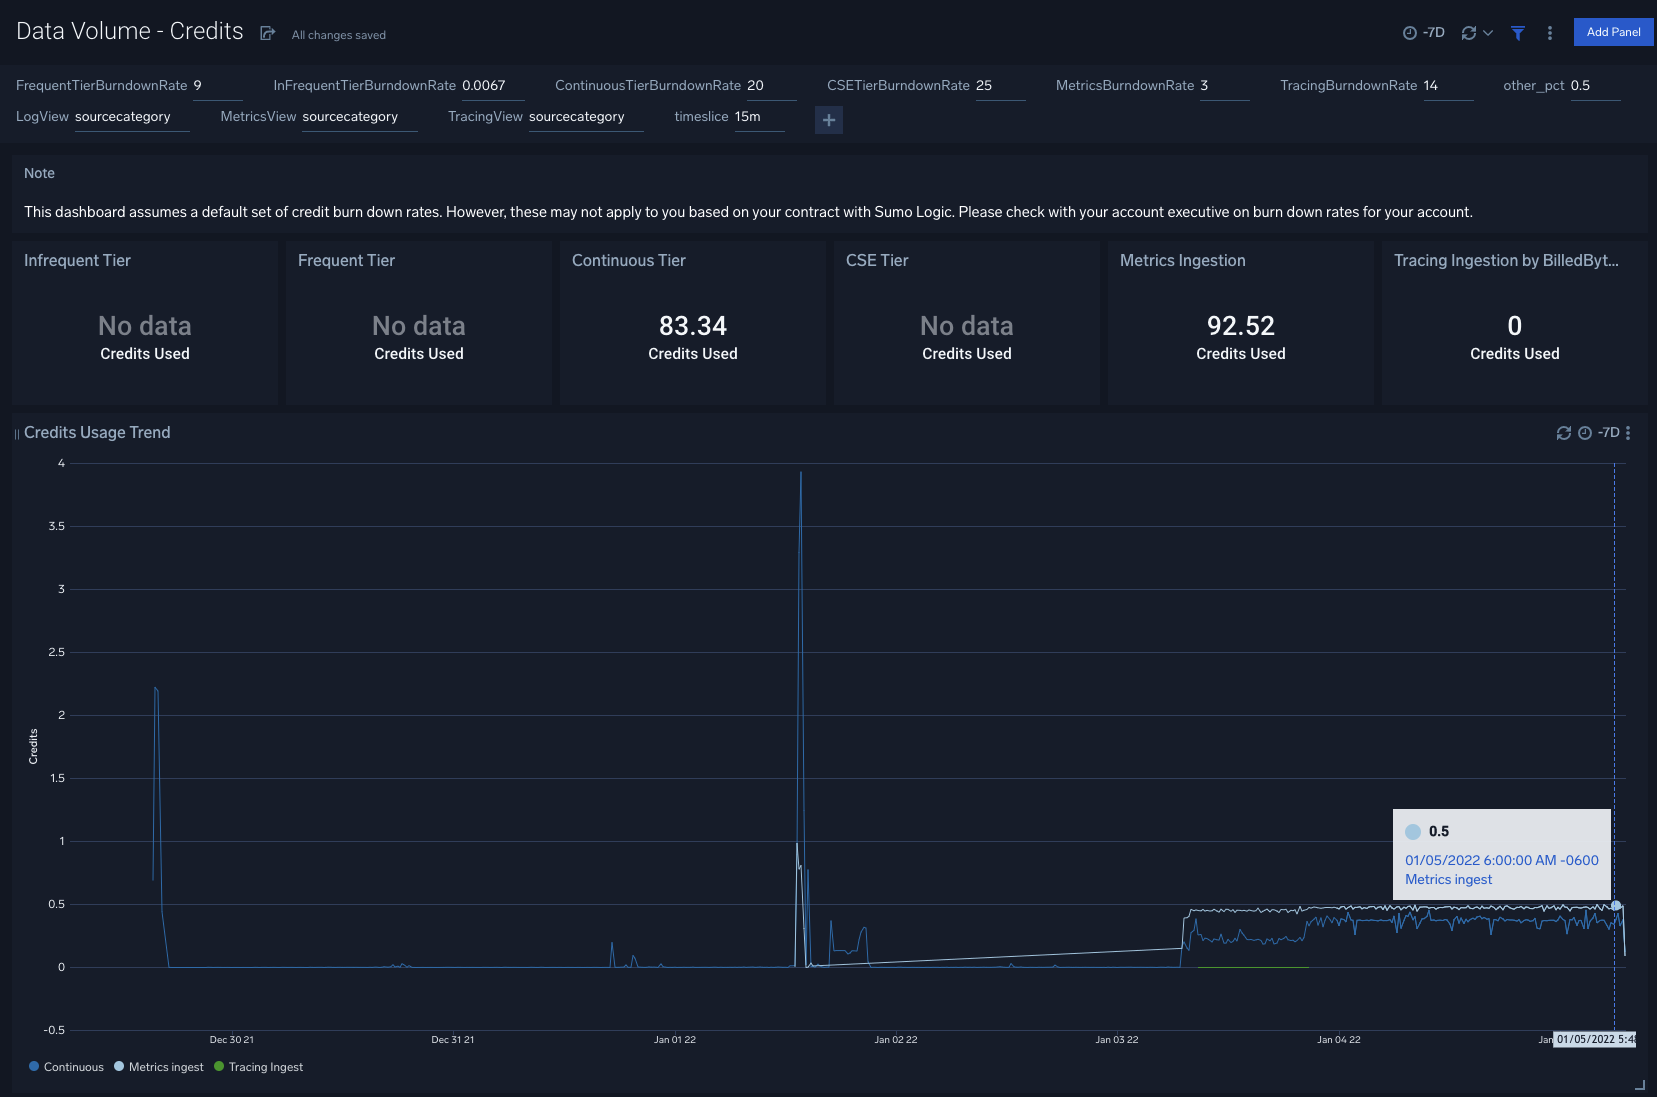
And a few days later we can see some trends
In a week I could start to get a trend on usage
When you pair that with what one sees in the account details
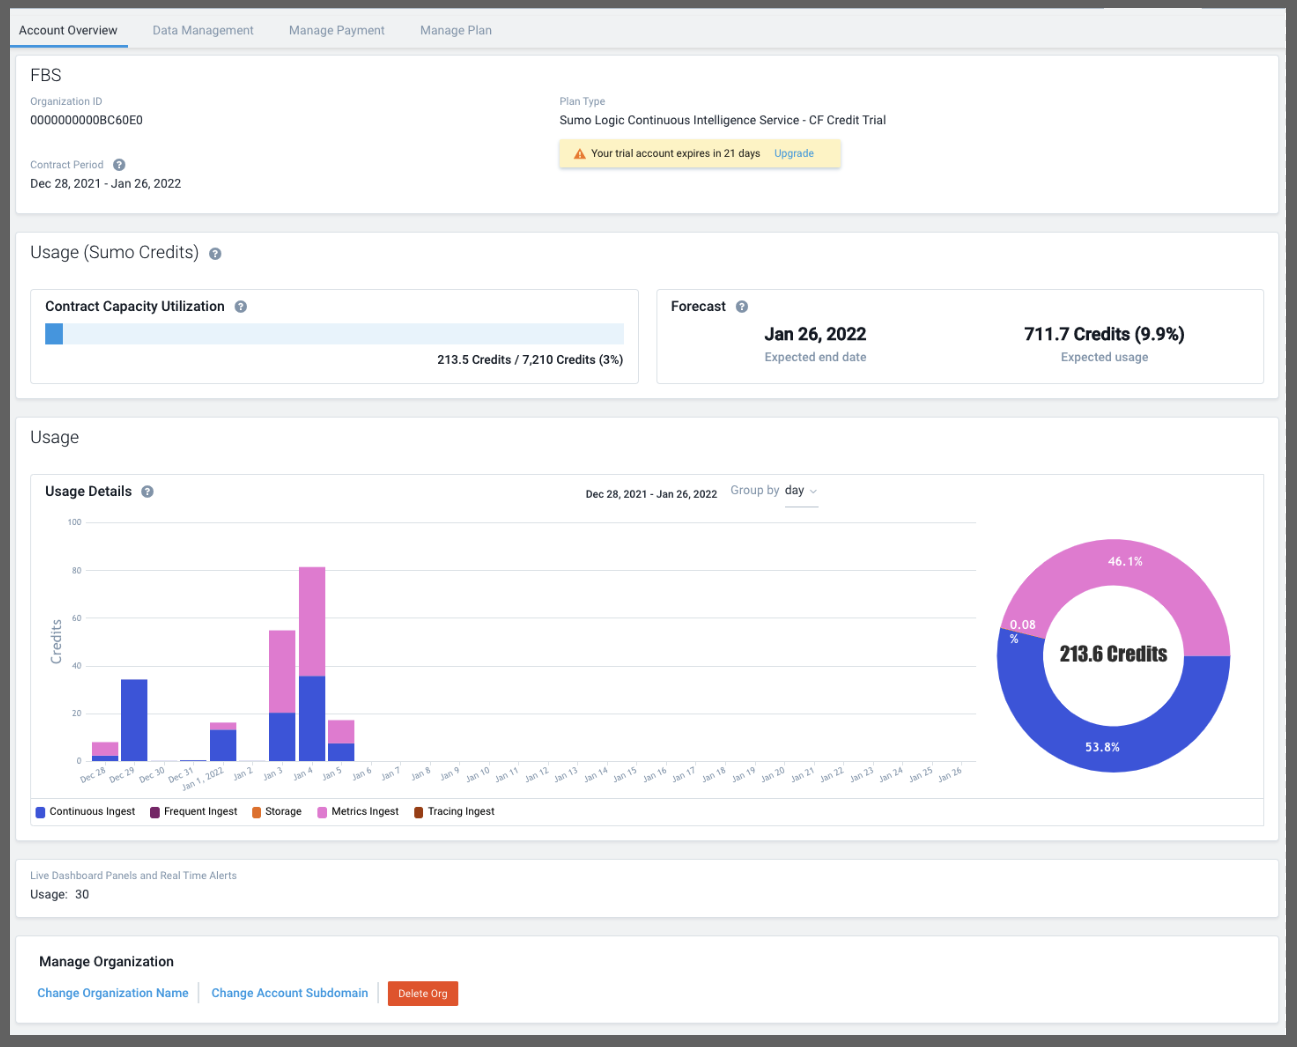
One can start to build a picture of what their organization is going to need.
Let us assume this is it, what I have monitored is what I want. Then I would guess I’m in the 720 ‘credits’ a month range.
Playing with the cost calculator, I found a query that roughly matched that
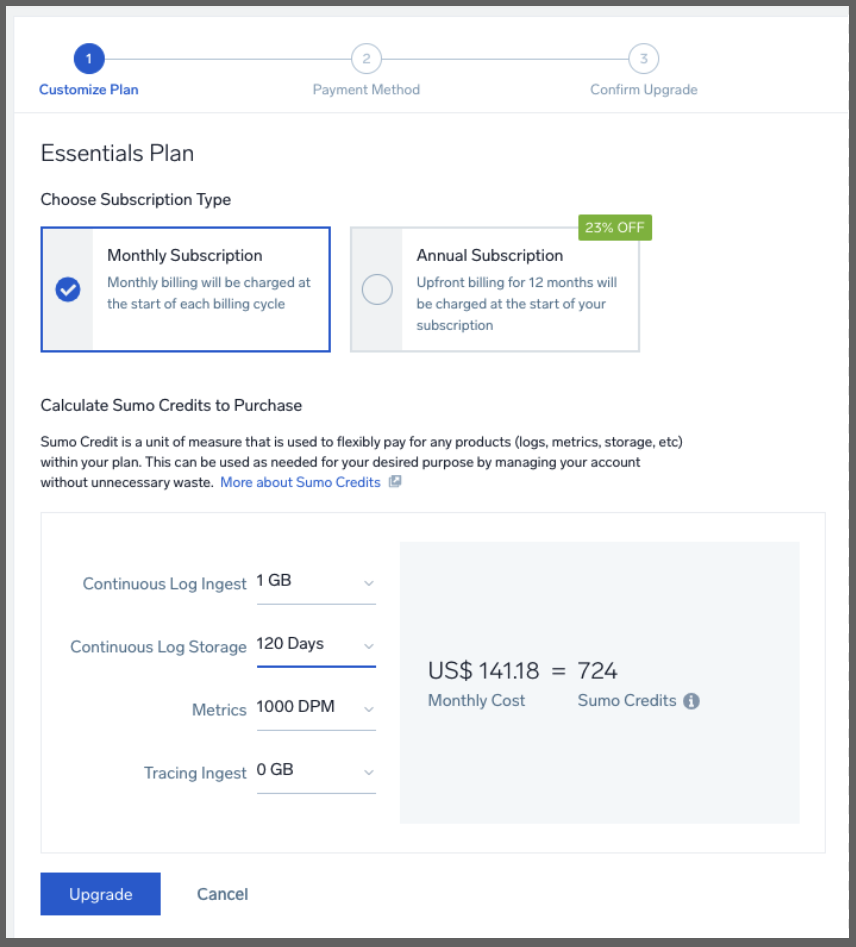
Showing to do what I’ve been doing would be about US$141 a month.
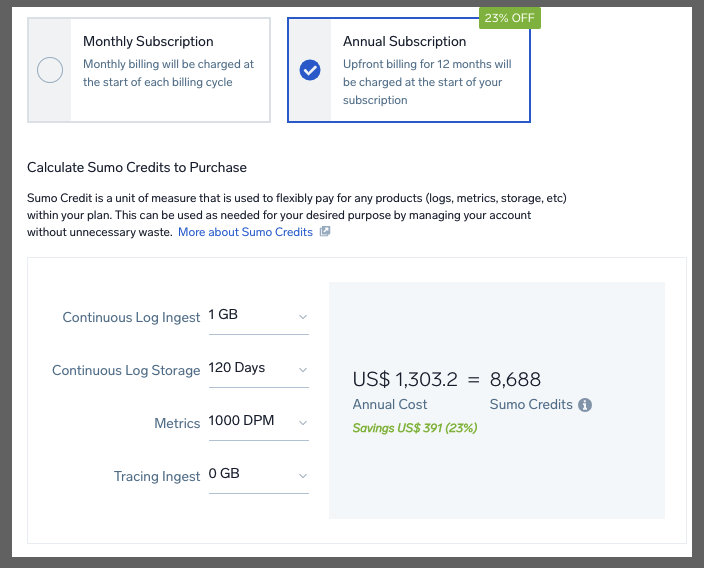
which would be US$1300 a year. This just means, at present, Sumo Credits “retail” for US$0.195/mo and US$0.15/year.
If I was front line Ops Manager, I might very well AMEX the whole year upfront and put in place budget limits (see Budgets section later). You can also read more on credits in licensing overview and Flex Credits.
Update: I spoke with a rep about really what happens when credits are used up. First, he pointed out that for annual plans, that should not happen as sales would get in contact if it were the case that one was likely to run out. But IF one did really run out, Sumo Logic would perform much like the free trial when I exceeded all my limits and i got some 429s and some slow ingest. It would still work, albeit it with degraded performance - there would not be overage charges
Local Agent Revisit
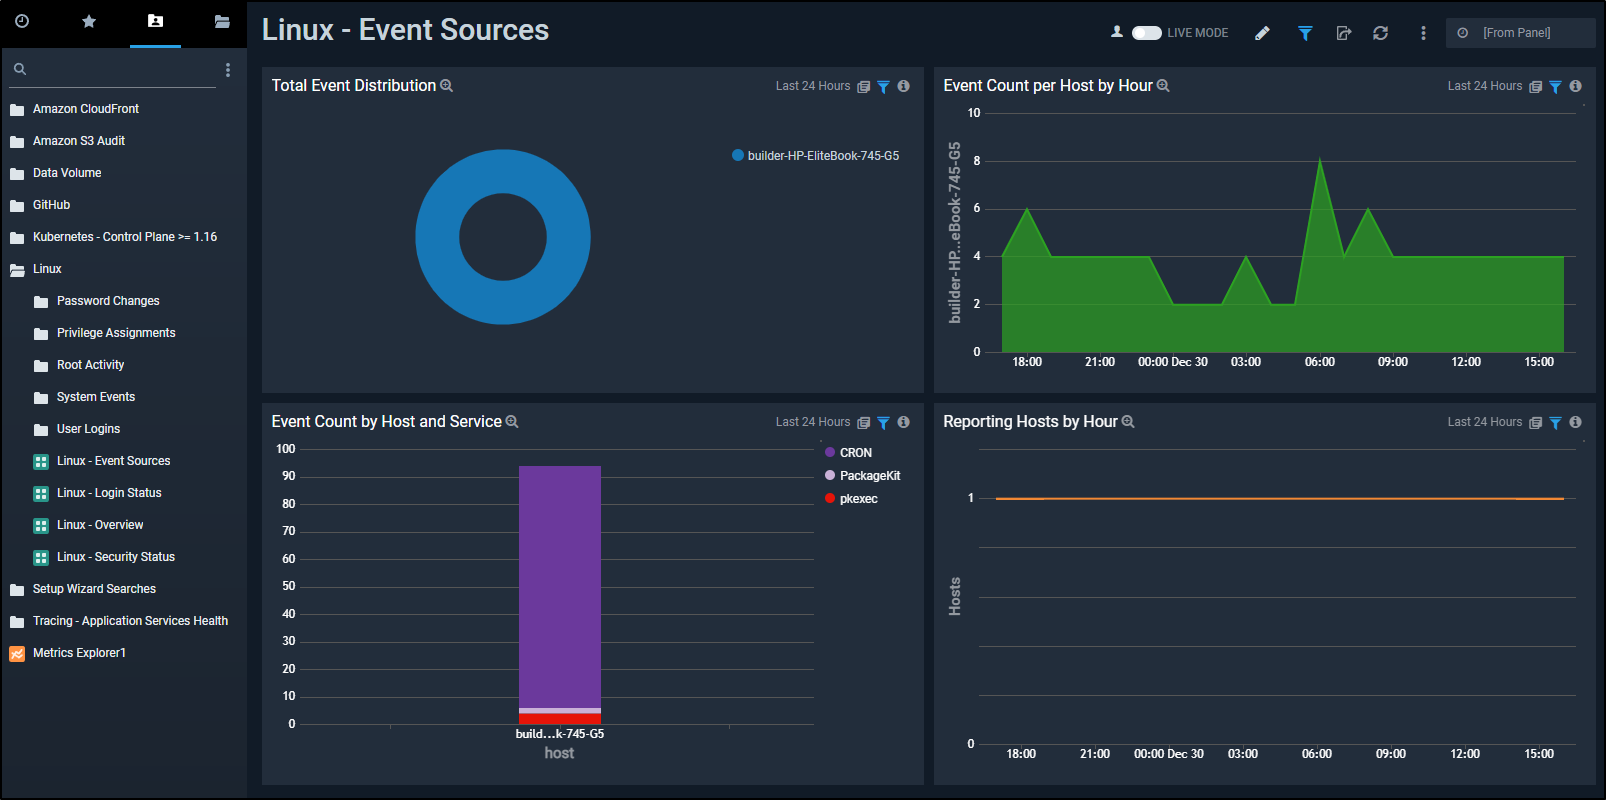
We had set up a simple Local Agent on a Linux host (running Cribl Logmonitor) and let it collect data for a day.
Circling back on it, we see that most of the events came from Cron and when the spikes occurred
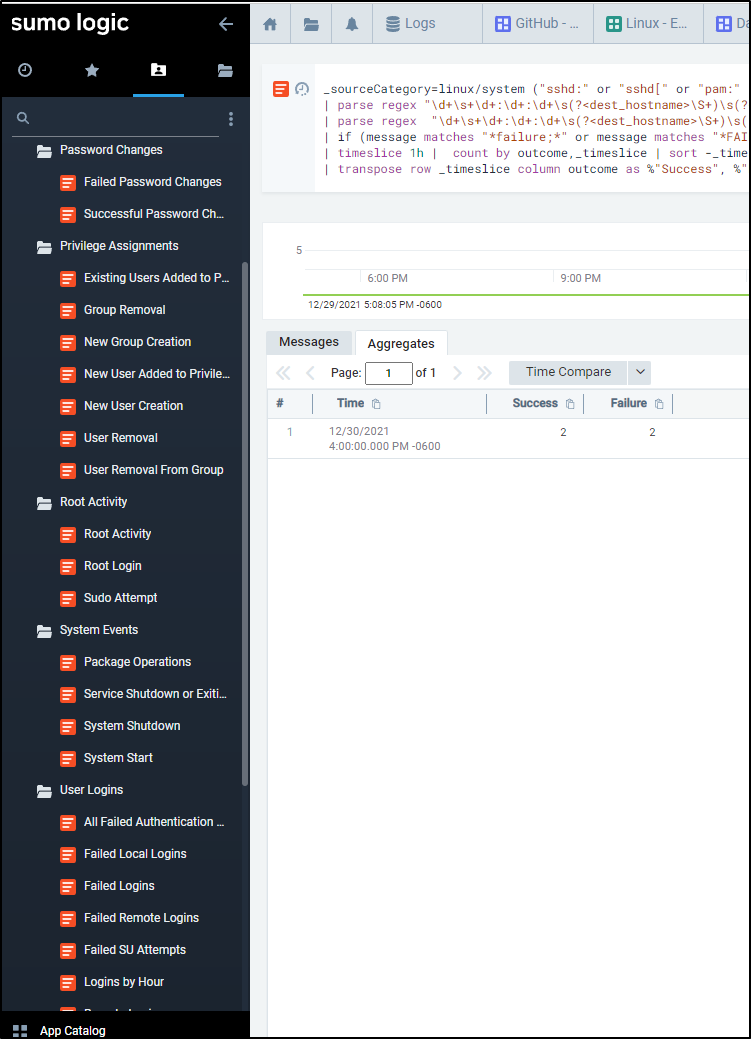
We see the wide range of queries we can do against the host, such as logins per hour
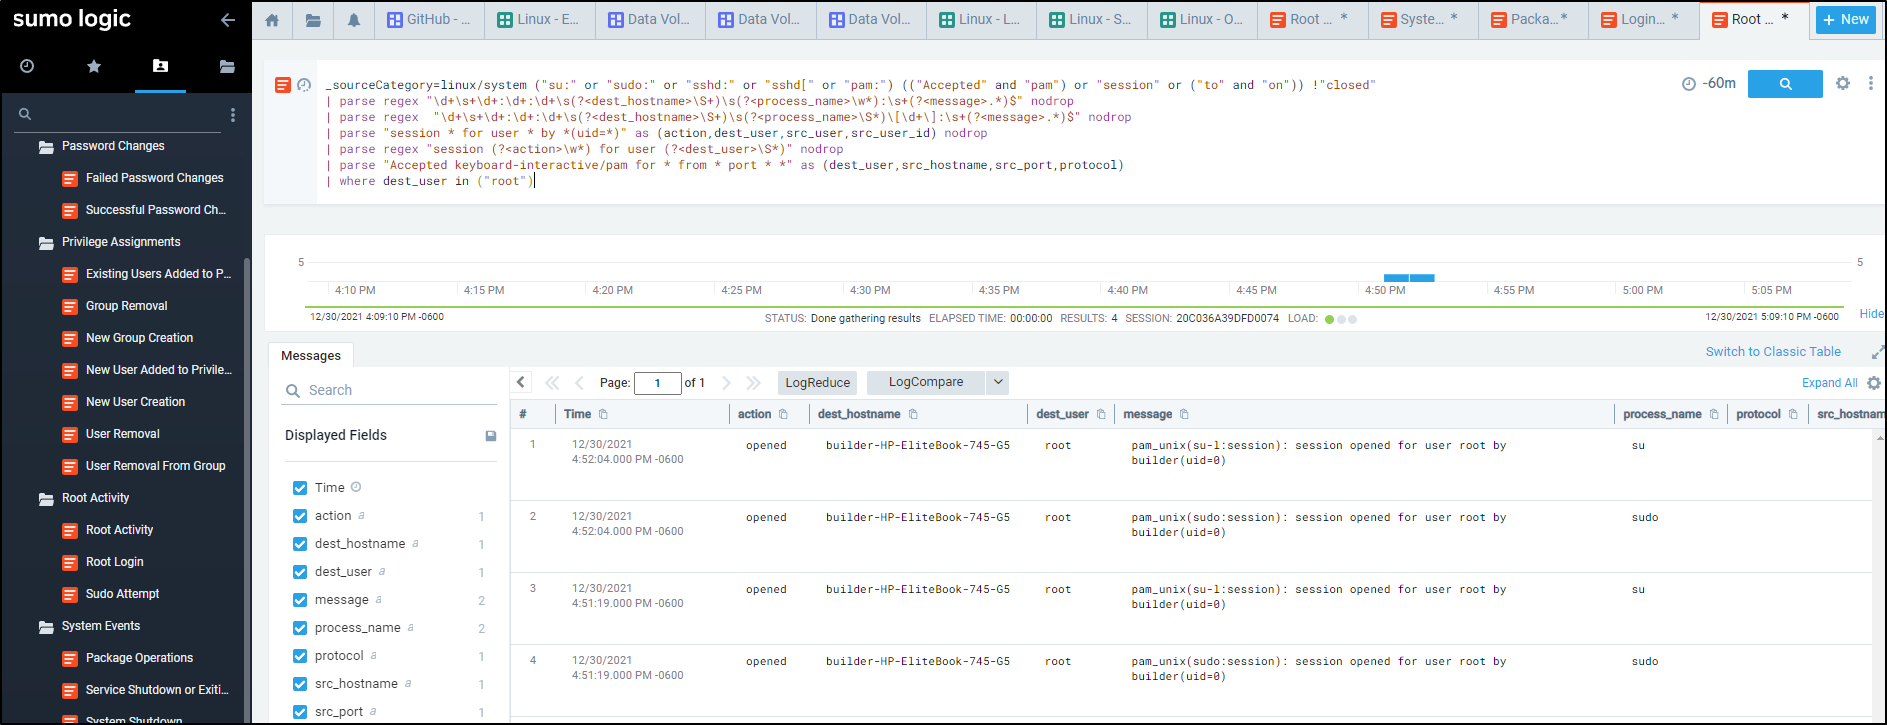
Perhaps we want to figure out who was logging in as root and when
Local Agent Windows
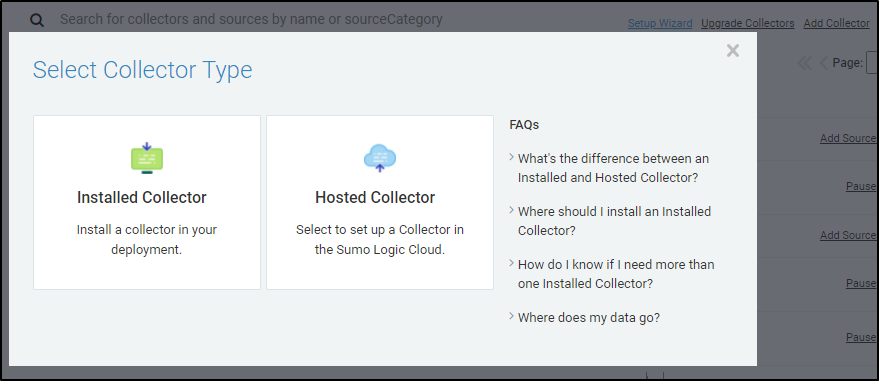
Let’s add a new “Installed Collector”
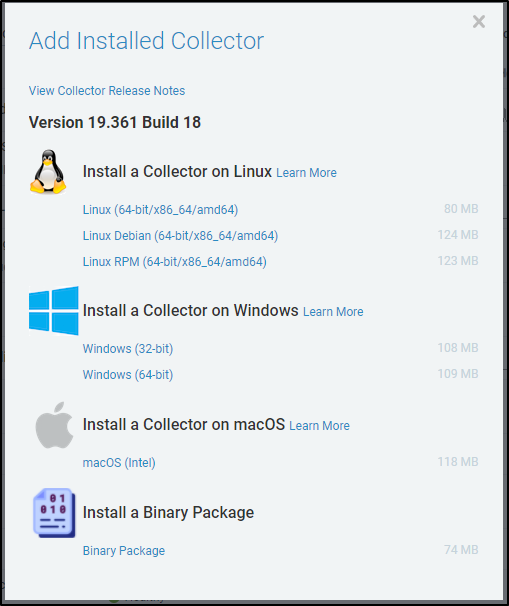
Next, we choose the 32 or 64bit windows collector (I’ll use the 64bit)
We can launch the installer and when prompted, confirm we are good with it making changes to our computer.
The installer will run
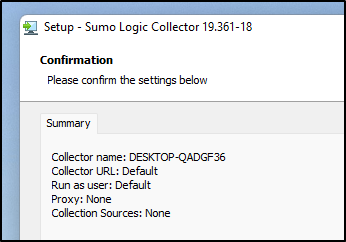
and let us know how the machine will appear in Sumo Logic
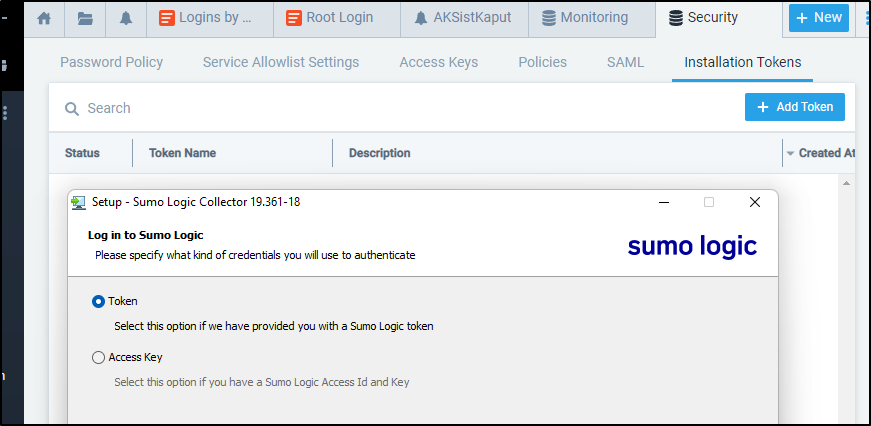
Next, we need to chose whether we want to use an Access Key or Token. A Token is easily created in the “Installation Tokens” area
We use it and complete the installer.
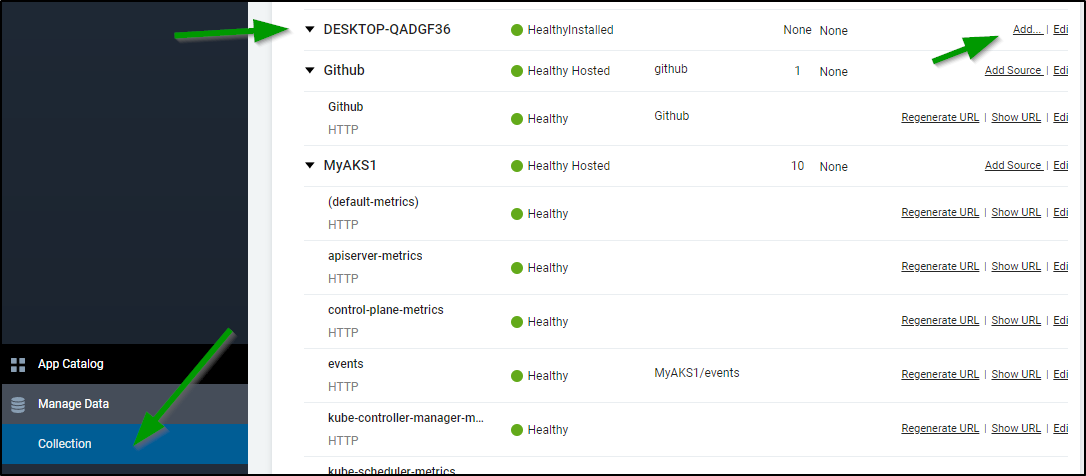
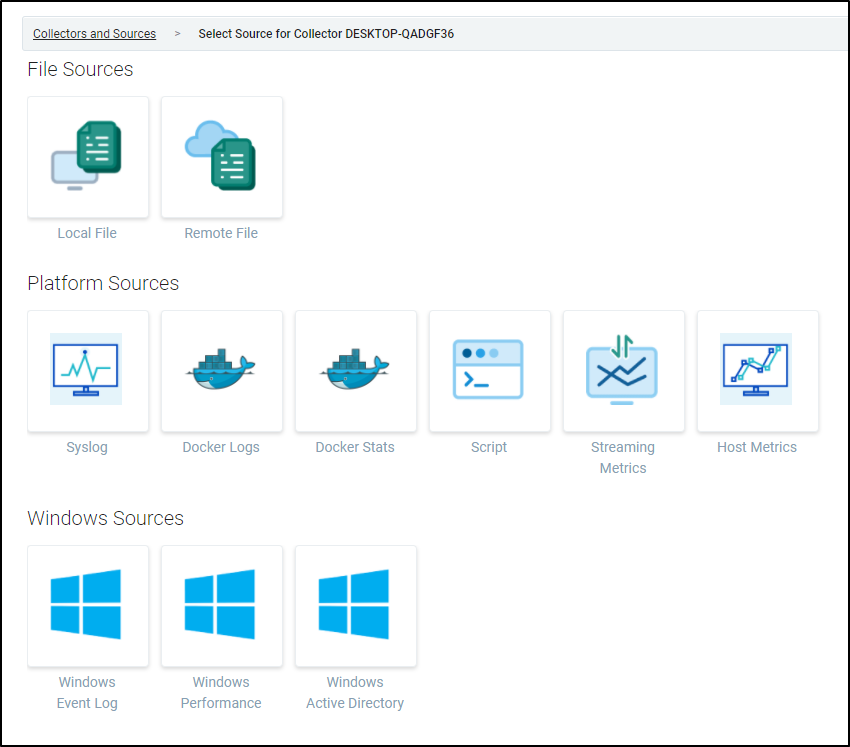
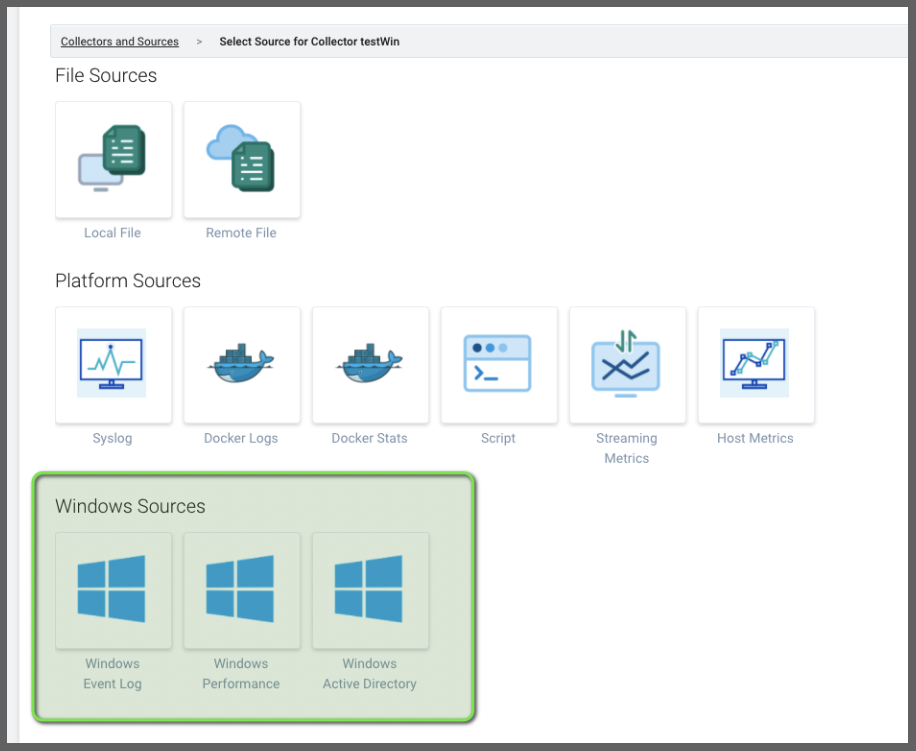
Now in our Collection we see the Machine. This means the collector agent is running, but we need to “Add Source” to chose what kind of data to import. Click Add source from the machine collector:
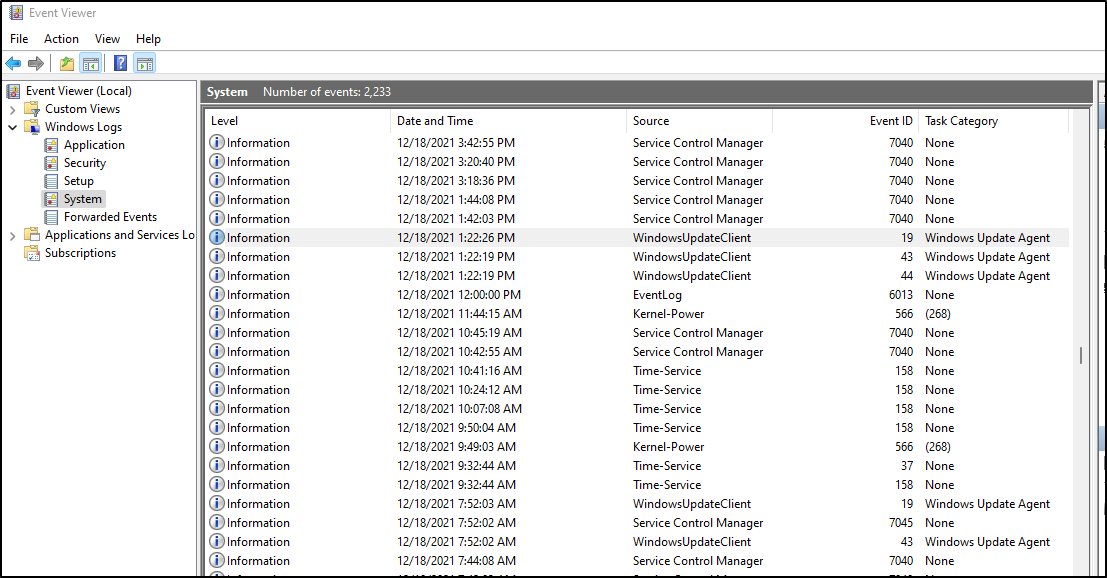
Perhaps the key thing I really want to know is when people run updates. I can see on Windows that comes from the System Event Log
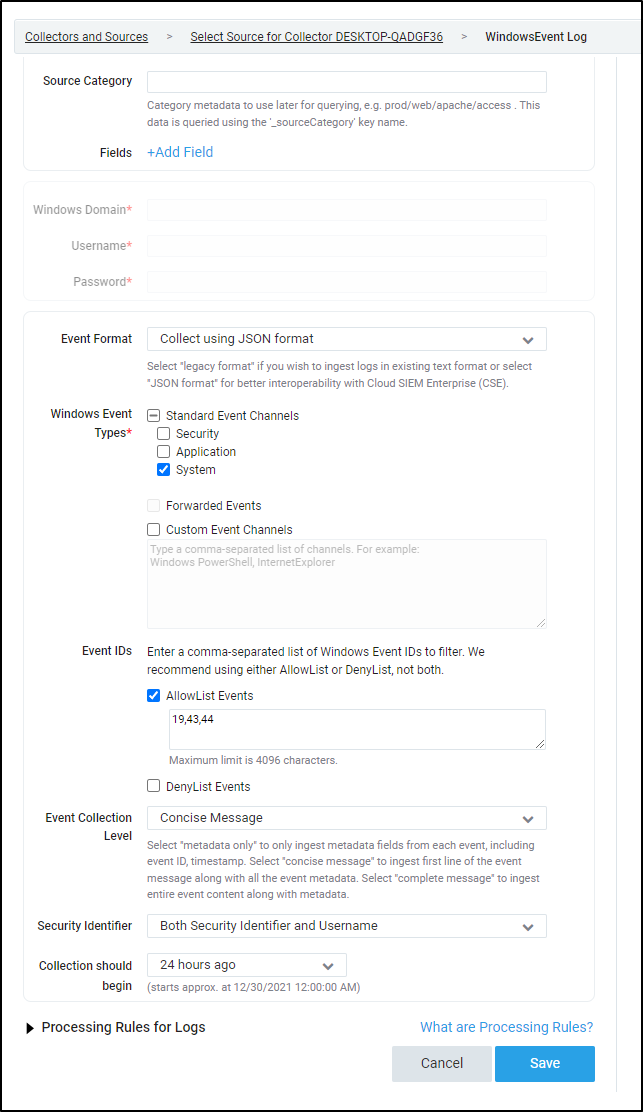
I can choose the “Windows Event Log” Source
Next, I just want to limit my Event IDs to those related to Windows Updates (19,43,44)
We can start to view windows events (for instance I set up a collector for all Events in JSON format under the main collector).
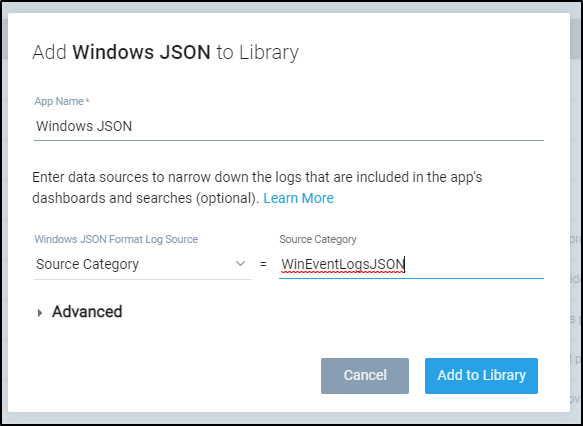
In app catalogue, Add the Windows App
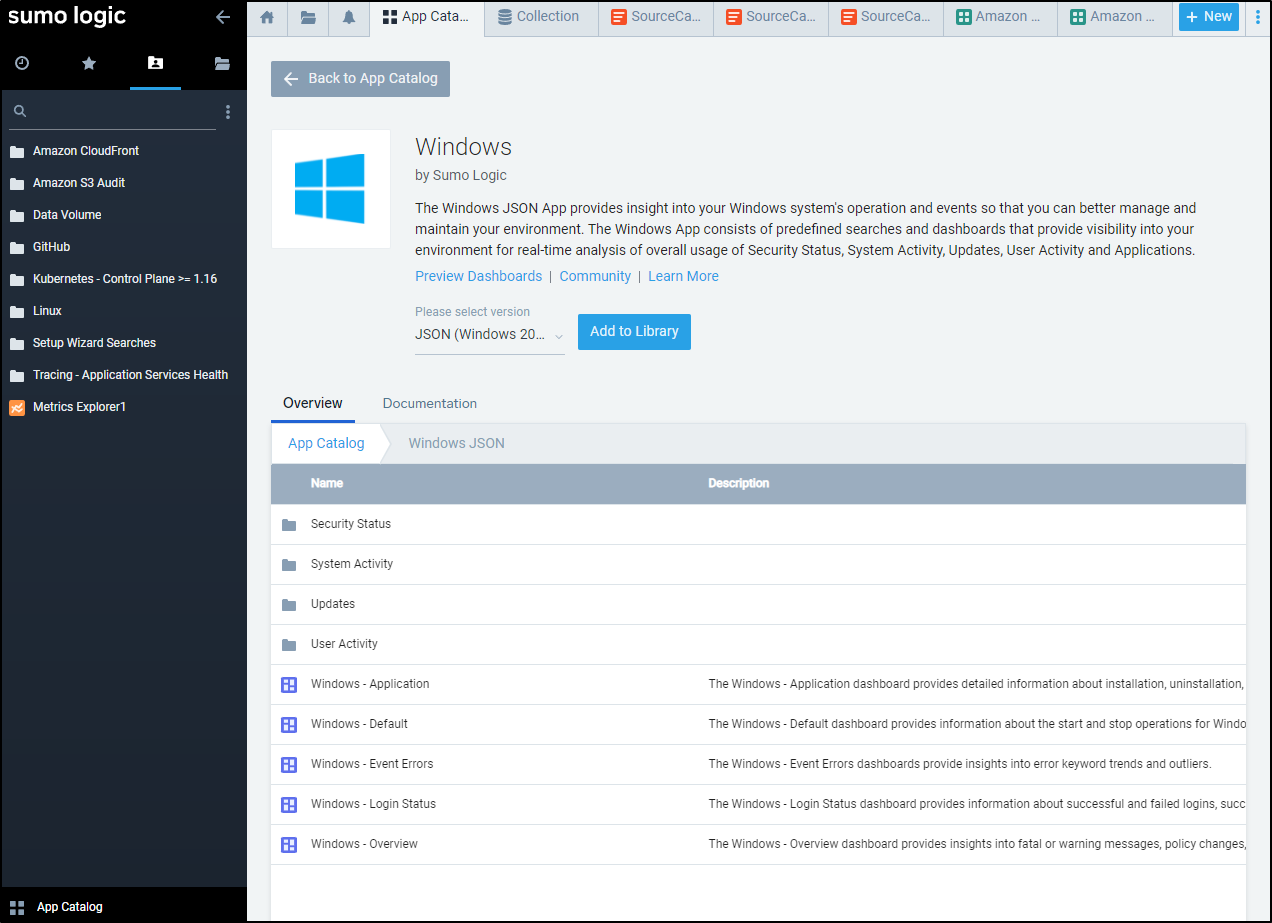
We want to use the Collectors source’s source category (WinEventLogsJSON)
Use that when adding the app
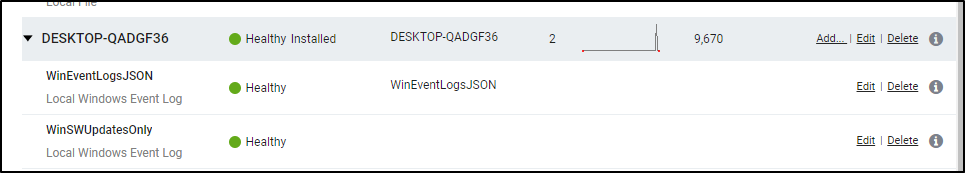
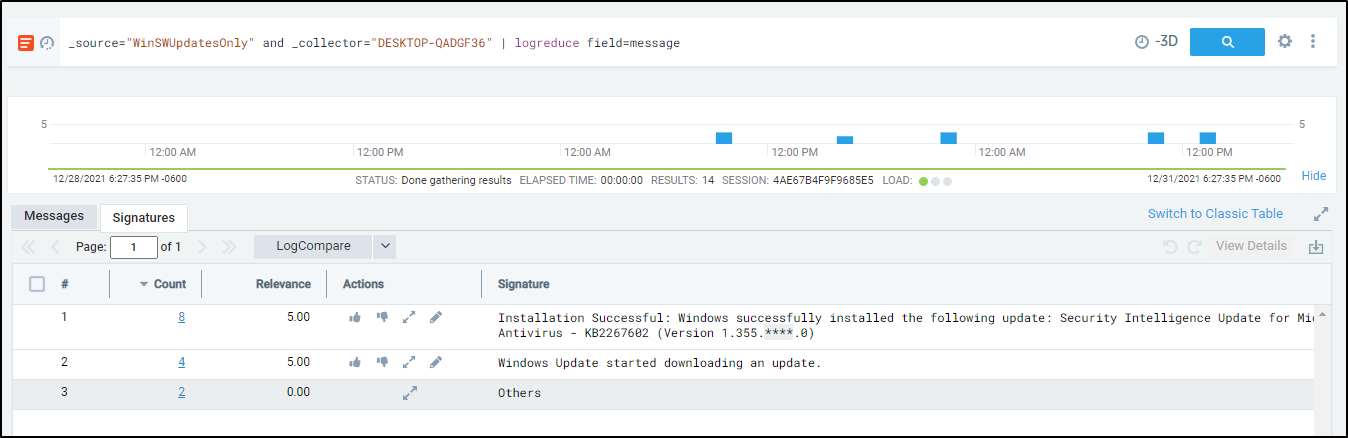
One thing we can do with the WinSWUpdatesOnly source is to logreduce on windows update messages
This shows, in effect, we had 3 Security updates in the last day: _source="WinSWUpdatesOnly" and _collector="DESKTOP-QADGF36" | logreduce field=message
Using Azure VM
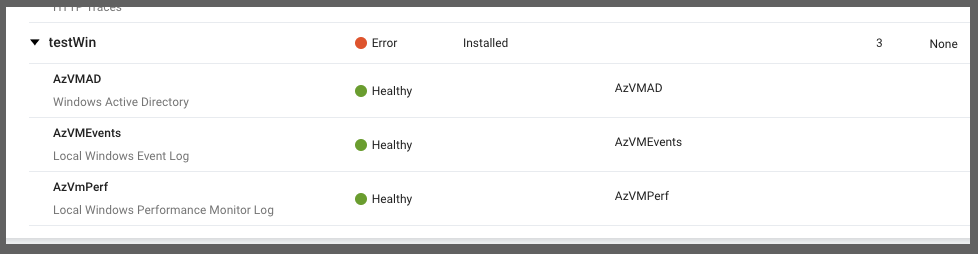
I went back to create a quick Windows Server 2012 Azure VM. This time I used the “Legacy” style collection (instead of JSON)
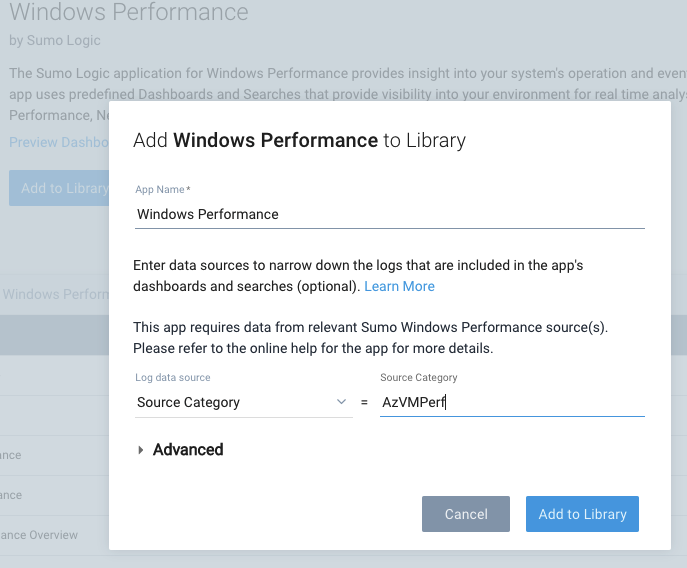
In addition to the “Windows Legacy” integration, I added “Windows Performance” as well.
In adding the “Windows Performance” App, I selected the Source Category for Performance counters (as you see above)
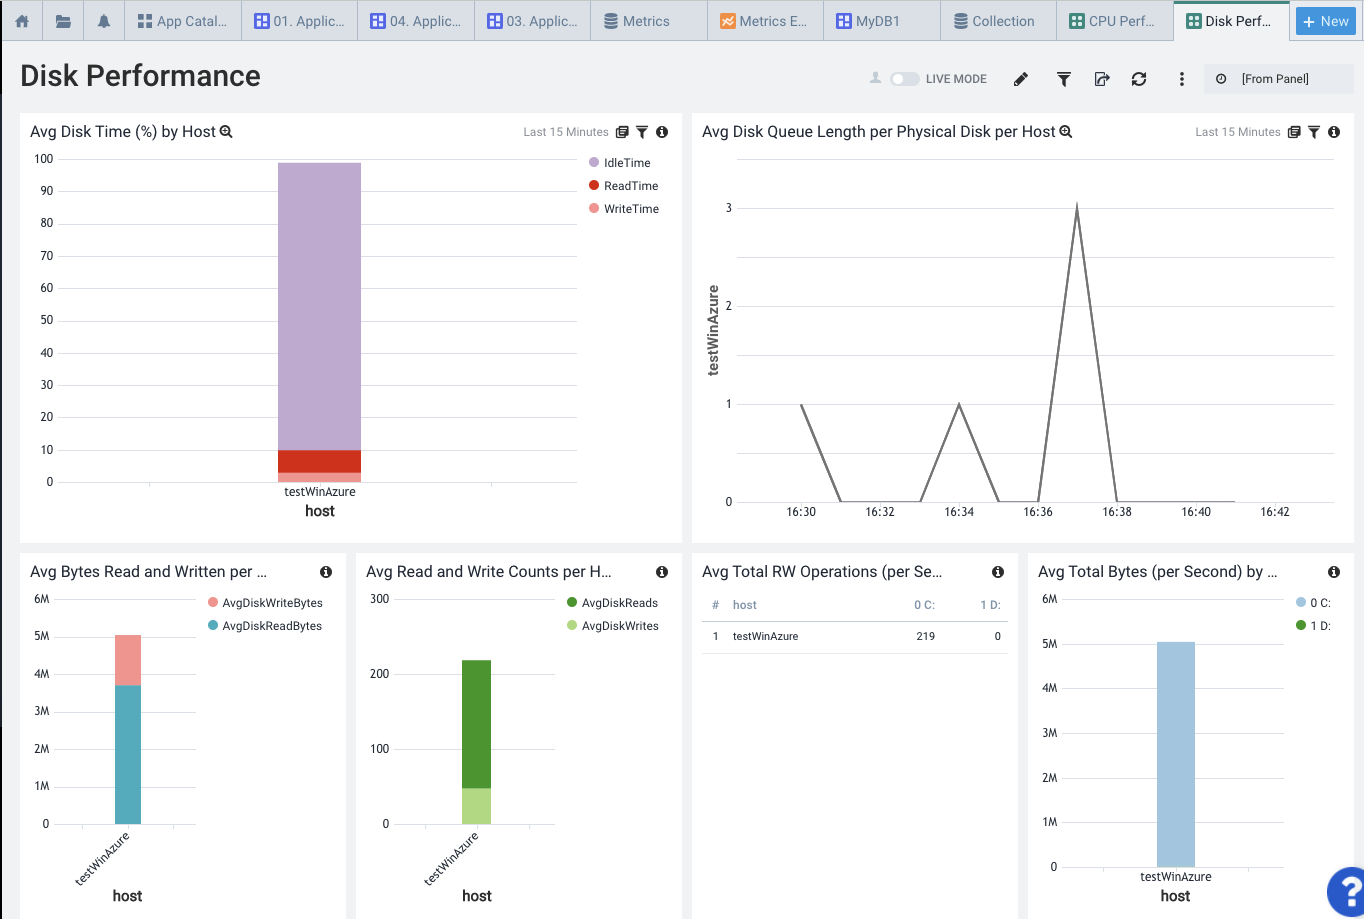
Performance Monitors
Here we can see Disk Performance
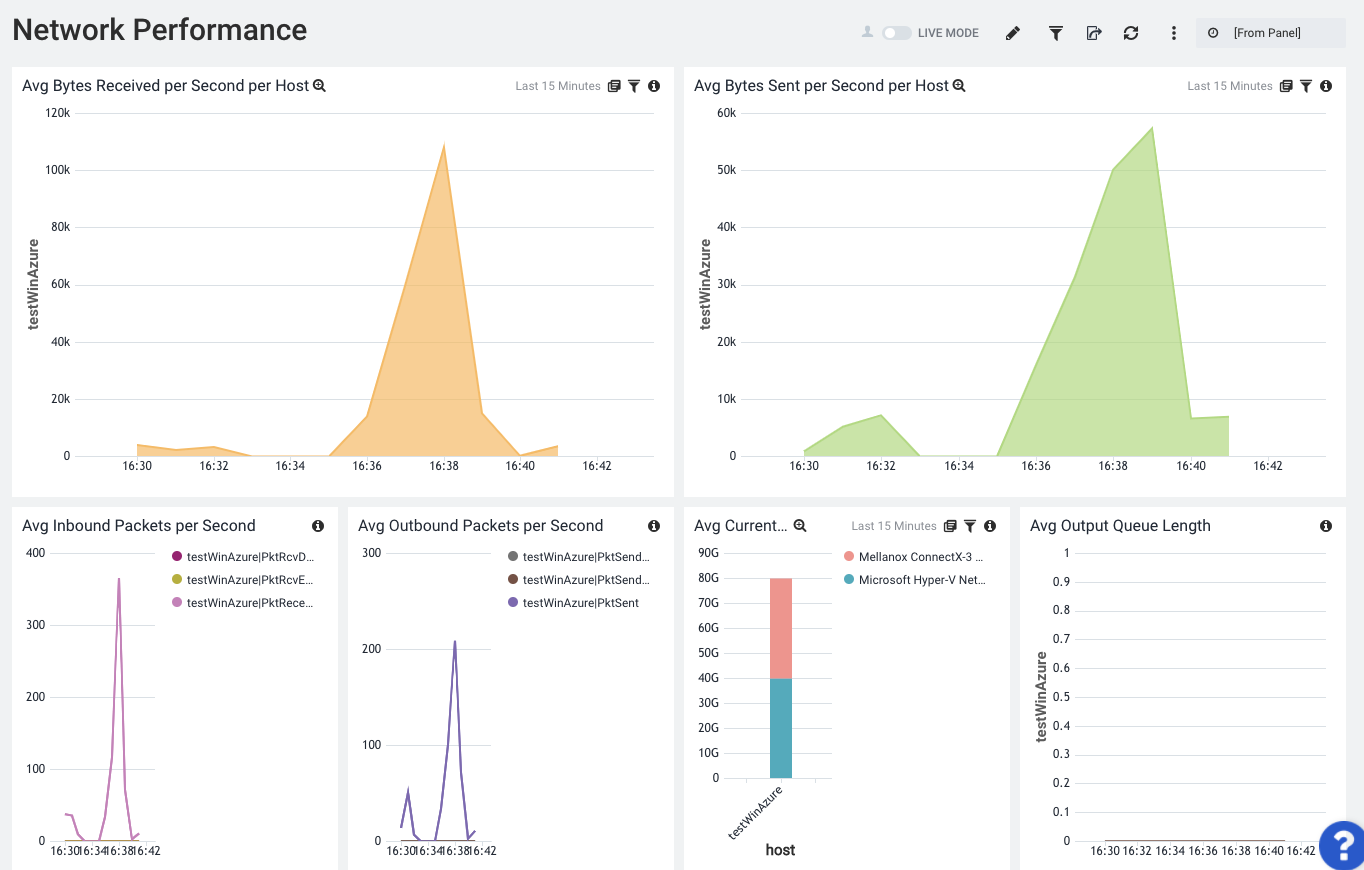
Network
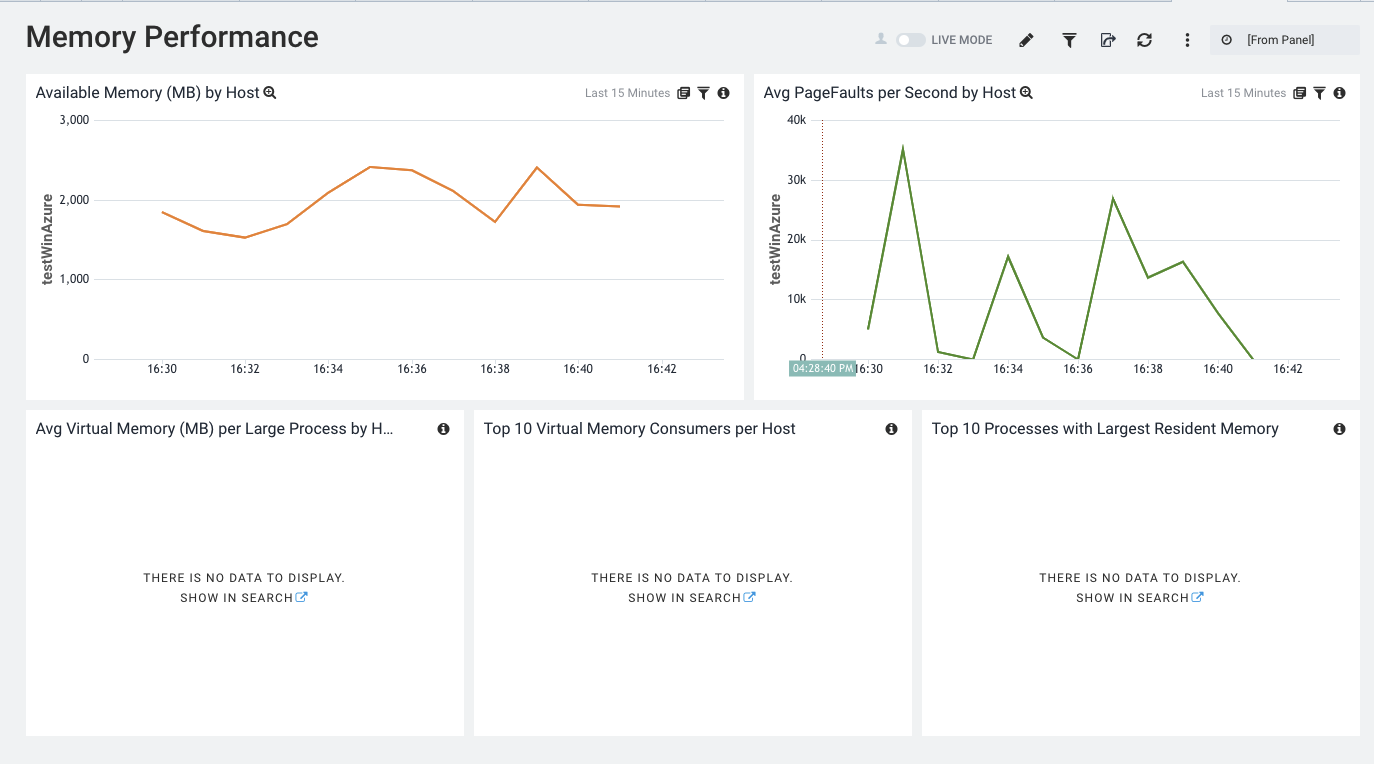
Memory
And a general Performance Overview
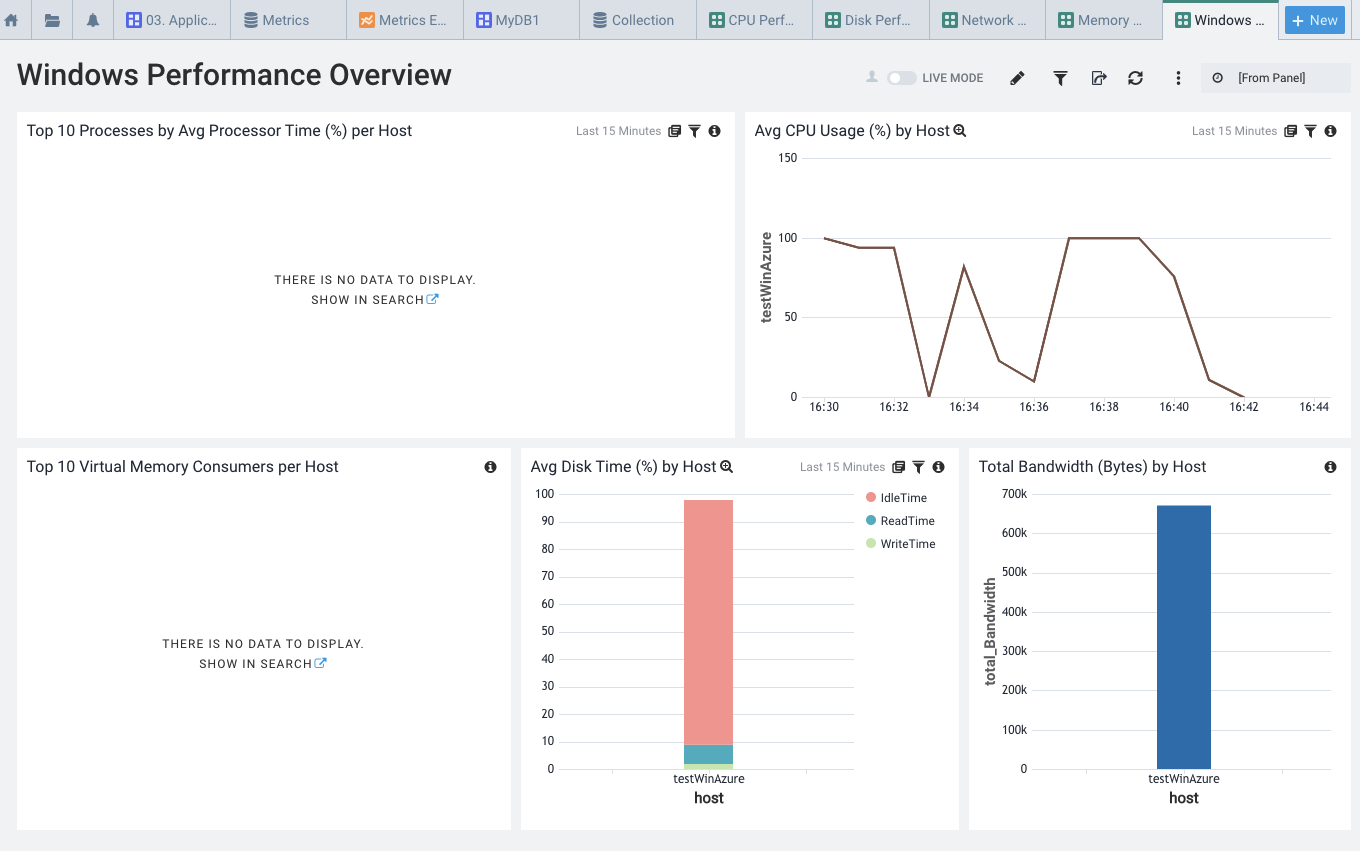
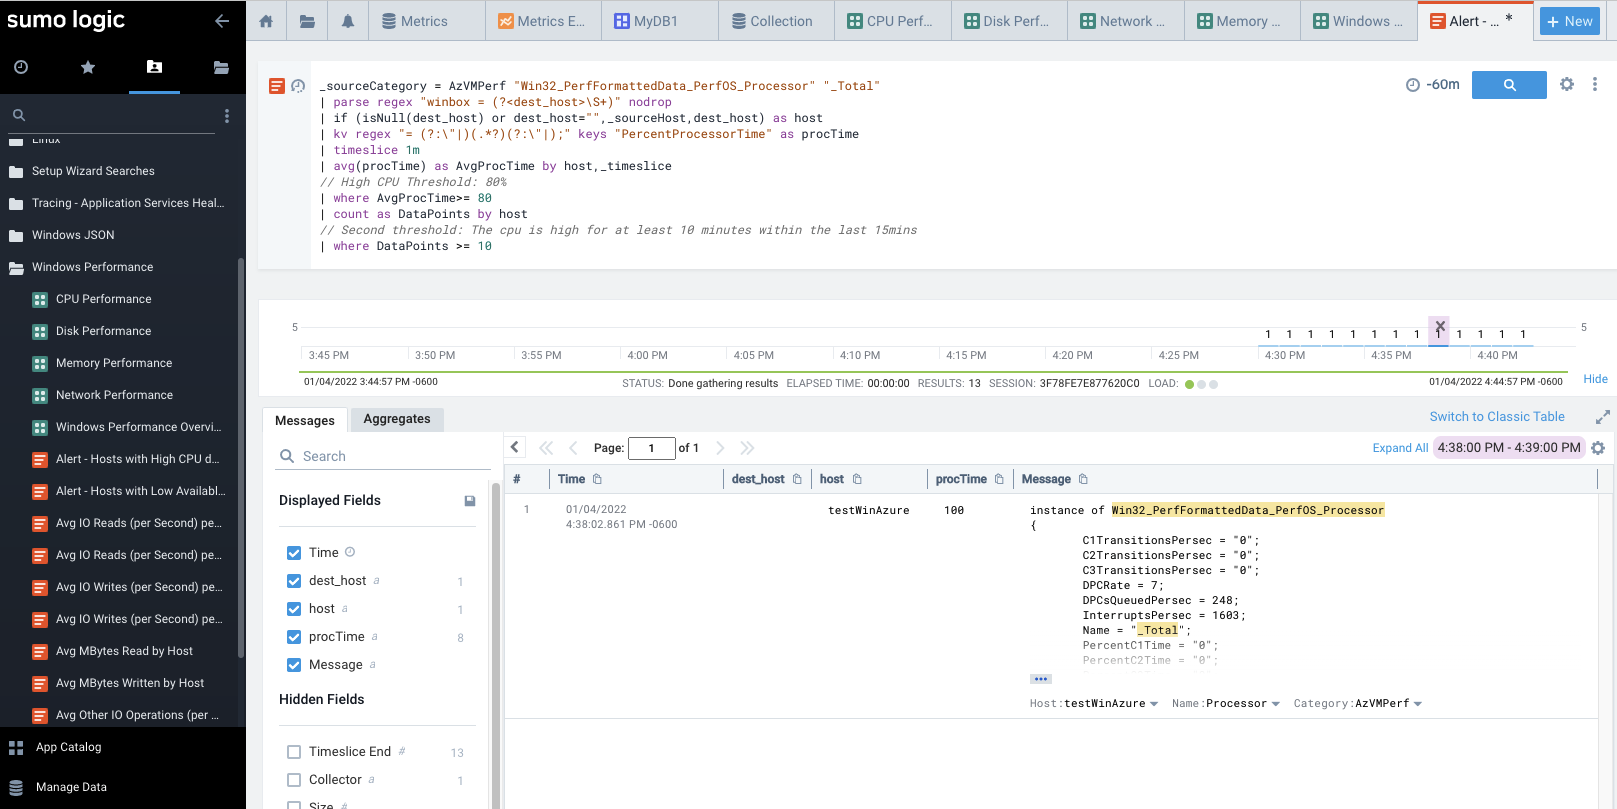
Besides graphs, we also have common queries to help find issues. Here is a report to highlight High CPU times
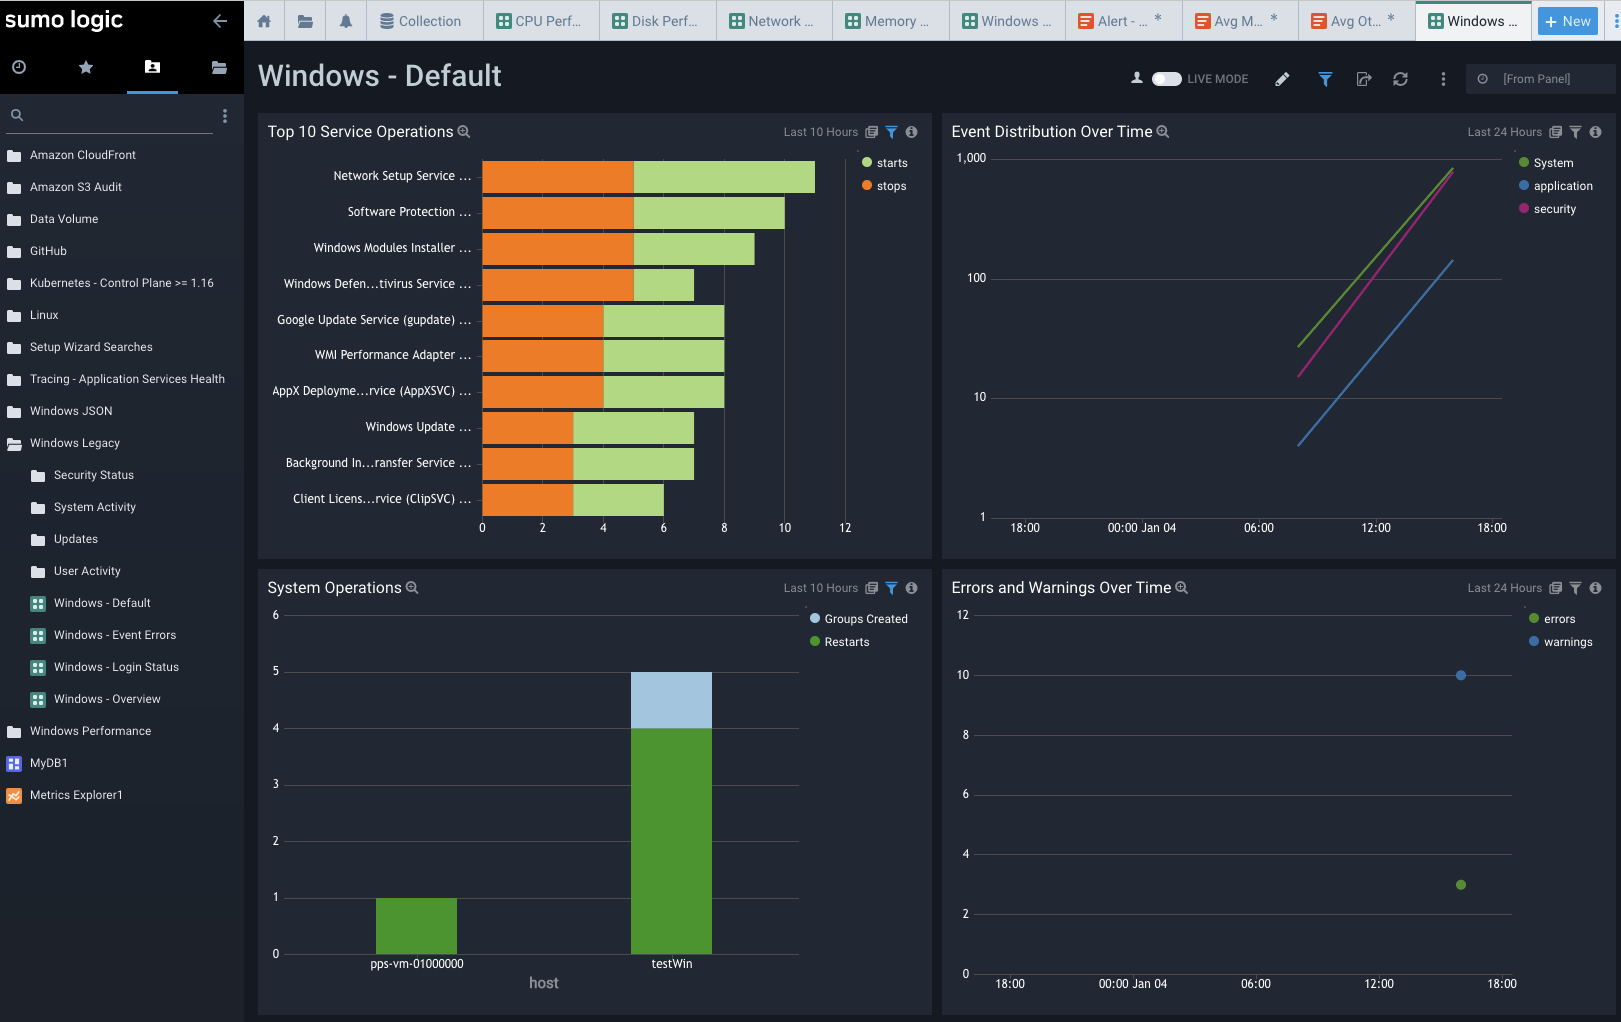
Windows Legacy Dashboards
Like the JSON ones, we get similar information. The Default Overview gives us top service operations and events.
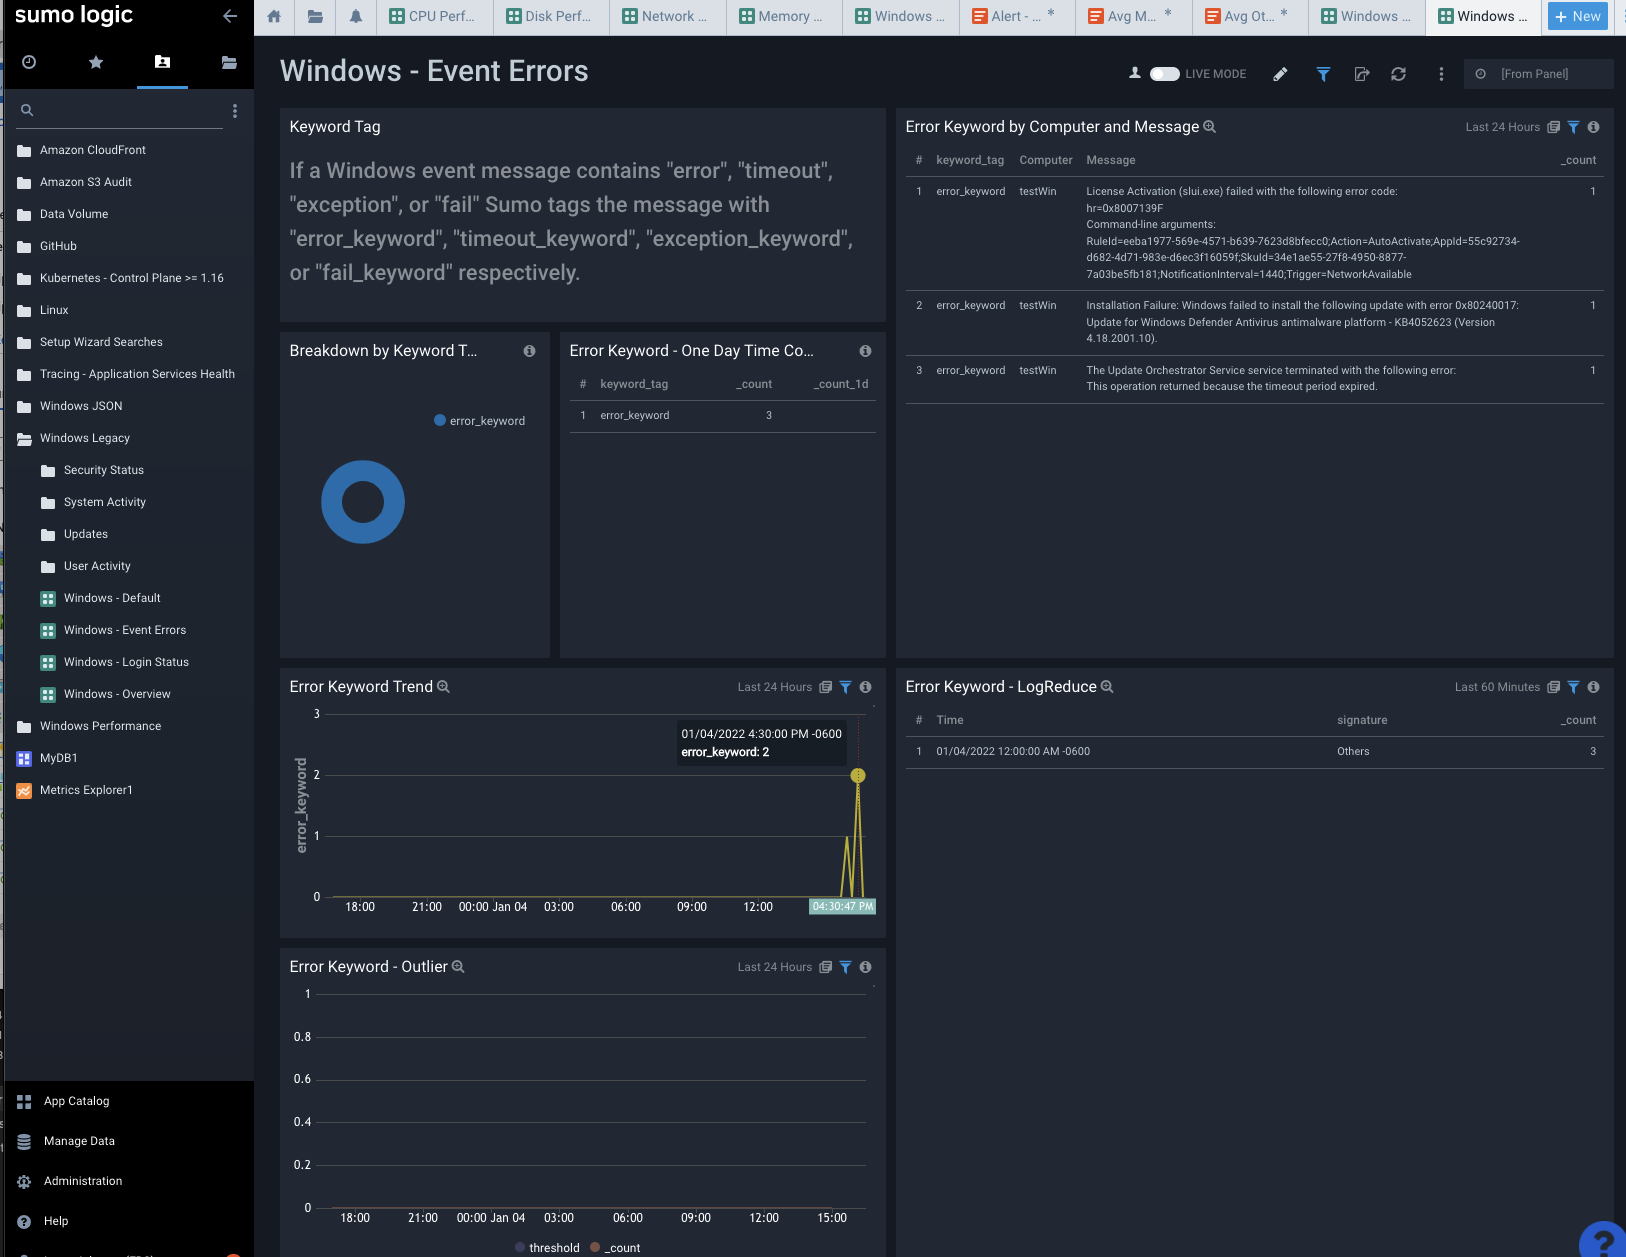
As you would expect, Windows Errors highlights errors from the event log. We saw some Update, Defender and license activation errors from boot up of the VM.
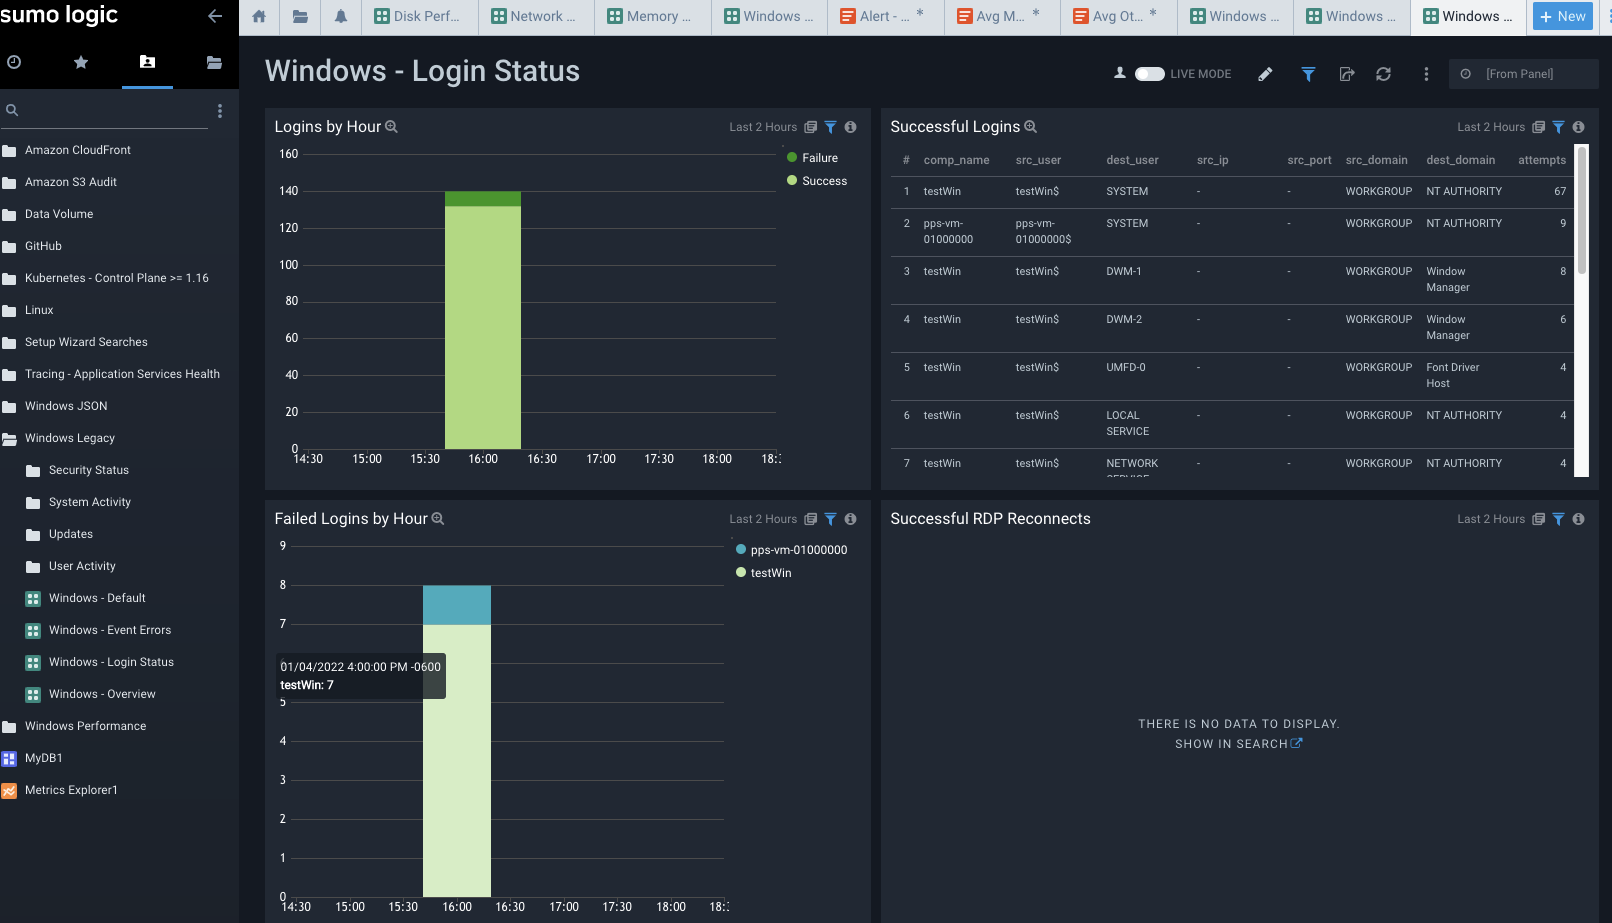
Login status, as one might expect, shows logged in user. I used a local ‘builder’ user on this VM. Had I tied it to AD/AAD we might see more interesting data.
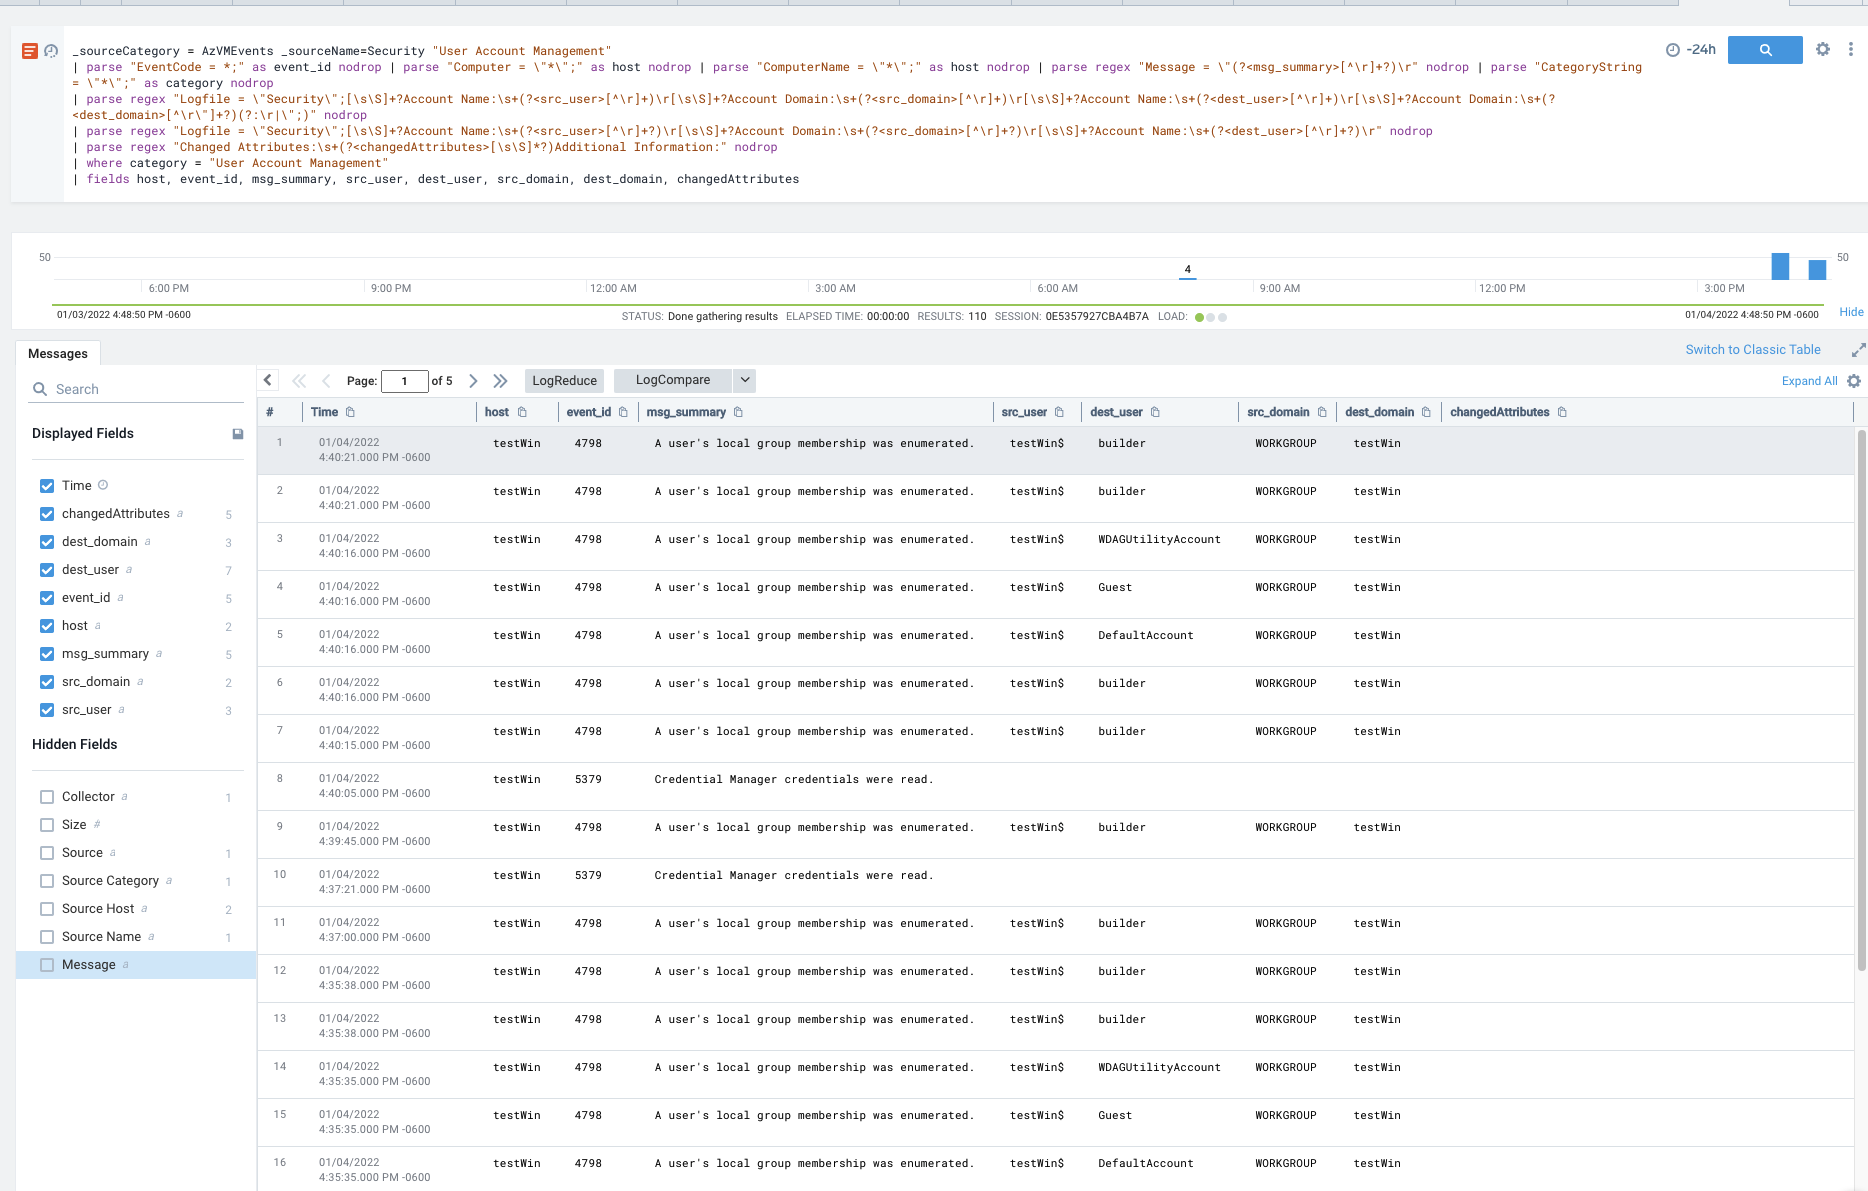
Here is another useful report from the Windows Legacy app that shows User events from User Account Management
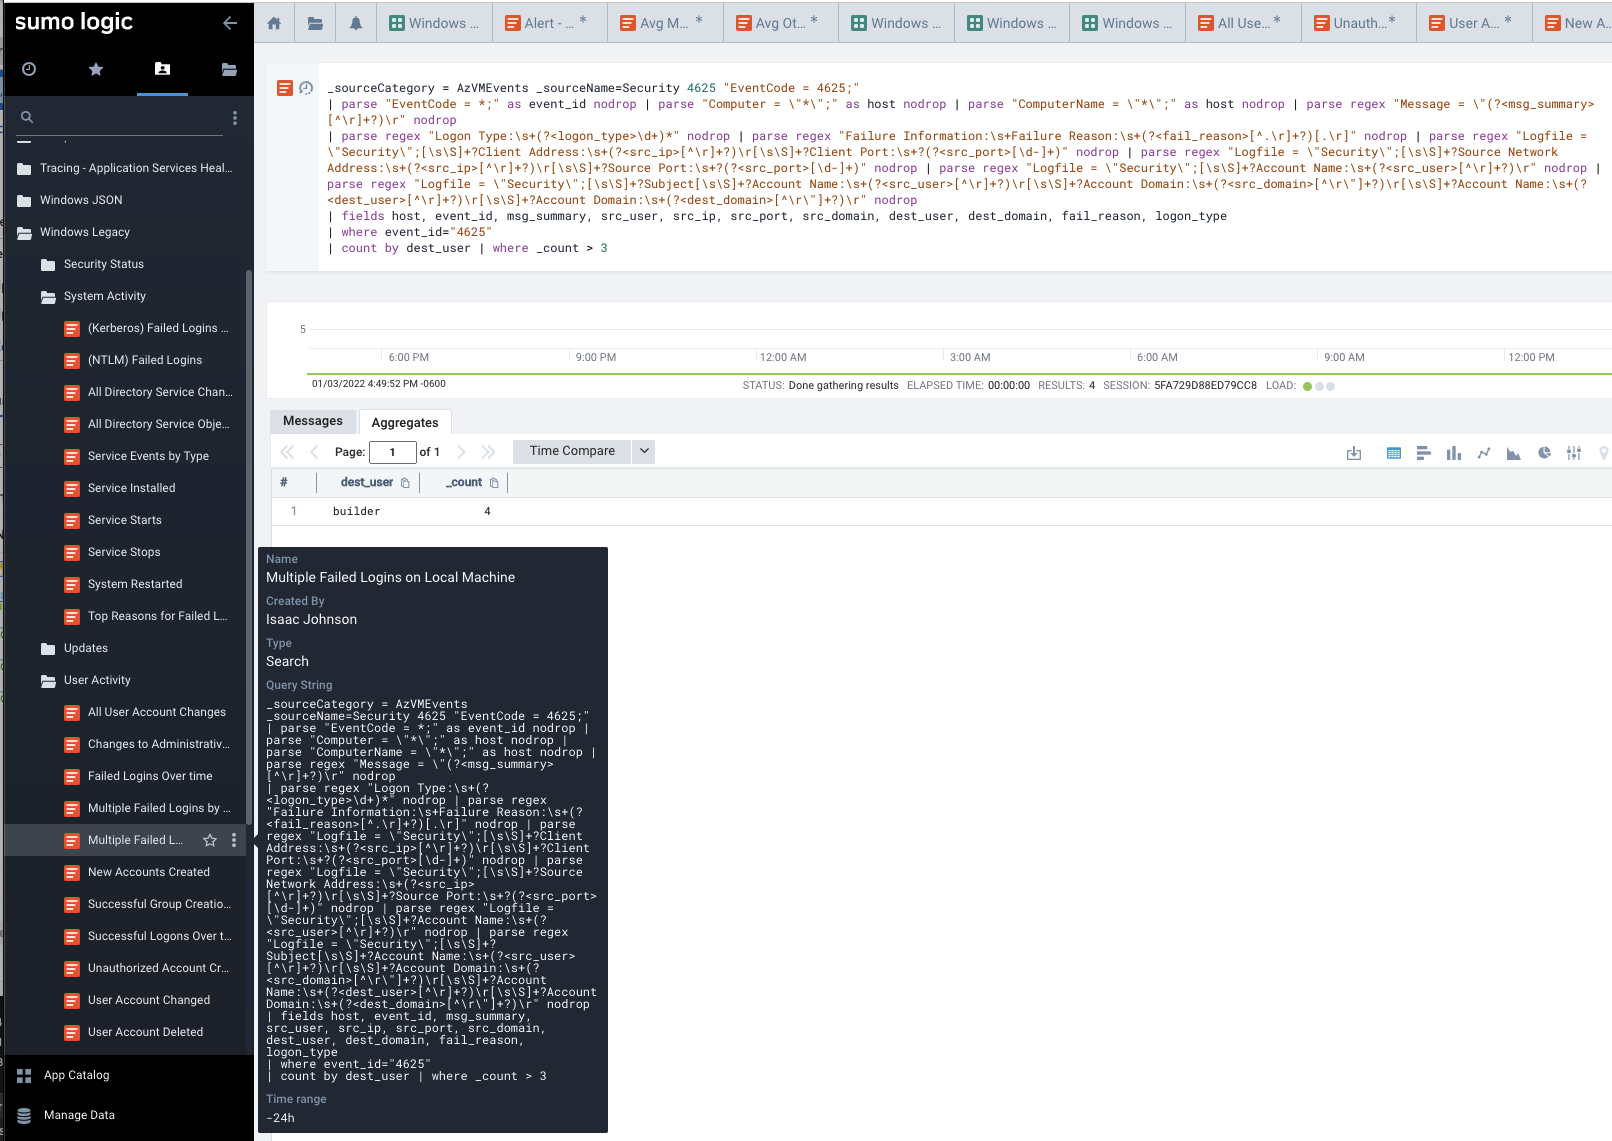
But maybe what I really care about is Failed Logins. Here I intentionally tried to fail to login 3 times. As you see, it shows a count of 4 which is, friends, why we don’t put public IPv4 windows VMs with standard RDP ports. In the less than an hour it was up, there were attempts not from me.
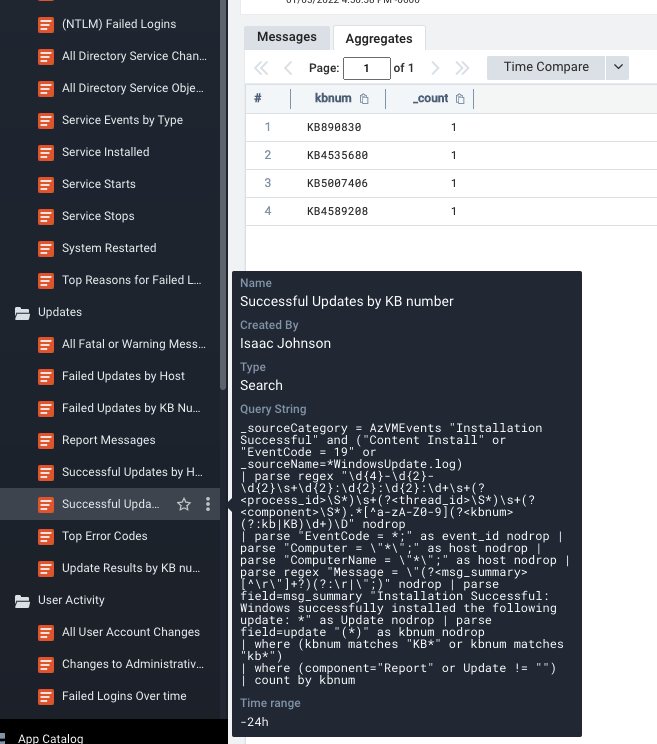
Another really handy report I found was Windows KB updates. This tends to be something in Operations we get asked a lot - was a KB applied to all hosts. Here we can query against some or all hosts.
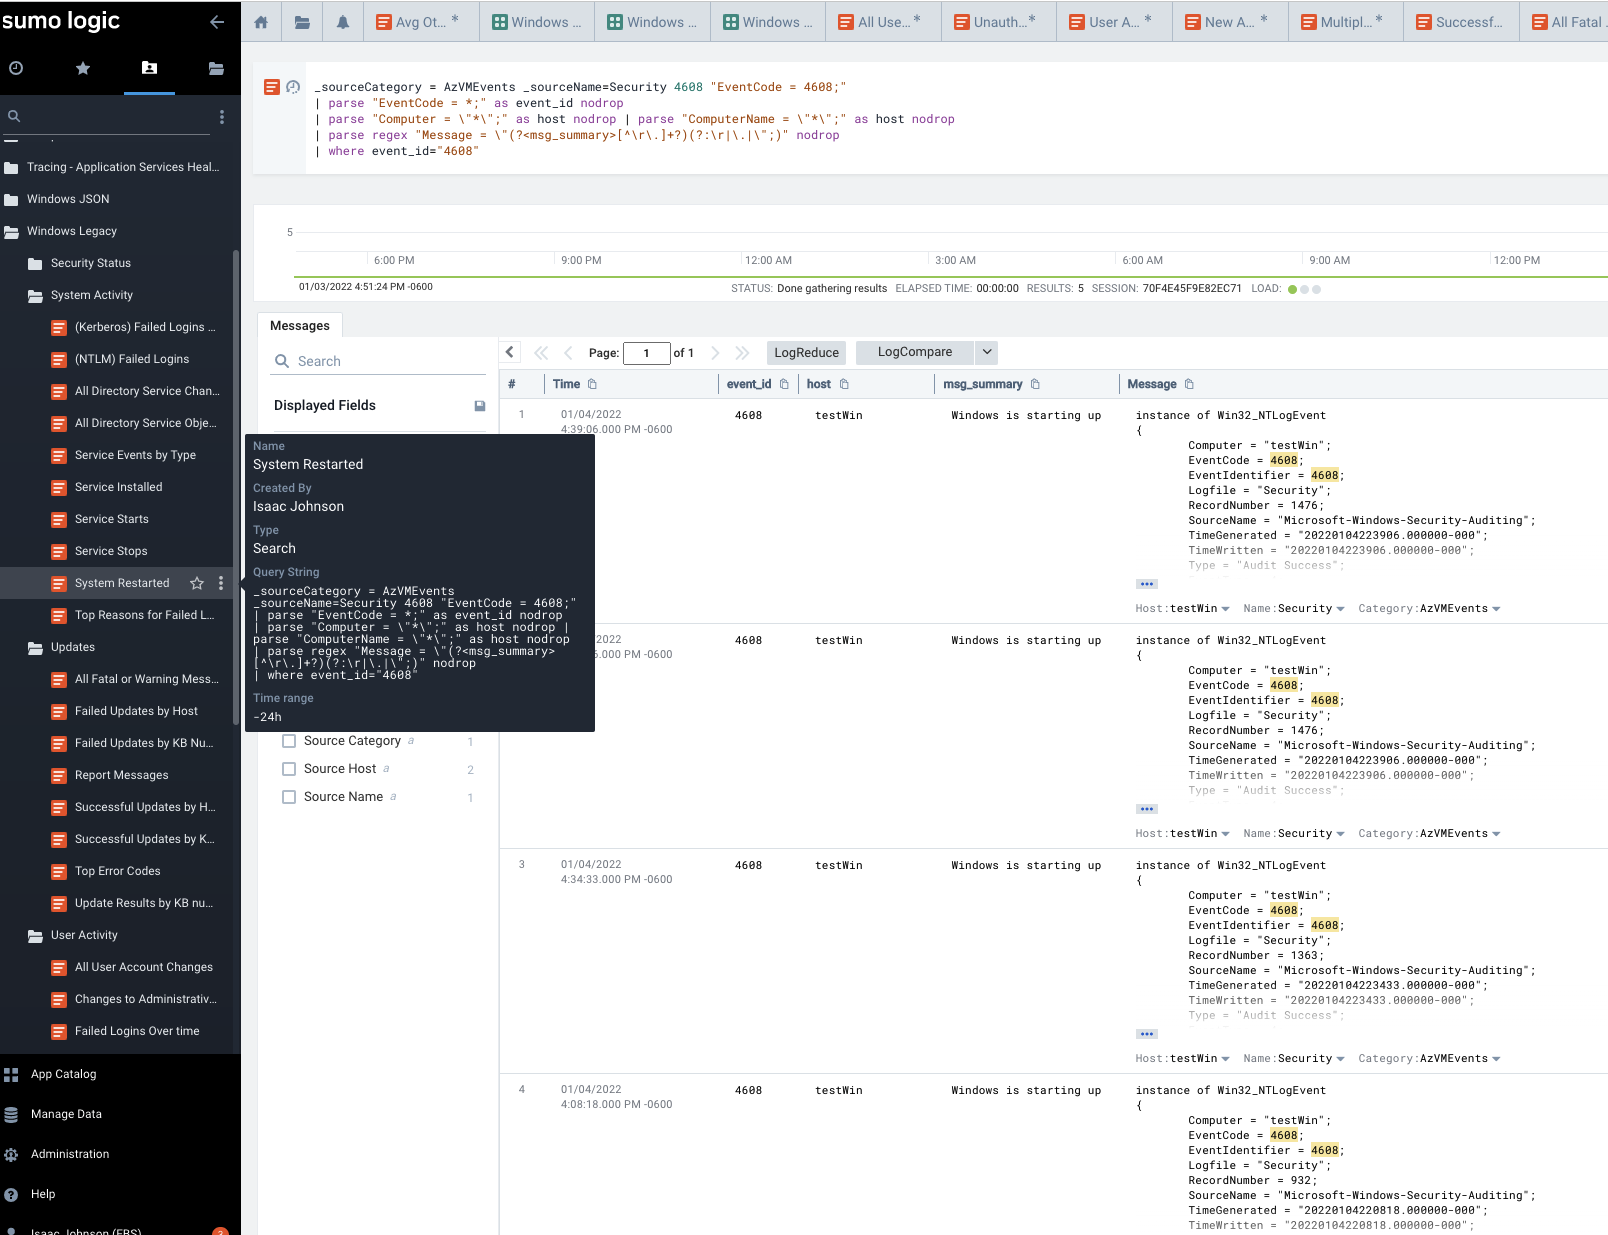
One more quick report that I find handy - Windows Uptime, or put conversely, when were systems restarted. I ran Windows Update a few times and rebooted to see this data.
Notifications
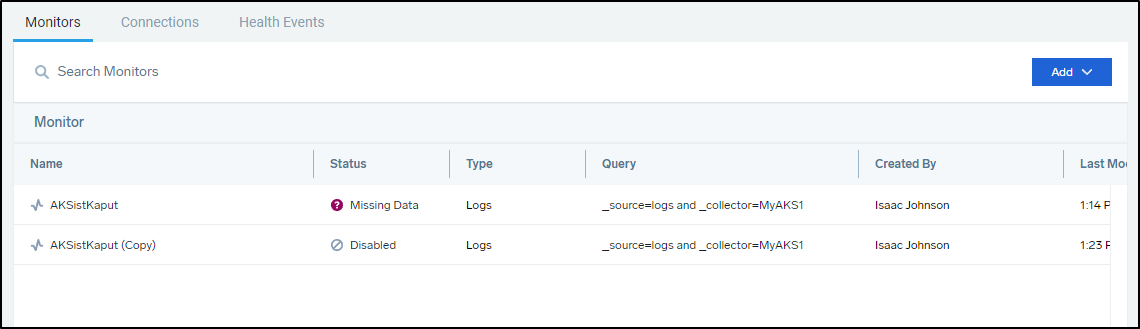
We already showed you the basics of using the Monitor. Here you can see one monitor disabled and the other active due to missing data (as I removed that AKS cluster)
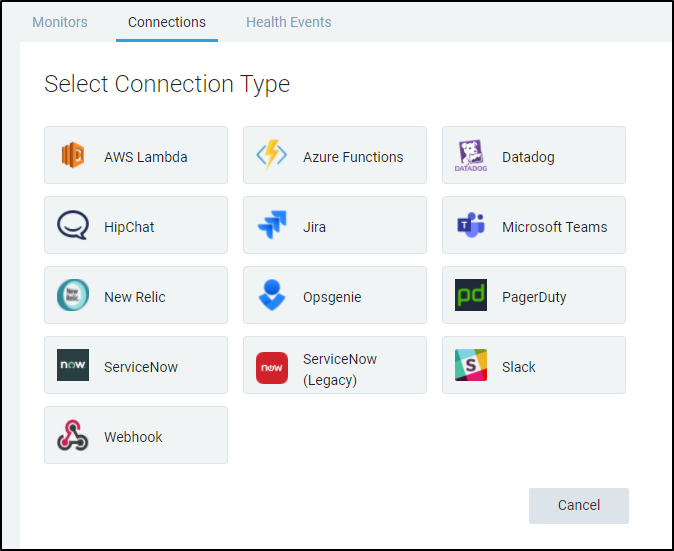
But presumably I would like to notify in more ways than just email. That is where we can add Connections:
One thing I found interesting is the idea that Sumo Logic could work in partnership with Datadog.
That is, I could create a connection to send an Alert though Datadog which might already have the notification and escalation paths setup
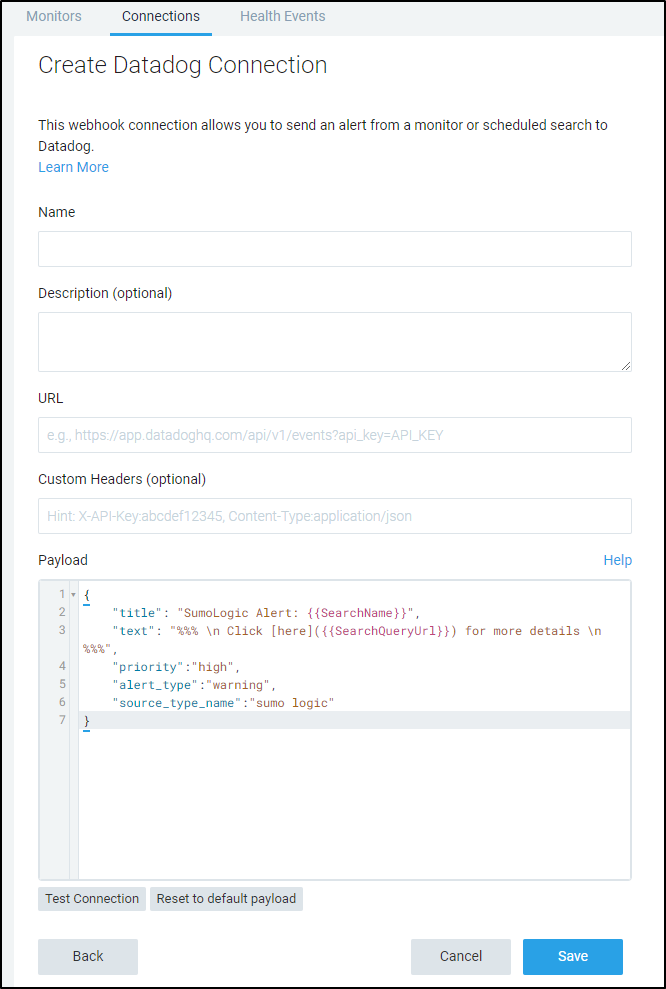
Checking the current API docs for Datadog events we see the POST URL is https://api.datadoghq.com/api/v1/events
Let’s set up a sample payload to see what that looks like:
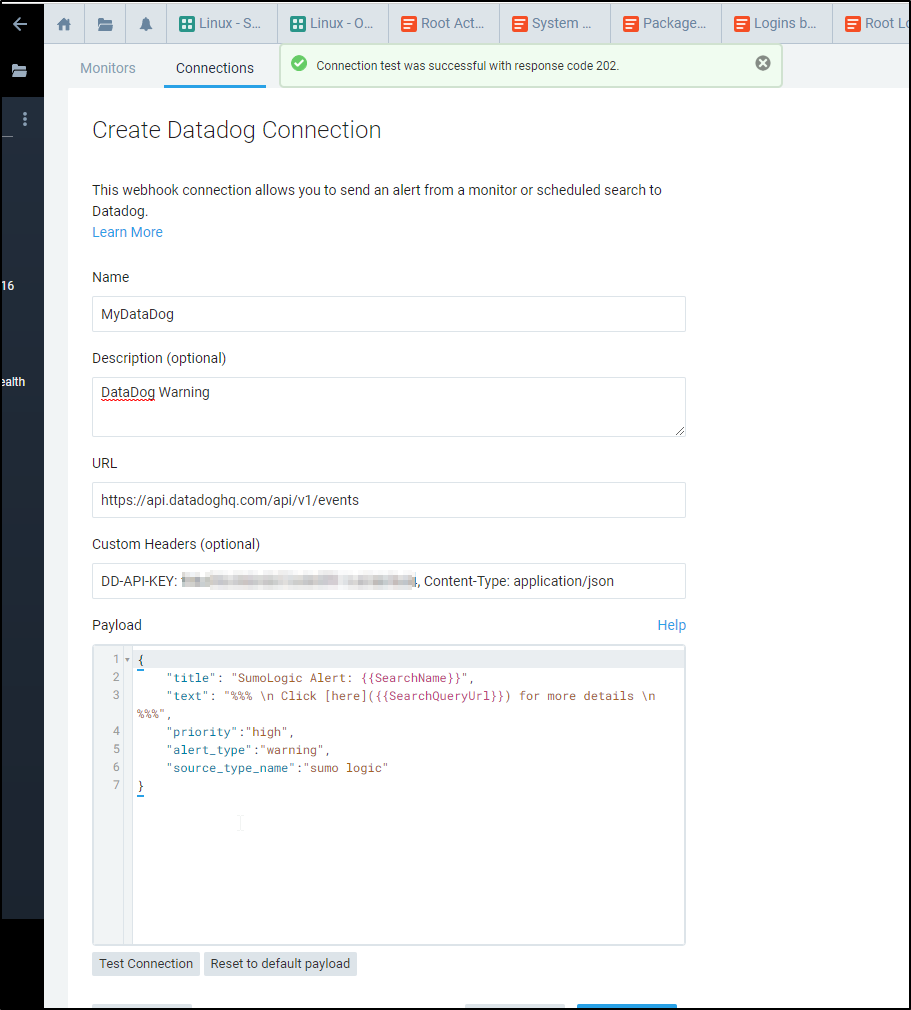
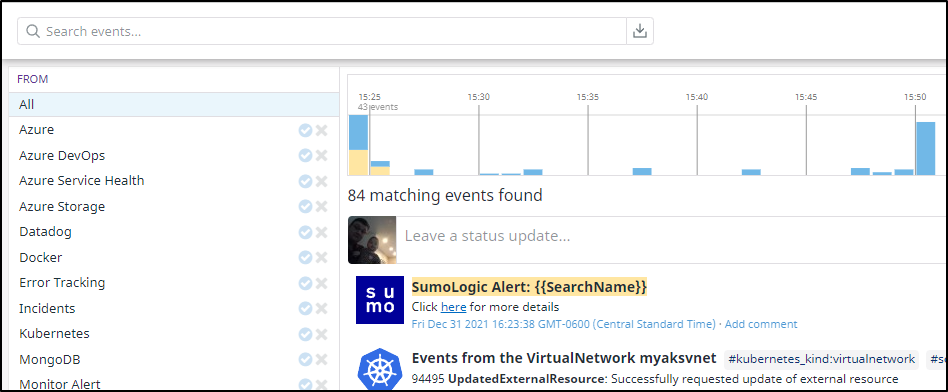
This should generate a warning. If we click okay, we can see the alert details show up in my Datadog events window:
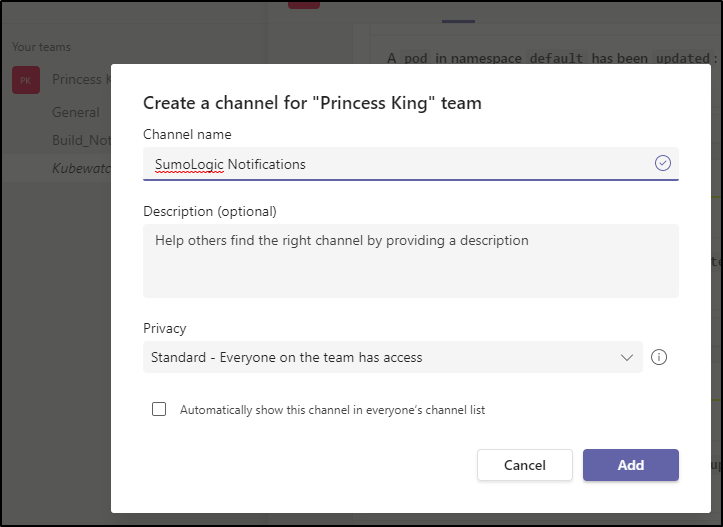
Teams
Let’s create a new Channel in Teams for Sumo notifications:
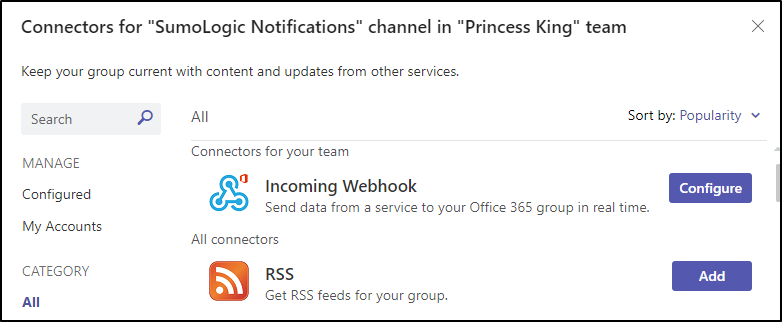
Next, we can add connectors in the Connectors menu:
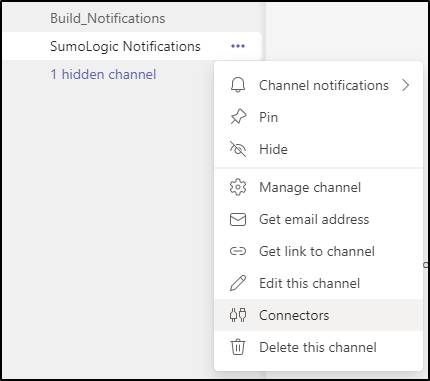
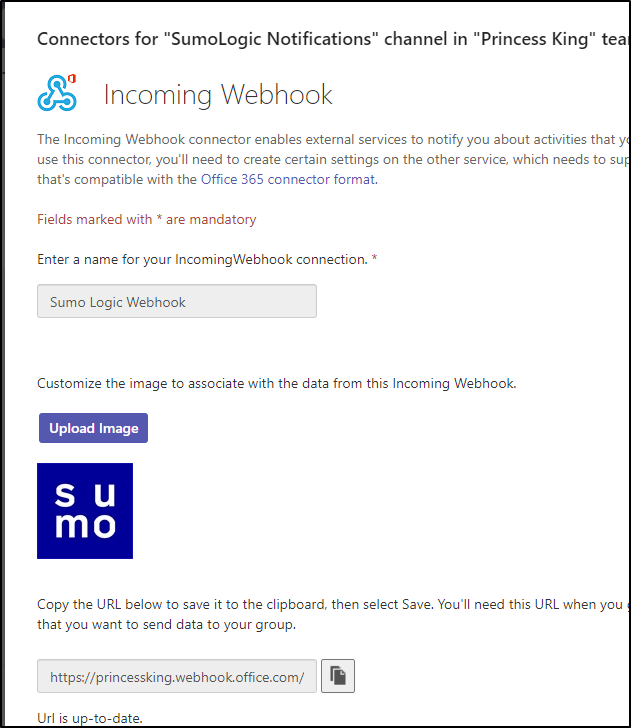
Then choose to configure an incoming webhook
I used a downloaded jpg for the icon and clicked create to get a URL
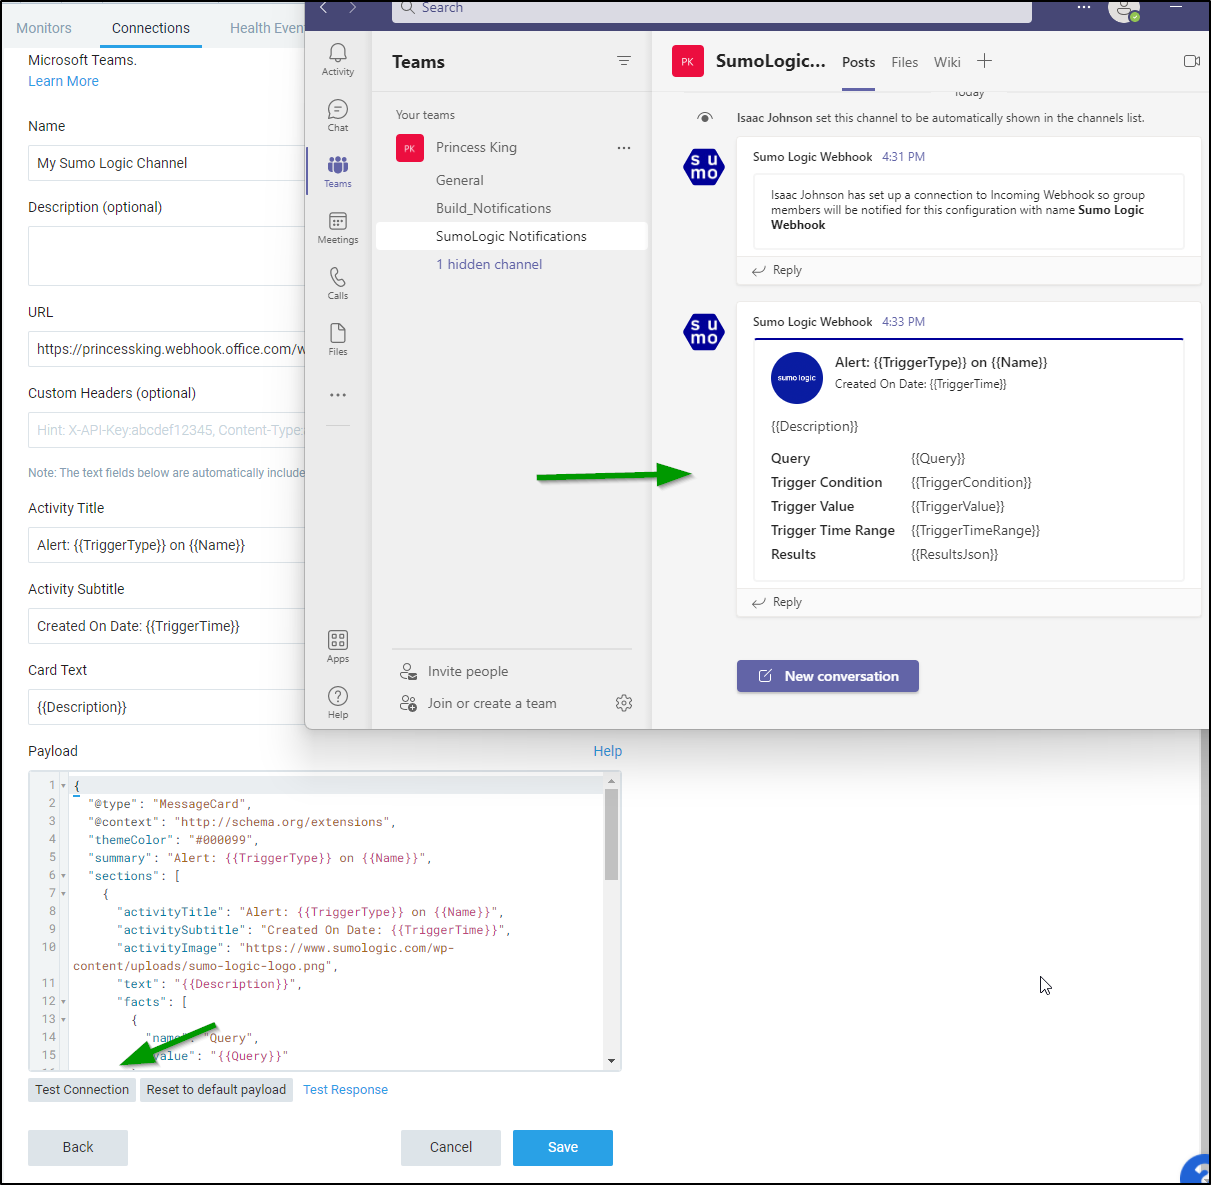
And now if I test it, we can see an update on the Teams channel
Rundeck Webhook
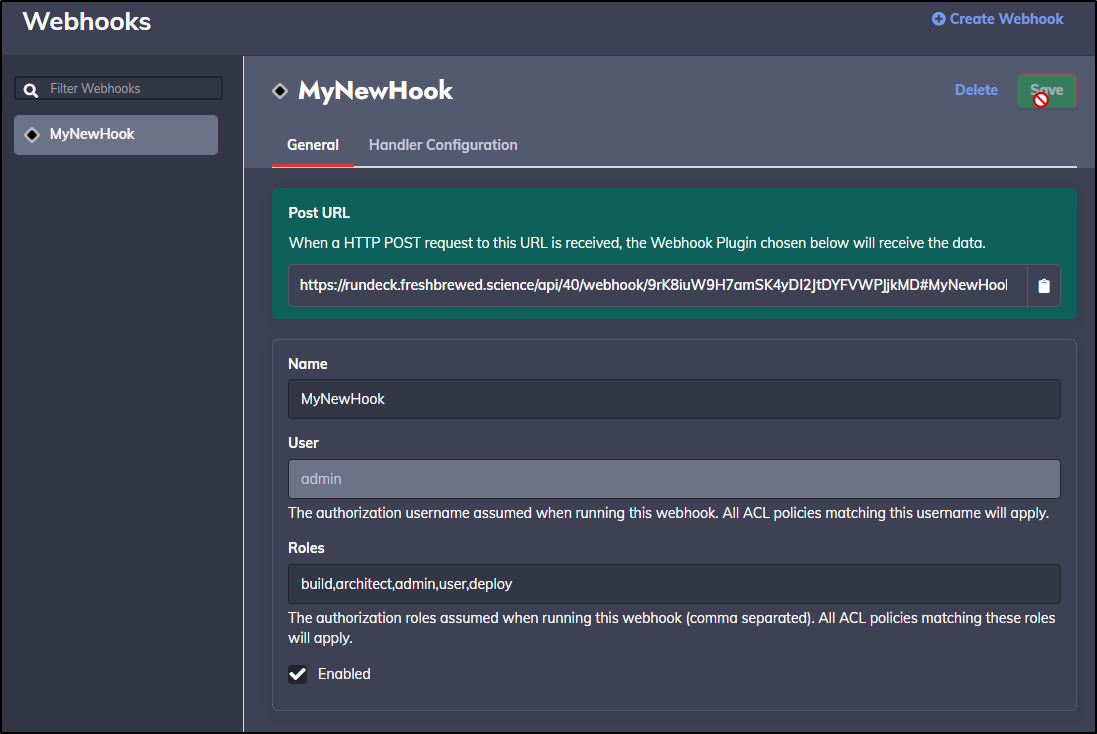
Let’s log into our Rundeck instance and create a simple webhook
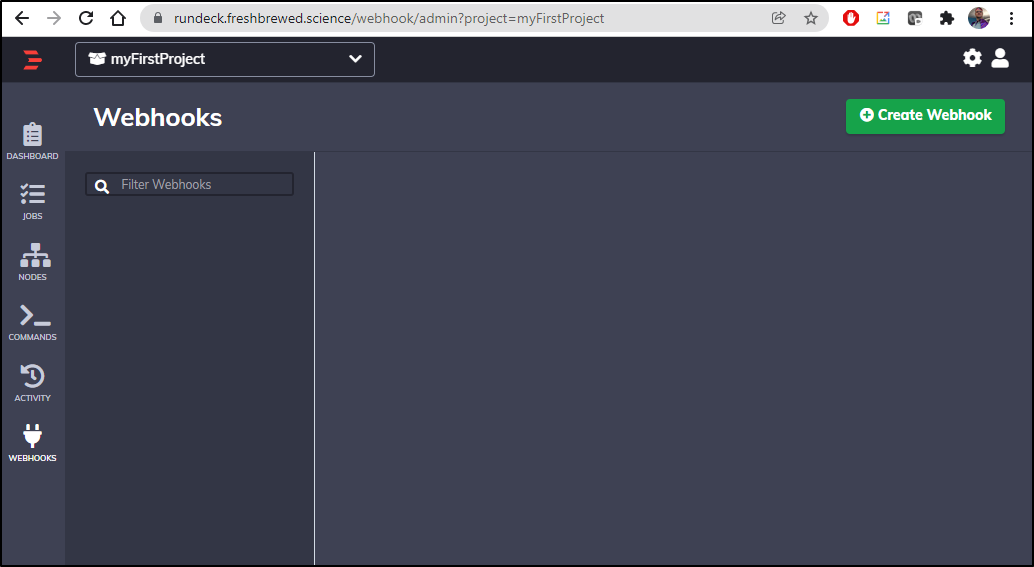
Next in the Handler Configuration we can choose to either run a job or just log an event.
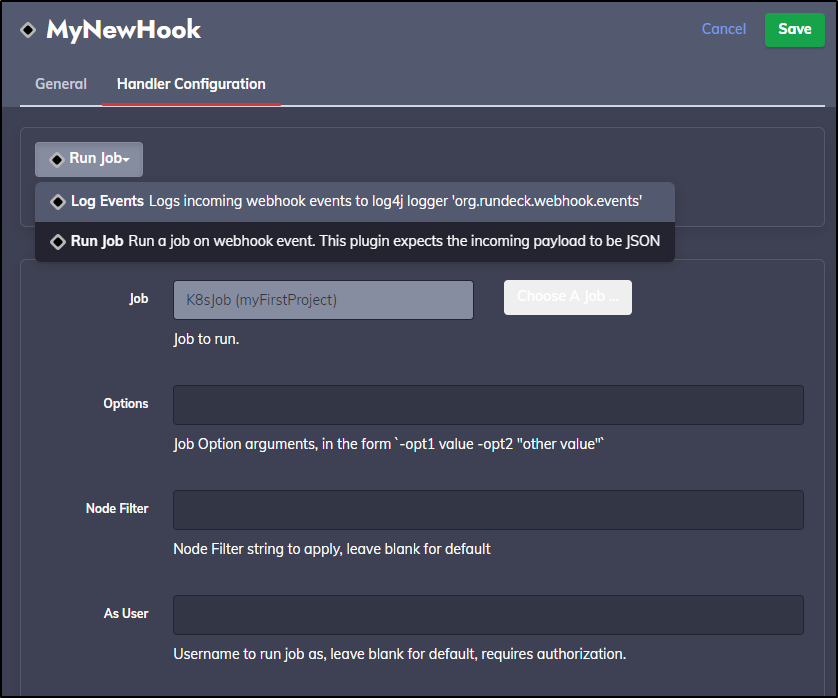
Of course, creating an K8s job to do work would be interesting, but for now, I’ll just leave it as Log Events
Now when I save it, I get a webhook URL
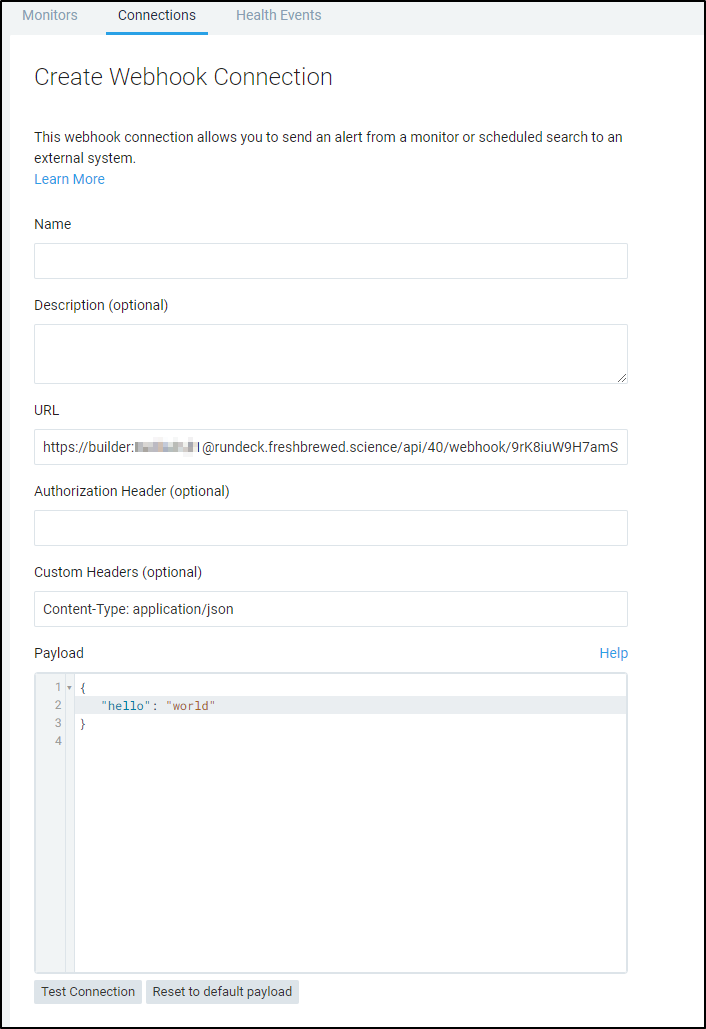
Now back in Sumo Logic Webhook we can use that URL with our basic Auth and test the connection
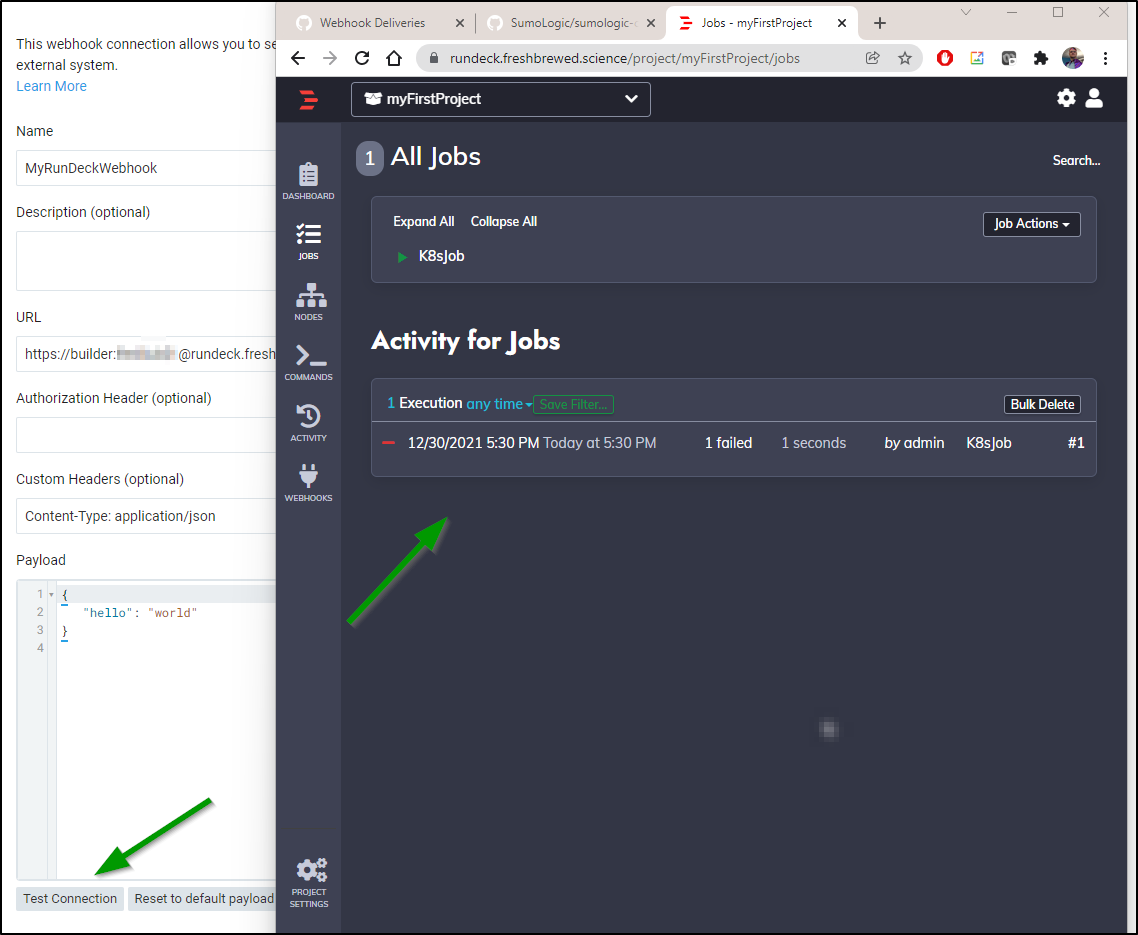
Since my logging was in err, I switched to invoke the k8s job (which would fail as the underlying cluster was removed). But indeed, running a test invoked the Rundeck job
Using
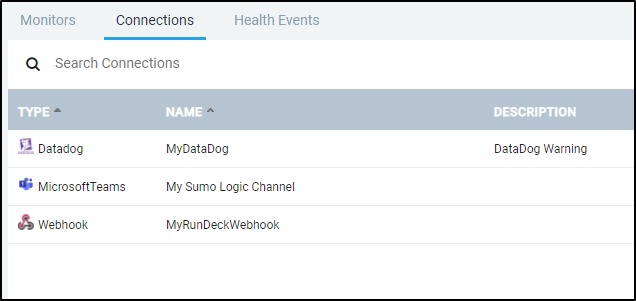
We can now see some different Connections available to us in the Connections window
When editing or adding a monitor, we simply need to select it in the To area where we would normally use an email.
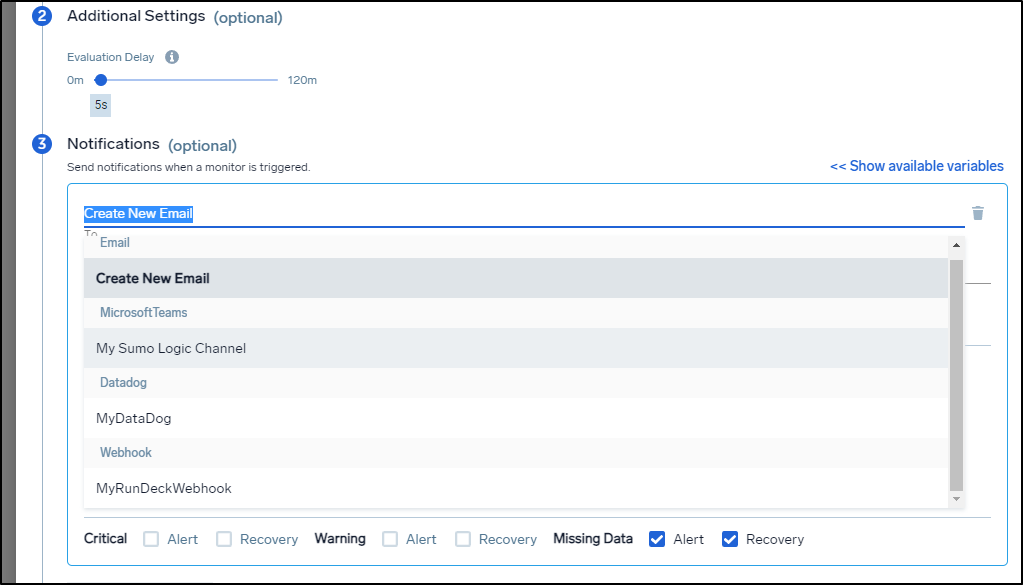
What I find pretty nifty is that for a given Monitor, we can send different types of alerts depending on the severity
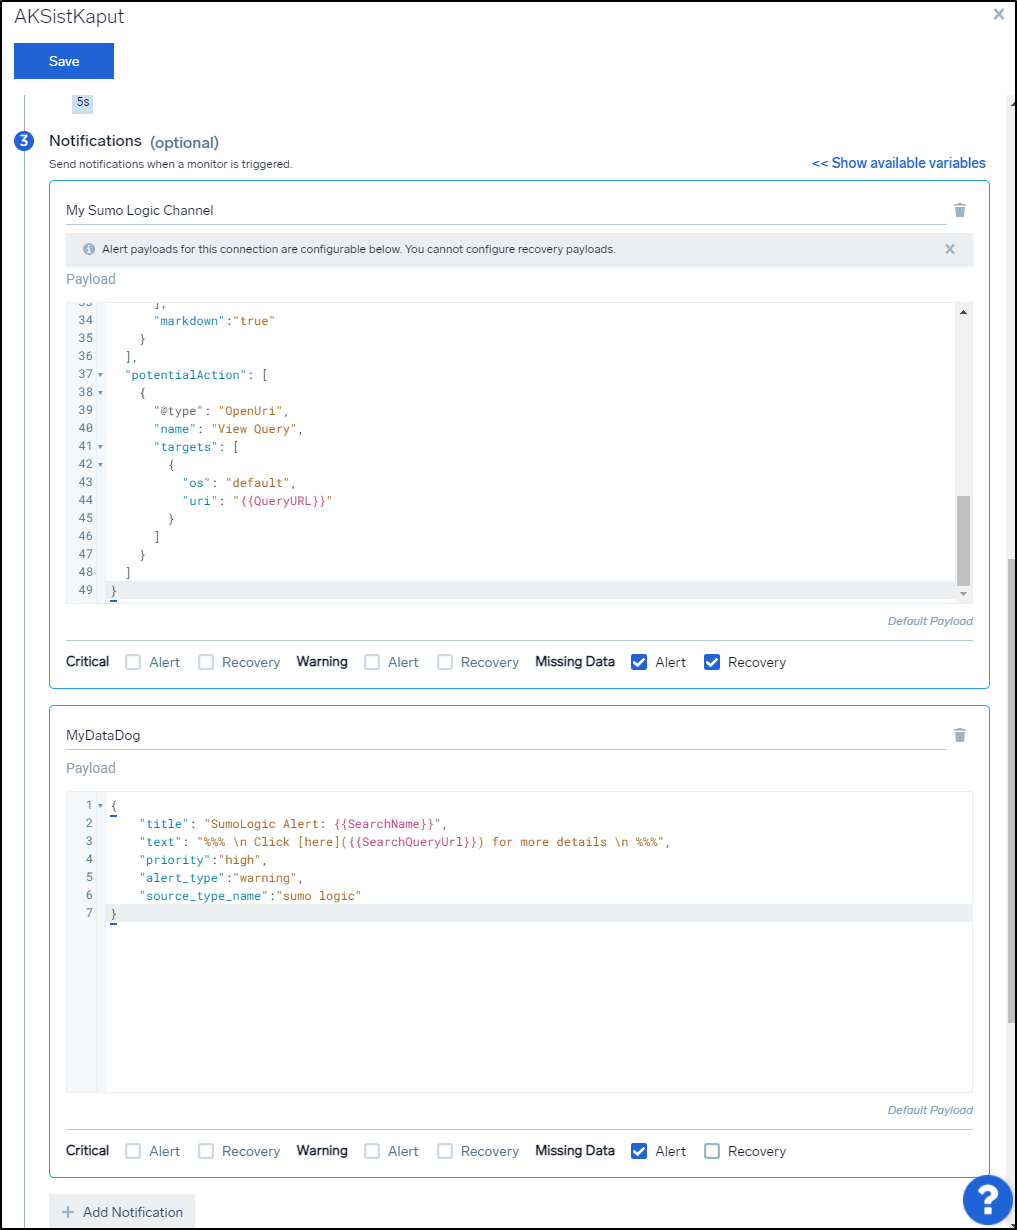
What you see above is that I would want to update my channel in Teams when it goes down and comes back. But I only care to log a k8s down alert in Datadog as that is for a dashboard of events.
Users and Roles
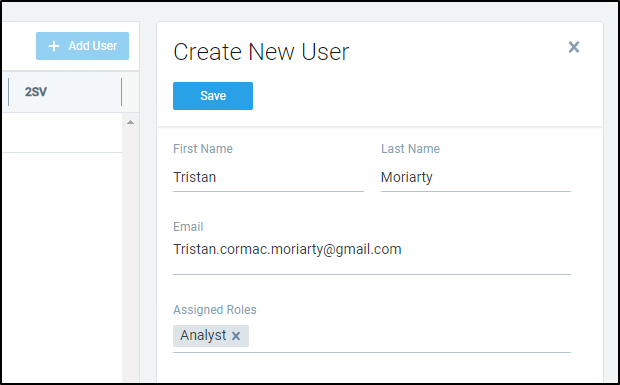
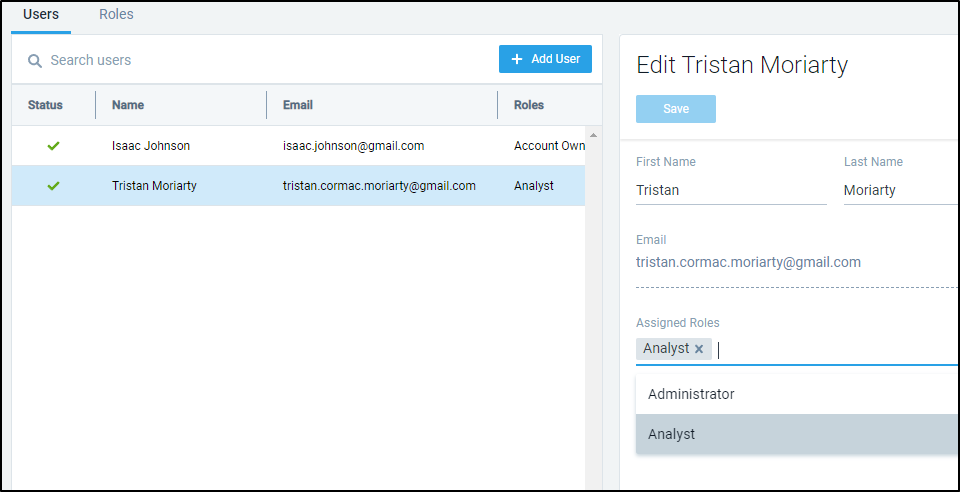
Say we wanted to add a non admin user. We could add an Analyst type user:
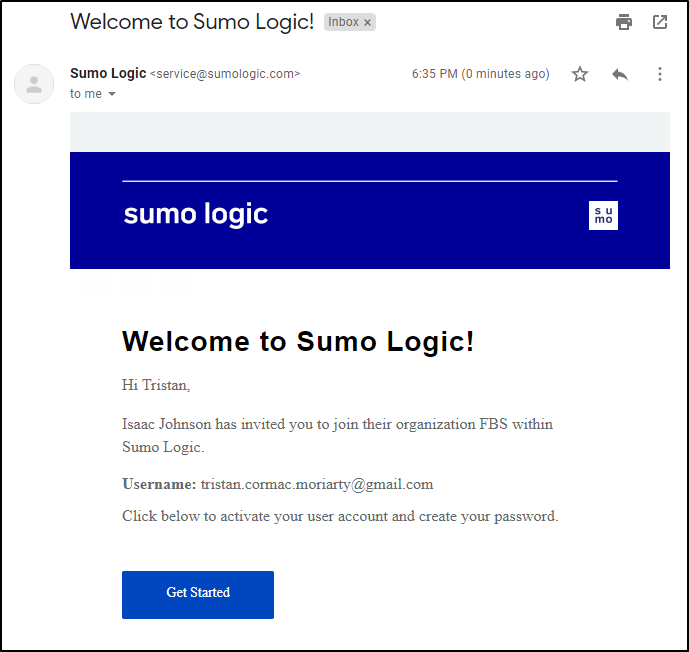
To which they will get an email invite:
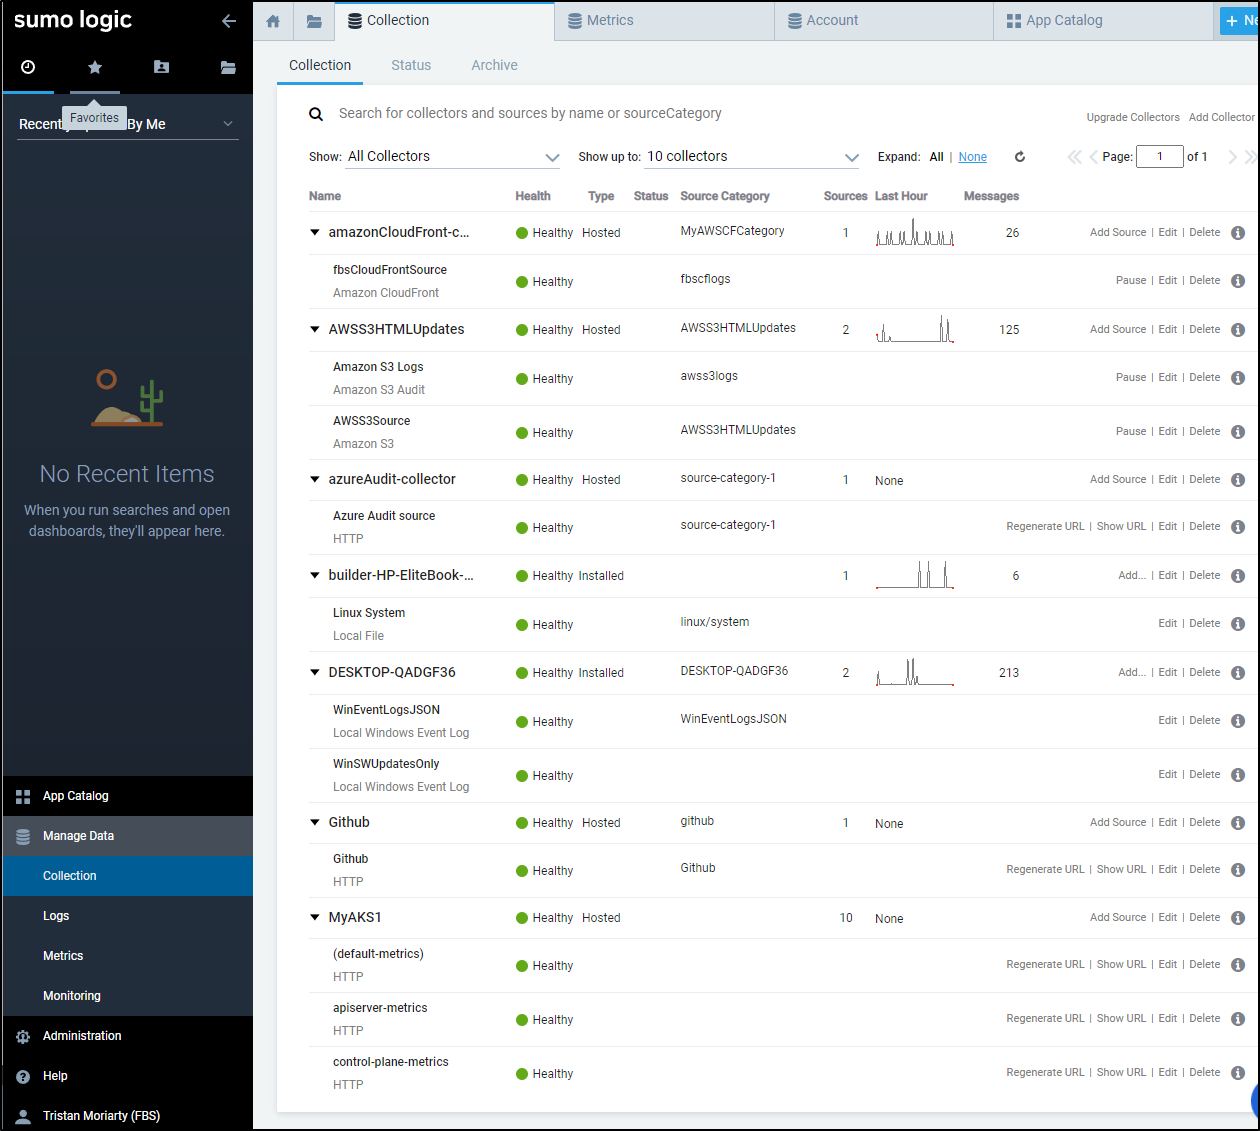
Once logged in they can view collectors and sources, but the Add, Edit and Delete buttons are inactive and grayed out.
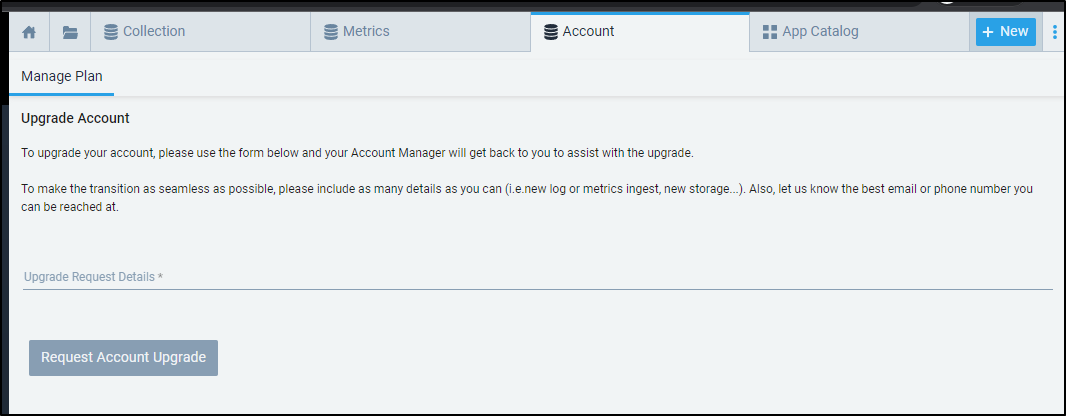
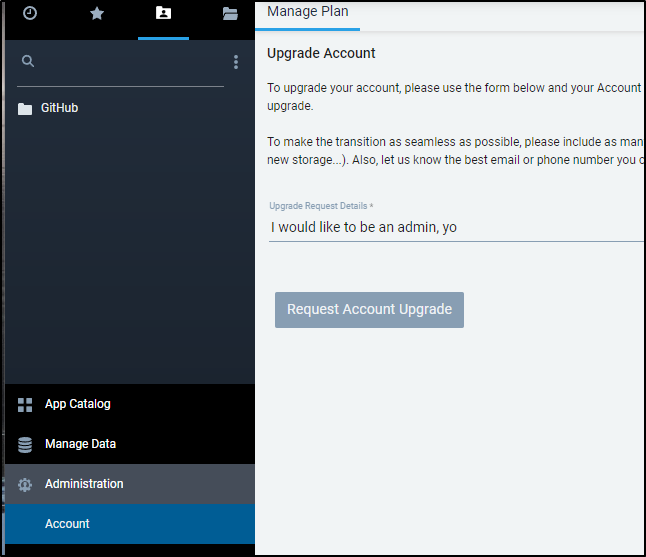
Additionally, if they go into Accounts, they will find they are not able to changes things (but can request an Account Upgrade).
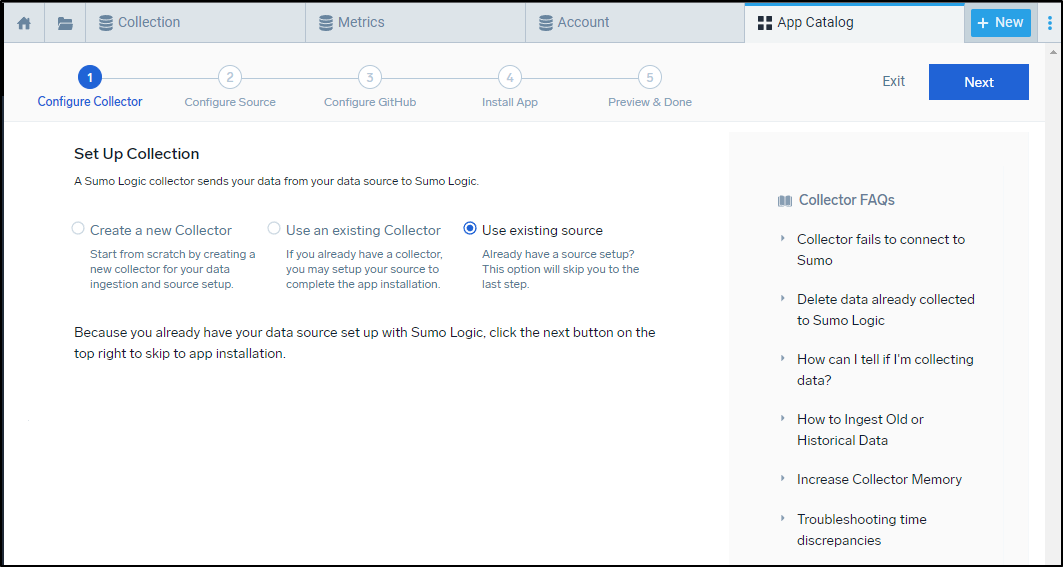
When adding an Integration (App), they can only “Use existing source”
But then once added, they can view dashboards based on existing sources just fine
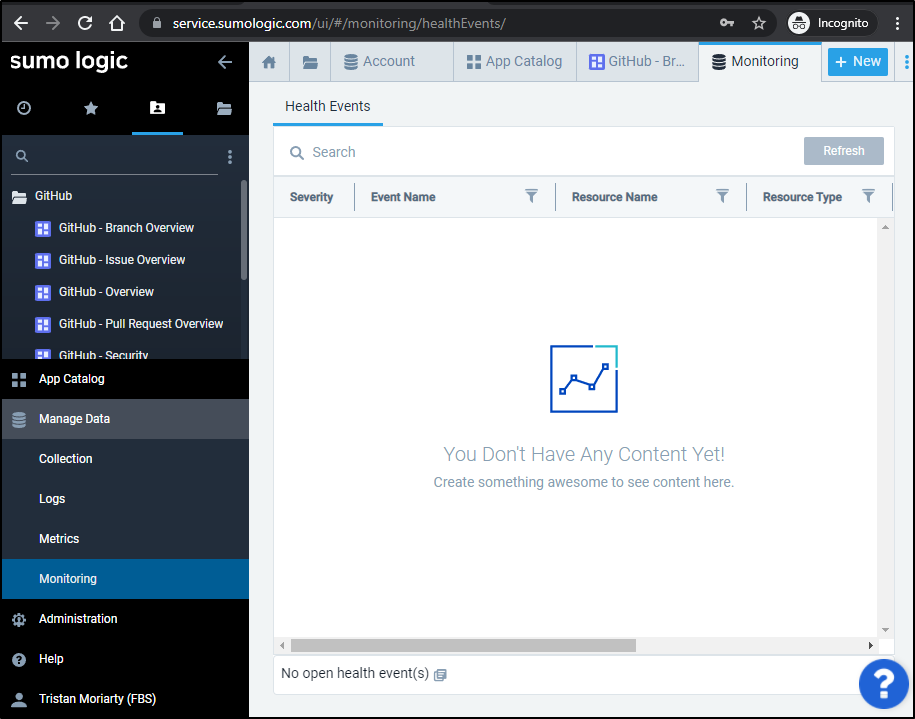
Also, in monitoring, they can only see Health Events. The Monitors and Connectors are hidden.
Elevating account
An “Analyst” can request an account upgrade
To which they get a notice when clicking the button that a request was sent

Now I did not see an email come to the admin account - perhaps it’s delayed
The admin can then edit the user to add roles.
Roles
We can create custom roles as well. Administrator and Analyst are the two built-in, but we can expand those.
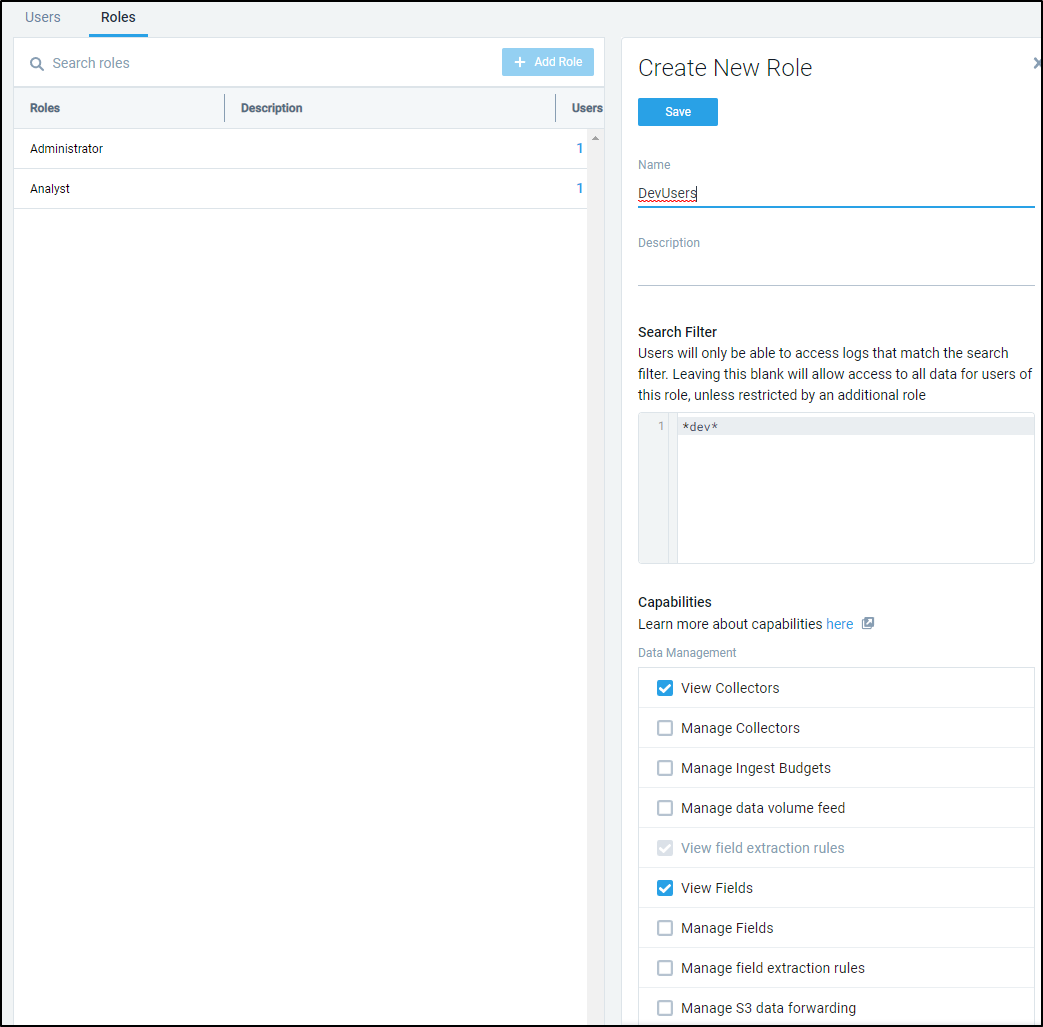
Say we wish to allow users to only view logs with “dev” in the name. We can create a devUsers role as such:
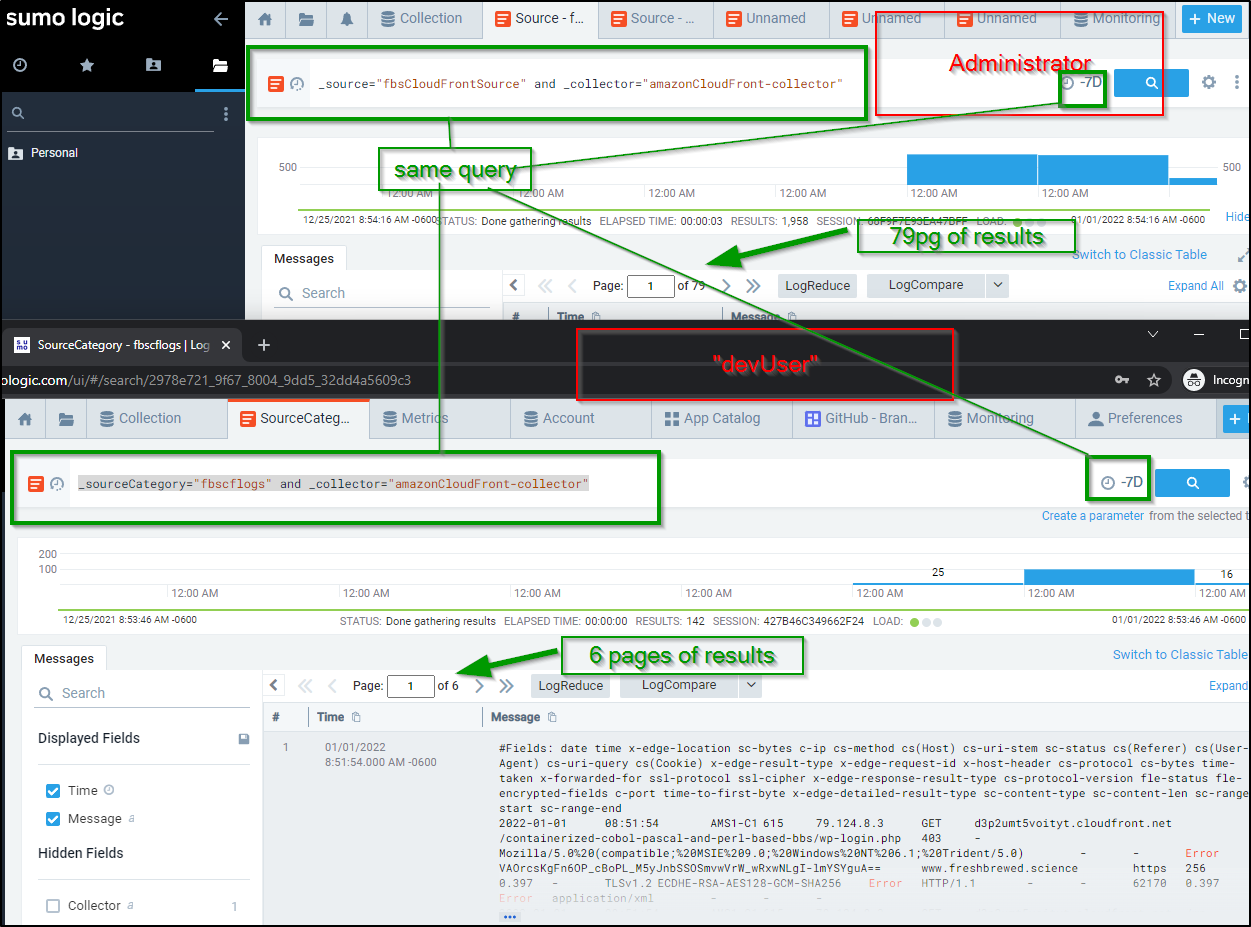
To illustrate the point, I set one user as “devUser” and the other is still Administrator.
Running the same query against the same source for the same duration yield two different sets of results for _sourceCategory="fbscflogs" and _collector="amazonCloudFront-collector". The Admin gets everything (79 pages) whereas the “devUser” only sees those that have “dev” in the message (6 pages).
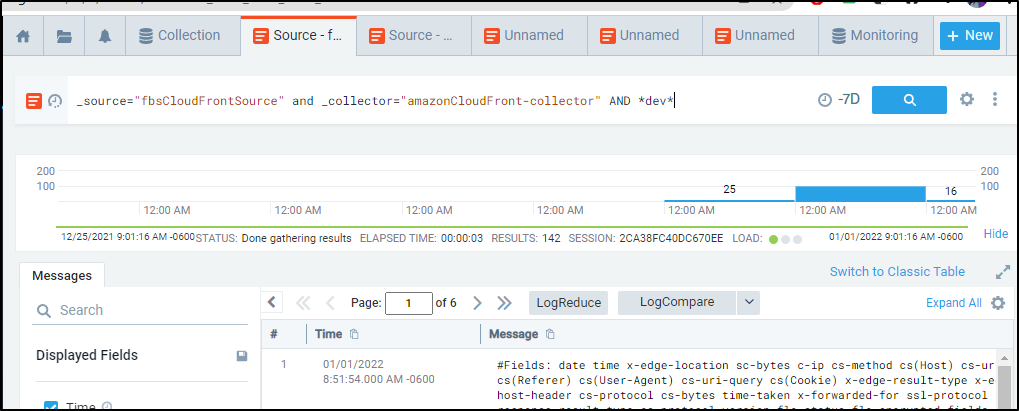
We can see the same results in the Administrator search by adding “AND *dev*”, e.g. _source="fbsCloudFrontSource" and _collector="amazonCloudFront-collector" AND *dev*
Pricing
By default, our Trial converts to the free tier at the end of the trial duration:
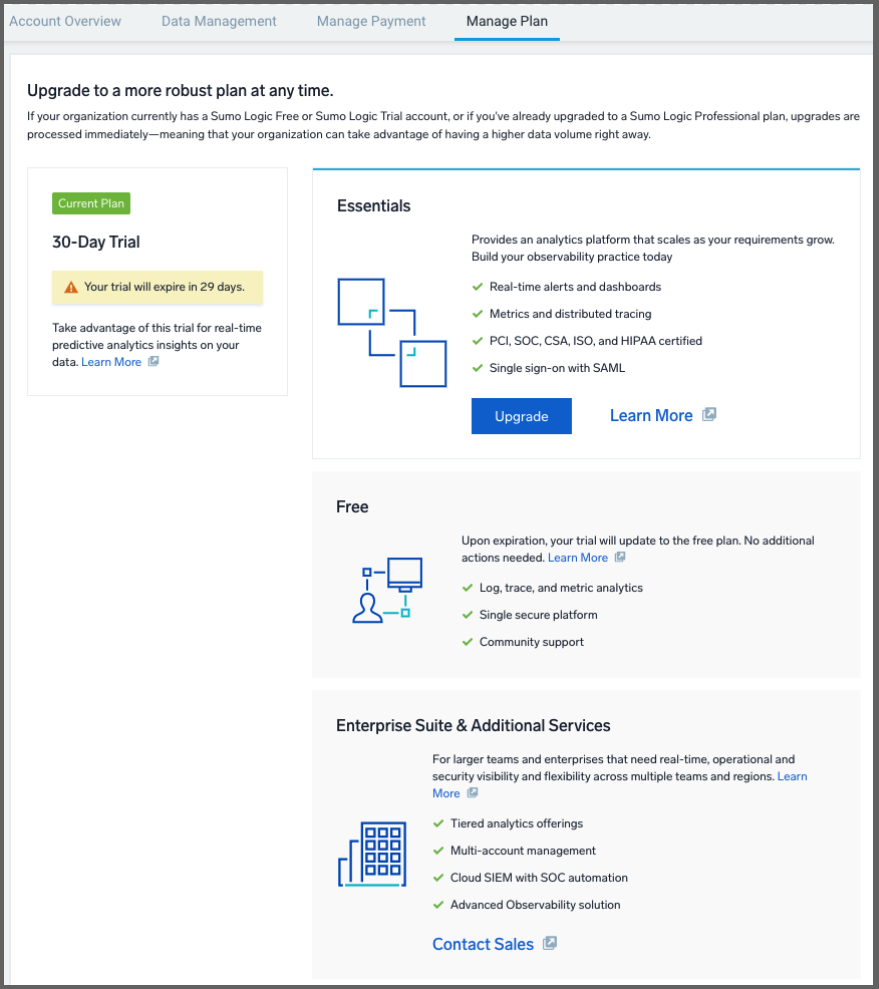
Beyond free there is a paid tier and an “Enterprise Suite”. The latter does require a conversation with sales.
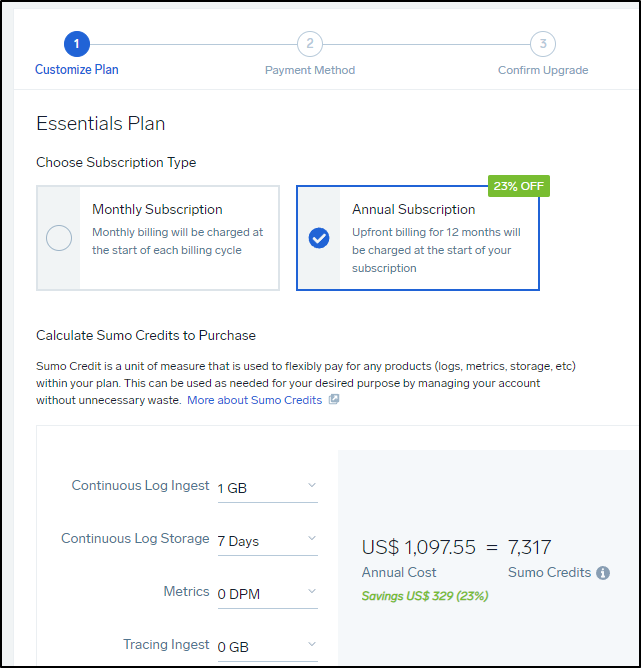
If we wish to convert to a paid tier, we can pick between monthly and annual pricing in the wizard:
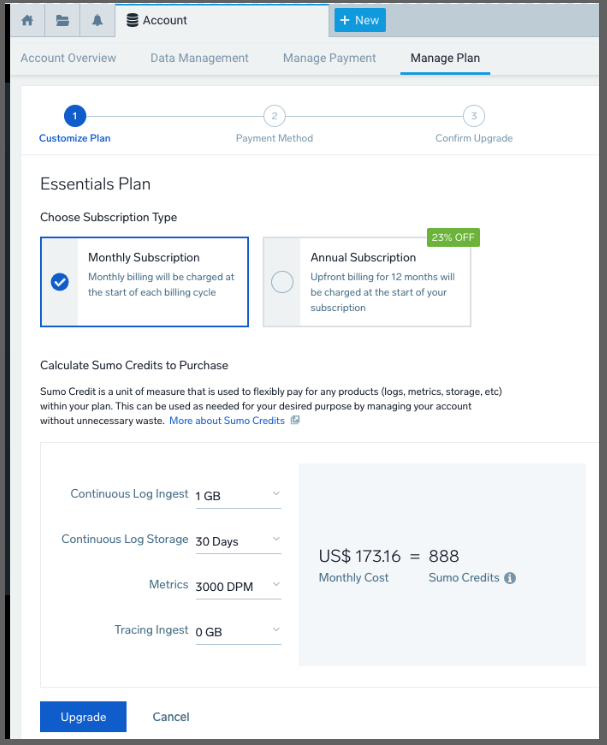
In the case of Sumo Logic, DPM means “Data Points per Minute”:
For billing and reporting purposes, data volume for metrics is measured in Data Points per Minute (DPM). DPM is defined as the average number of metric data points ingested per minute in one thousand increments. The per minute ingest is then averaged for a calendar day to get the average data points per minute for that day. The daily DPM average in one thousand increments is the unit of measure used to track metric ingestion for reporting and licensing within the Sumo Logic Continuous Intelligence Platform
What might this look like?
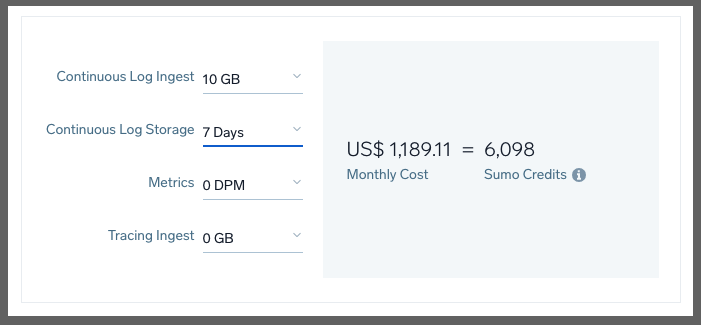
Just on Logs, we would need to spend $1,189/mo for 10Gb with a continuous log storage at 7 days (lowest setting):
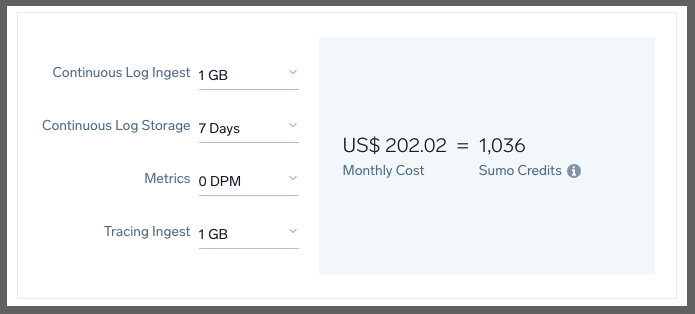
In fact, a decent low setting of the lowest amount of traces, logs with the least retention would be $202 a month (monthly)
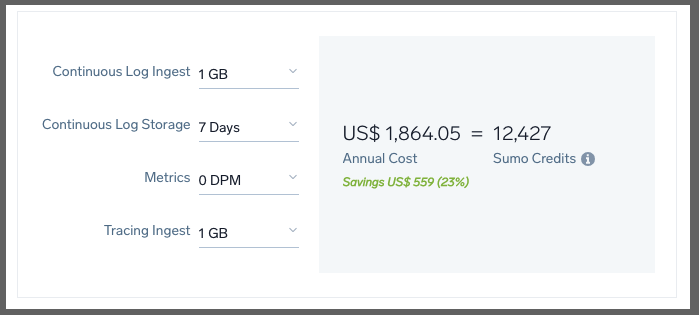
We can bring that to $1864 annually (about $155/mo) if we pay up front for the year:
The cheapest I could see a plan that still had logs was 1Gb/7Days with 0 metrics which would be $1100 year (or $120/mo )
 .
.
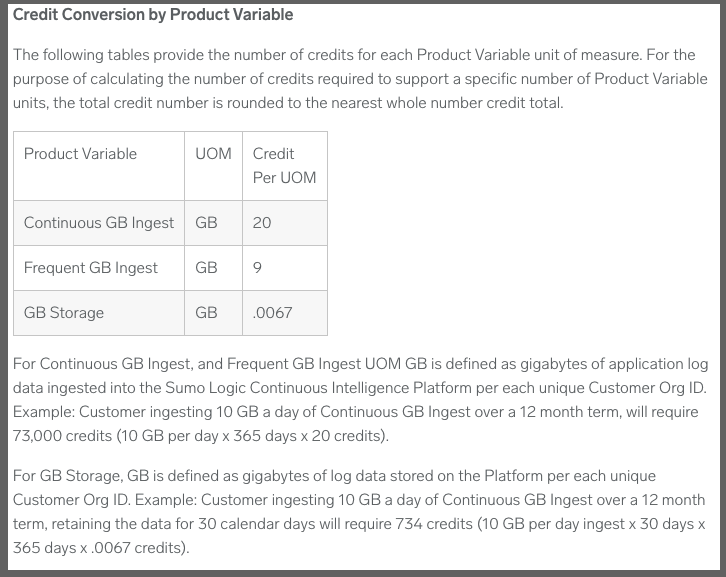
But before I go on to plans, I should note that the wizard here is just that - an estimator. You can see specifics in the cloud flex credits overview page. That is, for log storage:
 .
.
Using their example above, a customer pulling in 10Gb a day of logs continuously for a year needs 73,000 Sumo Credits. Paid annually, that would be $10,950 (presently) just for log needs (or $1186.25/mo paying monthly)
Plans
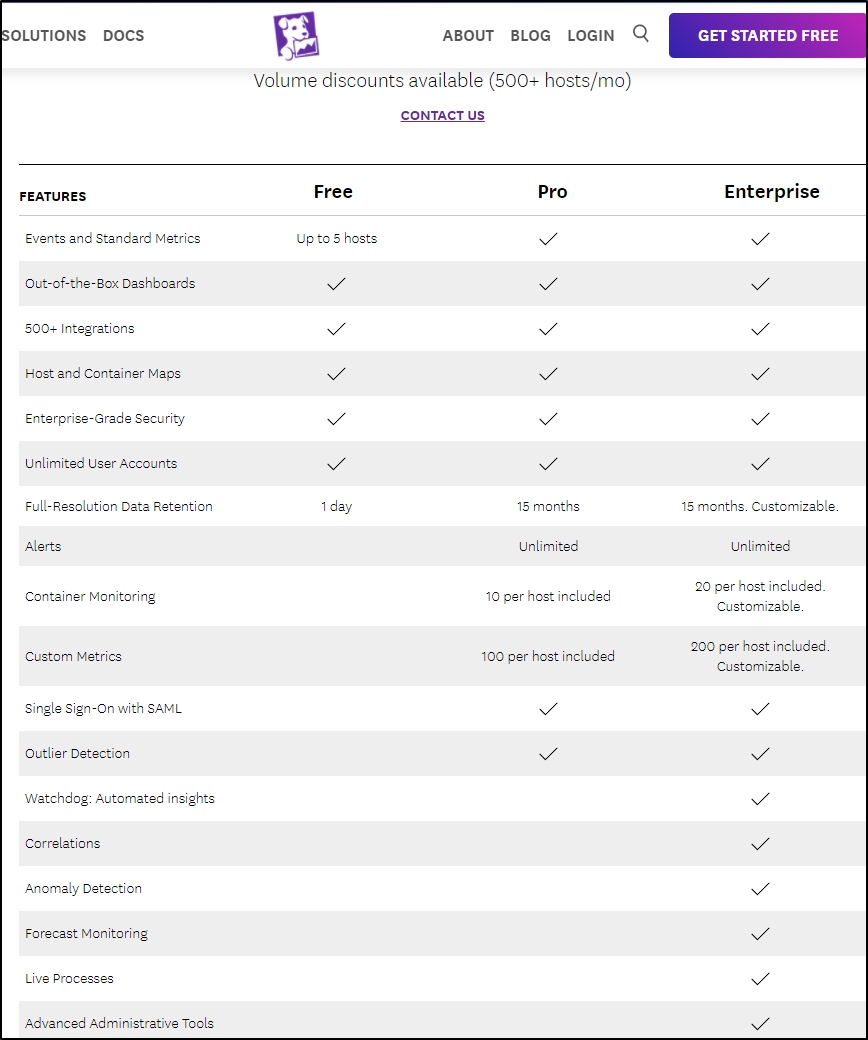
If we go to what the “Free” plan has compared to the “Essentials” in their Cloud Flex Credits Accounts page we see a lot is missing.
Here we can see that table from that page
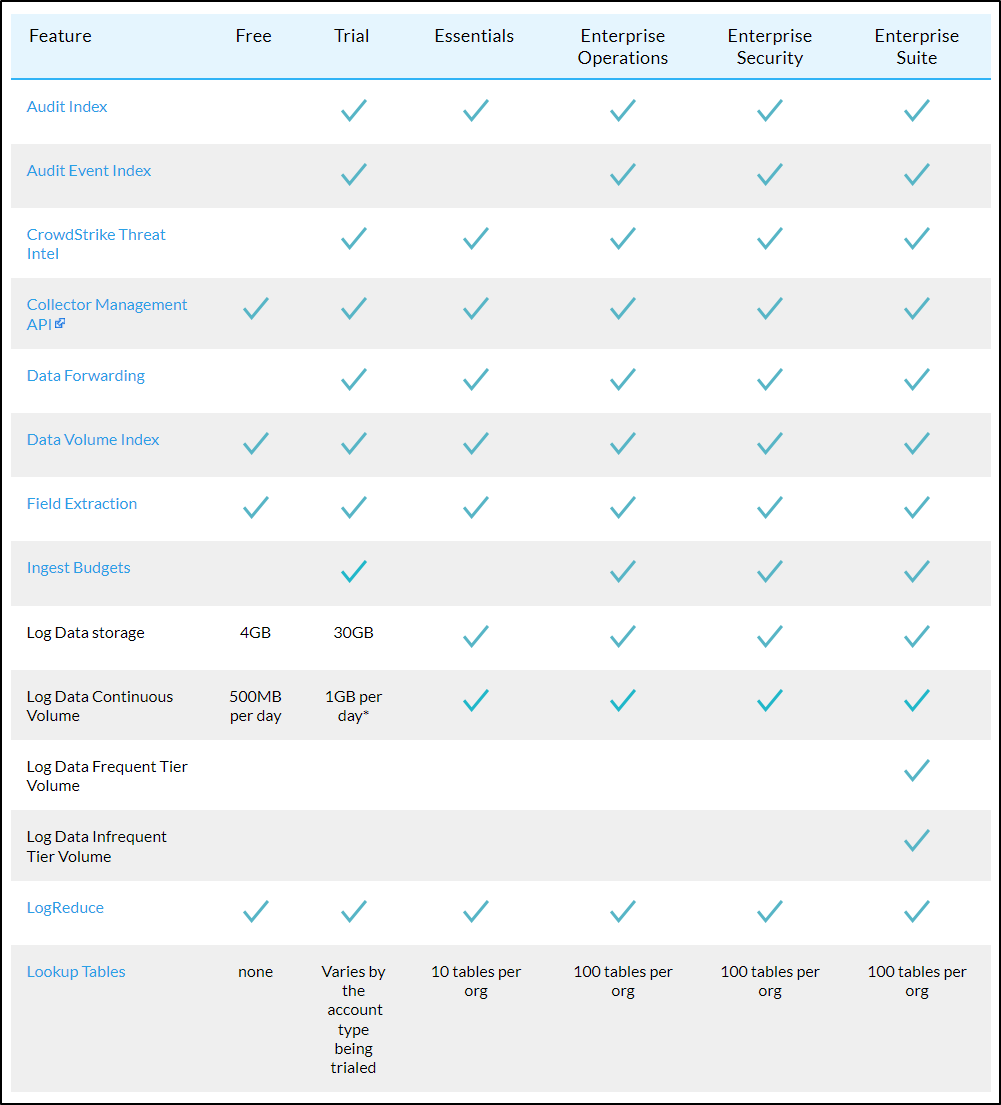
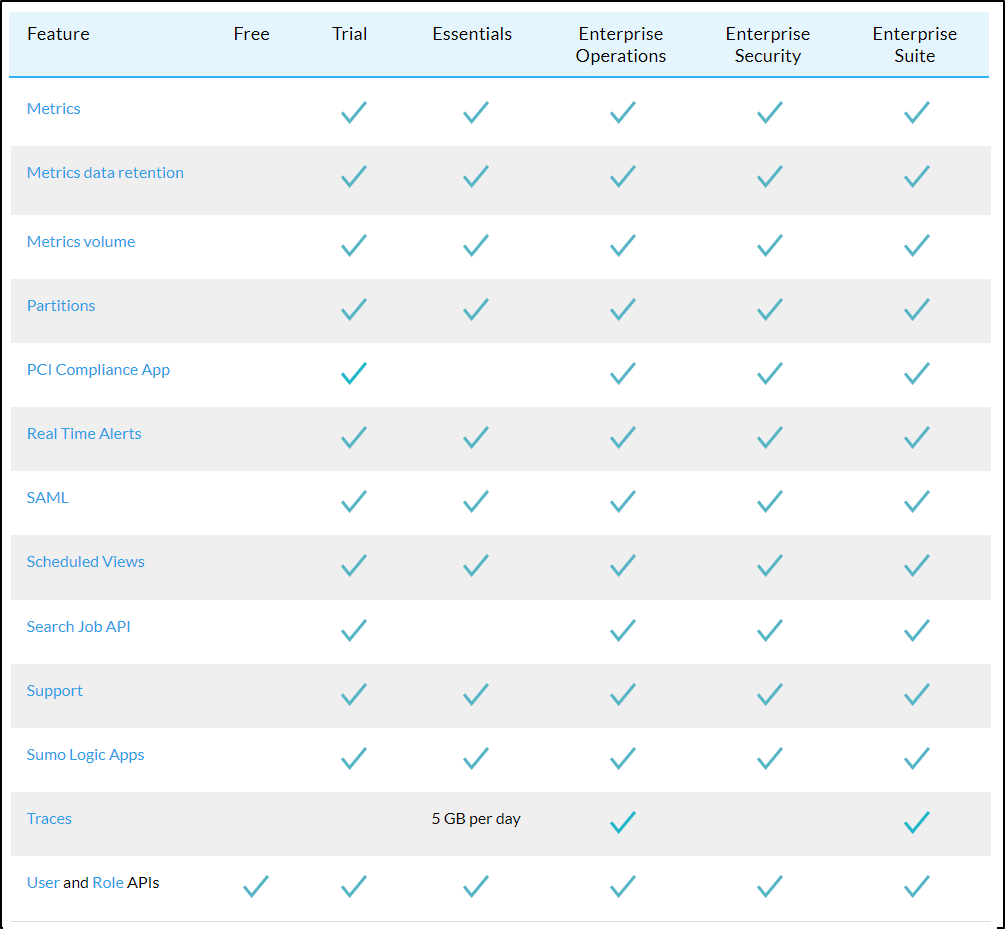
For me, the killer missing features in the Free tier are the lack of Apps and Real Time alerts. I’m not sure the impact on excluding Metrics - i can only imagine creating dashboards would be quite limited. I would like to mention in meeting with a couple Sumo Logic engineers they were unsure if “Apps” were really not included in the free tier. I cannot force my account into “free mode” so we’ll have to see at the end of the month.
Update: In speaking with a rep, he looked into it and the Apps we had should work and we should still be able to add Apps in the free tier.
However, I must be grandfathered into a sweet free deal with Datadog because when I compare what is available in their Free tier, Alerts and Container monitoring is not available in the free tier anymore
Budgets
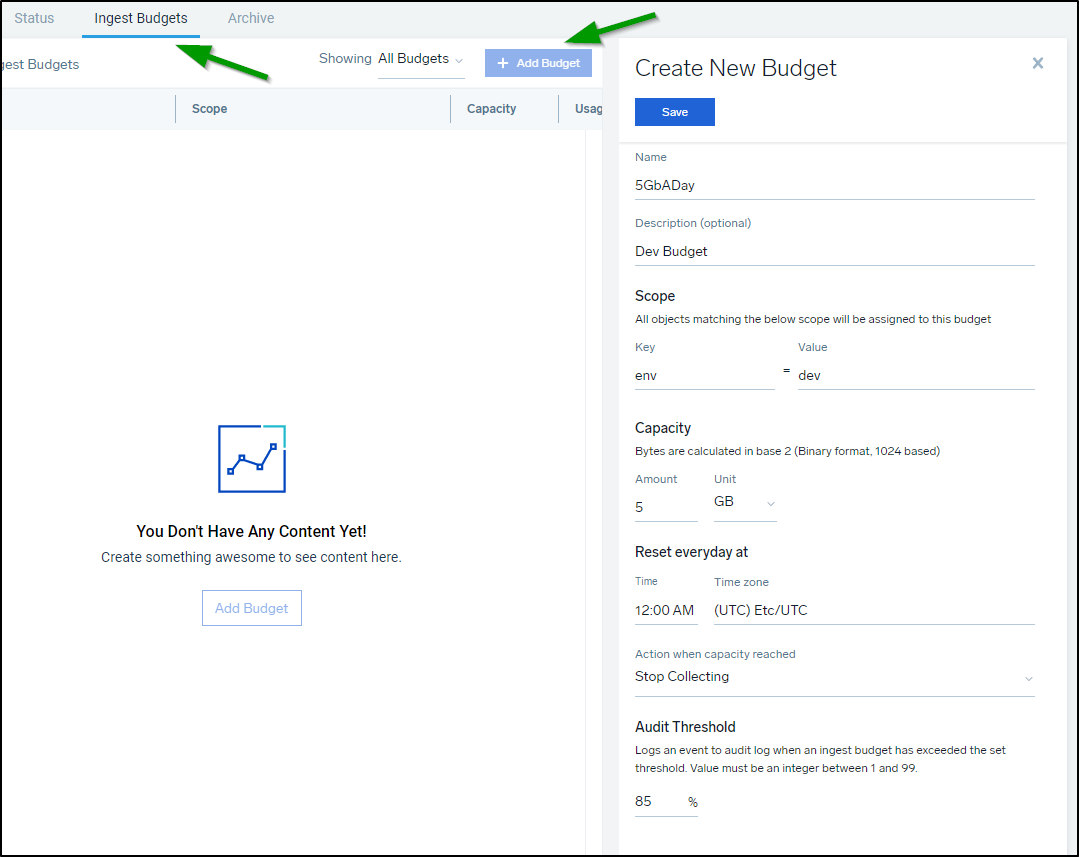
I can create an Ingest Budget that sets a fixed limit on collector ingestion.
Perhaps I want to limit only 5Gb of Dev Data, I could create a budget for that
The other way to do it, instead of matching keys, is to just name a budget with a limit:
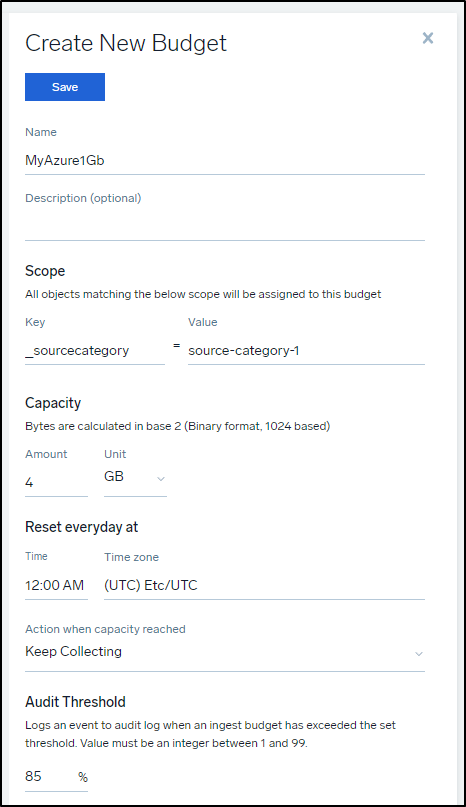
The above matches ‘source-category-1’ which I used for my Azure collector and source

S3 Logs
A consideration, what I first perceived as a limitation in that S3 Audit pulls logs from an S3 bucket that were populated by CloudFront and S3 access later dawned on me to be a fantastic cost saving feature.
Think of it as such: We ingest into Sumo Logic logs from S3 immediately and only store for the lowest actionable window. Perhaps we consider anything more than 2 weeks to not be interesting from a monitoring perspective.
We then set the Sumo Logic ingest to a continuous log storage of 14 days.
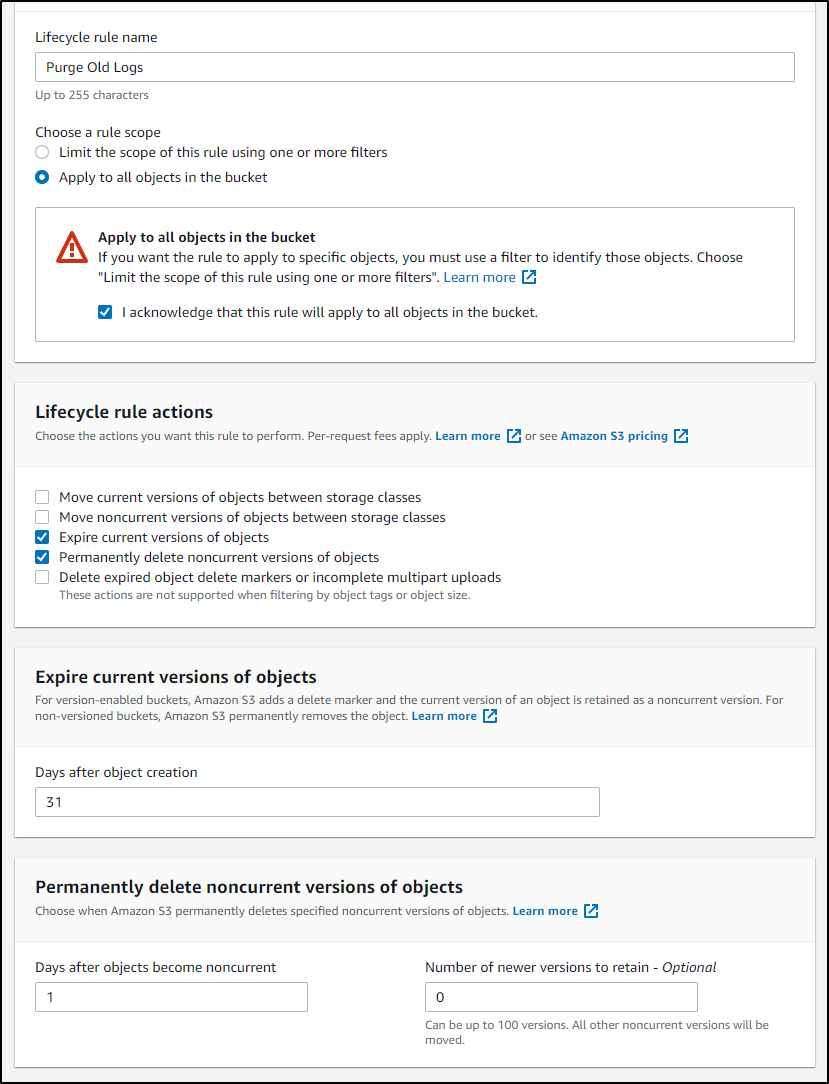
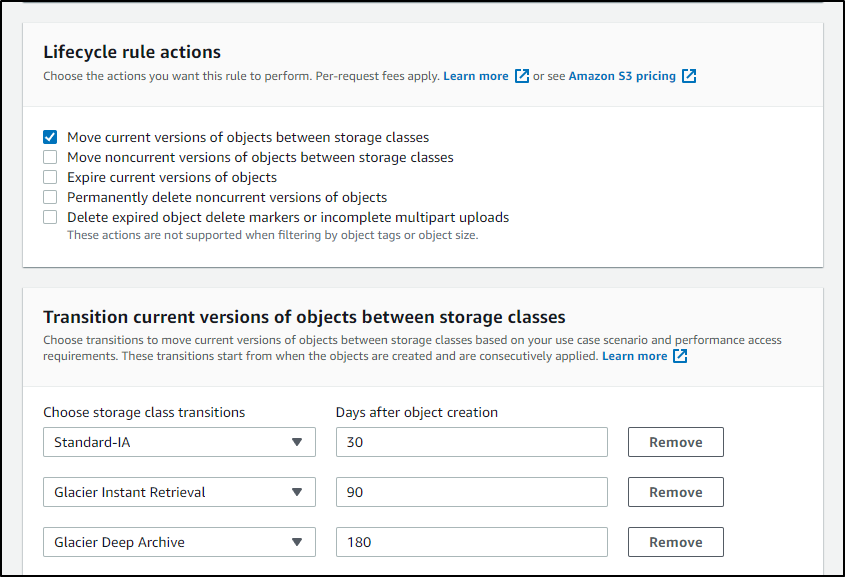
To save money for ourselves, we use an S3 Storage Lifecycle policy to either purge or archive old files.
Perhaps after 31 days i want to expire the log files, then a day later delete them:
 .
.
Or perhaps i just want to save to cold storage all logs over time (though there is a cost for small object storage that might not make this a savings)
 .
.
Summary
Today we went through Github integration with Repos and Organizations. We revisited local agents for Linux and deep dived into the Windows Agent setup and usage including graphs and reports. We explored additional notifications including Teams and integrations with Datadog and invoking Rundeck. We looked at Users and Roles then dug into Pricing and explored what “Flex Credits” are and how we can use them. We wrapped by looking at plans, budgets and some cost optimizations using S3 storage lifecycles with AWS based logs. Next week we will conclude this series with a look at Traces.
So far Sumo Logic has really impressed me with its capabilities. The Sumo Logic reps would often ask about the query language and how I used it. I get the impression that they are focused on improving it. I personally find it acceptable. The Cheat Sheets are handy go-tos.