

Published: Jan 4, 2022 by Isaac Johnson
Sumo Logic is another solid suite in the realm of APM and Logging. They aim to “reduce downtime with real-time alerting, dashboards and machine-learning-powered analytics for all three types of telemetry - logs, metrics and traces”.
Sumo Logic uses Collectors to pull data from Sources. The Installed Collectors pull in data and compress, encrypt and send it to Sumo Cloud. Hosted Collectors are handled by Sumo Logic and can be used to ingest data directly from the major public cloud providers like AWS, GCP and Azure.
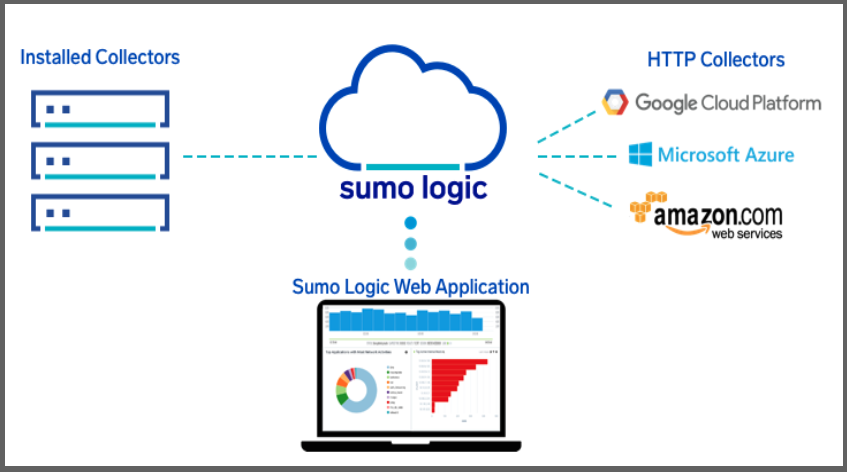
Besides Logs, Sumo Logic can consume/create metrics and turn logs into metrics. Metrics collection is used for Trace data and billed in Data Points per Minute (DPM).
Today we will look at the history, relative size in marketplace and account setup. We will setup an initial Linux monitor, Kubernetes monitoring with some sample apps and monitoring (detecting and alerting on issues). We will look at Integrations and review how Sumo Logic works with Collectors, Sources and Apps/Integrations.
Lastly, in this first part (of three), we will look at the AWS Collectors for S3 and Cloudfront including a step-by-step guide to setting up the SNS method for automatic ingestion. We’ll wrap with setting up Azure Monitors using Azure Event Hub and an ARM based function.
History
In the pre-Covid-19 era, I can recall their vendor booth at conferences always having little Sumo guys with the logo. The name actually came from the co-founder Christian Beedgen’s dog, a rescue he was fostering but couldn’t give back. According to the CEO Ramin Sayar, “When you think of sumos, they’re not just big, but they’re extremely nimble. Our co-founders thought Sumo Logic fit well together given the word associations with sumos and given the fact that machine data is the original big data.”
Sumo Logic was founded in April of 2010 by Kumar Saurabh (VP of Engineering) and Christian Beedgen (CTO). They brought in Bruno Kurtic from Sensage as VP of Product and Strategy. They had just come from ArcSight (which was acquired by HP months later in Sept 2010 for $1.5B). In 2014, Ramin Sayar was brought in from VMWare where he was GM and SVP of Cloud to be CEO. Shortly after, Kumar Saurabh left to start LogicHub.
By 2019, Sumo Logic had a slew of VC backers and had amassed $419m in VC funding. The company IPO’ed in Sept of 2020 at $22/share (which has since dropped to $13.5).
The company has some large customers including Pokemon and Lyft. In 2018, they expanded integrations with GCP including an integration with TensorFlow. And in 2019 a bi-directional integration with Atlassian OpsGenie. In recent years they’ve also made a few acquisitions including FactorChain in 2018, JASK Labs in 2019, as well as DFLabs and Sensu in 2021.
Like Dynatrace, Sumo Logic was listed in the Gartner Magic Quadrant in 2021.
They were caught up in the Netlix scandal from a Netflix Executive that accepted (required) bribes in 2021.
Size
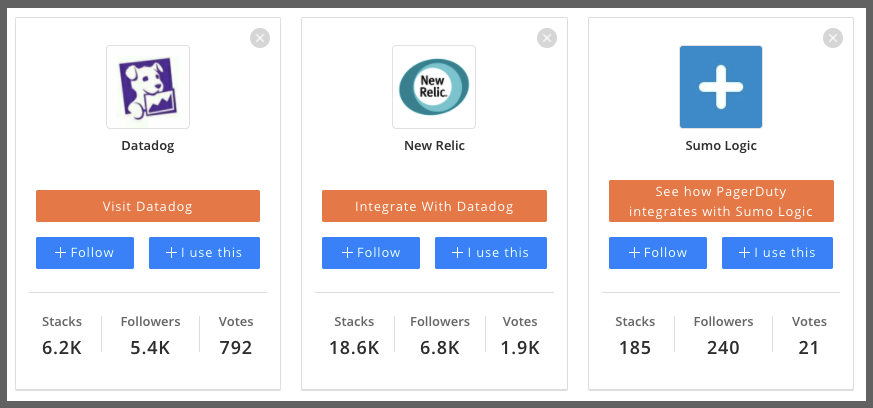
Sumo Logic is a relatively small player compared to Datadog and New Relic
They have generally favorable reviews on g2. Users say it is “Easy to use and find the relevant data from the logs through queries. Vulnerability analysis and clusters logs are also easily available in sumo logic” and “I like how clear the documentation was to use, the collection of documentation provided by sumo logics support team is really well thought out and provides clear instructions to set up with infrastructure”.
Their latest fiscal results for Q32022 (reported here in Dec 2021.. this confuses me). Showed revenue at $62m up 20%. They expect the full year revenue between $222.8 and $223.8m.
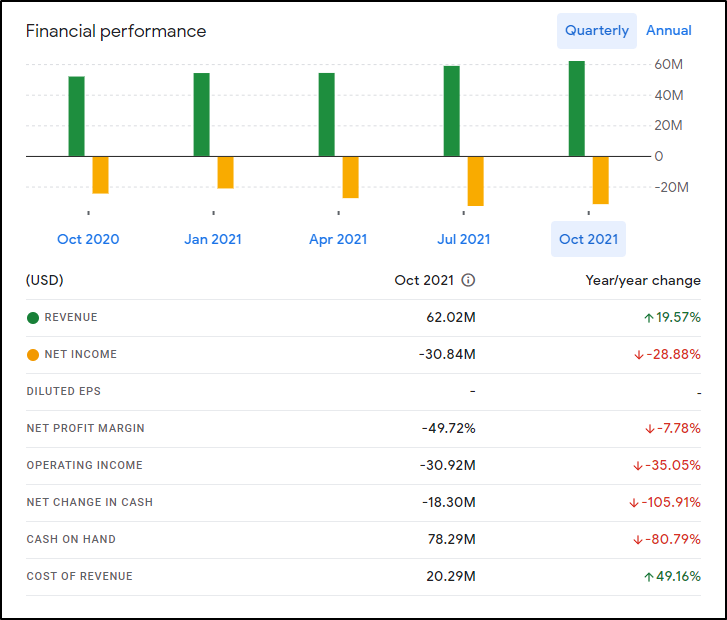
As we covered recently, to compare, New Relic in 2021 was $667.7m , Datadog’s revenue was $802m and for comparison, Splunk’s revenue for just the month of April 2021 was $664.7m.
The company has around between 500-800 employees (Datadog is 3000+, Splunk 7500+) and is based out of Redwood City, CA.
Account Setup
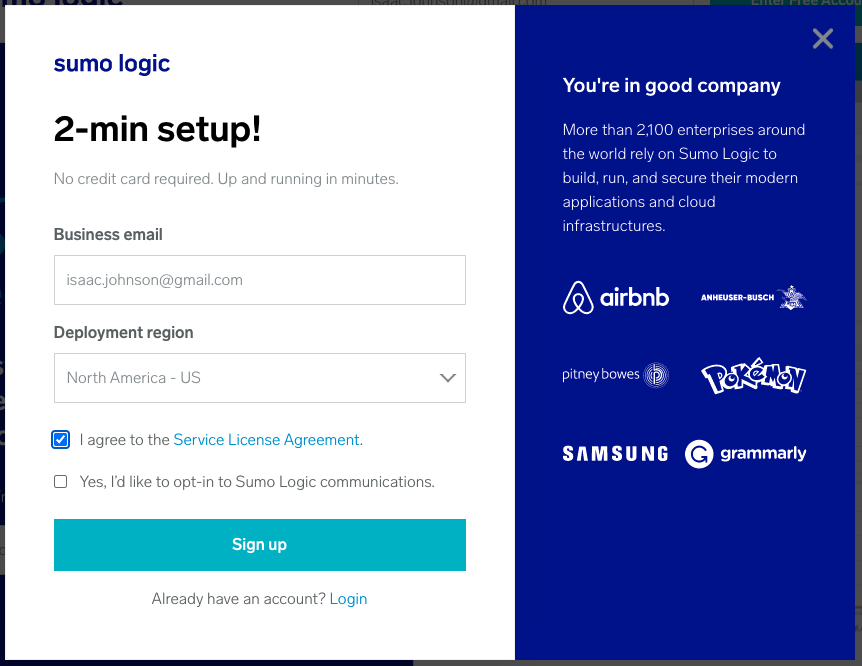
We can signup for a new account from the main https://sumologic.com website:
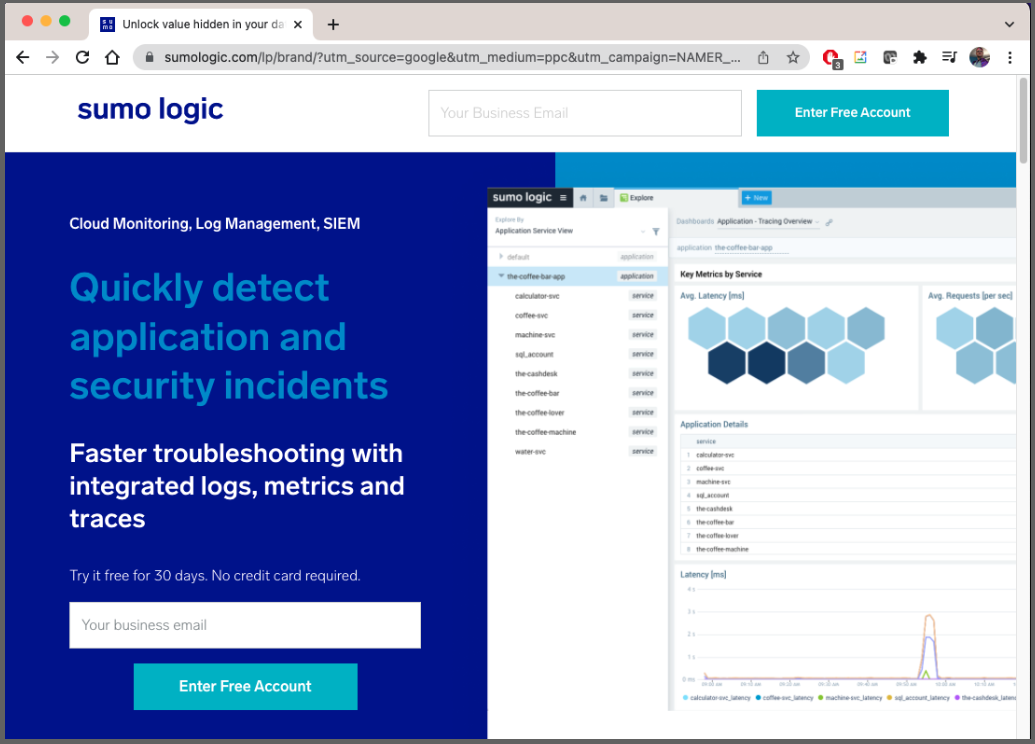
Just fill out the email address and region
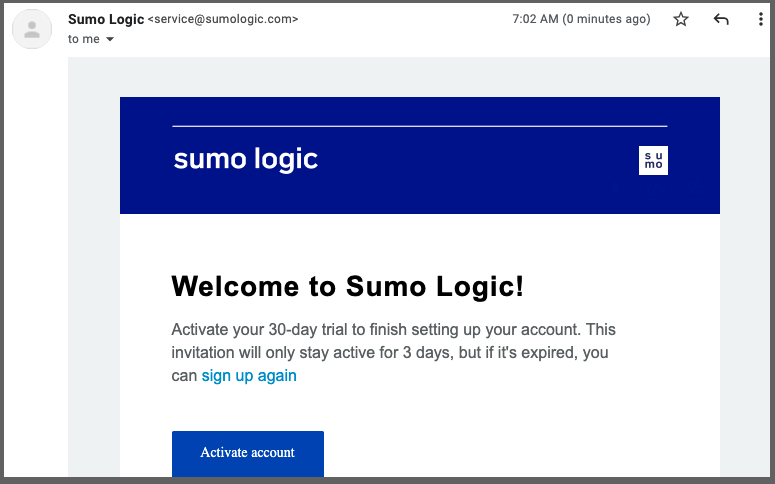
Click the Activation link in your email
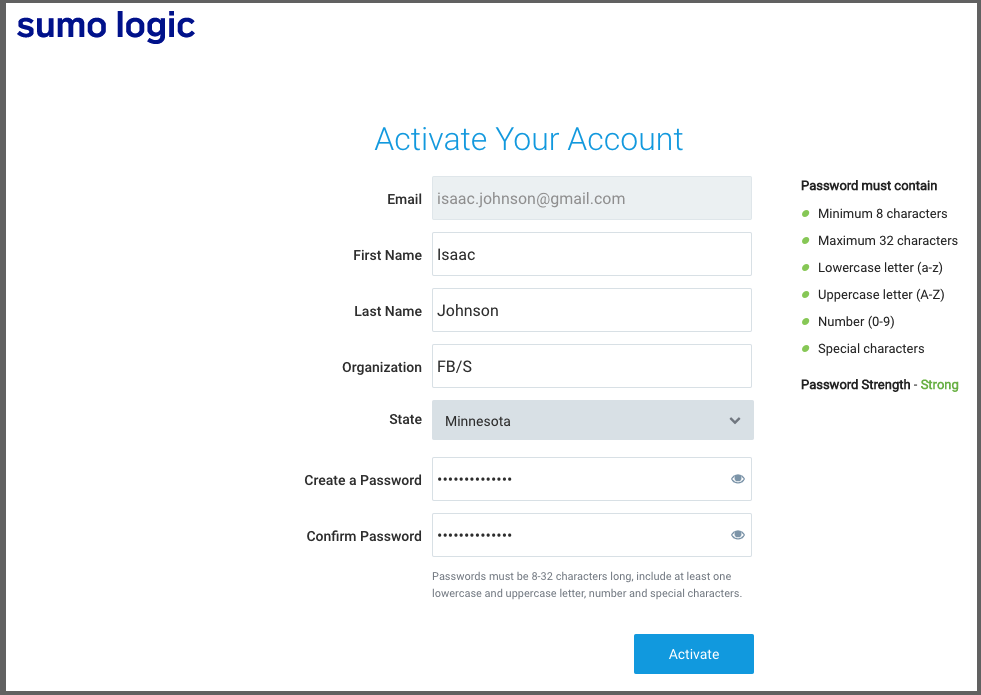
Then create your account
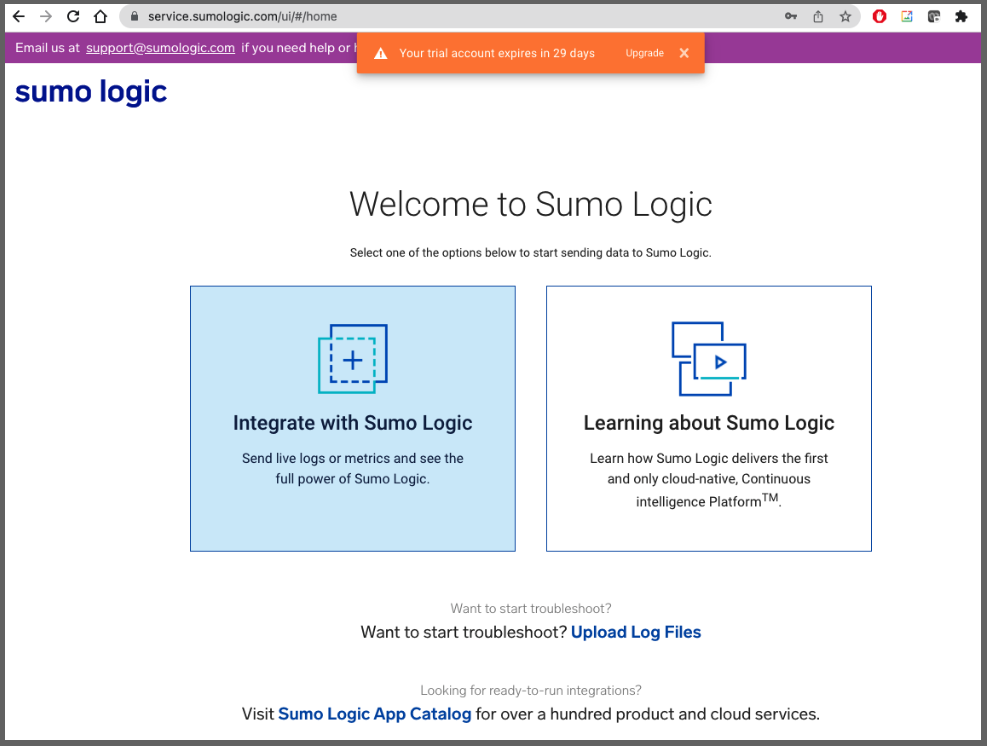
And once activated, we can login
Installing local agent
Let’s start simple and use the wizard to setup a linux monitor:
Select “Linux System”
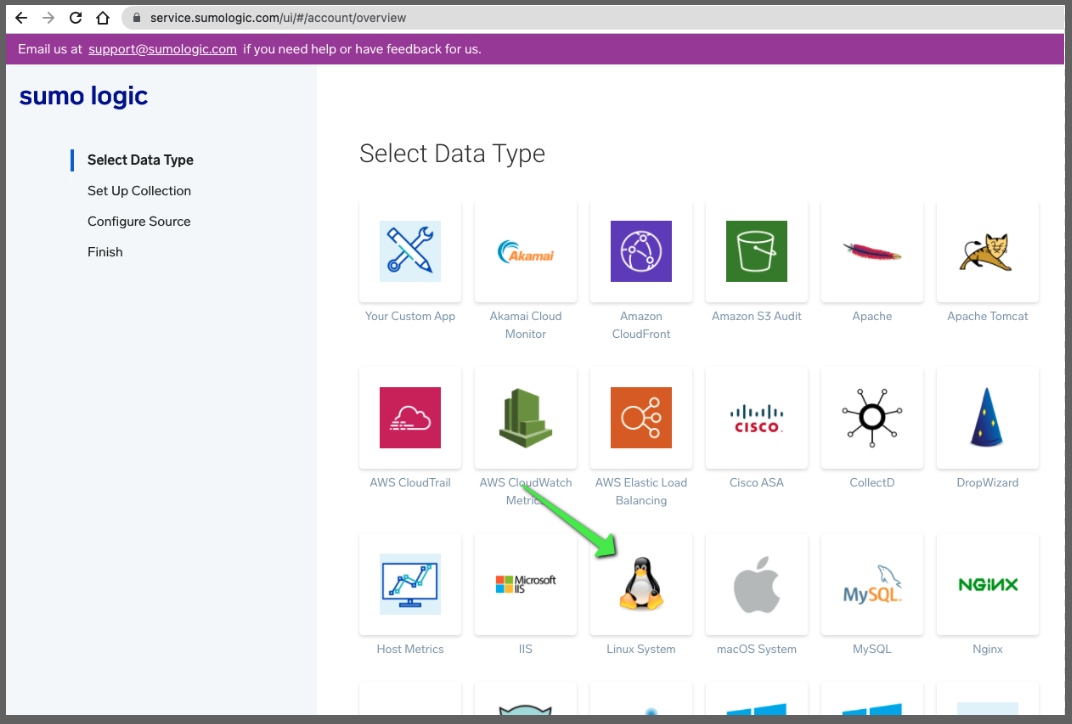
This will give us a simple install script:
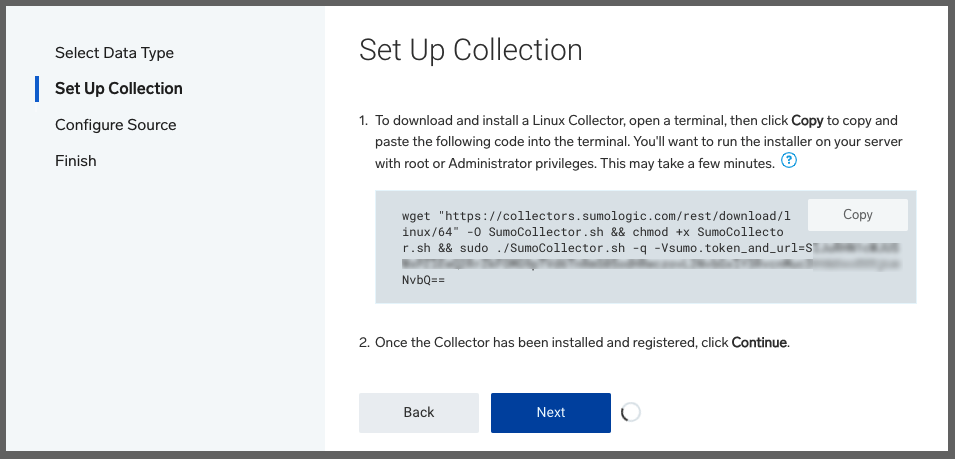
Launch in your Linux shell, be that WSL, Mac OS Terminal or the Linux of your choosing.
$ wget "https://collectors.sumologic.com/rest/download/linux/64" -O SumoCollector.sh && chmod +x SumoCollector.sh && sudo ./SumoCollector.sh -q -Vsumo.token_and_url=asdfasdfasdfsadfasdfasdfasdfasdfasdfasdfasdfasdfasdfasdfasdfasdfasdfasdfasdfasdfasdf==
--2021-12-28 11:02:28--  https://collectors.sumologic.com/rest/download/linux/64
Resolving collectors.sumologic.com (collectors.sumologic.com)... 44.195.111.128, 18.213.207.207, 34.236.173.140, ...
Connecting to collectors.sumologic.com (collectors.sumologic.com)|44.195.111.128|:443... connected.
HTTP request sent, awaiting response... 200 OK
Length: 79504582 (76M) [application/octet-stream]
Saving to: ‘SumoCollector.sh’

SumoCollector.sh                       100%[============================================================================>]  75.82M  29.4MB/s    in 2.6s

2021-12-28 11:02:30 (29.4 MB/s) - ‘SumoCollector.sh’ saved [79504582/79504582]

[sudo] password for builder:
Unpacking JRE ...
Starting Installer ...
The installation directory has been set to /opt/SumoCollector.
2021-12-28 11:02:46,851 main WARN The bufferSize is set to 8192 but bufferedIo is false: false
Extracting files...
Finishing installation...
In the next page in Sumo Logic, we can add additional log locations and override the Timezone if desired.
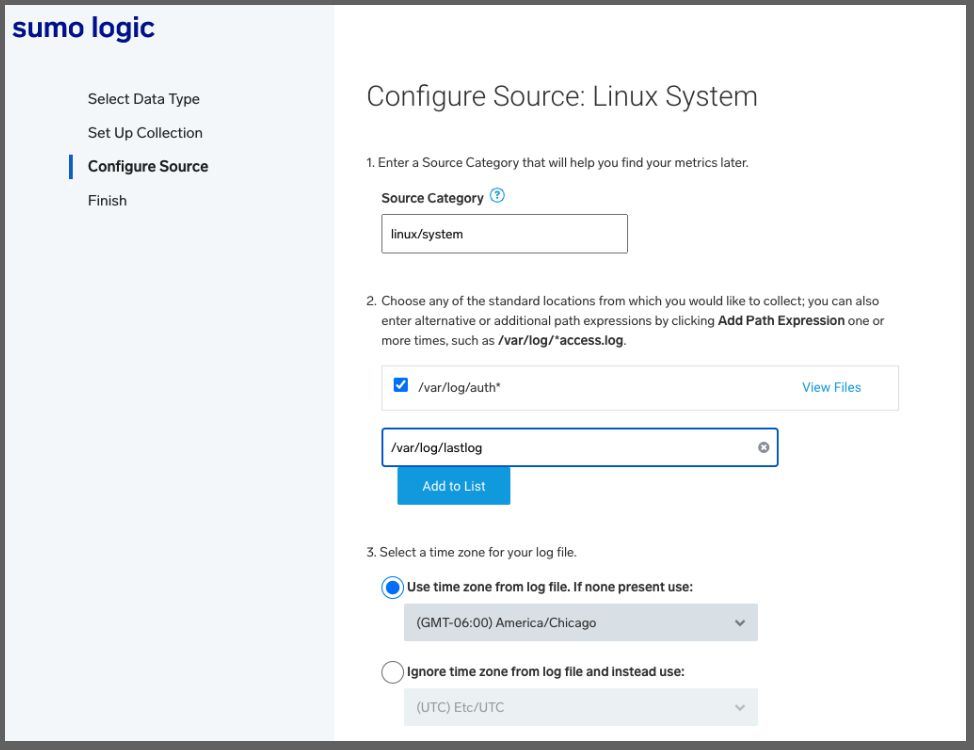
Which then leads to the next window to finish (for some reason it did not like /var/log/lastlog or /var/log/last* so I removed)
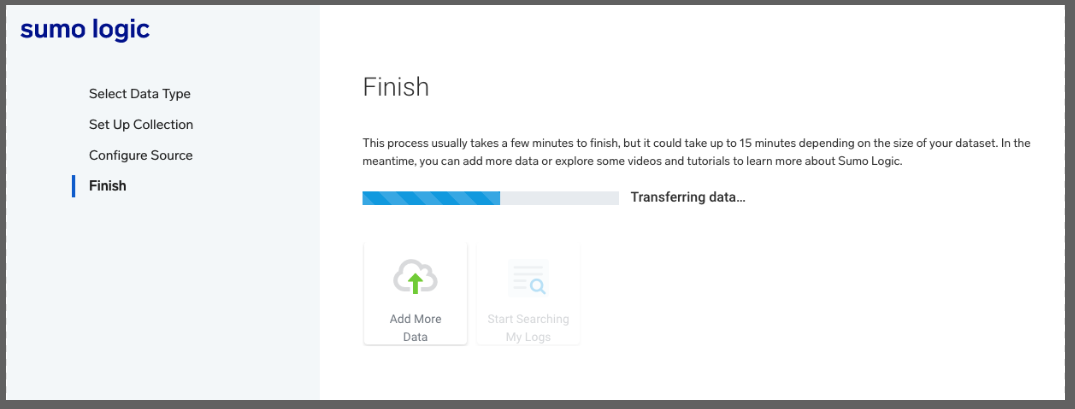
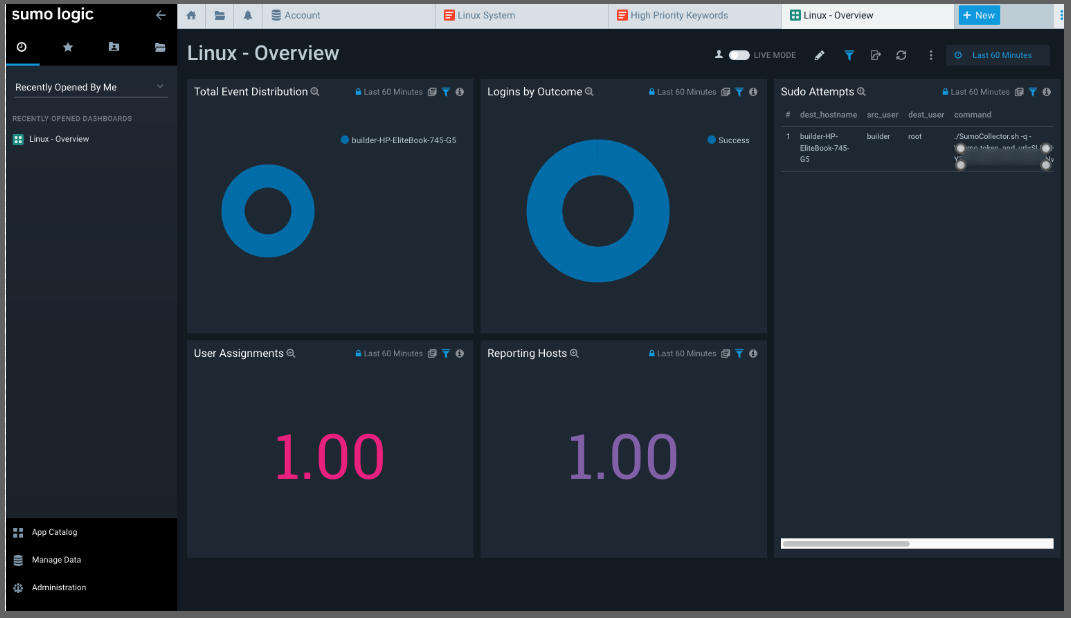
We can then see logs propagate in the Dashboard
Kubernetes Monitoring
We will use the Kubernetes Collector to install the Sumo Logic Helm Operator.
Fresh AKS
Let’s start by creating a fresh AKS
First create a RG and set the SP ID and PASS if you need to set your AKS to run under a service principal
$ az account set --subscription "Visual Studio Enterprise Subscription" && az group create -n idjaks04rg --location centralus
{
  "id": "/subscriptions/eaeaee-aeaee-aeae-aeae-aeaeaeaeae/resourceGroups/idjaks04rg",
  "location": "centralus",
  "managedBy": null,
  "name": "idjaks04rg",
  "properties": {
    "provisioningState": "Succeeded"
  },
  "tags": null,
  "type": "Microsoft.Resources/resourceGroups"
}

$ export SP_ID=`cat SP_ID | tr -d '\n'` && export SP_PASS=`cat SP_PASS | tr -d '\n'`
To monitor Kubernetes, Sumo needs some fields added, namely:
- cluster
- container
- deployment
- host
- namespace
- node
- pod
- service
But no need to fret, that can be handled by the helm chart automatically (and is, by default). If you already set them up, you can have the helm deploy not add them with --set sumologic.setupEnabled=false
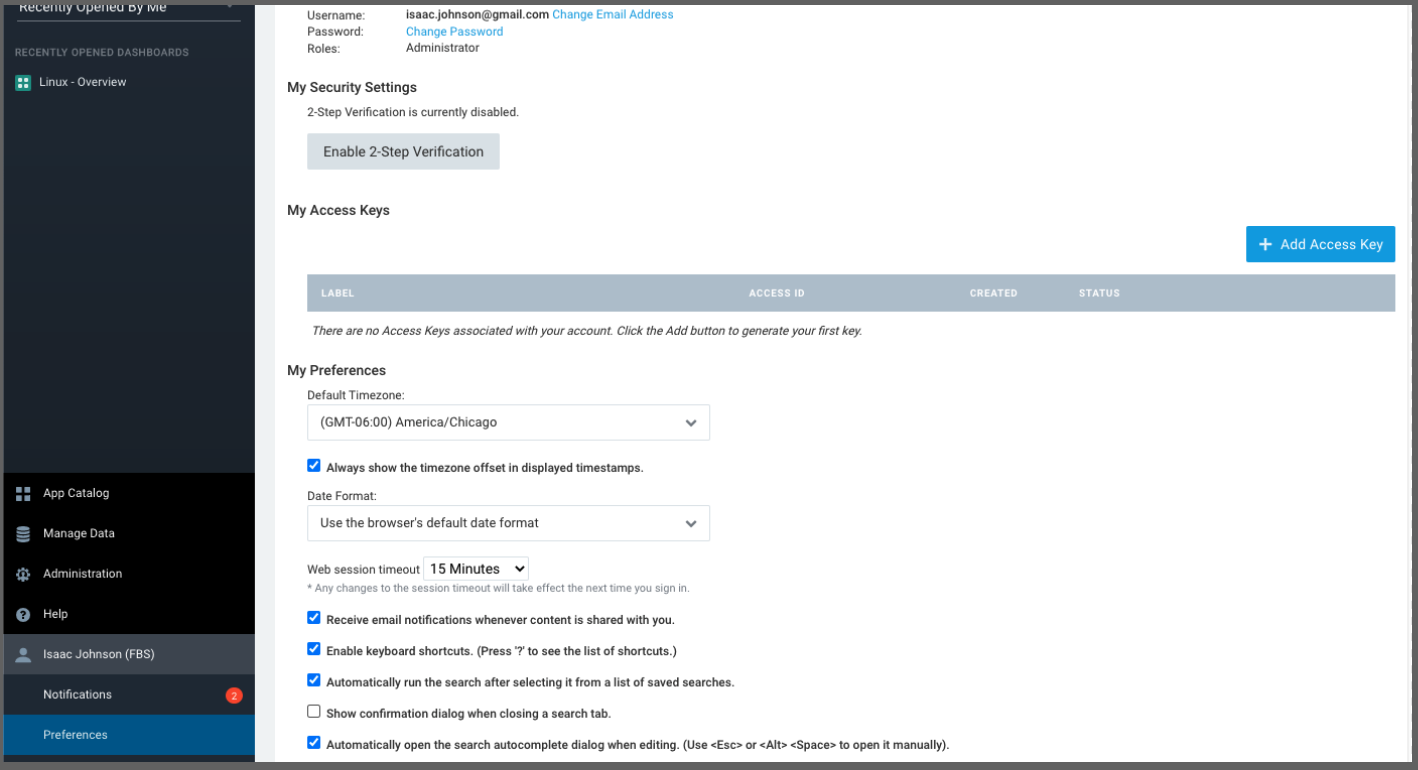
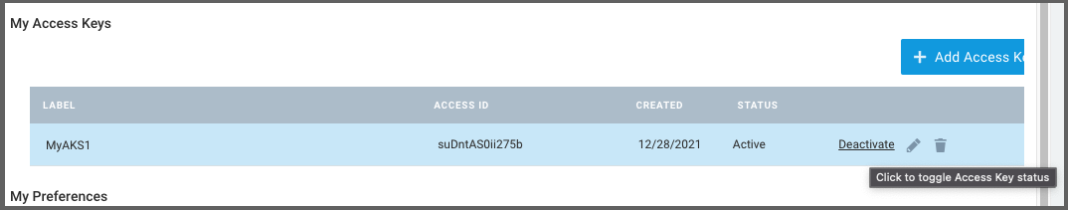
Before we move on, we will need an Access Key (Key and ID).
We can create that in our Preferences menu:
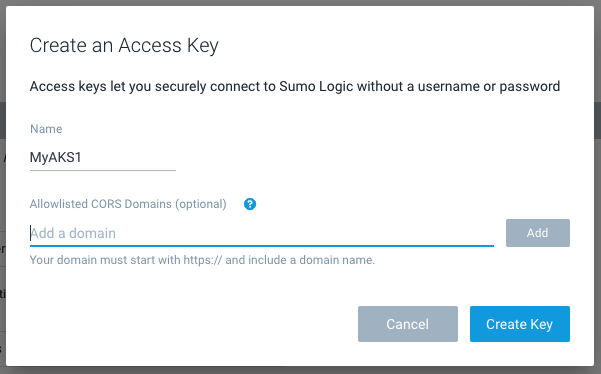
Give it a name
We are then presented with a Key ID and Secret (Key).
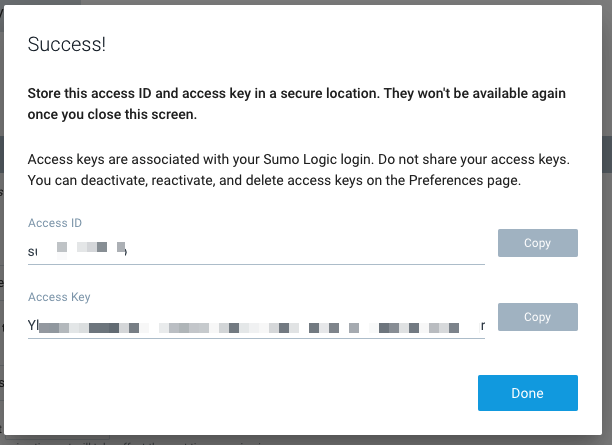
Note: we can always go back and delete/deactive keys when done
Let’s create the AKS cluster
$ az aks create -g idjaks04rg -n idjaks04sl --location centralus  --network-plugin azure --network-policy azure --generate-ssh-keys --service-principal $SP_ID --client-secret $SP_PASS
{
  "aadProfile": null,
  "addonProfiles": null,
  "agentPoolProfiles": [
    {
      "availabilityZones": null,
      "count": 3,
      "enableAutoScaling": false,
...

  "windowsProfile": {
    "adminPassword": null,
    "adminUsername": "azureuser",
    "enableCsiProxy": true,
    "licenseType": null
  }
}

$ (rm -f ~/.kube/config || true) && az aks get-credentials -g idjaks04rg -n idjaks04sl --admin && kubectl get nodes
Merged "idjaks04sl-admin" as current context in /Users/johnisa/.kube/config
NAME                                STATUS   ROLES   AGE    VERSION
aks-nodepool1-79923192-vmss000000   Ready    agent   2m8s   v1.21.7
aks-nodepool1-79923192-vmss000001   Ready    agent   117s   v1.21.7
aks-nodepool1-79923192-vmss000002   Ready    agent   2m     v1.21.7
$
Now let’s add the helm chart and update
$ helm repo add sumologic https://sumologic.github.io/sumologic-kubernetes-collection
"sumologic" has been added to your repositories

$ helm repo update
Hang tight while we grab the latest from your chart repositories...
...Successfully got an update from the "sumologic" chart repository
...Successfully got an update from the "chrdemo" chart repository
...Successfully got an update from the "azure-samples" chart repository
...Successfully got an update from the "datadog" chart repository
...Successfully got an update from the "actions-runner-controller" chart repository
...Successfully got an update from the "cribl" chart repository
...Successfully got an update from the "bitnami" chart repository
Update Complete. ⎈Happy Helming!⎈
Then with the Key we created, we can install the cluster. The clusterName can just be set once so be sure to use something you’ll remember for sumologic.clusterName`:
$ helm upgrade --install mysumorelease sumologic/sumologic --set sumologic.accessId=s******b --set sumologic.accessKey=Y******************************Q --set sumologic.clusterName="MyAKS1"
Release "mysumorelease" does not exist. Installing it now.
W1228 11:56:23.756453   32199 warnings.go:70] policy/v1beta1 PodSecurityPolicy is deprecated in v1.21+, unavailable in v1.25+
W1228 11:56:23.831975   32199 warnings.go:70] policy/v1beta1 PodSecurityPolicy is deprecated in v1.21+, unavailable in v1.25+
W1228 11:56:23.908921   32199 warnings.go:70] policy/v1beta1 PodSecurityPolicy is deprecated in v1.21+, unavailable in v1.25+
W1228 11:56:23.986558   32199 warnings.go:70] policy/v1beta1 PodSecurityPolicy is deprecated in v1.21+, unavailable in v1.25+
W1228 11:57:00.034907   32199 warnings.go:70] policy/v1beta1 PodSecurityPolicy is deprecated in v1.21+, unavailable in v1.25+
W1228 11:57:00.064641   32199 warnings.go:70] policy/v1beta1 PodSecurityPolicy is deprecated in v1.21+, unavailable in v1.25+
W1228 11:57:00.064643   32199 warnings.go:70] policy/v1beta1 PodSecurityPolicy is deprecated in v1.21+, unavailable in v1.25+
W1228 11:57:00.064648   32199 warnings.go:70] policy/v1beta1 PodSecurityPolicy is deprecated in v1.21+, unavailable in v1.25+
NAME: mysumorelease
LAST DEPLOYED: Tue Dec 28 11:56:19 2021
NAMESPACE: default
STATUS: deployed
REVISION: 1
NOTES:
Thank you for installing sumologic.

A Collector with the name "MyAKS1" has been created in your Sumo Logic account.

Check the release status by running:
  kubectl --namespace default get pods -l "release=mysumorelease"

We've tried to automatically create fields. In an unlikely scenario that this
fails please refer to the following to create them manually:
https://github.com/SumoLogic/sumologic-kubernetes-collection/blob/2b3ca63/deploy/docs/Installation_with_Helm.md#prerequisite
I noted that, by default, it uses the default namespace. This is fine, but something that caught my attention:
$ kubectl get pods
NAME                                                   READY   STATUS    RESTARTS   AGE
mysumorelease-fluent-bit-dfccq                         1/1     Running   0          3m34s
mysumorelease-fluent-bit-gj999                         1/1     Running   0          3m34s
mysumorelease-fluent-bit-vggh7                         1/1     Running   0          3m34s
mysumorelease-kube-prometh-operator-77fb54985d-xwfws   1/1     Running   0          3m34s
mysumorelease-kube-state-metrics-5fb7b7b599-7x697      1/1     Running   0          3m34s
mysumorelease-prometheus-node-exporter-9wn72           1/1     Running   0          3m34s
mysumorelease-prometheus-node-exporter-gvjw2           1/1     Running   0          3m34s
mysumorelease-prometheus-node-exporter-js7fx           1/1     Running   0          3m34s
mysumorelease-sumologic-fluentd-events-0               1/1     Running   0          3m34s
mysumorelease-sumologic-fluentd-logs-0                 1/1     Running   0          3m34s
mysumorelease-sumologic-fluentd-logs-1                 1/1     Running   0          3m34s
mysumorelease-sumologic-fluentd-logs-2                 1/1     Running   0          3m34s
mysumorelease-sumologic-fluentd-metrics-0              1/1     Running   0          3m34s
mysumorelease-sumologic-fluentd-metrics-1              1/1     Running   0          3m34s
mysumorelease-sumologic-fluentd-metrics-2              1/1     Running   0          3m34s
prometheus-mysumorelease-kube-prometh-prometheus-0     0/3     Pending   0          3m21s
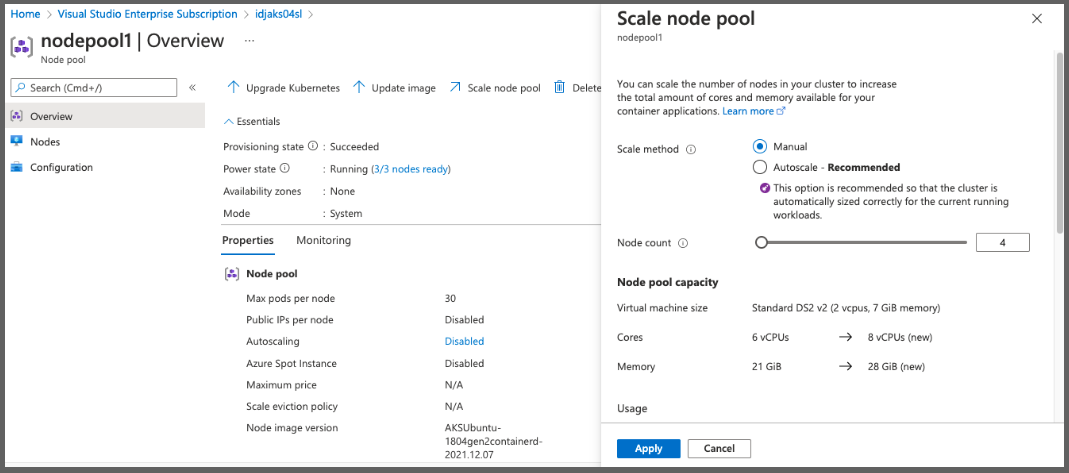
Interestingly the basic AKS cluster with 3 Standard_DS2_v2 VMs wouldn’t schedule the prometheus pod due to insufficient CPU
$ kubectl describe pod prometheus-mysumorelease-kube-prometh-prometheus-0 | tail -n4
Events:
  Type     Reason            Age                 From               Message
  ----     ------            ----                ----               -------
  Warning  FailedScheduling  8s (x9 over 7m29s)  default-scheduler  0/3 nodes are available: 3 Insufficient cpu.
I scaled out by a node:
$ kubectl get nodes
NAME                                STATUS   ROLES   AGE     VERSION
aks-nodepool1-79923192-vmss000000   Ready    agent   55m     v1.21.7
aks-nodepool1-79923192-vmss000001   Ready    agent   55m     v1.21.7
aks-nodepool1-79923192-vmss000002   Ready    agent   55m     v1.21.7
aks-nodepool1-79923192-vmss000003   Ready    agent   2m50s   v1.21.7
$ kubectl get pods
NAME                                                   READY   STATUS    RESTARTS   AGE
mysumorelease-fluent-bit-dfccq                         1/1     Running   0          14m
mysumorelease-fluent-bit-gj999                         1/1     Running   0          14m
mysumorelease-fluent-bit-tvhbw                         1/1     Running   0          3m24s
mysumorelease-fluent-bit-vggh7                         1/1     Running   0          14m
mysumorelease-kube-prometh-operator-77fb54985d-xwfws   1/1     Running   0          14m
mysumorelease-kube-state-metrics-5fb7b7b599-7x697      1/1     Running   0          14m
mysumorelease-prometheus-node-exporter-9wn72           1/1     Running   0          14m
mysumorelease-prometheus-node-exporter-gvjw2           1/1     Running   0          14m
mysumorelease-prometheus-node-exporter-js7fx           1/1     Running   0          14m
mysumorelease-prometheus-node-exporter-lbqff           1/1     Running   0          3m24s
mysumorelease-sumologic-fluentd-events-0               1/1     Running   0          14m
mysumorelease-sumologic-fluentd-logs-0                 1/1     Running   0          14m
mysumorelease-sumologic-fluentd-logs-1                 1/1     Running   0          14m
mysumorelease-sumologic-fluentd-logs-2                 1/1     Running   0          14m
mysumorelease-sumologic-fluentd-metrics-0              1/1     Running   0          14m
mysumorelease-sumologic-fluentd-metrics-1              1/1     Running   0          14m
mysumorelease-sumologic-fluentd-metrics-2              1/1     Running   0          14m
prometheus-mysumorelease-kube-prometh-prometheus-0     3/3     Running   1          14m
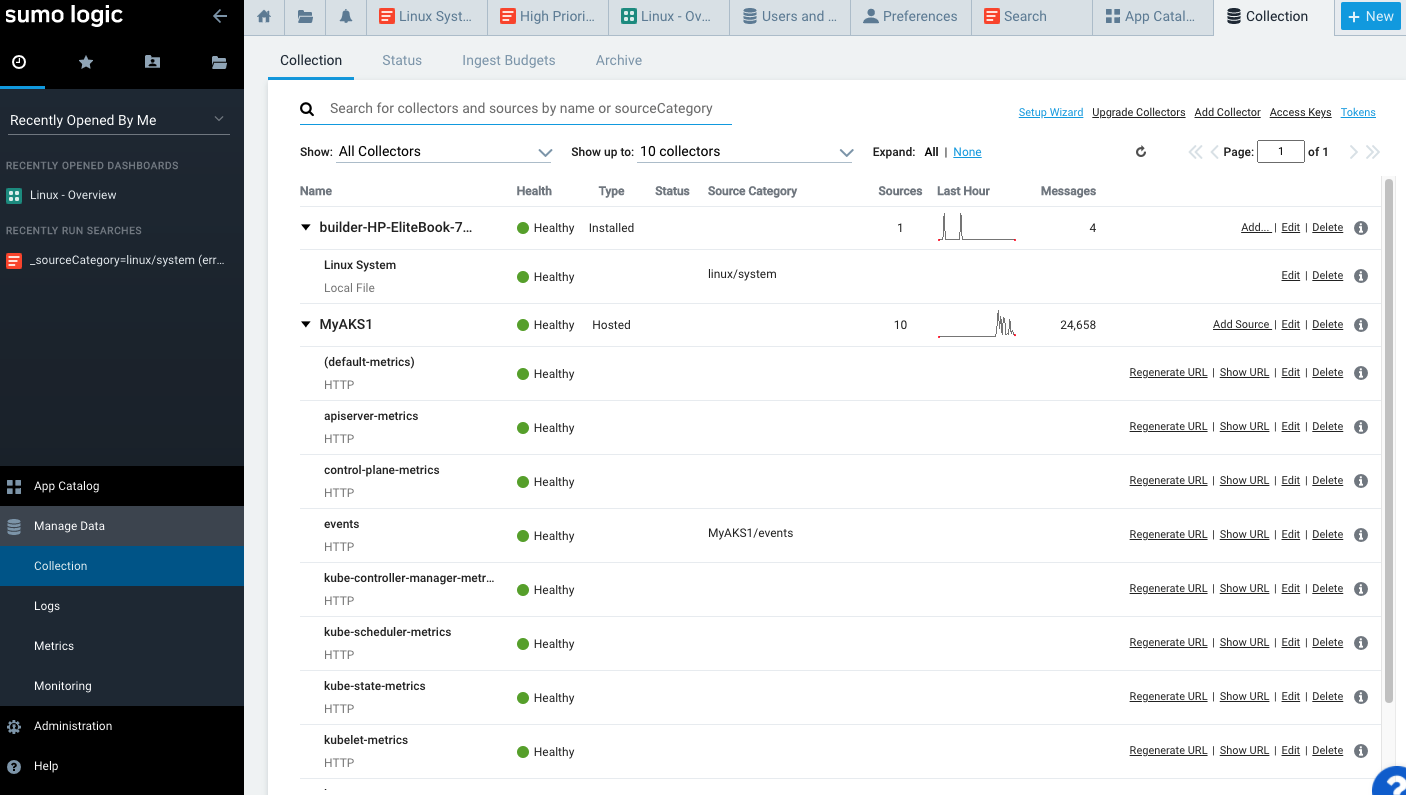
We can now see MyAKS1 under the Collection menu, noting that it is gathering metrics and logs:
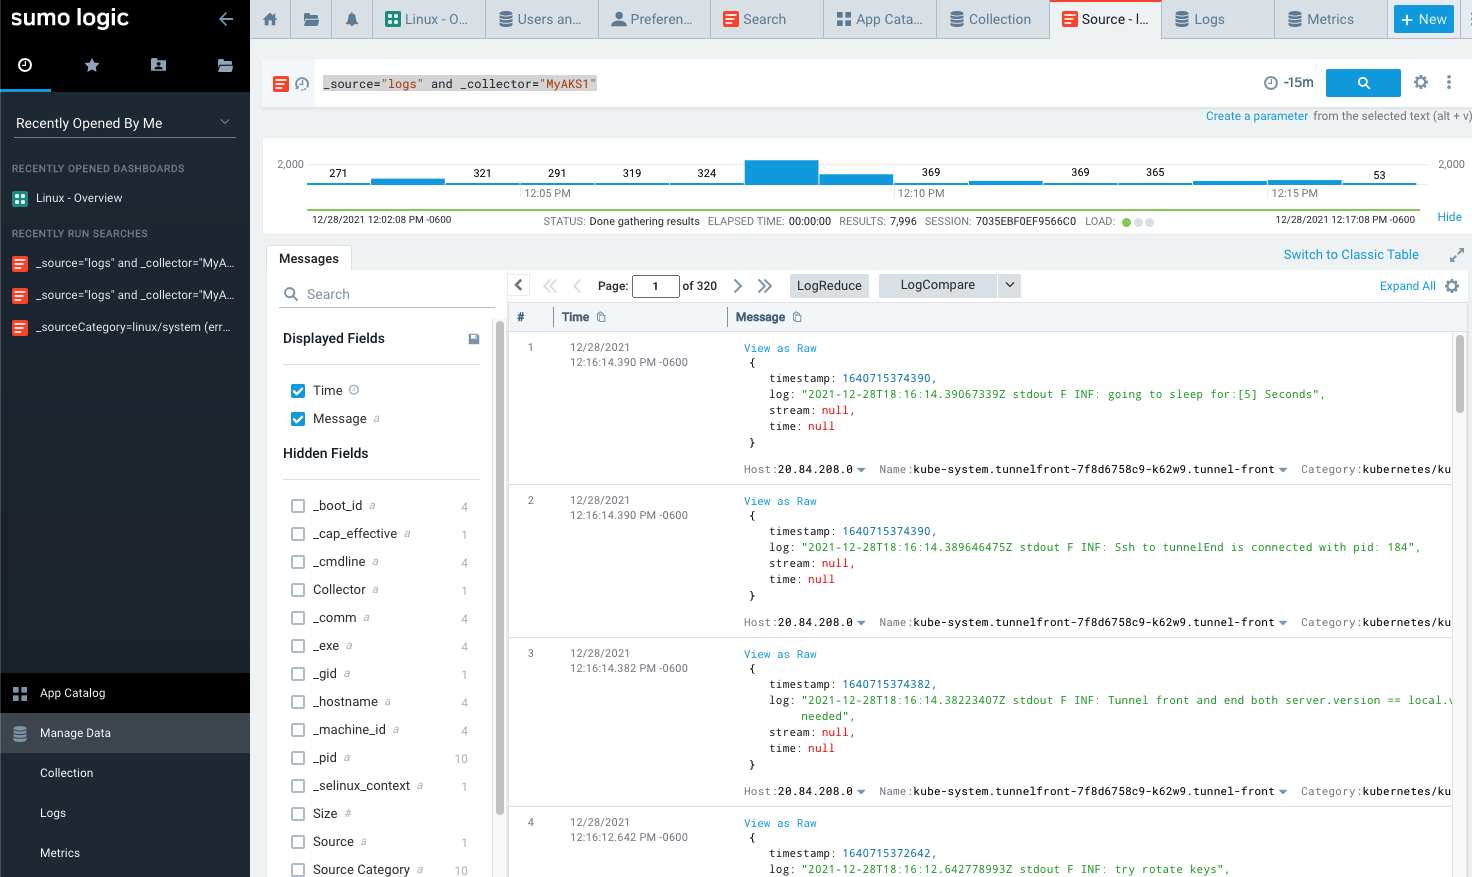
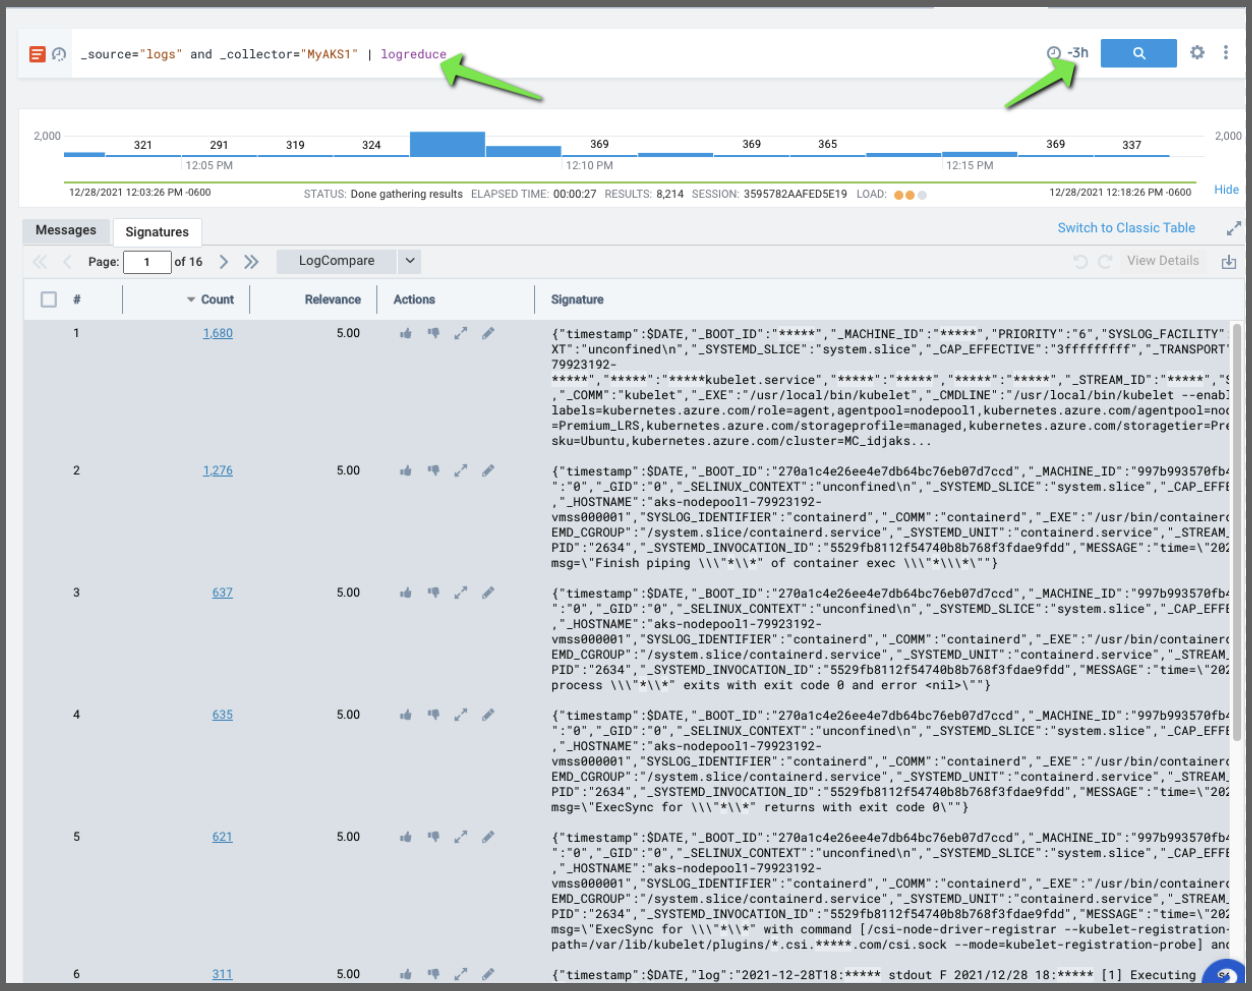
We can use the Log Query _source="logs" and _collector="MyAKS1" to vew the Logs coming out of our AKS cluster:
We can pipe that into logreduce to see a count over a period. Perhaps we want to logreduce over the last 3 hours to see the most common types of logs _source="logs" and _collector="MyAKS1" | logreduce:
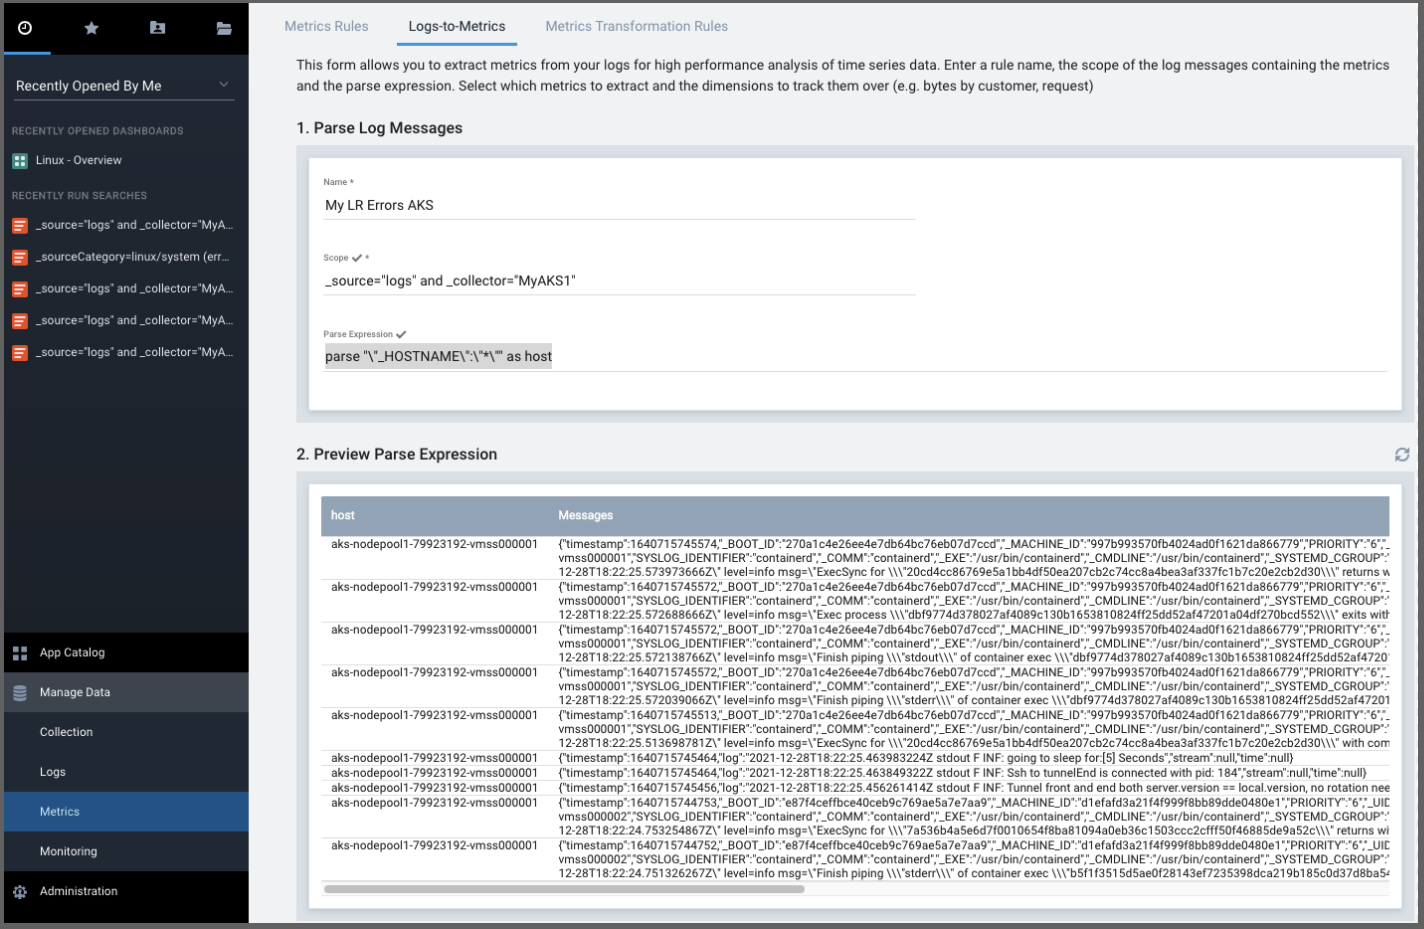
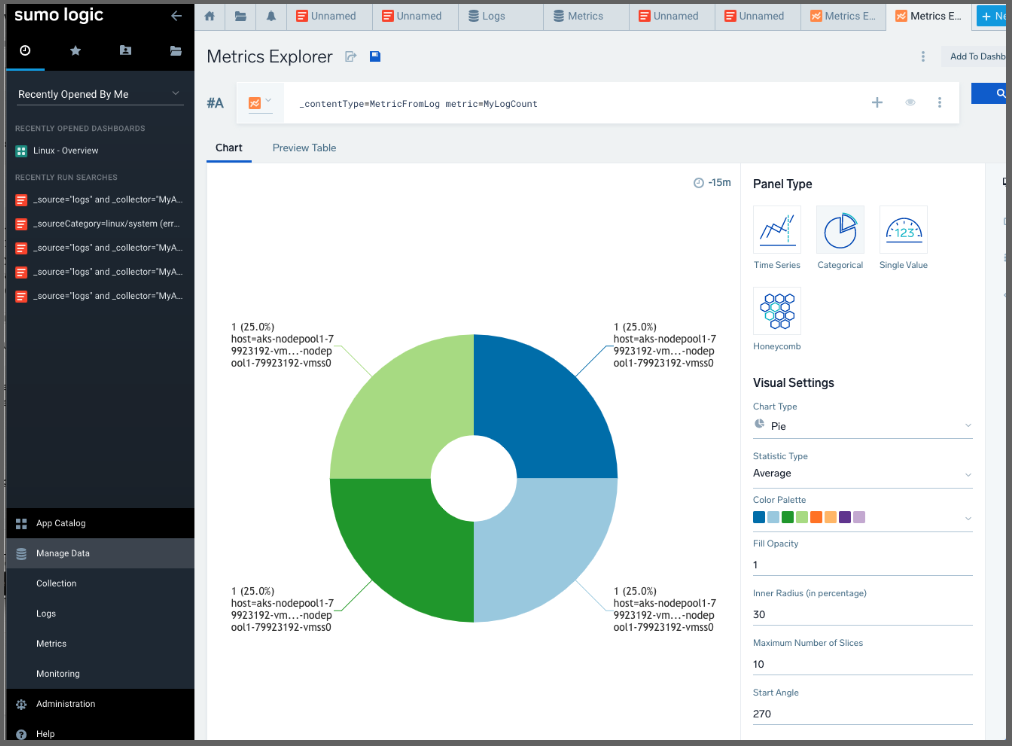
We can then use these logs as Metrics as well. Going to “Metrics” and chosing Logs-To-Metrics we can use _source="logs" and _collector="MyAKS1" as the Scope and a simple by-host metric could use parse "\"_HOSTNAME\":\"*\"" as host as the Parse Expression
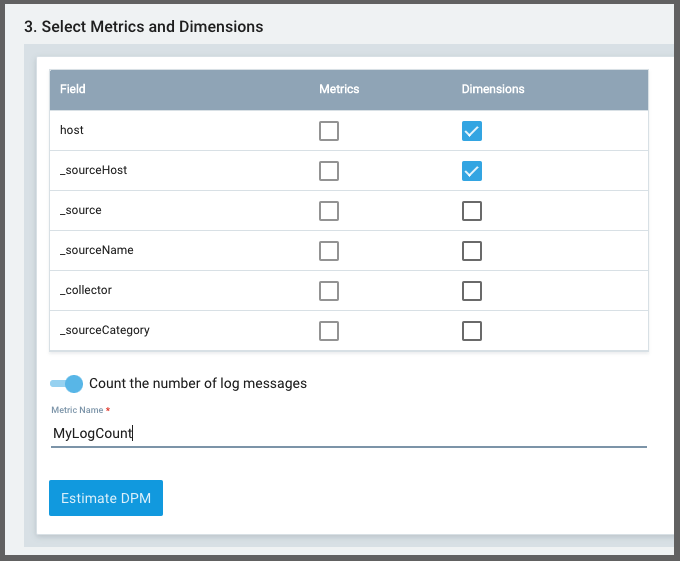
Then set the fields and dimensions
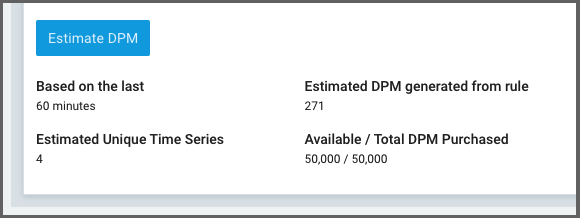
I like how you can estimate the DPM right there in the query based on recent sample data. This is a rather nice way they enable customers to save money on potentially costly queries.
Sample Apps/Integrations
Let’s add some content to our AKS cluster.
First, the Azure Vote App is always a good demo app:
$ helm repo add azure-samples https://azure-samples.github.io/helm-charts/
"azure-samples" already exists with the same configuration, skipping

$ helm repo update
Hang tight while we grab the latest from your chart repositories...
...Successfully got an update from the "chrdemo" chart repository
...Successfully got an update from the "cribl" chart repository
...Successfully got an update from the "sumologic" chart repository
...Successfully got an update from the "datadog" chart repository
...Successfully got an update from the "azure-samples" chart repository
...Successfully got an update from the "actions-runner-controller" chart repository
...Successfully got an update from the "bitnami" chart repository
Update Complete. ⎈Happy Helming!⎈

$ helm install azure-samples/azure-vote --generate-name
NAME: azure-vote-1640716463
LAST DEPLOYED: Tue Dec 28 12:34:27 2021
NAMESPACE: default
STATUS: deployed
REVISION: 1
TEST SUITE: None
NOTES:
The Azure Vote application has been started on your Kubernetes cluster.

Title: Azure Vote App
Vote 1 value: Cats
Vote 2 value: Dogs

The externally accessible IP address can take a minute or so to provision. Run the following command to monitor the provisioning status. Once an External IP address has been provisioned, brows to this IP address to access the Azure Vote application.

kubectl get service -l name=azure-vote-front -w

$ kubectl get svc azure-vote-front
NAME               TYPE           CLUSTER-IP   EXTERNAL-IP     PORT(S)        AGE
azure-vote-front   LoadBalancer   10.0.84.72   20.112.200.44   80:31331/TCP   7m16s
The other common app I like to add is Istio with the Book app:
$ curl -L https://istio.io/downloadIstio | sh -
  % Total    % Received % Xferd  Average Speed   Time    Time     Time  Current
                                 Dload  Upload   Total   Spent    Left  Speed
100   102  100   102    0     0    174      0 --:--:-- --:--:-- --:--:--   176
100  4549  100  4549    0     0   5713      0 --:--:-- --:--:-- --:--:-- 4442k

Downloading istio-1.12.1 from https://github.com/istio/istio/releases/download/1.12.1/istio-1.12.1-osx.tar.gz ...
Istio 1.12.1 Download Complete!

Istio has been successfully downloaded into the istio-1.12.1 folder on your system.

Next Steps:
See https://istio.io/latest/docs/setup/install/ to add Istio to your Kubernetes cluster.

To configure the istioctl client tool for your workstation,
add the /Users/johnisa/Workspaces/sumoLogic/istio-1.12.1/bin directory to your environment path variable with:
	 export PATH="$PATH:/Users/johnisa/Workspaces/sumoLogic/istio-1.12.1/bin"

Begin the Istio pre-installation check by running:
	 istioctl x precheck

Need more information? Visit https://istio.io/latest/docs/setup/install/

$ cd istio-1.12.1/
$ export PATH=$PWD/bin:$PATH
$ istioctl install --set profile=demo -y
✔ Istio core installed
✔ Istiod installed
✔ Egress gateways installed
✔ Ingress gateways installed
✔ Installation complete                                                                                                                                     Making this installation the default for injection and validation.

Thank you for installing Istio 1.12.  Please take a few minutes to tell us about your install/upgrade experience!

$ kubectl apply -f https://raw.githubusercontent.com/istio/istio/release-1.12/samples/bookinfo/platform/kube/bookinfo.yaml

service/details created
serviceaccount/bookinfo-details created
deployment.apps/details-v1 created
service/ratings created
serviceaccount/bookinfo-ratings created
deployment.apps/ratings-v1 created
service/reviews created
serviceaccount/bookinfo-reviews created
deployment.apps/reviews-v1 created
deployment.apps/reviews-v2 created
deployment.apps/reviews-v3 created
service/productpage created
serviceaccount/bookinfo-productpage created
deployment.apps/productpage-v1 created

$ kubectl apply -f https://raw.githubusercontent.com/istio/istio/release-1.12/samples/bookinfo/networking/bookinfo-gateway.yaml
gateway.networking.istio.io/bookinfo-gateway created
virtualservice.networking.istio.io/bookinfo created

$ kubectl -n istio-system get service istio-ingressgateway -o jsonpath='{.status.loadBalancer.ingress[0].ip}'
20.112.200.132
I’ll hit on the product page a few: http://20.112.200.132/productpage
And the Azure Vote app http://20.112.200.44/
We can see the Logs-to-Metrics Explorer shows we got logs from all 4 hosts (not exciting, but proves the point)
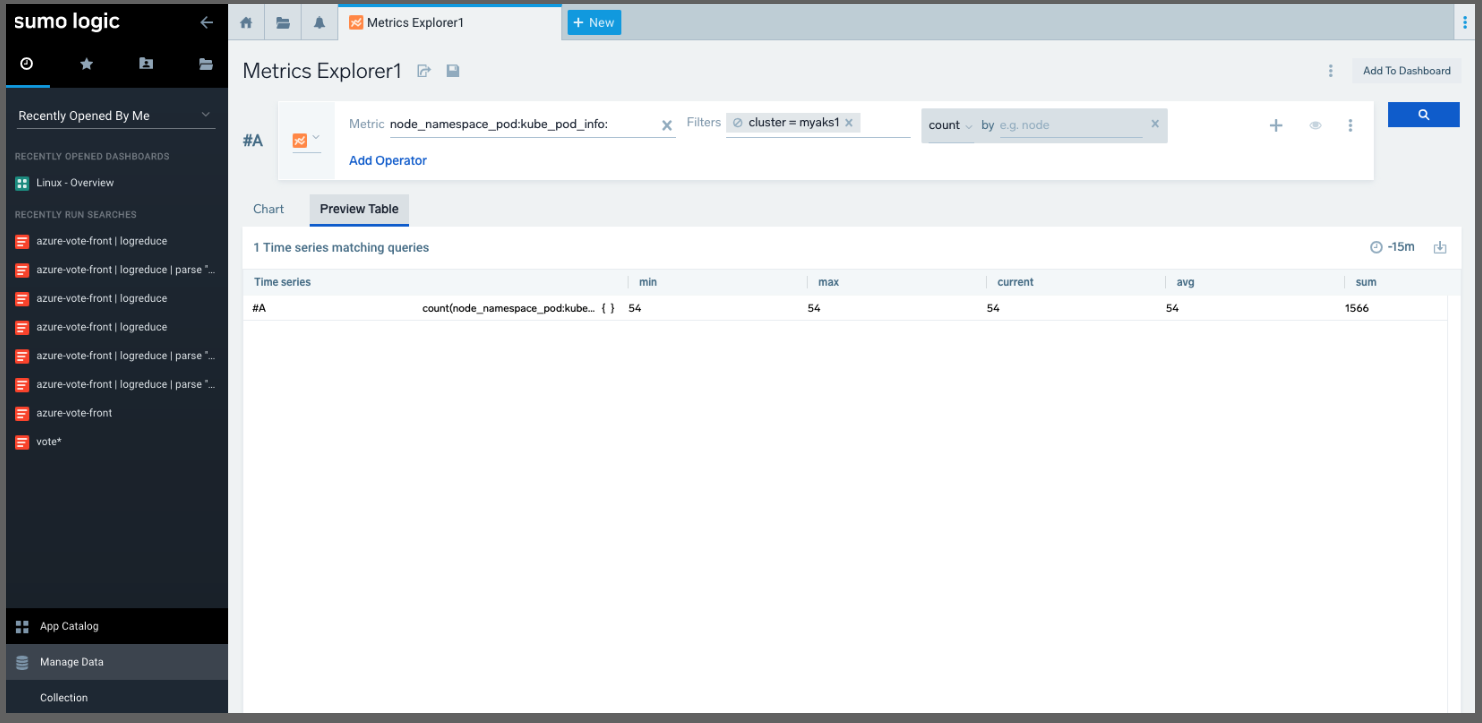
I can also start to put together Metrics queries in the Metrics explorer against the cluster. For instance I could gather counts of node_namespace_pod:kube_pod_info:
Monitors
We can add monitors on Metrics or Logs and base them on Static or Outliers.
For instance, if wanted to alert when we stopped getting log data from our cluster:
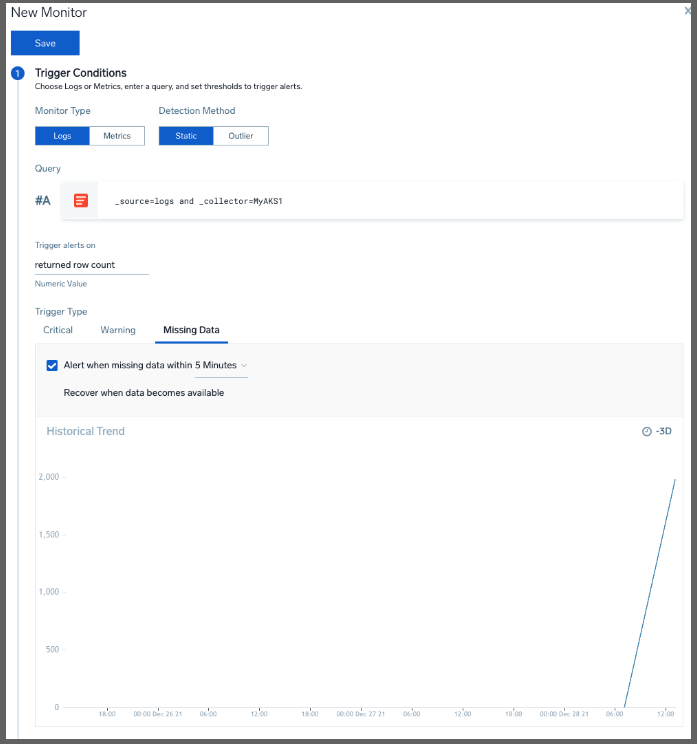
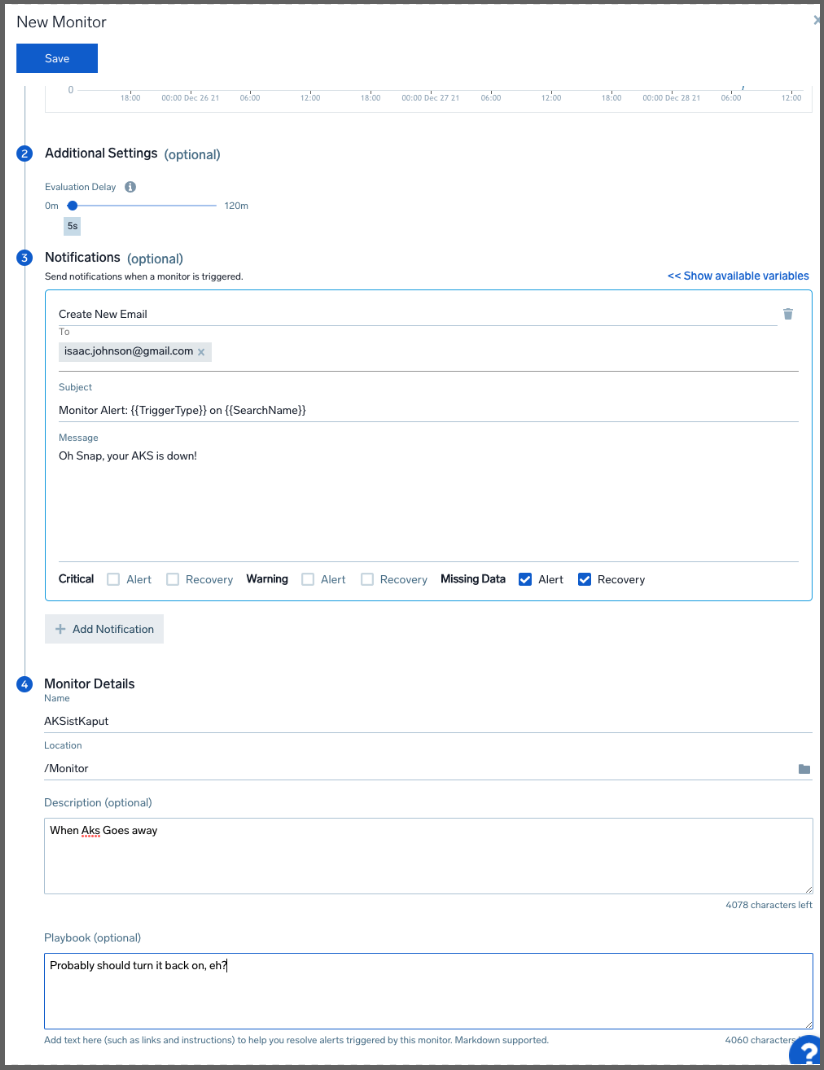
We can set the delay as well as when to send alerts, the name and folder for the monitor and even some runbook instructions
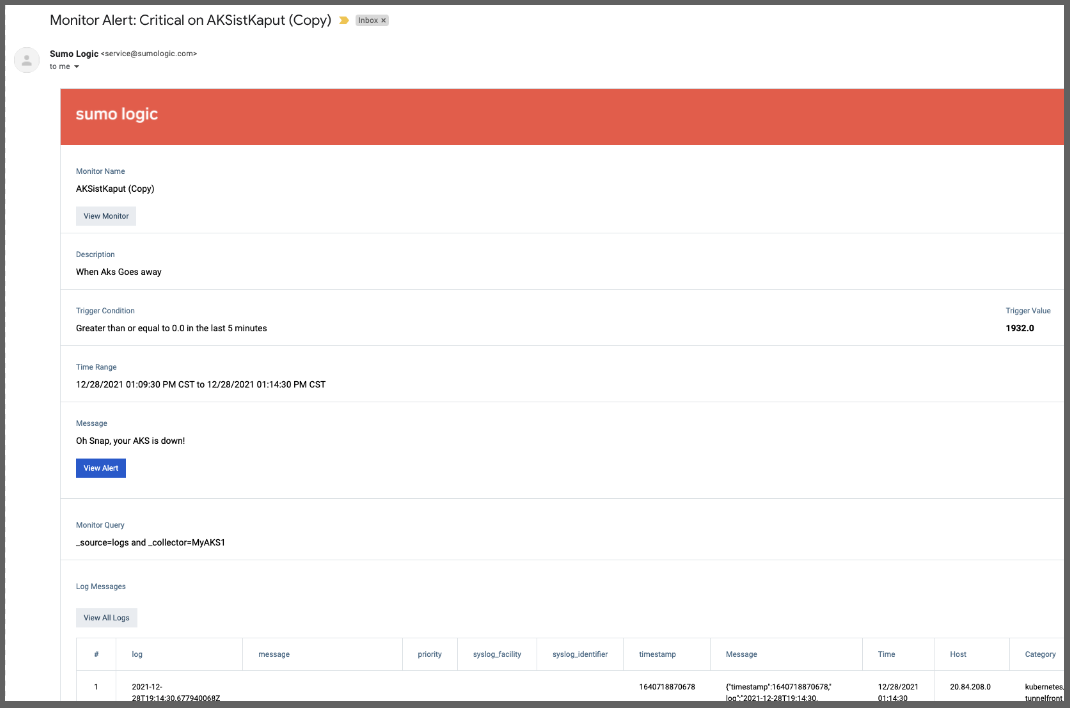
Unfortunately, there is not a “Try” or “Test” button so I set the Monitor to alert when I had results over 5 minutes to see how the message looked:
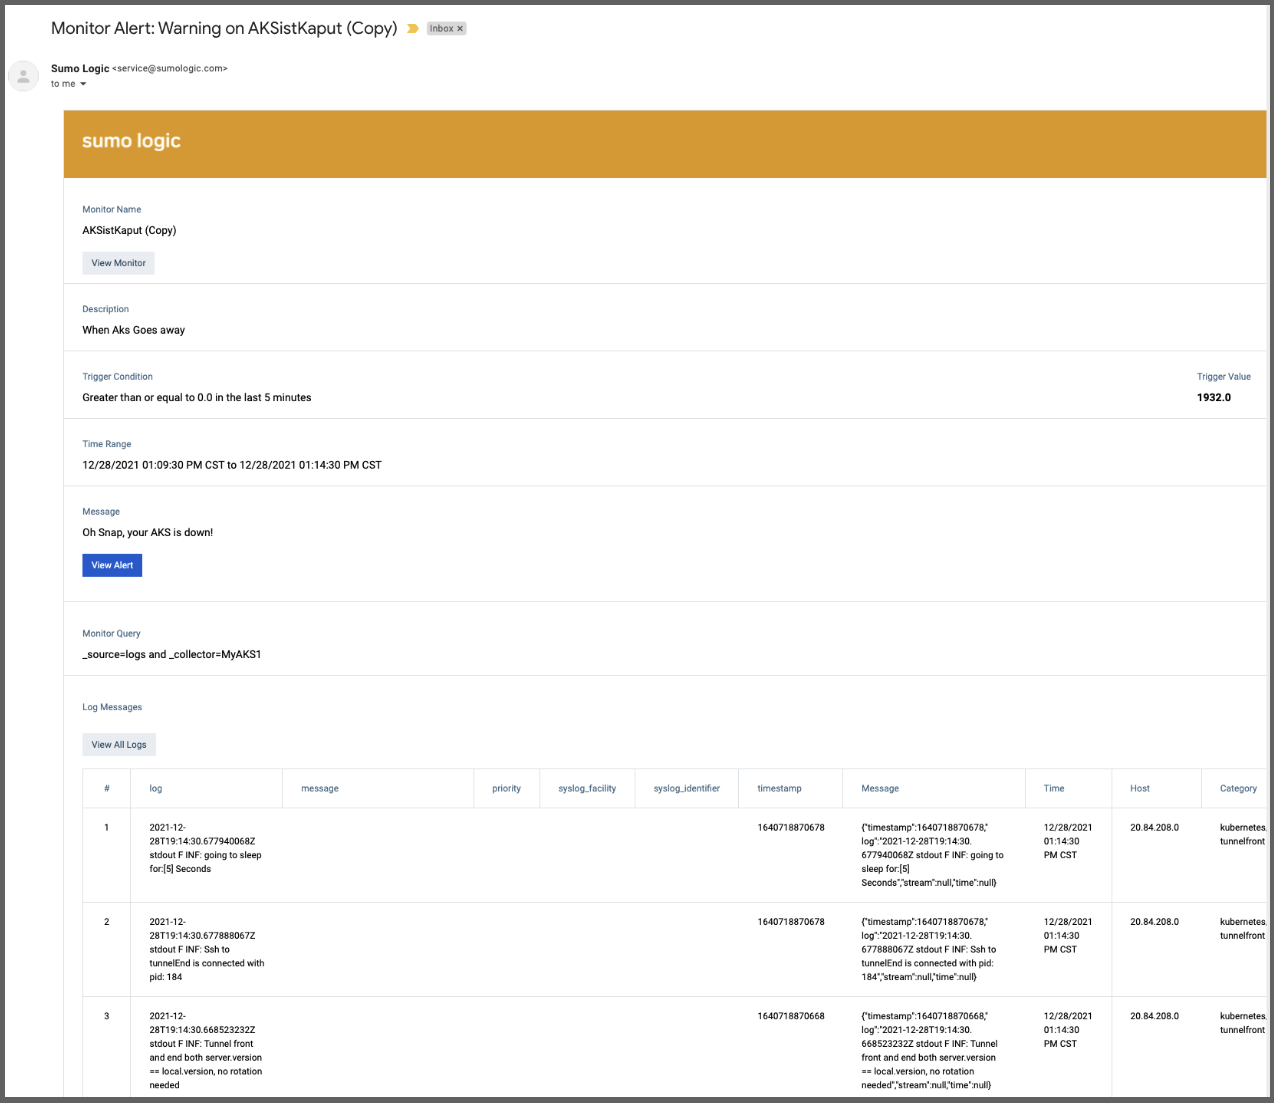
and in Error:
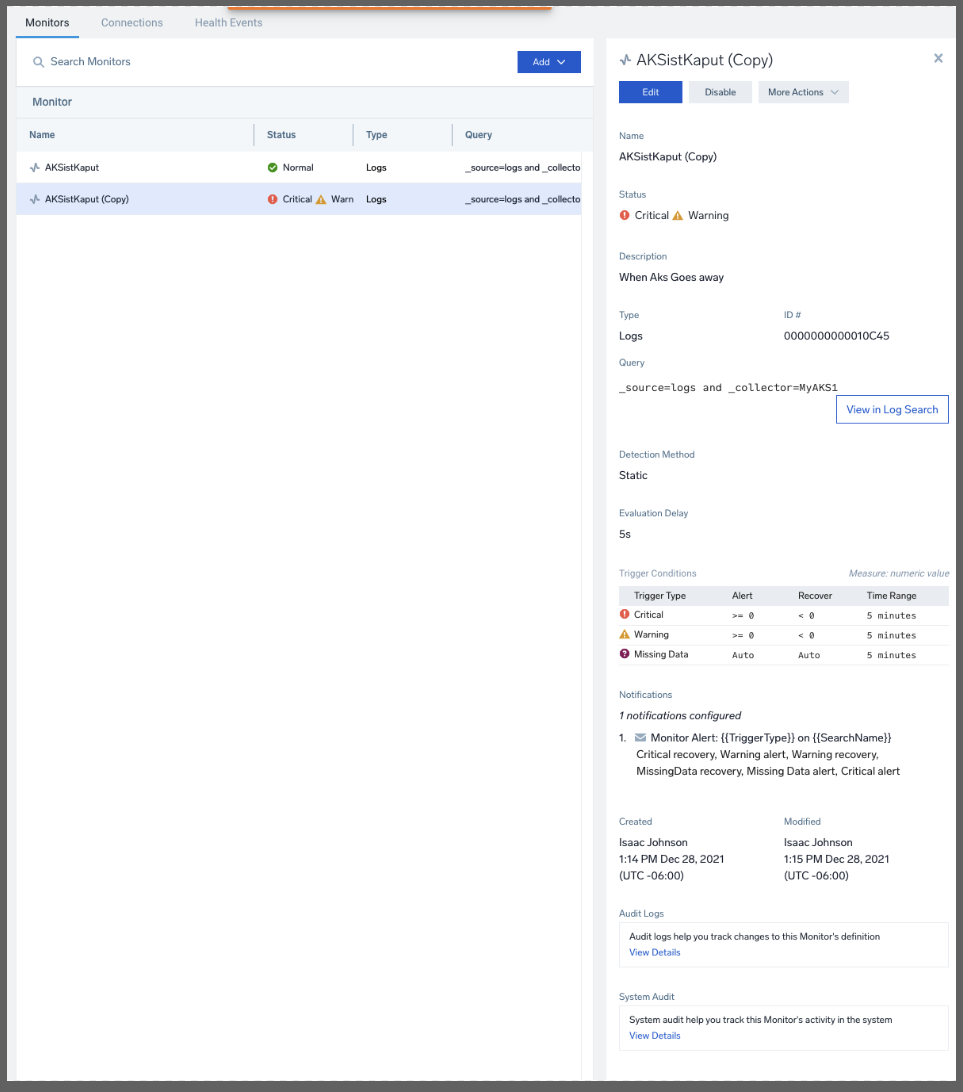
If we go to Monitors, we see that indeed we are in a Warning and Alert condition
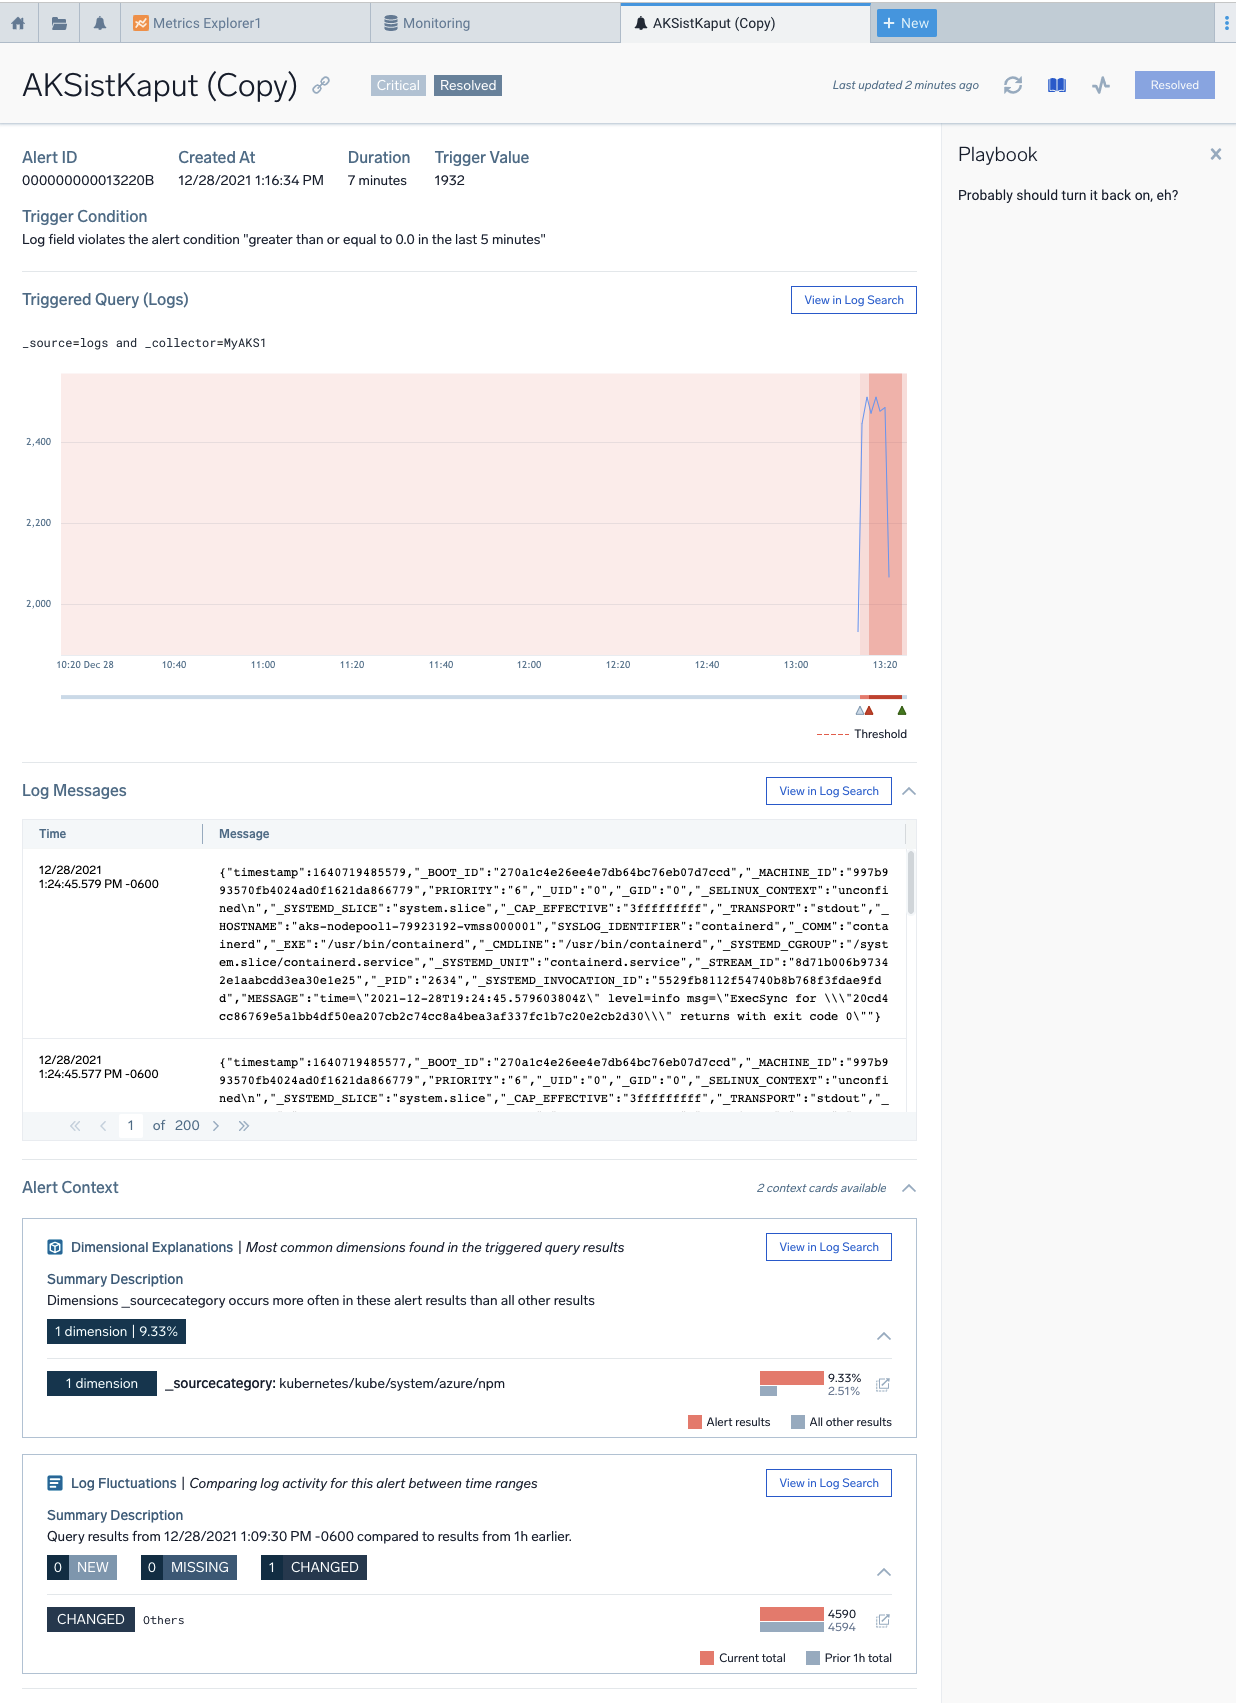
If we had clicked “View Alert” from the email, we would see details of the alert. Clicking the Playbook icon in the upper right shows the Playbook steps we had written
Integrations
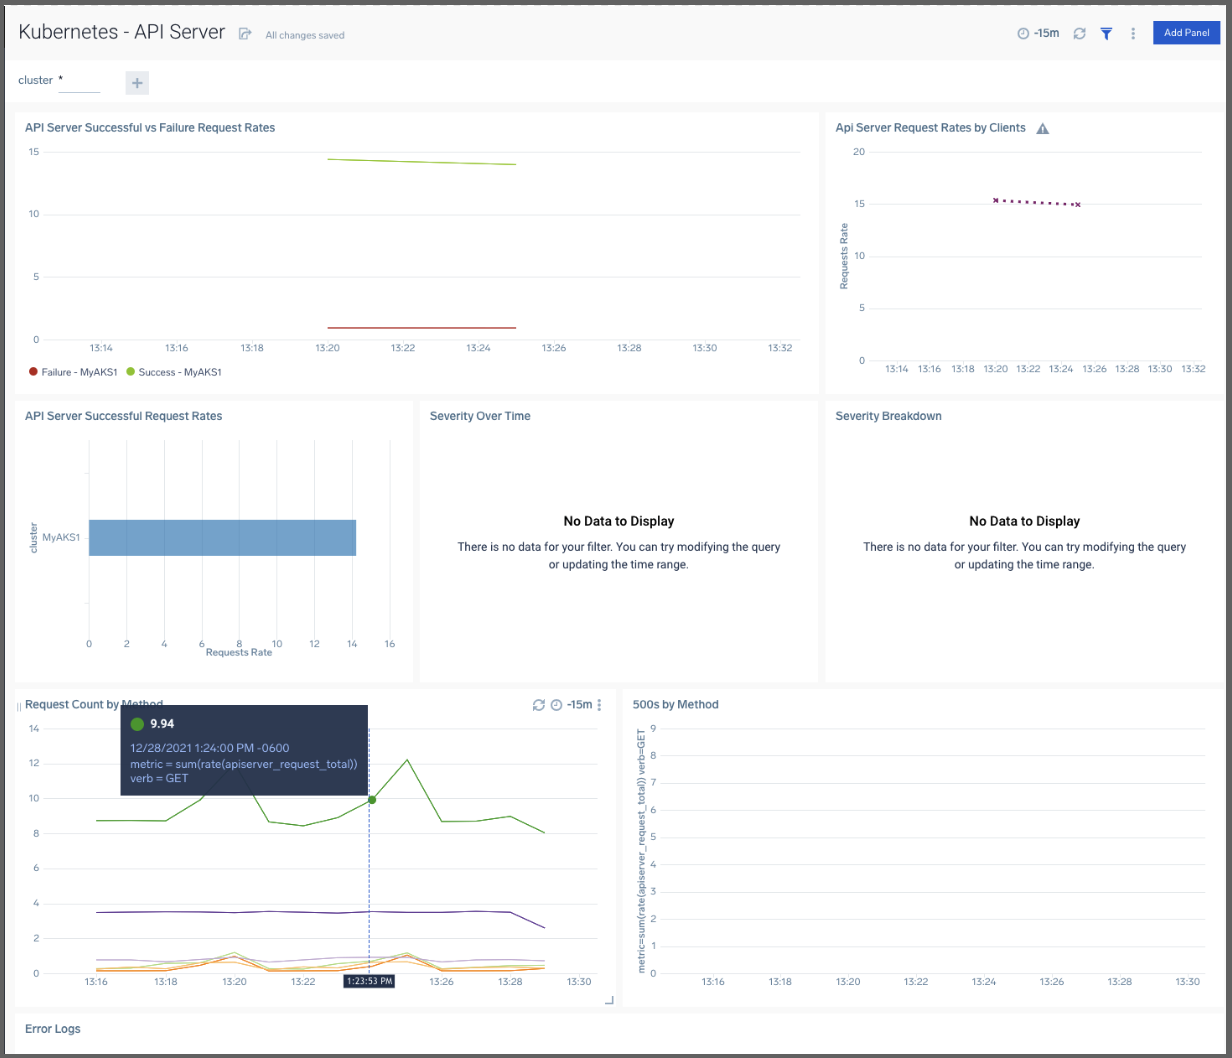
We can actually get some handy Dashboards for our Kubernetes by adding in the Kubernetes Control Plane “App”.
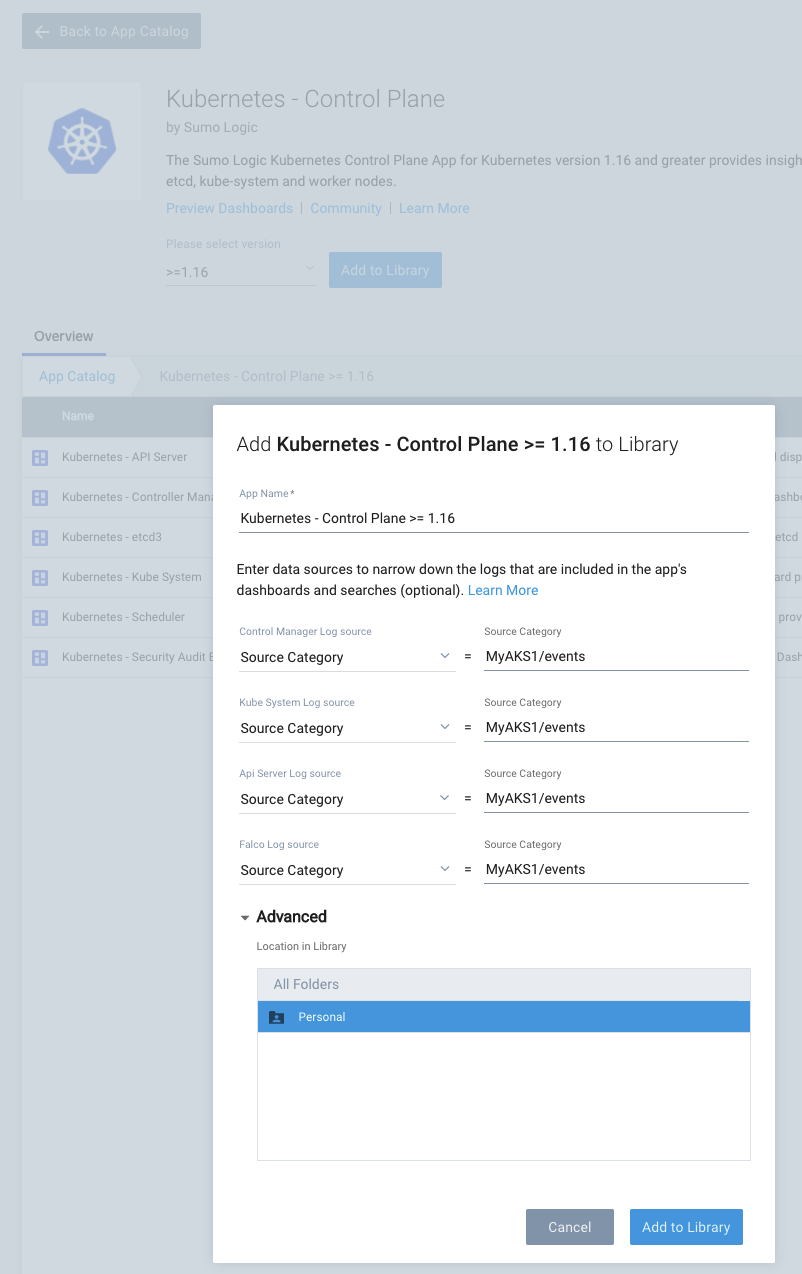
For instance, the K8s API dashboard:
Collectors, Sources and Apps
Understanding this model is key to being productive in Sumo Logic. If you take anything away from this blog post, let it be this section
I had a great call with a Sumo Logic engineer who reached out to see how my trial was going. Ben provided a lot of great tips and in debugging my strange results from Cloudfront and S3 I learned more on the data model.
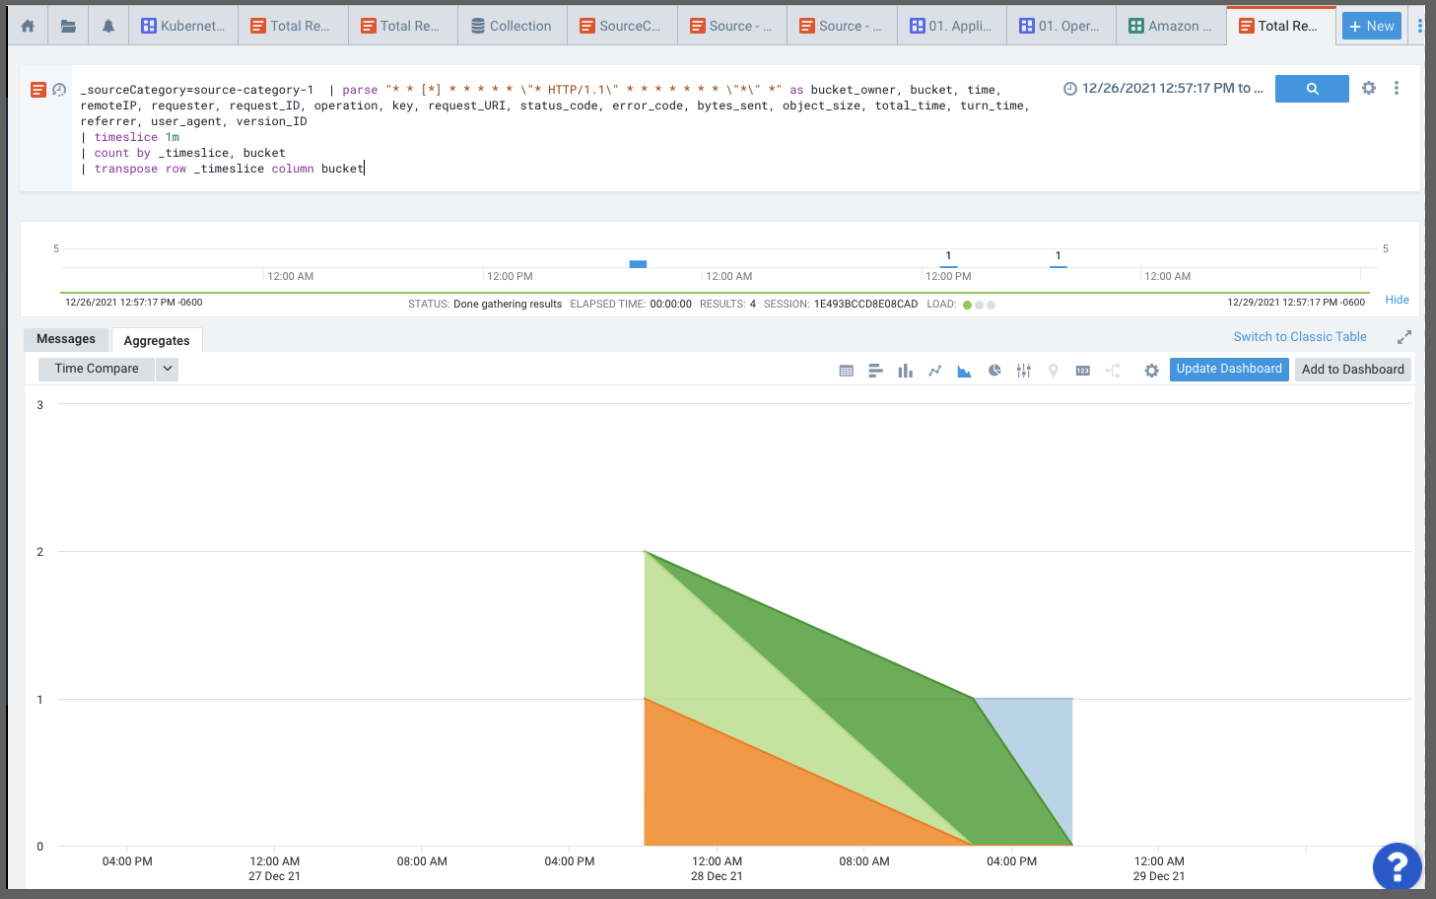
Sumo Logic works by having Collectors, which are like a bucket of Sources. These Collectors ingest data from one or more sources of that type. When we instantiate a Collector it is really important to actually give it a reasonable name for “Source Category” since that is something we will need to select when using an App later. It segregates the data from this type of thing into a way Sumo Logic can handle and parse later. If we leave everything with the default “source-category-1” it can really slow things down and even bungle things up. (Ben admitted this is something they look to address in future updates to the UI)
Collectors and Sources are how we ingest data, be them logs or metrics from sources. Apps are just how we visualize things. When we invoke the “wizard” for Apps we often have the option at the start to “Create a new collector”, “Use an existing Collector” or lastly “Use existing source”. I had been confused before and first setup a collector and source for things like Github and S3 but then subsequently in launching the app I did it all again by creating a new source or collector. The result was that I ended up ingesting a massive amount of duplicate data (and using up all my ingesting credits in that day).
So to be clear. The ideal flow (at least as I worked it out with Ben) is to:
- In Manage Data, create a Collector (or use an existing of that type)
- Add a Source to that Collector
Knowing that we have ingested data, we can then move onto adding an App
- Add an app after getting ingested data. Select “Use existing source” and pick the source we named. Again, this is where giving proper category names helps a lot
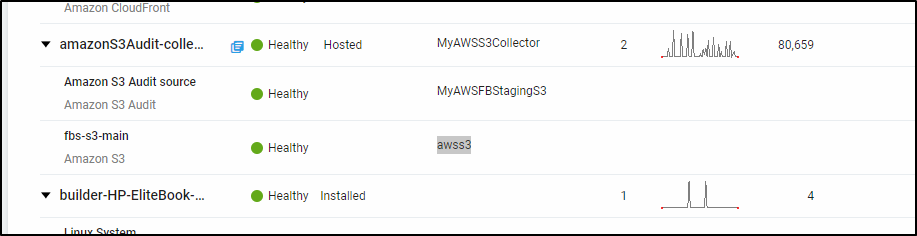
The other lesson I learned was really about what an S3 collector was. I serve my website out of S3 in two ways; one directly for staging and one via CloudFront CDN. When I pointed the S3 collector to the actually website bucket I was telling Sumo Logic “Here is a place with logs to ingest, go parse all this for log lines”.
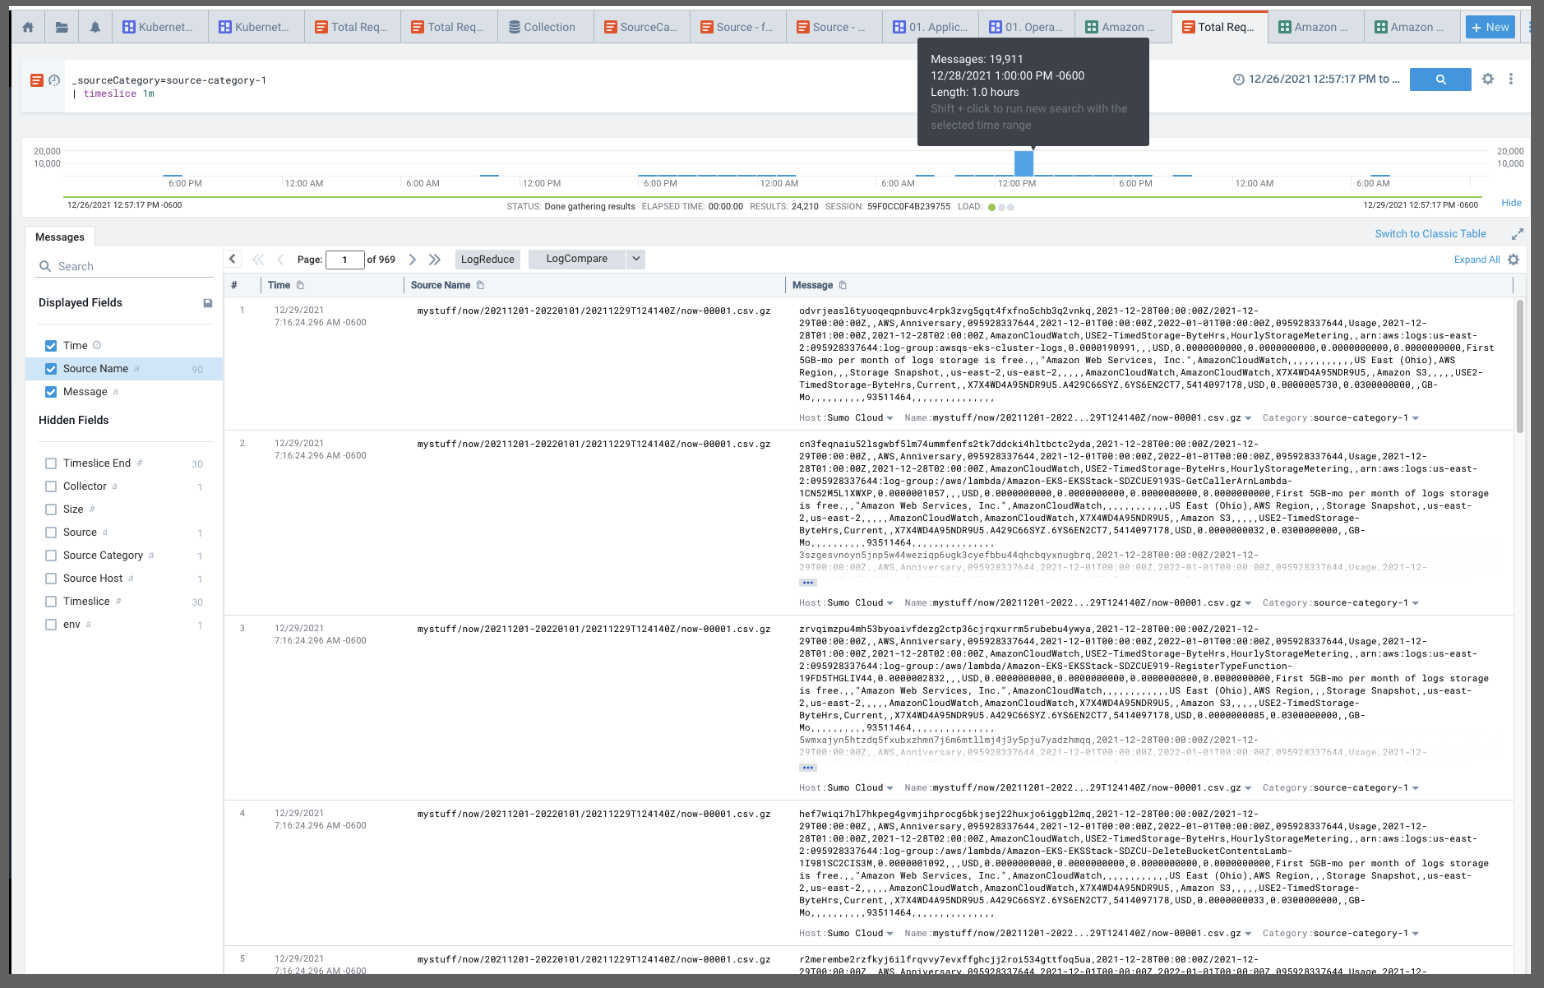
Obviously this was wrong. As we looked at why I had clearly ingested over 80k messages in a day but saw next to nothing in my App windows. Instead we saw binary data in the form of PNG files. We saw repeats as the bucket is versioned.
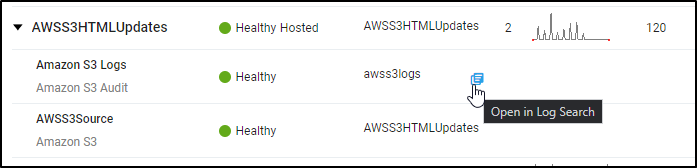
I removed all the collectors and Apps around S3 Audit. Going into AWS I changed both my staging and production buckets to write logs to a new bucket I named “fbs-logs”:
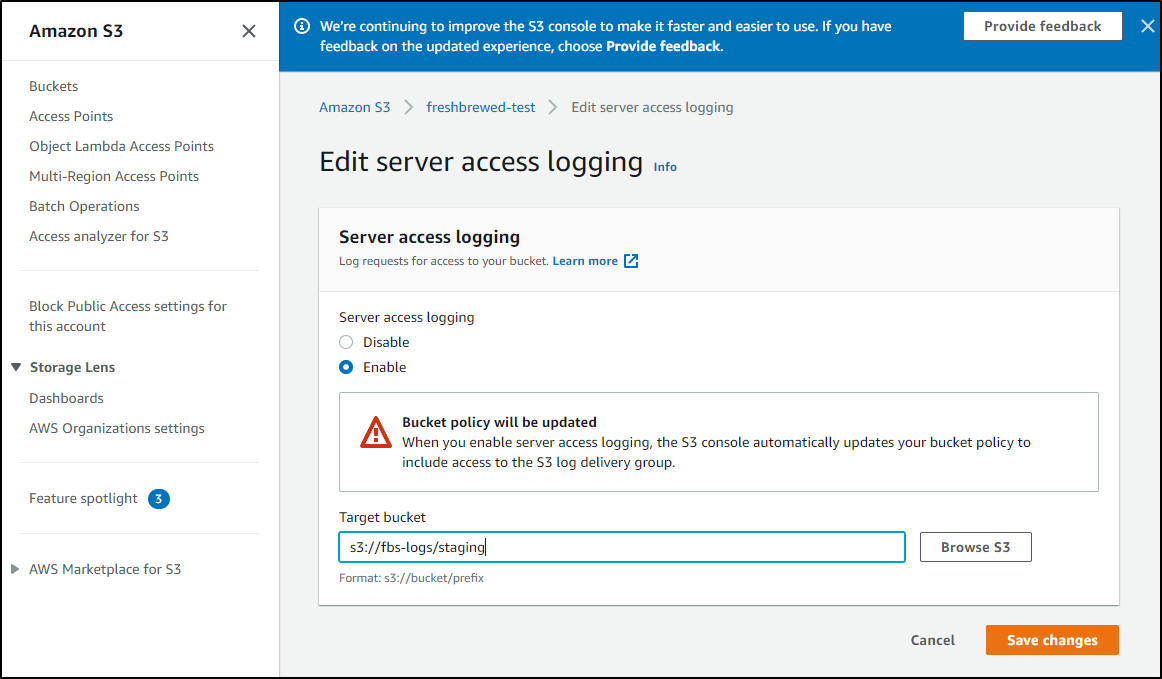
Then I re-added the apps and collectors. By the next morning I saw proper content. We’ll cover that below.
But the point I want to make is that S3 Audit and Ingestion is about logs stored in S3, not about the metadata or events around S3.
AWS S3
Let’s monitor S3 usage with Sumo Logic. We can follow the guide here.
First, we want to setup a Collector, add a new Hosted Collector
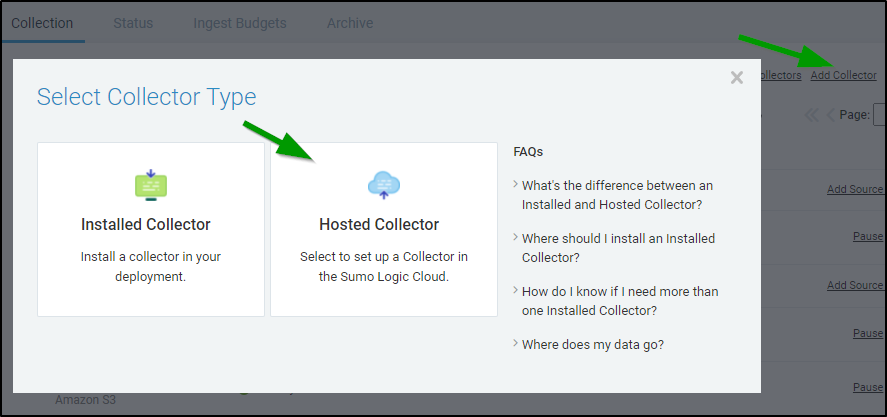
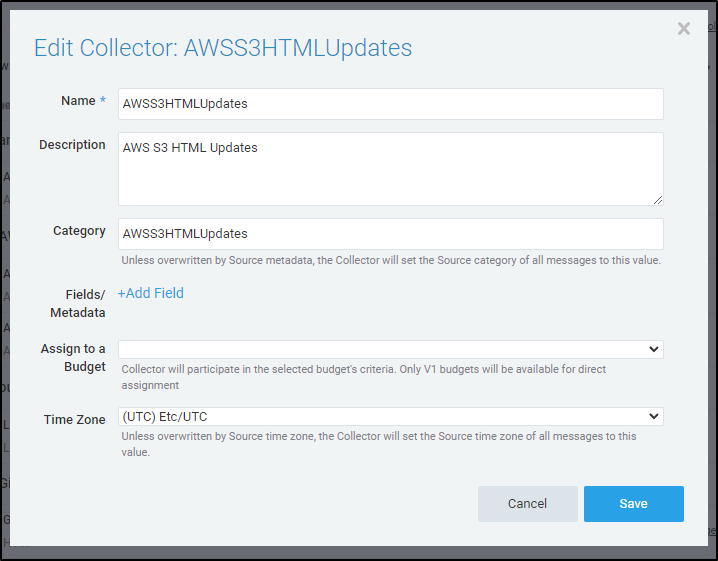
From there we can give it a unique name and category name:
Next, we want to add some S3 sources. Add an S3 source and give it a proper name and category. You can reuse the category you had for the collector or give it a unique one.
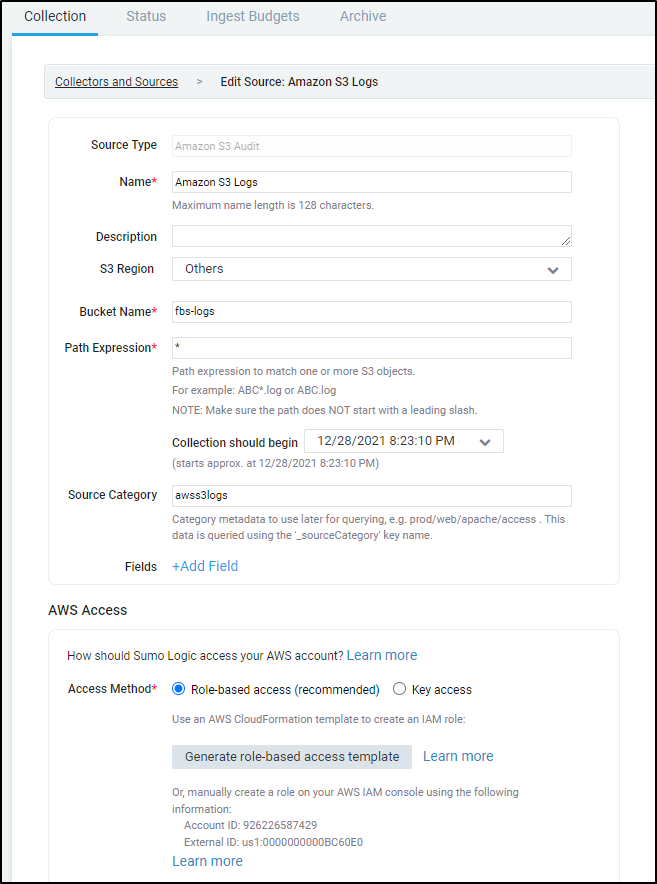
You’ll see for the bucket name I’m now using my “Logging” bucket for s3://fbs-logs with a POSIX * to match all things (including subfolders).
You’ll then want to click the “Generate role-based access template” to generate a proper IAM role. I then downloaded it for use in the AWS CloudFormation window. I had tweaked the “Resource:” block to include more buckets I might want to monitor. I prefer to use one shared role than having a role-per-bucket.
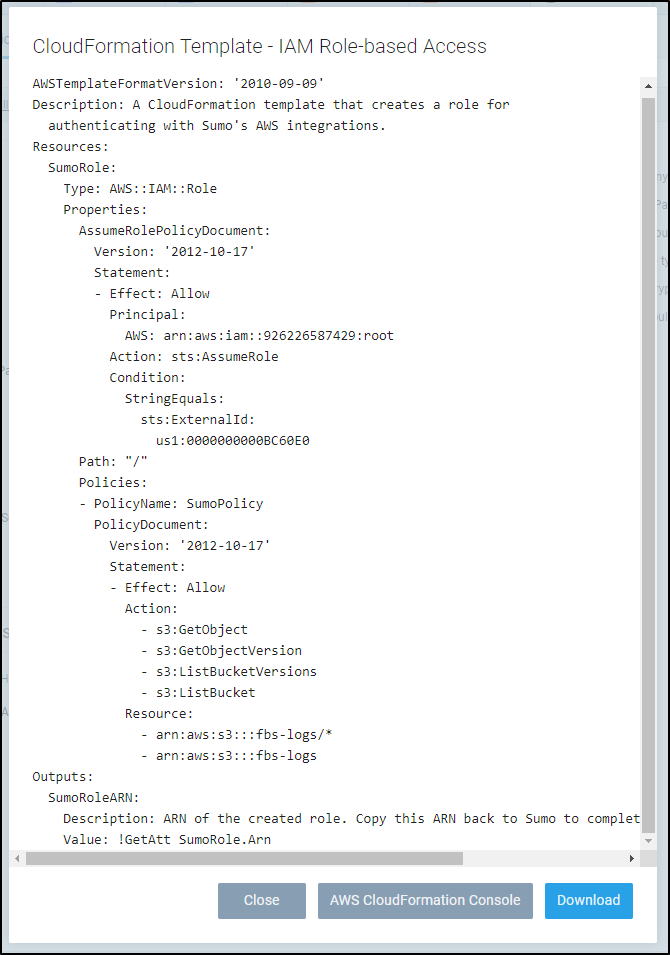
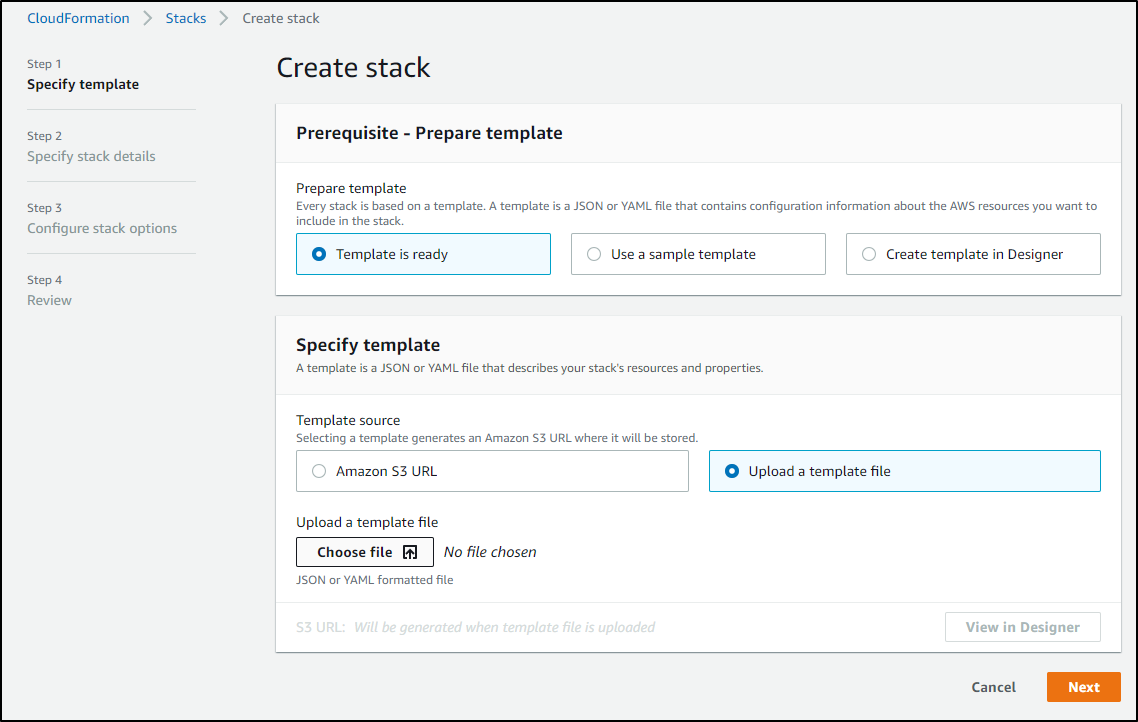
We can pick that downloaded JSON file in the Cloudformation Wizard
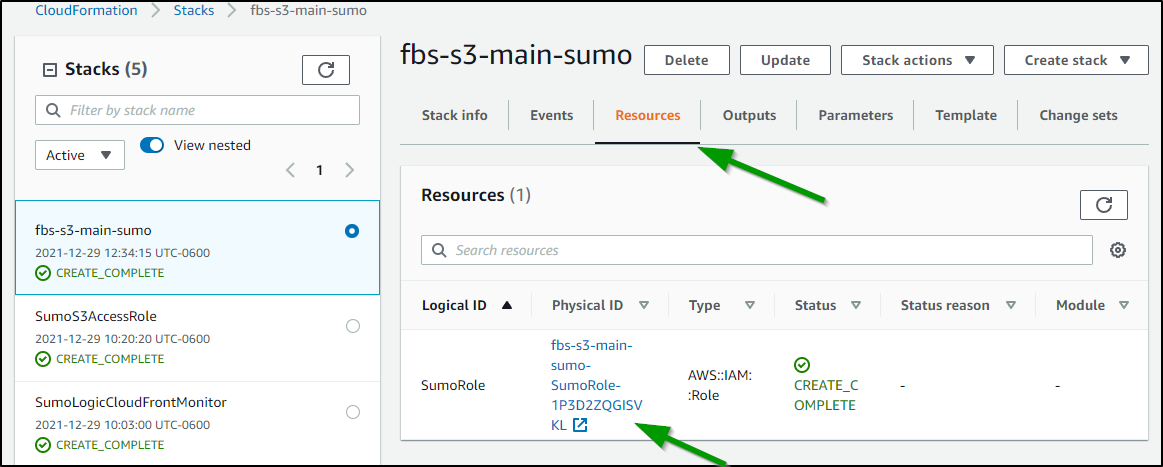
When the stack completes, we just need to get the IAM ARN (Amazon Resource Name). We can go to the Resources of the stack and clicking the ARN name
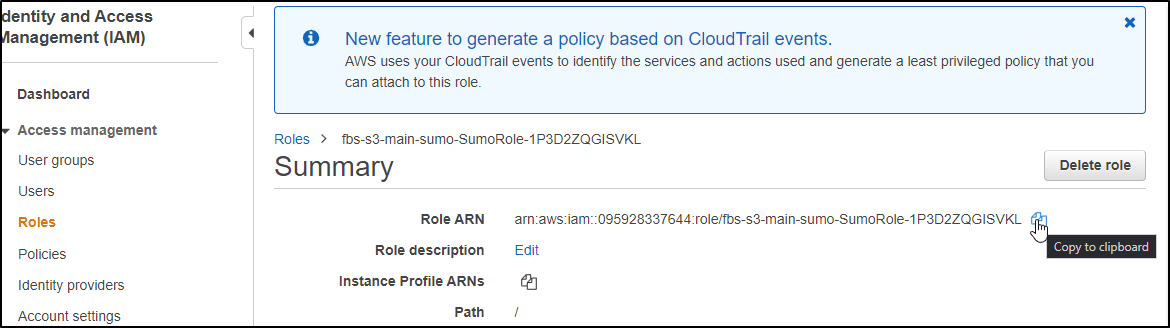
And from the IAM Role we can copy the ARN to the clipboard to use back in Sumo Logic
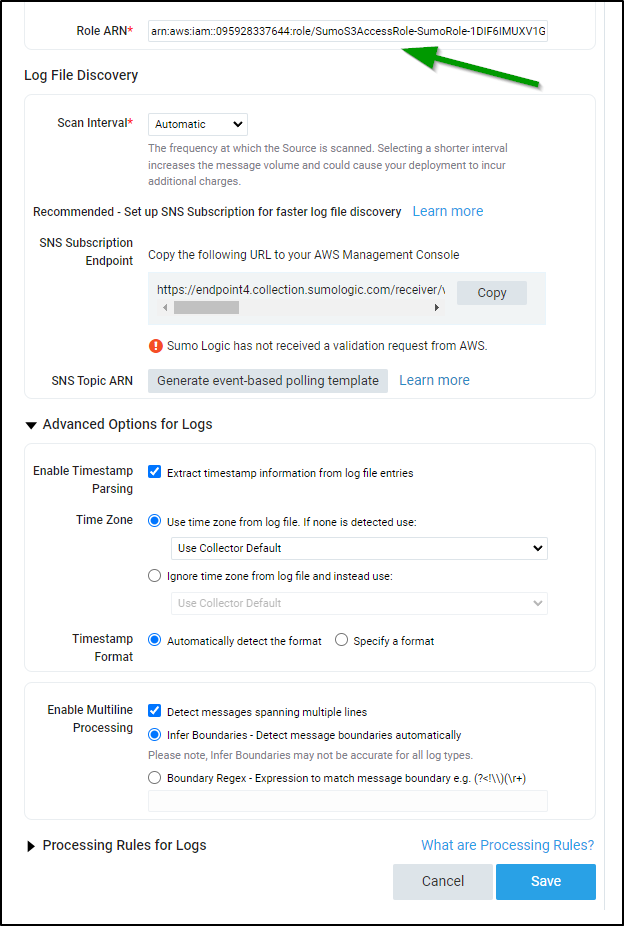
Setting up SNS
You can skip the SNS setup and just ingest per minute or every 5 minutes:
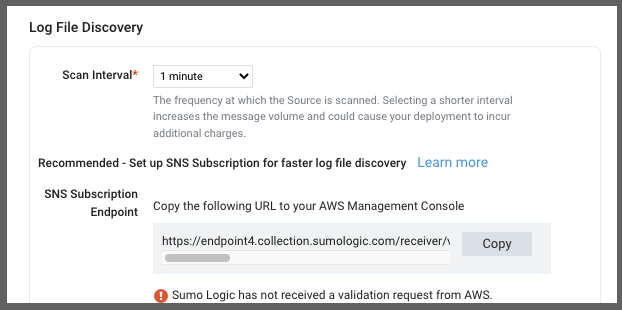
But if we wish to leave it as Automatic, we need to setup the SNS topic to let Sumo Logic know when to ingest.
We will use cloudformation to create the Topic and Subscription.
First, save the following (from here) to a file:
AWSTemplateFormatVersion: "2010-09-09"
Description: "A template to create a topic and a subscription with the endpoint of the Sumo Logic source"
Parameters:
 bucketName:
   Description: "The name of the bucket on which you want to configure your notification eg. myBucket"
   Type: String
 sumoLogicSourceUrl:
   Description: "The endpoint URL that you obtained from the S3 source created with Sumo Logic eg. https://sumo-endpoint-events.sumolog...r/v1/event/xyz"
   Type: String
Resources:
 sumoSNSTopic:
   Properties:
     TopicName: !Sub "SumoSNSTopic-${AWS::StackName}"
   Type: "AWS::SNS::Topic"

 sumoSNSSubcscription:
   Properties:
     TopicArn:
       Ref: sumoSNSTopic
     Endpoint:
       Ref: sumoLogicSourceUrl
     Protocol: https
     DeliveryPolicy:
       healthyRetryPolicy:
         numRetries: 40
         minDelayTarget: 10
         maxDelayTarget: 300
         numMinDelayRetries: 3
         numMaxDelayRetries: 5
         numNoDelayRetries: 0
         backoffFunction: exponential
   Type: "AWS::SNS::Subscription"

 sumoSNSpolicy:
   Properties:
     PolicyDocument:
       Id: SumoTopicPolicy
       Statement:
         -
           Action: "sns:Publish"
           Condition:
             StringEquals:
               aws:SourceAccount: !Ref "AWS::AccountId"
             ArnLike:
               aws:SourceArn: !Join ['', ['arn:aws:s3:*:*:', Ref: bucketName]]
           Effect: Allow
           Principal:
             AWS: "*"
           Resource:
             Ref: sumoSNSTopic
     Topics:
       -
         Ref: sumoSNSTopic
   Type: "AWS::SNS::TopicPolicy"
Then upload it in the CFN Stack wizard
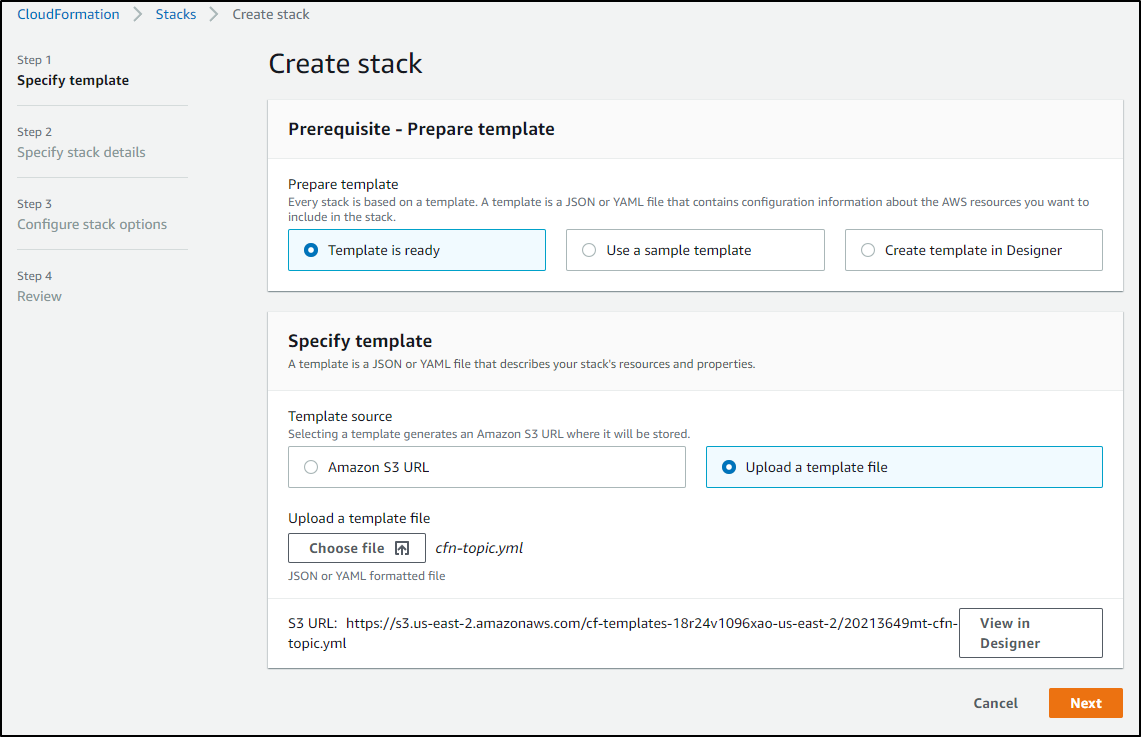
We will need the endpoint from the Sumo Wizard so copy that to your clipboard
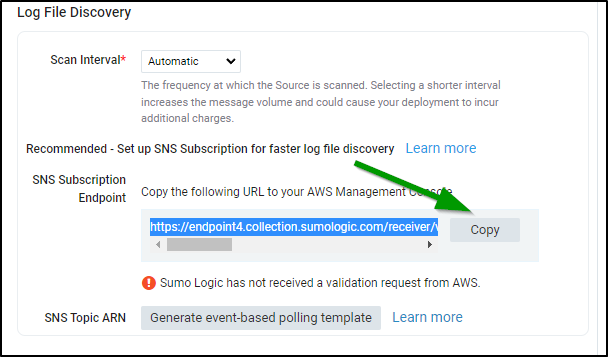
We can then use that in the next step of the Cloudformation Wizard (sumoLogicSourceUrl)
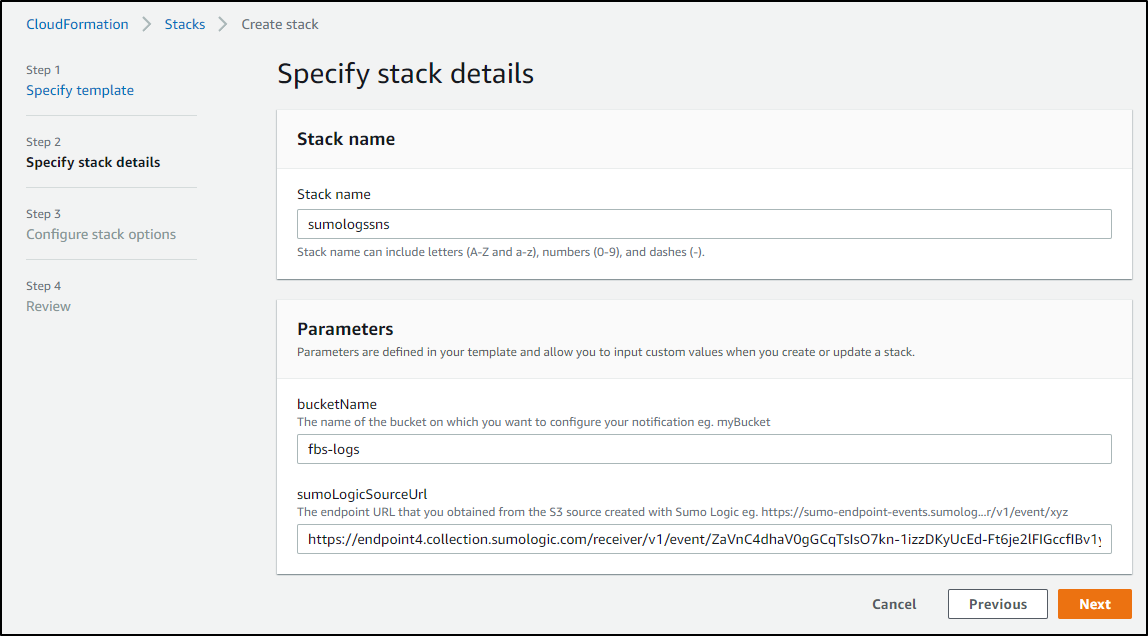
When the stack completes, we can see the resources that were created
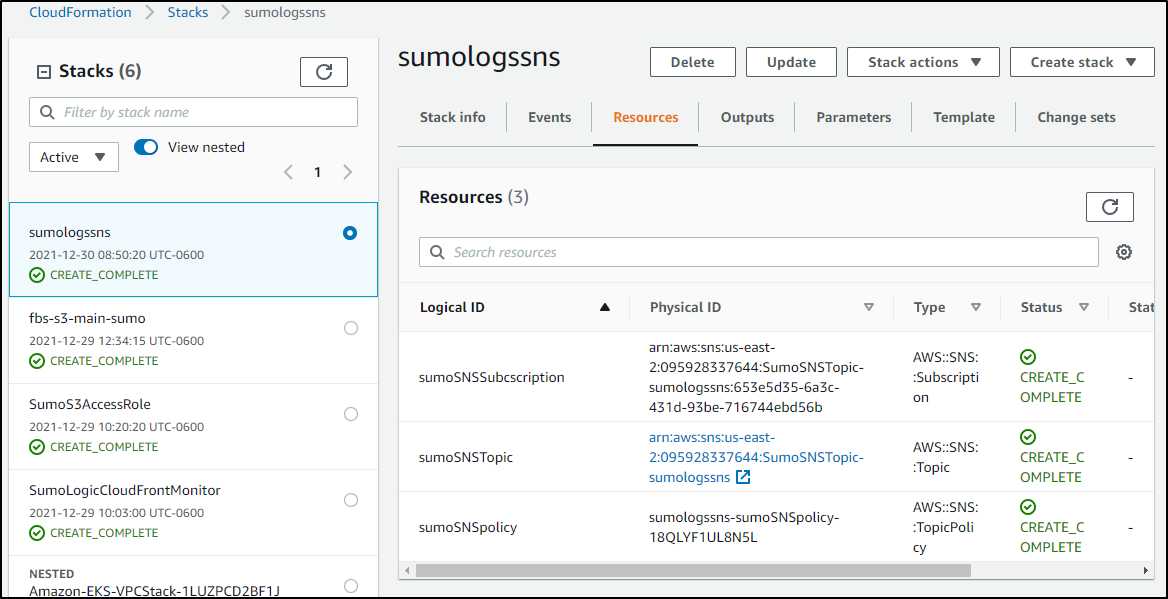
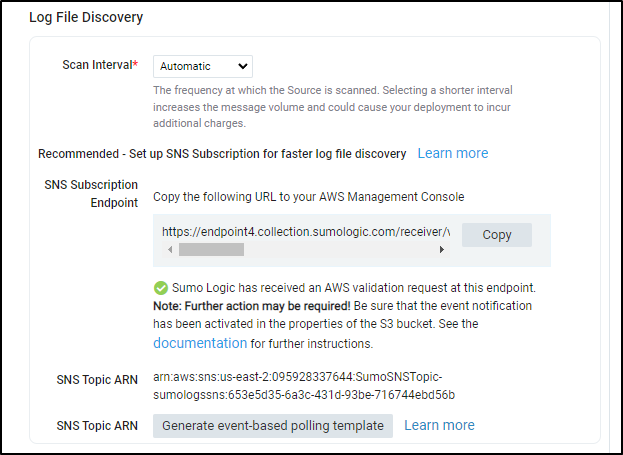
And if we refresh our Source in Sumo Logic we can see that the Topic is properly notifying Sumo Logic
Now that we have a collector, let’s add the AWS S3 Audit App under apps. Click “Add Integration” to start
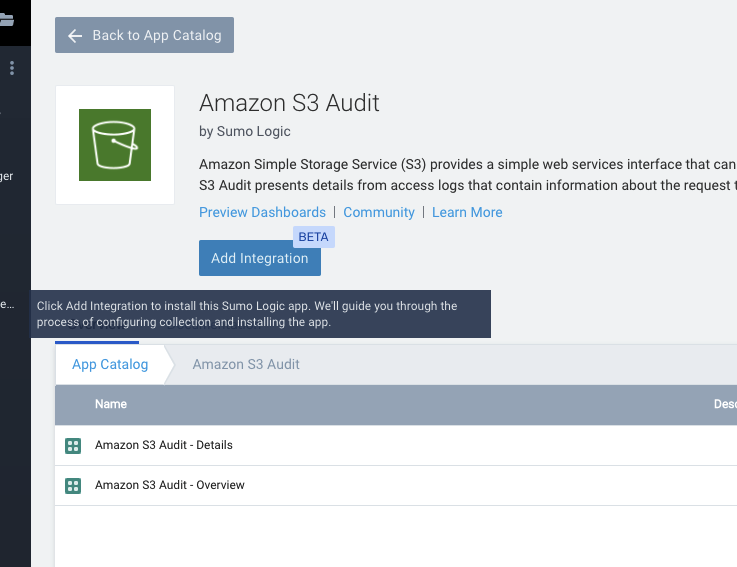
Here we want to “Use existing source”
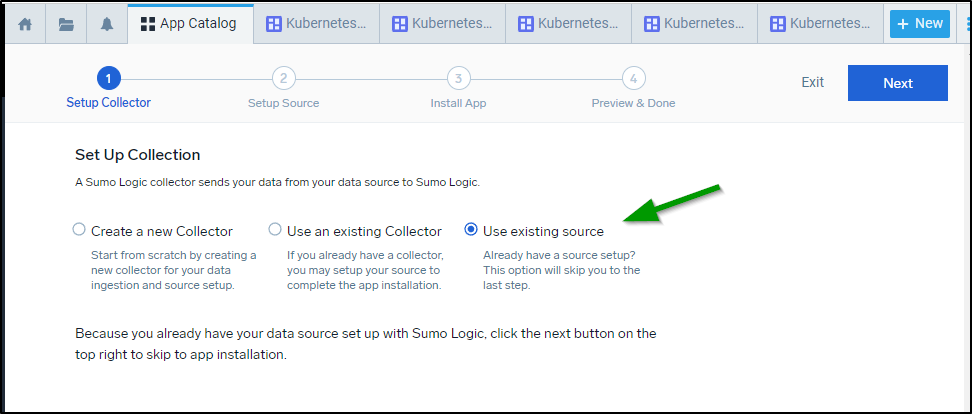
There I select my Existing source category
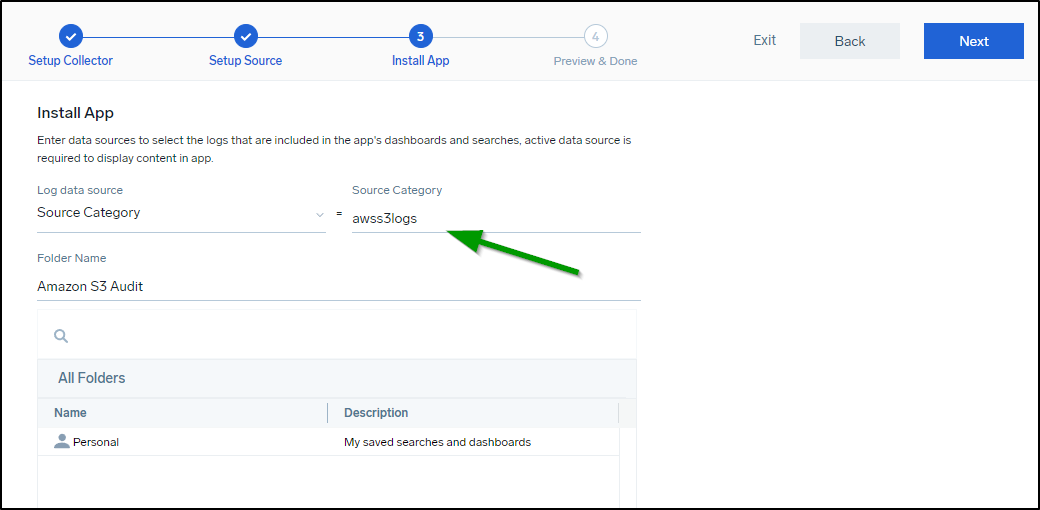
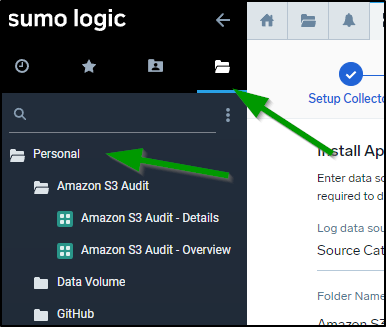
When done, I can then find these Dashboards (Apps) in my Personal folder:
Now the first time I did this, I errantly pointed to a bucket that had no logs. I saw ingested messages but my AWS S3 Audit window looked like this:
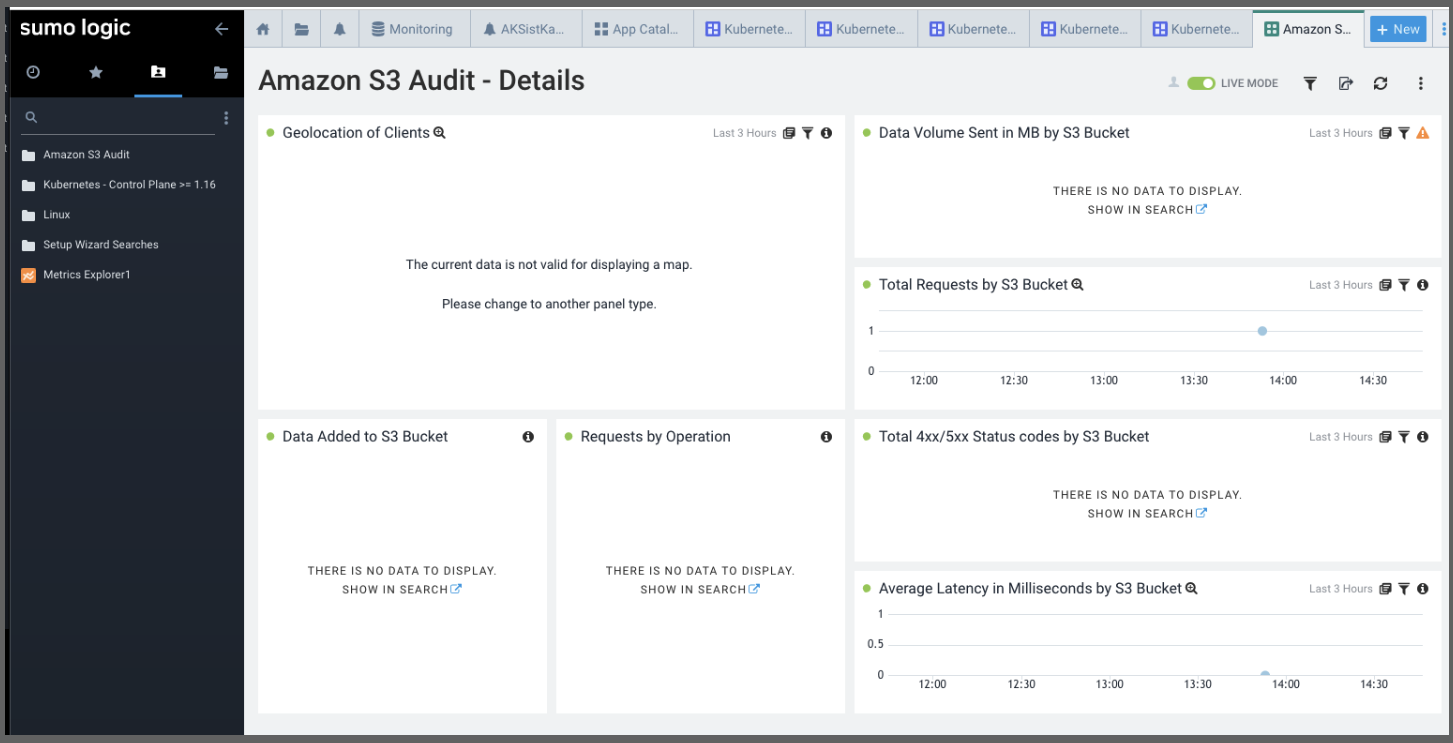
After a bit of sync time, we can see results:
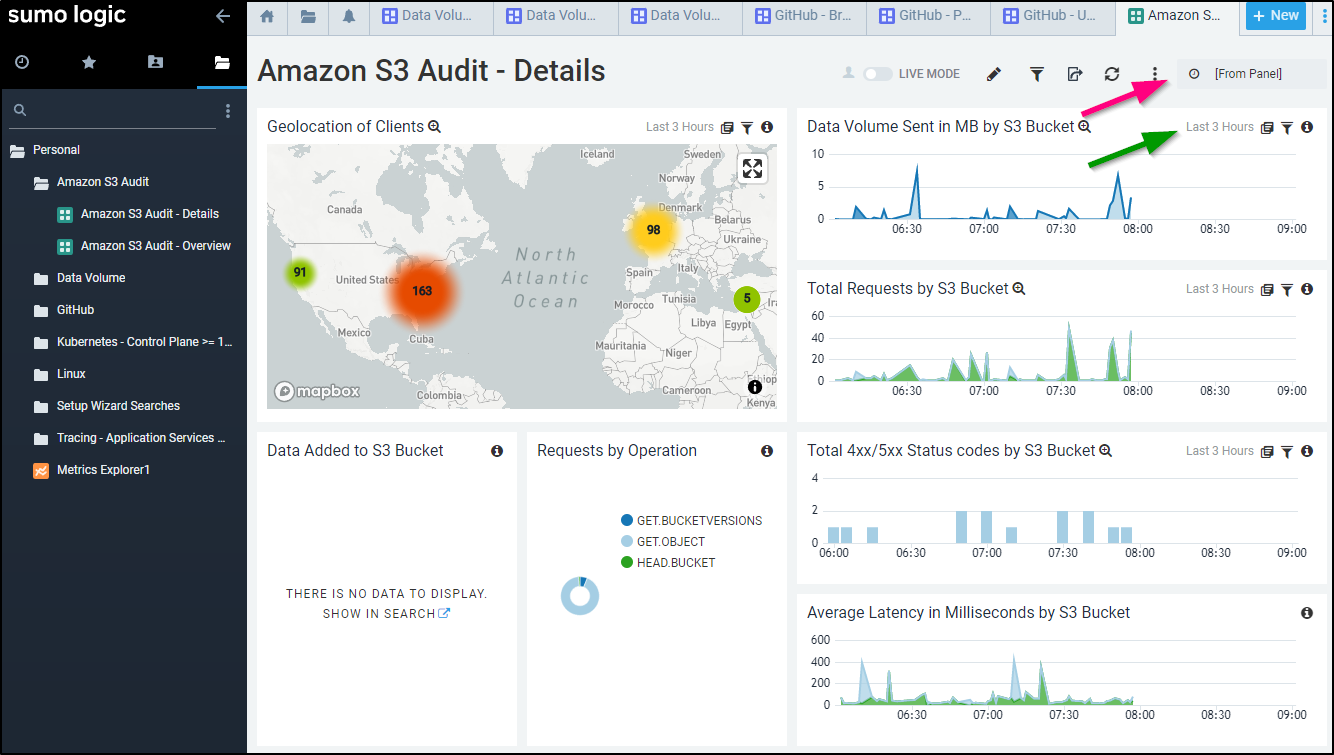
If you want to change the time window for just a single panel you can do so at the panel duration window (green arrow above). If you want to change all the panels at the same time, use the Dashboard time picker (red arrow above).
So here we can see 24 hours worth of data (though I only have collected for 12 hours)
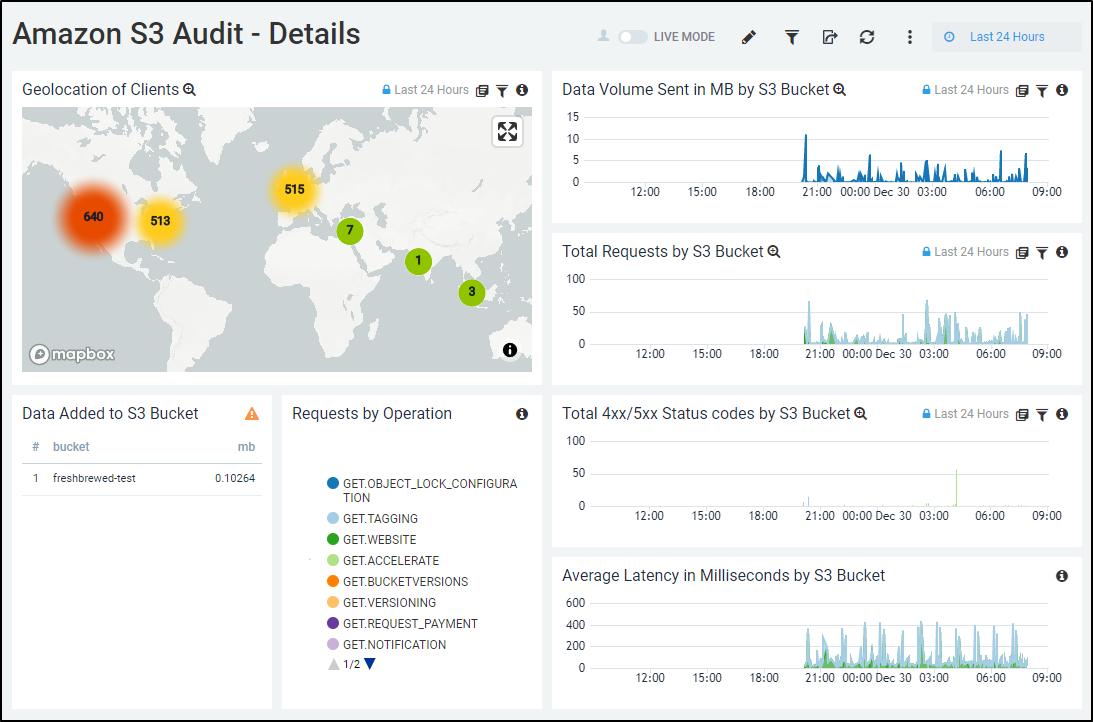
If I maximize the Mapbox window, we can zoom in for even more detailed results
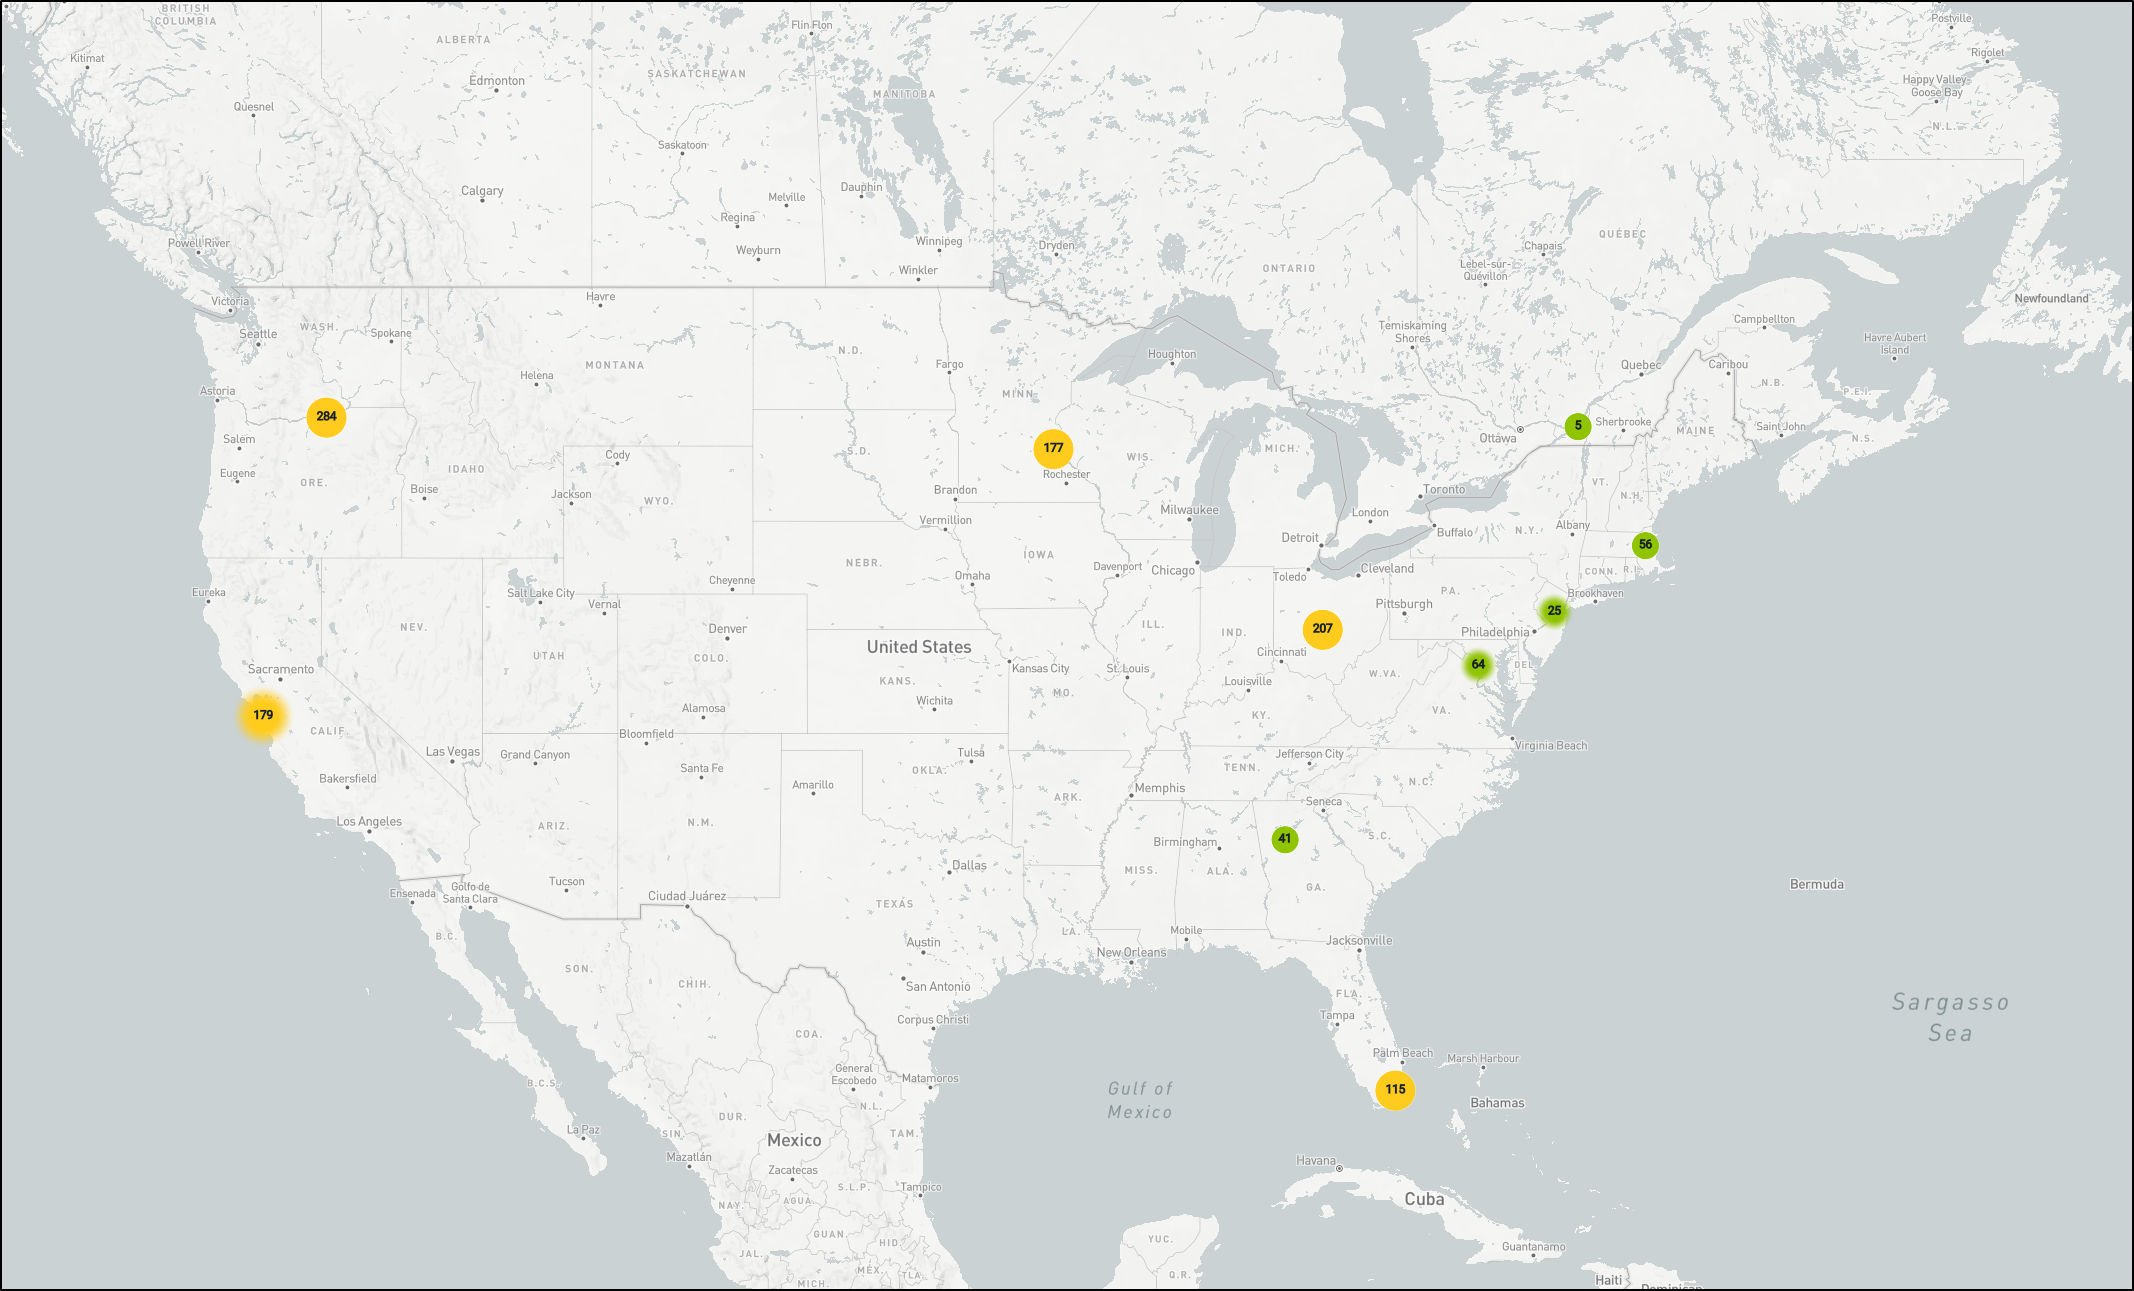
If we want a larger overview, we can use the “Amazon S3 Audit - Overview” Dashboard (App) instead
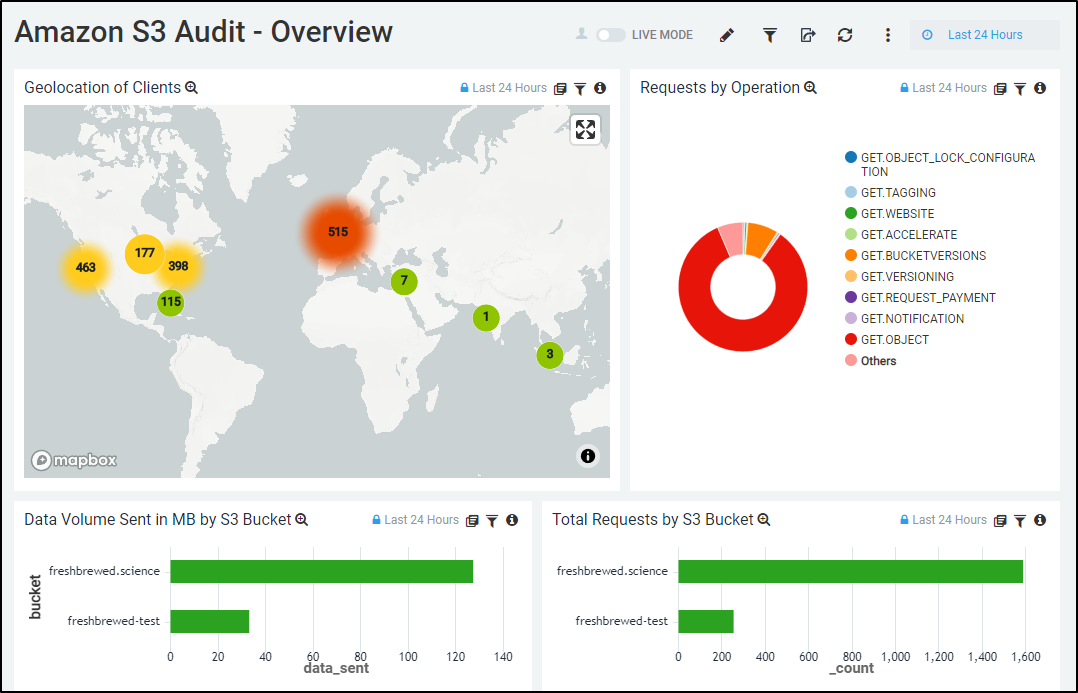
Here you can see the zooming feature of the Map Widget
Cloudfront
This is similar to S3. Since I want to avoid mixing my CloudFront bucket logs with S3 bucket logs, let’s create a bucket to store CloudFront logs:
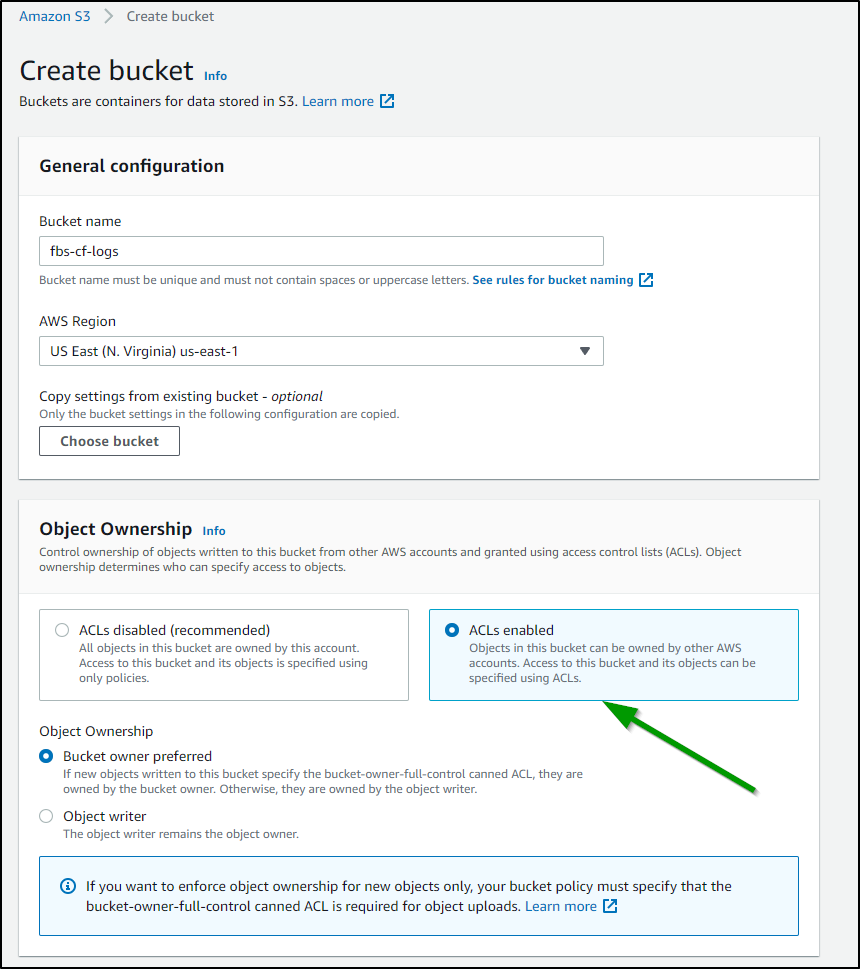
note: make sure to set “ACLs enabled”
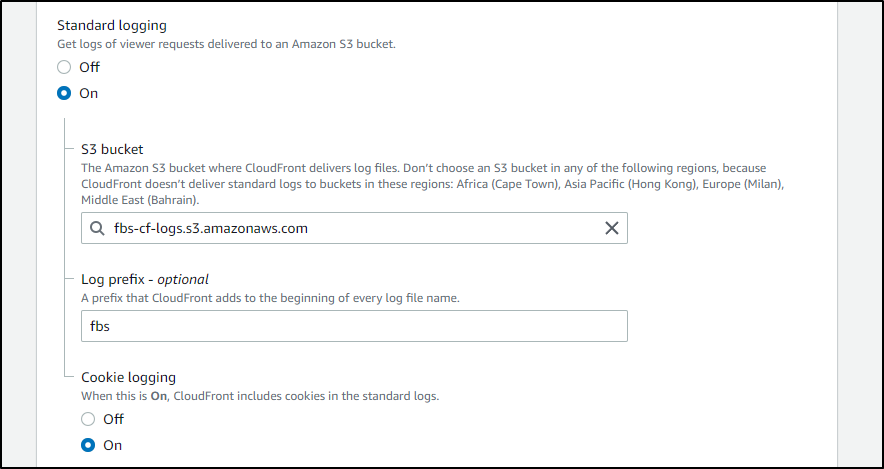
Next, go to your Cloudfront distribution and edit it. I then set the Standard Logging from Off to On and selected my bucket
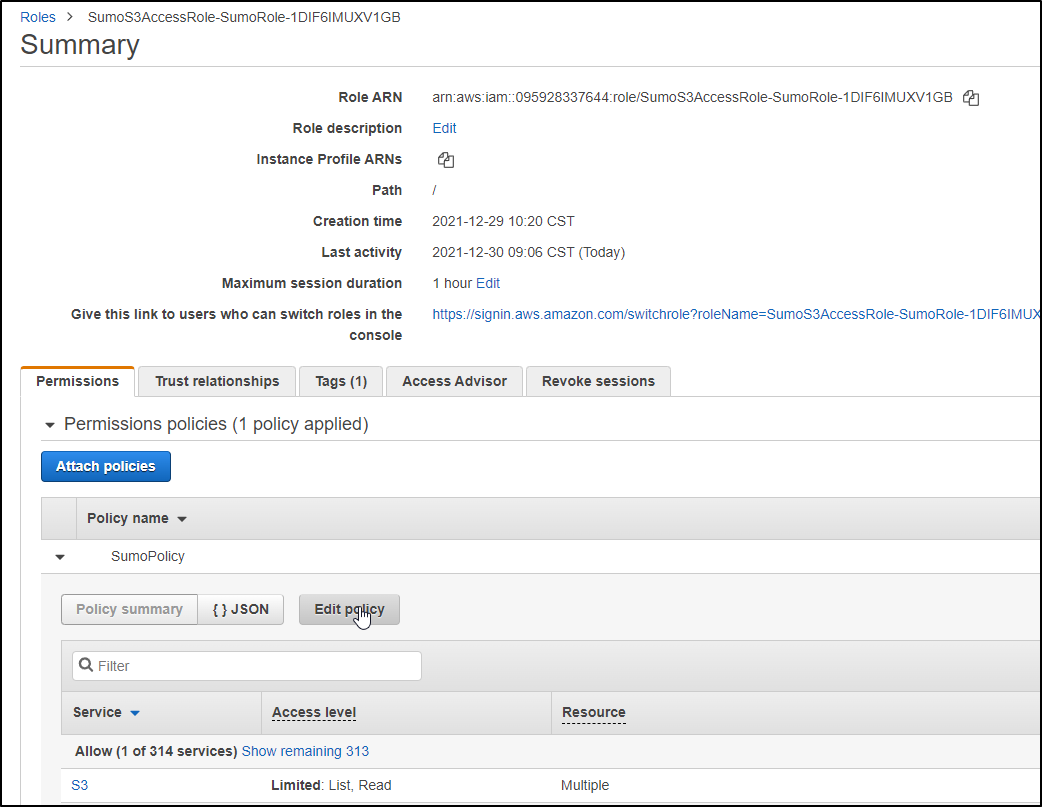
My next step is to update the SumoLogic Role to include this new bucket. Click Edit Policy on the Role in IAM
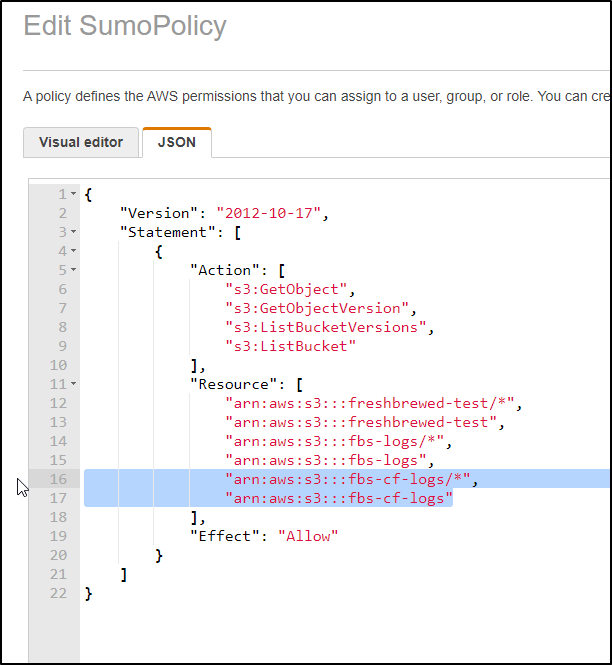
There I will add two lines for the new bucket and save
In Sumo Logic, we add a Hosted Collector then from the Manage Data page we can add a source
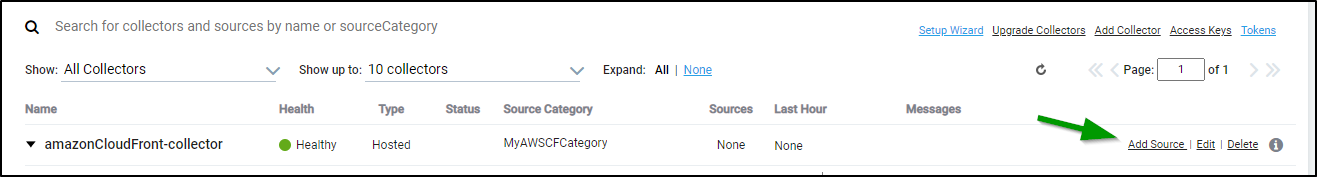
Next we select Amazon CloudFront for the source type and give it a name and pick our bucket. We can now also re-use the ARN we updated for the policy
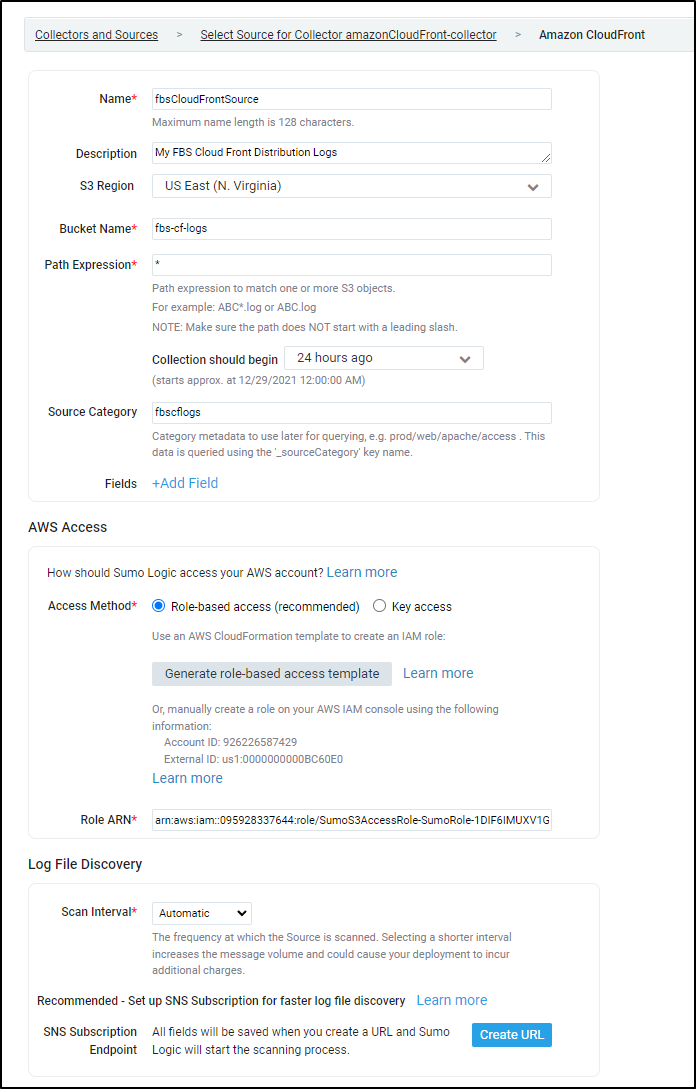
click “Create URL” to generate an SNS endpoint.
For our next step, we will use the SAME topic CFN YAML we used in the S3 steps prior.
we will need the endpoint from the Sumo Wizard so copy that to your clipboard
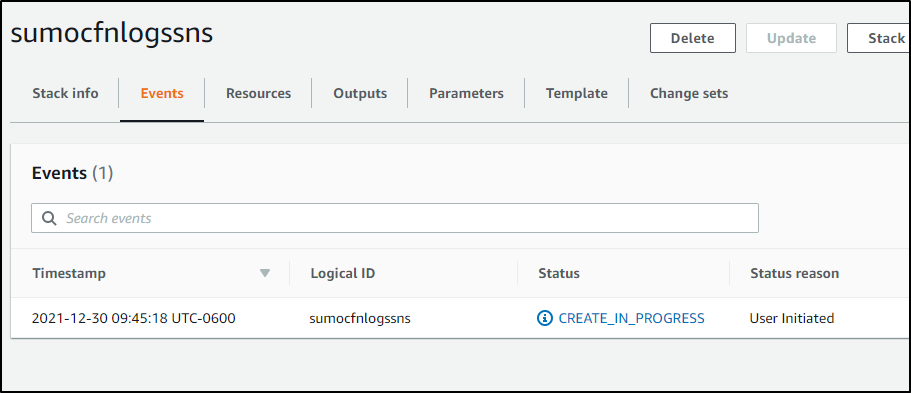
We’ll create the stack and wait for it to finish
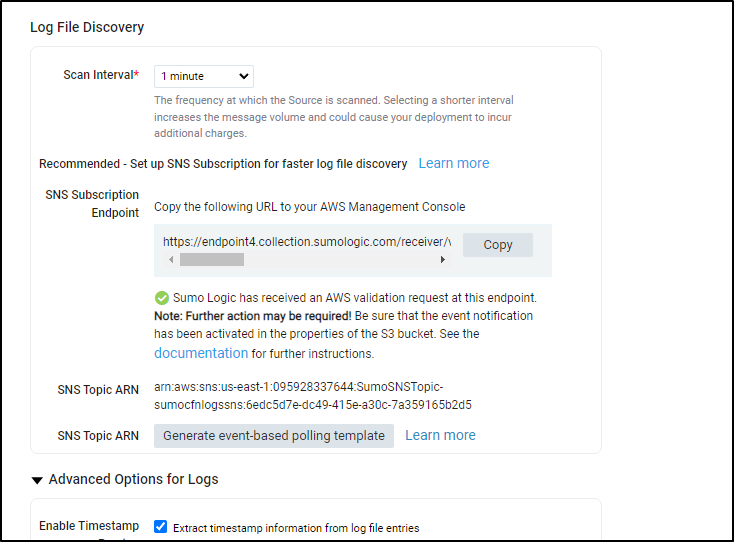
and it will make use refresh the Sumo window, which now shows us the SNS topic is sending proper updates
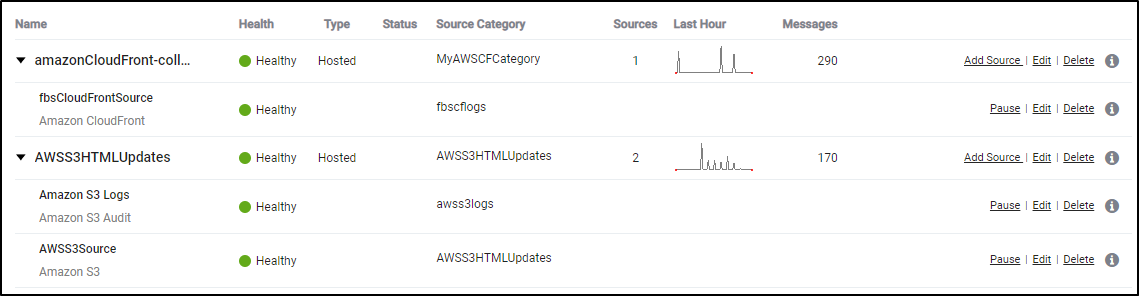
Once we see some processed messages in the Collector in our Manage Data/Collection window we can then move on to adding the CloudFormation App
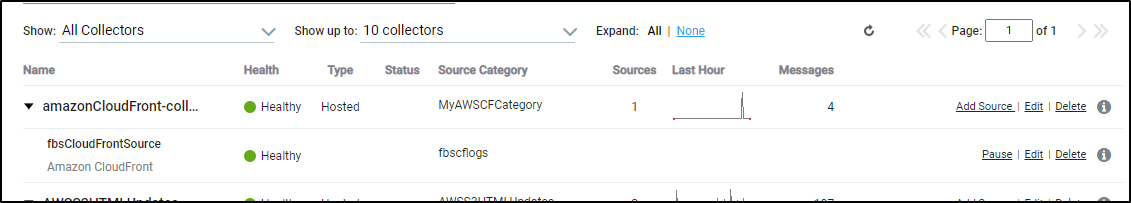
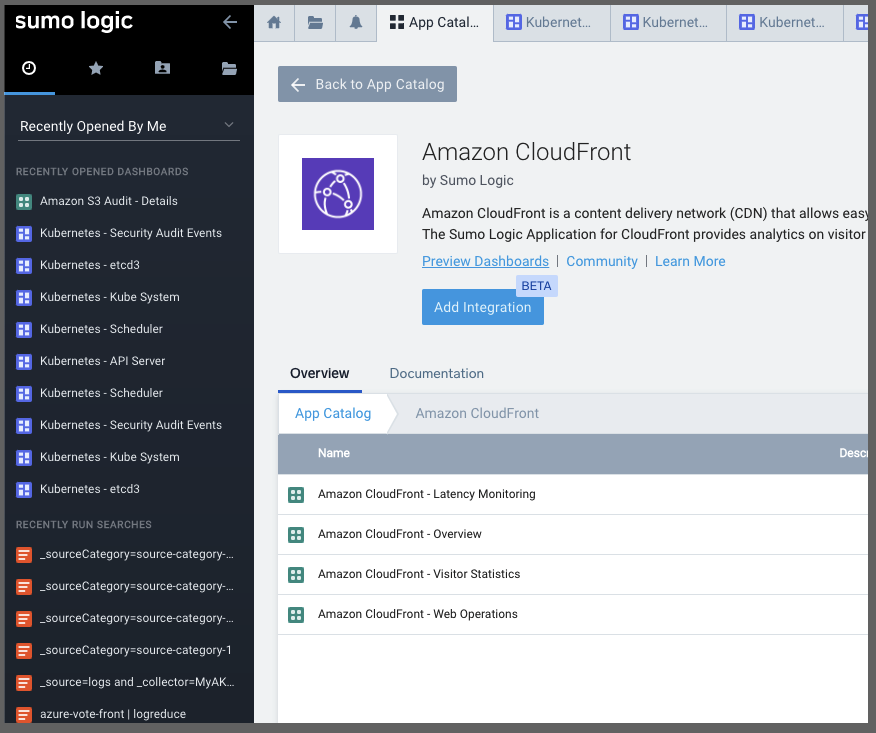
Add the AWS Cloudfront Integration via the Apps window
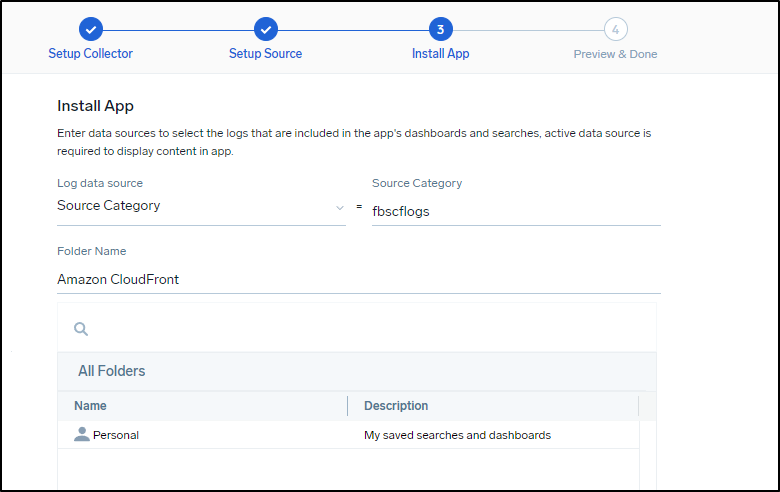
Like before, choose to use an existing source:
This time I’ll use the source category from the source
I can now see the last 24h of data in the CF Overview (though I’ve only captured several hours at this point)
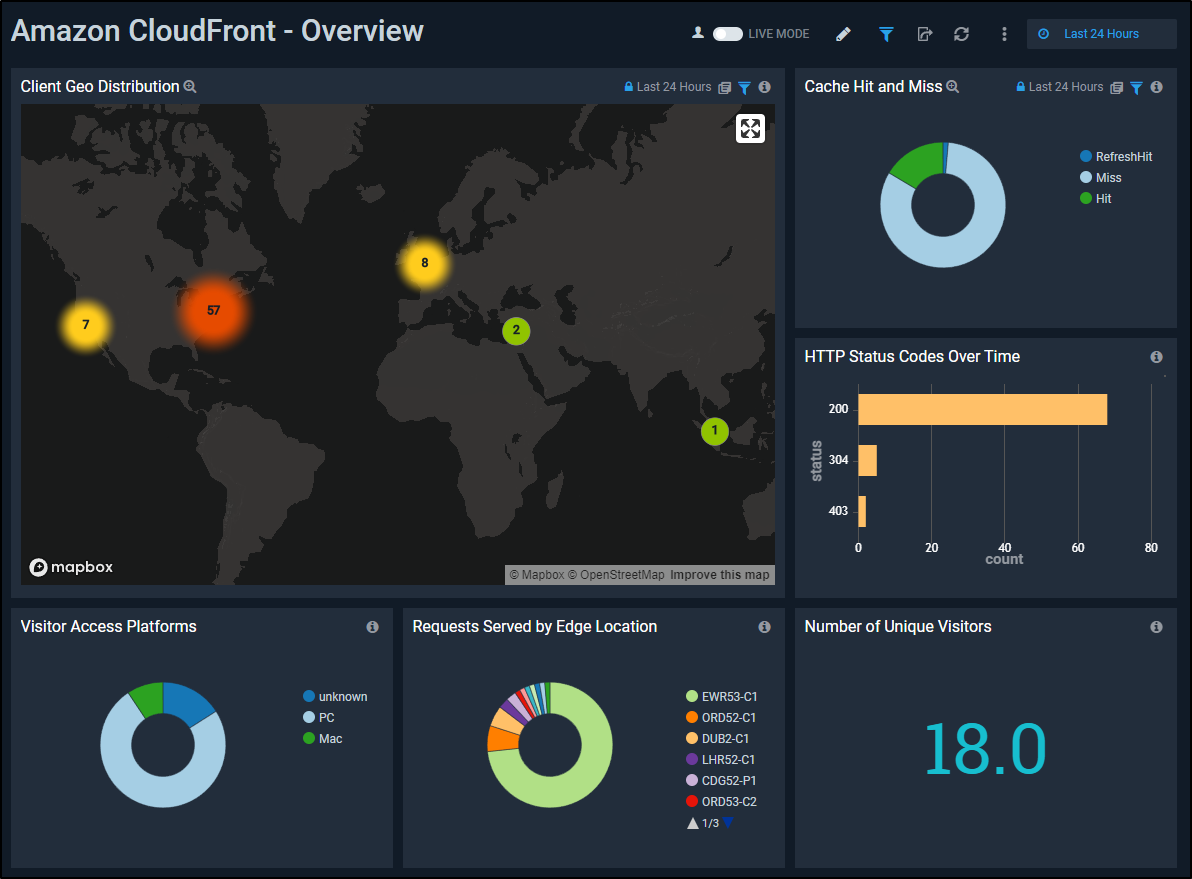
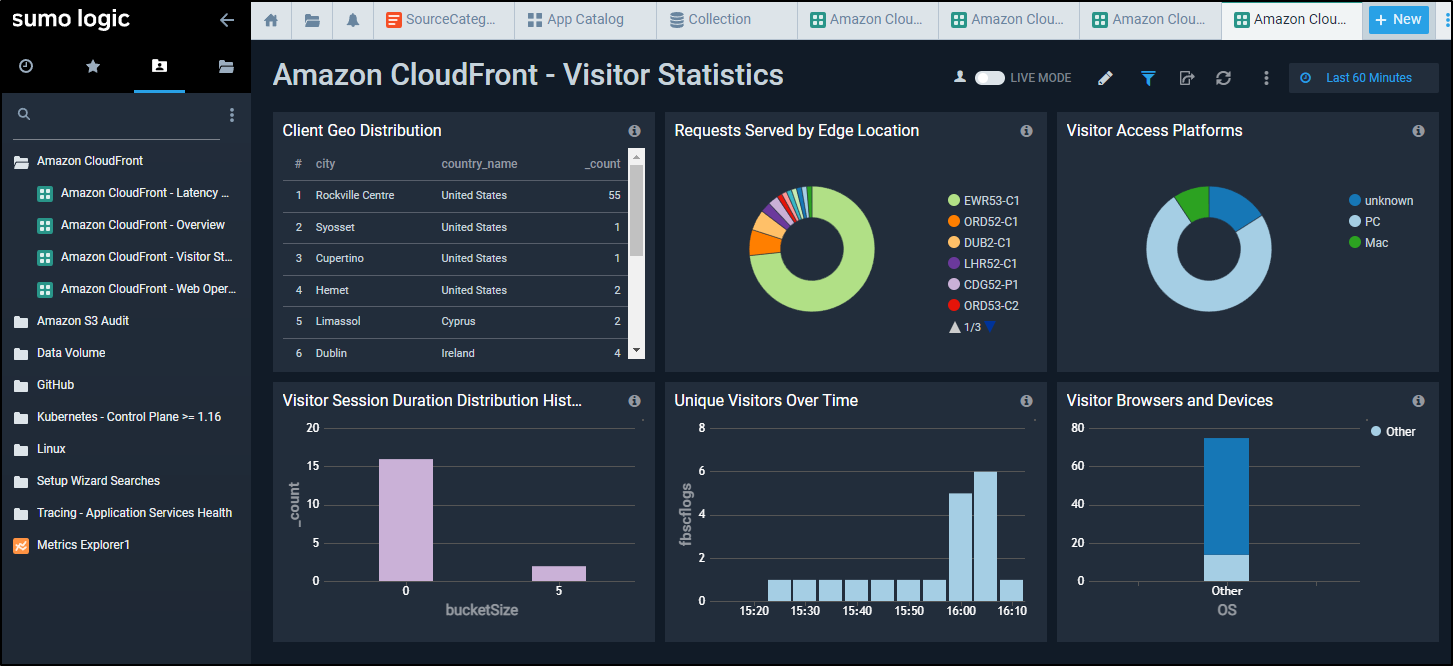
From Visitor Statistics, we can get great visualizations based on the parsed Cloudfront logs on where our visitors come from, when and using what kind of host and browser.
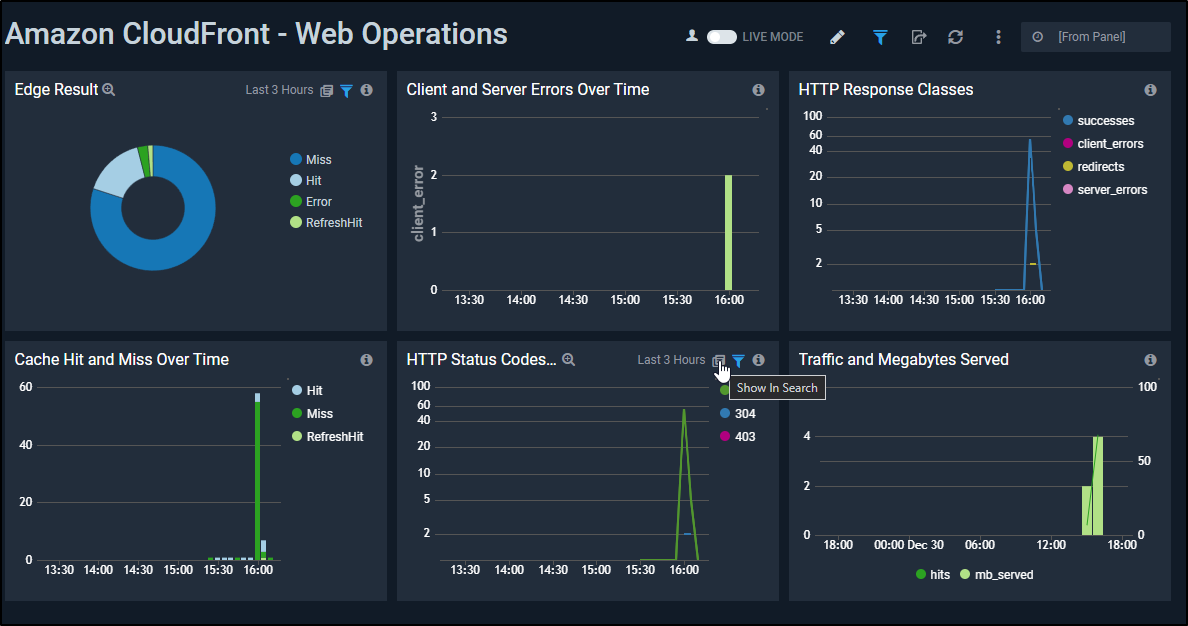
Web Operations breaks down the performance and usage of the cache showing me how much traffic is served and how much came from the cache.
I should point out a mistake I made the first time through. I had errantly used the S3 bucket containing the website itself. IN looking at the logs I saw only a few “visitors”
Yet the logs were full (I didn’t yet realize it was showing me actual webpages not log files)
There was a massive amount of ingested data (two years worth of posts with many versions).
Moreover, this consumed up most of my allotted ingestion bandwidth.
So let that be a bit of a word of caution. With all the stats I have so far shown, I’ve really only pulled a few hundred messages from the last day:
Azure Events
By now we should be pretty comfortable adding a basic HTTP collector. Just add a “Hosted Collector” then an HTTP source. These steps are generally covered in the Collect Logs from Azure Monitor guide.

Next, we need the ARM template from https://s3.amazonaws.com/appdev-cloudformation-templates/azuredeploy_logs.json (or see below)
{
    "$schema": "https://schema.management.azure.com/schemas/2015-01-01/deploymentTemplate.json#",
    "contentVersion": "1.0.0.0",
    "parameters": {
        "sites_SumoAzureLogsFunctionApp_name": {
            "defaultValue": "[concat('SumoAzureLogsFunctionApp', uniqueString(resourceGroup().id))]",
            "type": "String"
        },
        "storageAccounts_SumoAzureFailedMsg_name": {
            "defaultValue": "[concat('sumofailmsg',uniqueString(resourceGroup().id))]",
            "type": "String"
        },
        "namespaces_SumoAzureLogs_name": {
            "defaultValue": "[concat('SumoAzureLogsNamespace', uniqueString(resourceGroup().id))]",
            "type": "String"
        },
        "serverfarms_SumoAzureLogsAppServicePlan_name": {
            "defaultValue": "[concat('SumoAzureLogsAppServicePlan', uniqueString(resourceGroup().id))]",
            "type": "String"
        },
        "storageAccounts_SumoAzureAppLogs_name": {
            "defaultValue": "[concat('sumoapplogs', uniqueString(resourceGroup().id))]",
            "type": "String"
        },
        "eventhubs_insights_operational_logs_name": {
            "defaultValue": "insights-operational-logs",
            "type": "String"
        },
        "AuthorizationRules_RootManageSharedAccessKey_name": {
            "defaultValue": "RootManageSharedAccessKey",
            "type": "String"
        },
        "consumergroups_name": {
            "defaultValue": "$Default",
            "type": "String"
        },
        "sourceCodeRepositoryURL": {
            "defaultValue":"https://github.com/SumoLogic/sumologic-azure-function",
            "type": "String"
        },
        "sourceCodeBranch": {
            "defaultValue":"master",
            "type": "String"
        },
        "sourceCodeManualIntegration": {
            "defaultValue": "true",
            "type": "String"
        },
        "SumoEndpointURL": {
            "defaultValue": "Enter HTTP Source URL",
            "type": "String"
        },
        "appInsightsName": {
            "defaultValue": "[concat('SumoAzureLogsAppInsights', uniqueString(resourceGroup().id))]",
            "type": "String"
        }
    },
    "variables": {},
    "resources": [
        {
            "type": "Microsoft.EventHub/namespaces",
            "sku": {
                "name": "Standard",
                "tier": "Standard",
                "capacity": 1
            },
            "name": "[parameters('namespaces_SumoAzureLogs_name')]",
            "apiVersion": "2017-04-01",
            "location": "[resourceGroup().location]",
            "tags": {},
            "scale": null,
            "properties": {
                "isAutoInflateEnabled": true,
                "maximumThroughputUnits": 20,
                "provisioningState": "Succeeded",
                "metricId": "[concat('c088dc46-d692-42ad-a4b6-9a542d28ad2a:sumoazurelogs', parameters('namespaces_SumoAzureLogs_name'))]",
                "createdAt": "2018-01-17T09:33:37.26Z",
                "updatedAt": "2018-01-17T09:34:00.52Z",
                "serviceBusEndpoint": "[concat('https://', parameters('namespaces_SumoAzureLogs_name'),'.servicebus.windows.net:443/')]"
            },
            "dependsOn": []
        },
        {
            "type": "Microsoft.Storage/storageAccounts",
            "sku": {
                "name": "Standard_RAGRS",
                "tier": "Standard"
            },
            "kind": "Storage",
            "name": "[parameters('storageAccounts_SumoAzureFailedMsg_name')]",
            "apiVersion": "2017-06-01",
            "location": "[resourceGroup().location]",
            "scale": null,
            "properties": {
                "supportsHttpsTrafficOnly": false,
                "encryption": {
                    "services": {
                        "file": {
                            "enabled": true
                        },
                        "blob": {
                            "enabled": true
                        }
                    },
                    "keySource": "Microsoft.Storage"
                }
            },
            "dependsOn": []
        },
        {
            "type": "Microsoft.Storage/storageAccounts",
            "sku": {
                "name": "Standard_LRS",
                "tier": "Standard"
            },
            "kind": "Storage",
            "name": "[parameters('storageAccounts_SumoAzureAppLogs_name')]",
            "apiVersion": "2017-06-01",
            "location": "[resourceGroup().location]",
            "scale": null,
            "properties": {
                "encryption": {
                    "services": {
                        "file": {
                            "enabled": true
                        },
                        "blob": {
                            "enabled": true
                        }
                    },
                    "keySource": "Microsoft.Storage"
                }
            },
            "dependsOn": []
        },
        {
            "type": "Microsoft.Web/serverfarms",
            "sku": {
                "name": "Y1",
                "tier": "Dynamic",
                "size": "Y1",
                "family": "Y",
                "capacity": 0
            },
            "kind": "functionapp",
            "name": "[parameters('serverfarms_SumoAzureLogsAppServicePlan_name')]",
            "apiVersion": "2016-09-01",
            "location": "[resourceGroup().location]",
            "scale": null,
            "properties": {
                "name": "[parameters('serverfarms_SumoAzureLogsAppServicePlan_name')]",
                "workerTierName": null,
                "adminSiteName": null,
                "hostingEnvironmentProfile": null,
                "perSiteScaling": false,
                "reserved": false,
                "targetWorkerCount": 0,
                "targetWorkerSizeId": 0
            },
            "dependsOn": []
        },
        {
            "type": "Microsoft.Web/sites",
            "kind": "functionapp",
            "name": "[parameters('sites_SumoAzureLogsFunctionApp_name')]",
            "apiVersion": "2016-08-01",
            "location": "[resourceGroup().location]",
            "scale": null,
            "properties": {
                "enabled": true,
                "serverFarmId": "[resourceId('Microsoft.Web/serverfarms', parameters('serverfarms_SumoAzureLogsAppServicePlan_name'))]",
                "reserved": false,
                "siteConfig": {
                    "appSettings": [
                        { "name": "FUNCTIONS_EXTENSION_VERSION", "value": "~1" },
                        { "name": "Project", "value": "EventHubs/target/logs_build/" },
                        {"name": "AzureWebJobsStorage", "value" : "[concat('DefaultEndpointsProtocol=https;AccountName=', parameters('storageAccounts_SumoAzureAppLogs_name'), ';AccountKey=', listKeys(resourceId('Microsoft.Storage/storageAccounts', parameters('storageAccounts_SumoAzureAppLogs_name')),'2015-05-01-preview').key1)]"},

                        {"name": "SumoLogsEndpoint", "value" : "[parameters('SumoEndpointURL')]"},
                        {"name": "AzureEventHubConnectionString", "value" : "[listkeys(resourceId('Microsoft.EventHub/namespaces/authorizationRules', parameters('namespaces_SumoAzureLogs_name'),parameters('AuthorizationRules_RootManageSharedAccessKey_name')), '2017-04-01').primaryConnectionString]"},
                        {
                            "name": "APPINSIGHTS_INSTRUMENTATIONKEY",
                            "value": "[reference(resourceId('microsoft.insights/components/', parameters('appInsightsName')), '2015-05-01').InstrumentationKey]"
                        },
                        {"name": "WEBSITE_CONTENTAZUREFILECONNECTIONSTRING", "value" : "[concat('DefaultEndpointsProtocol=https;AccountName=', parameters('storageAccounts_SumoAzureAppLogs_name'), ';AccountKey=', listKeys(resourceId('Microsoft.Storage/storageAccounts', parameters('storageAccounts_SumoAzureAppLogs_name')),'2015-05-01-preview').key1)]"},
                        { "name": "WEBSITE_CONTENTSHARE", "value": "[toLower(parameters('sites_SumoAzureLogsFunctionApp_name'))]" },
                        { "name": "FUNCTION_APP_EDIT_MODE", "value": "readwrite"},
                        {"name": "StorageConnectionString", "value" : "[concat('DefaultEndpointsProtocol=https;AccountName=', parameters('storageAccounts_SumoAzureFailedMsg_name'), ';AccountKey=', listKeys(resourceId('Microsoft.Storage/storageAccounts', parameters('storageAccounts_SumoAzureFailedMsg_name')),'2015-05-01-preview').key1,';EndpointSuffix=core.windows.net')]"}

                    ]
                }
            },
            "resources": [
             {
                  "apiVersion": "2015-08-01",
                  "name": "web",
                  "type": "sourcecontrols",
                  "dependsOn": [
                    "[resourceId('Microsoft.Web/sites/', parameters('sites_SumoAzureLogsFunctionApp_name'))]"
                  ],
                  "properties": {
                    "RepoUrl": "[parameters('sourceCodeRepositoryURL')]",
                    "branch": "[parameters('sourceCodeBranch')]",
                    "IsManualIntegration": "[parameters('sourceCodeManualIntegration')]"
                  }
             }
            ],
            "dependsOn": [
                "[resourceId('Microsoft.Web/serverfarms', parameters('serverfarms_SumoAzureLogsAppServicePlan_name'))]",
                "[resourceId('Microsoft.Storage/storageAccounts', parameters('storageAccounts_SumoAzureAppLogs_name'))]",
                "[concat('Microsoft.EventHub/namespaces/', parameters('namespaces_SumoAzureLogs_name'))]",
                "[resourceId('Microsoft.Insights/components', parameters('appInsightsName'))]"
            ]
        },
        {
            "type": "Microsoft.EventHub/namespaces/AuthorizationRules",
            "name": "[concat(parameters('namespaces_SumoAzureLogs_name'), '/', parameters('AuthorizationRules_RootManageSharedAccessKey_name'))]",
            "apiVersion": "2017-04-01",
            "location": "[resourceGroup().location]",
            "scale": null,
            "properties": {
                "rights": [
                    "Listen",
                    "Manage",
                    "Send"
                ]
            },
            "dependsOn": [
                "[resourceId('Microsoft.EventHub/namespaces', parameters('namespaces_SumoAzureLogs_name'))]"
            ]
        },
        {
            "type": "Microsoft.EventHub/namespaces/eventhubs",
            "name": "[concat(parameters('namespaces_SumoAzureLogs_name'), '/', parameters('eventhubs_insights_operational_logs_name'))]",
            "apiVersion": "2017-04-01",
            "location": "[resourceGroup().location]",
            "scale": null,
            "properties": {
                "messageRetentionInDays": 7,
                "partitionCount": 4,
                "status": "Active",
                "createdAt": "2018-01-17T10:00:54.703",
                "updatedAt": "2018-01-17T10:01:02.42",
                "partitionIds": [
                    "0",
                    "1",
                    "2",
                    "3"
                ]
            },
            "dependsOn": [
                "[resourceId('Microsoft.EventHub/namespaces', parameters('namespaces_SumoAzureLogs_name'))]"
            ]
        },
        {
            "type": "Microsoft.EventHub/namespaces/eventhubs/consumergroups",
            "name": "[concat(parameters('namespaces_SumoAzureLogs_name'), '/', parameters('eventhubs_insights_operational_logs_name'), '/', parameters('consumergroups_name'))]",
            "apiVersion": "2017-04-01",
            "location": "[resourceGroup().location]",
            "scale": null,
            "properties": {
                "createdAt": "2018-01-17T10:01:00.7812081",
                "updatedAt": "2018-01-17T10:01:00.7812081"
            },
            "dependsOn": [
                "[resourceId('Microsoft.EventHub/namespaces', parameters('namespaces_SumoAzureLogs_name'))]",
                "[resourceId('Microsoft.EventHub/namespaces/eventhubs', parameters('namespaces_SumoAzureLogs_name'), parameters('eventhubs_insights_operational_logs_name'))]"
            ]
        },
        {
          "name": "[parameters('appInsightsName')]",
          "type": "Microsoft.Insights/components",
          "apiVersion": "2015-05-01",
          "location": "[resourceGroup().location]",
          "kind": "web",
          "properties": {
            "Application_Type": "web",
           "applicationId": "[parameters('appInsightsName')]"
          }
        }
    ]
}
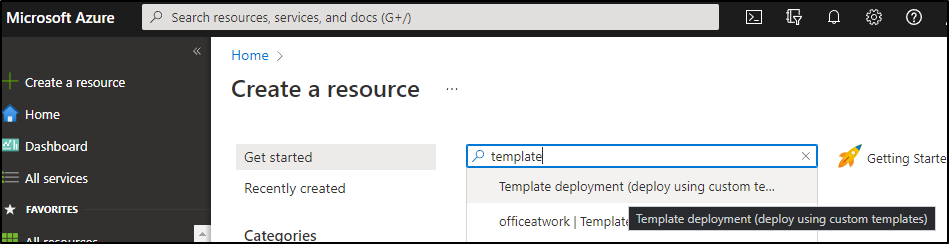
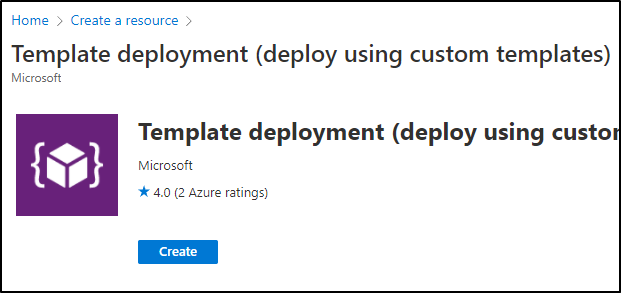
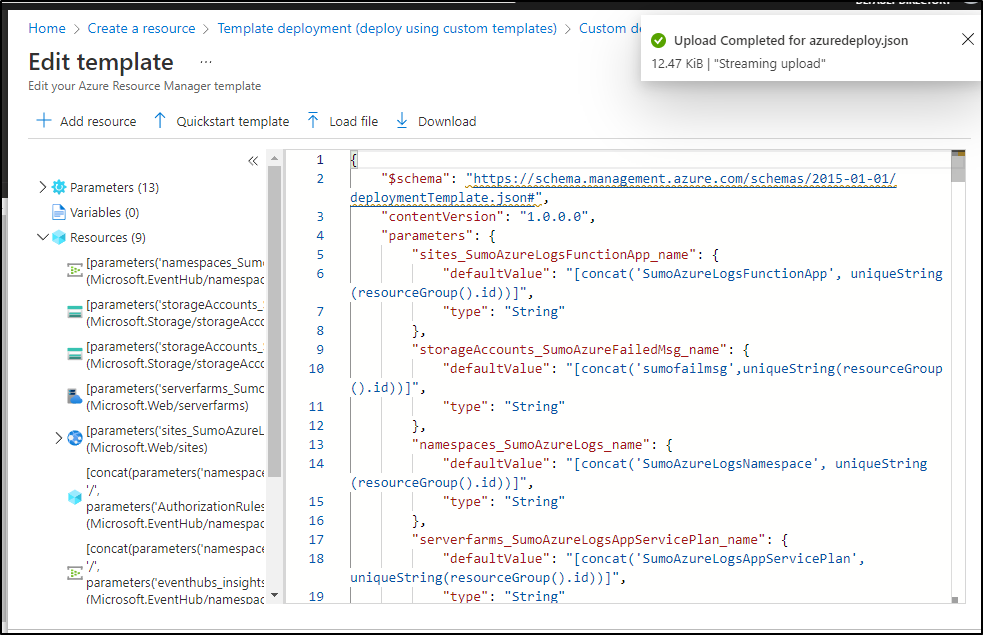
In the Azure Portal, Create a Resource and choose Template Deployment
Click create
We can “edit the template”, then choose to “Load file”
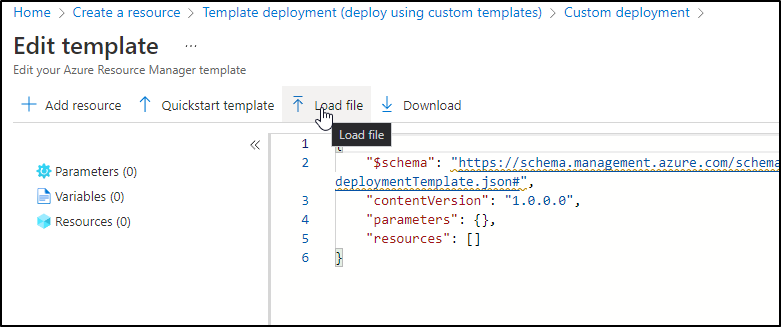
Then upload the template we saved
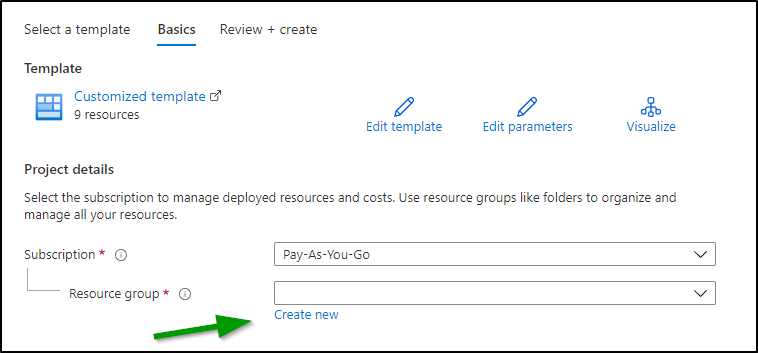
There are two parameters we need to set. The first is the Resource Group (or create a new one inline)
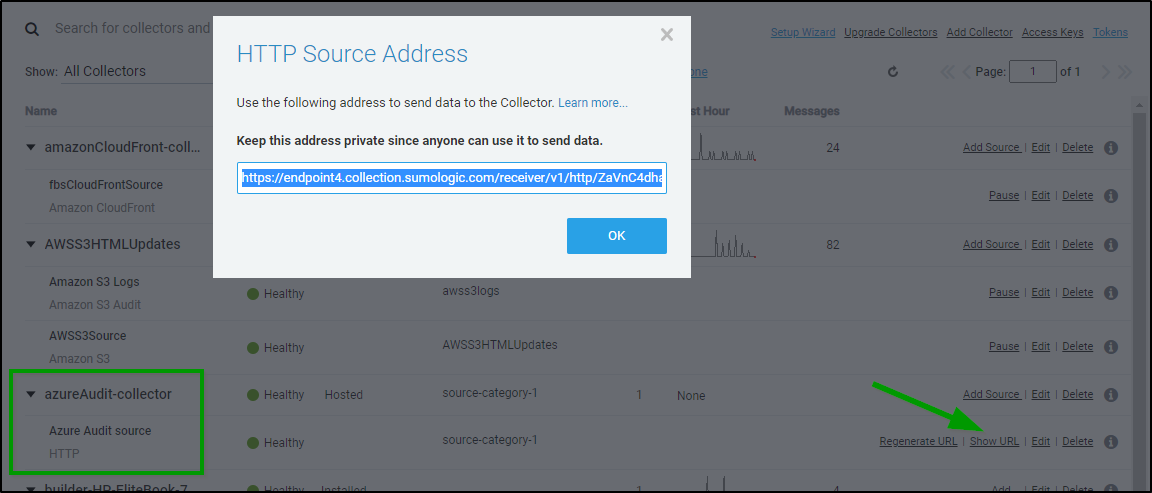
Then we need the Endpoint URL which we can get from the collector
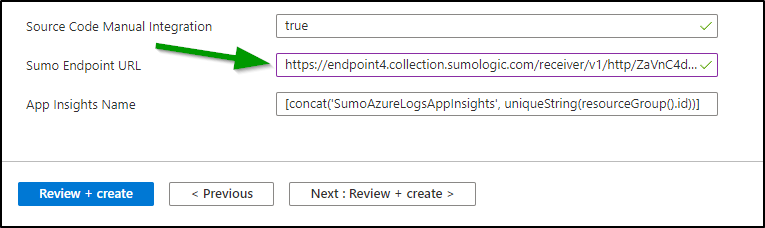
And put that into the “Sumo Endpoint URL” field
We can then “Review + Create” then click Create to create the deployment
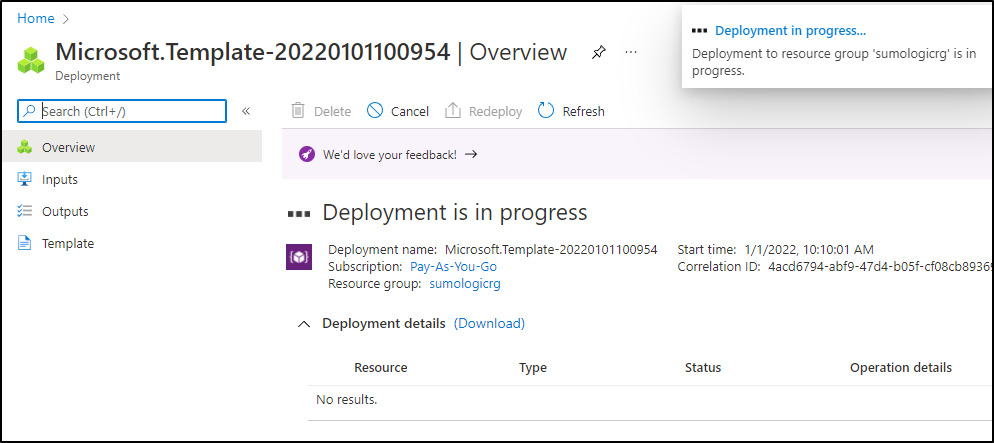
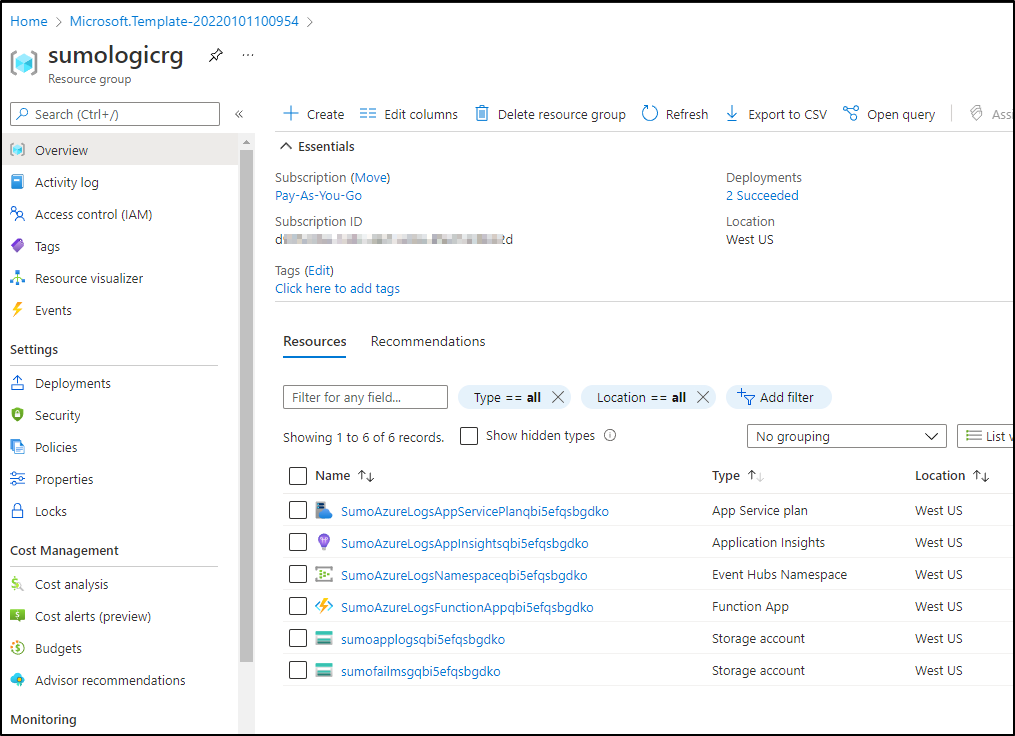
When done we see that we created some storage accounts, an Event Hub and Function app for notifications
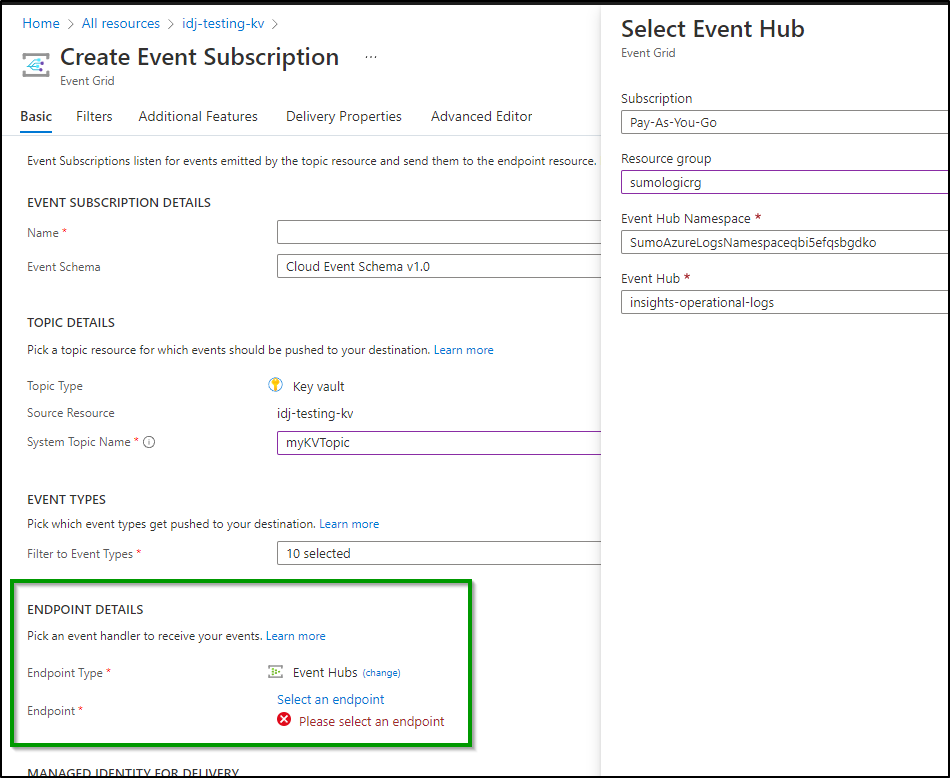
These now need some events to stream via Event Hub to Sumo Logic.
Here I will set an Event Grid subscription to an AKV instance for all key changes. I’ll pick the Event Hub namespace and Event Hub name to do so:
Now I’ll make some new versions, add and delete a cert. Generally muck about in my KV. We can see the events are being sent to the Azure Event Hub topic
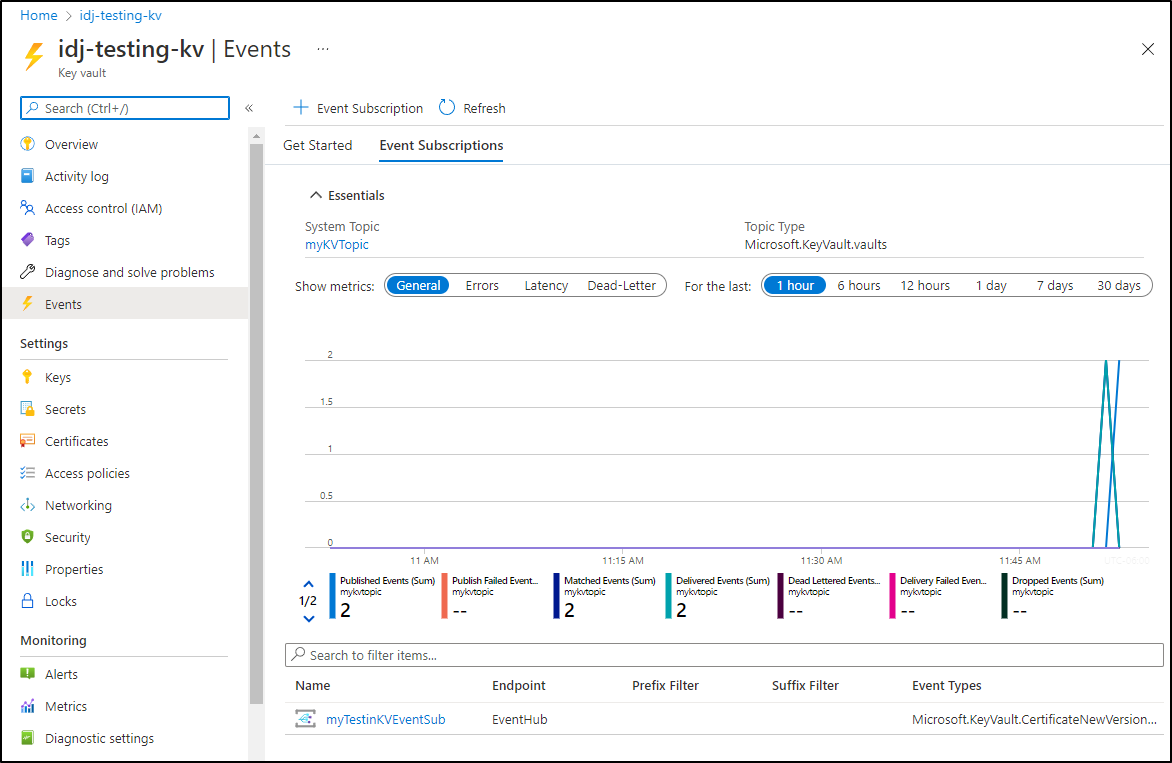
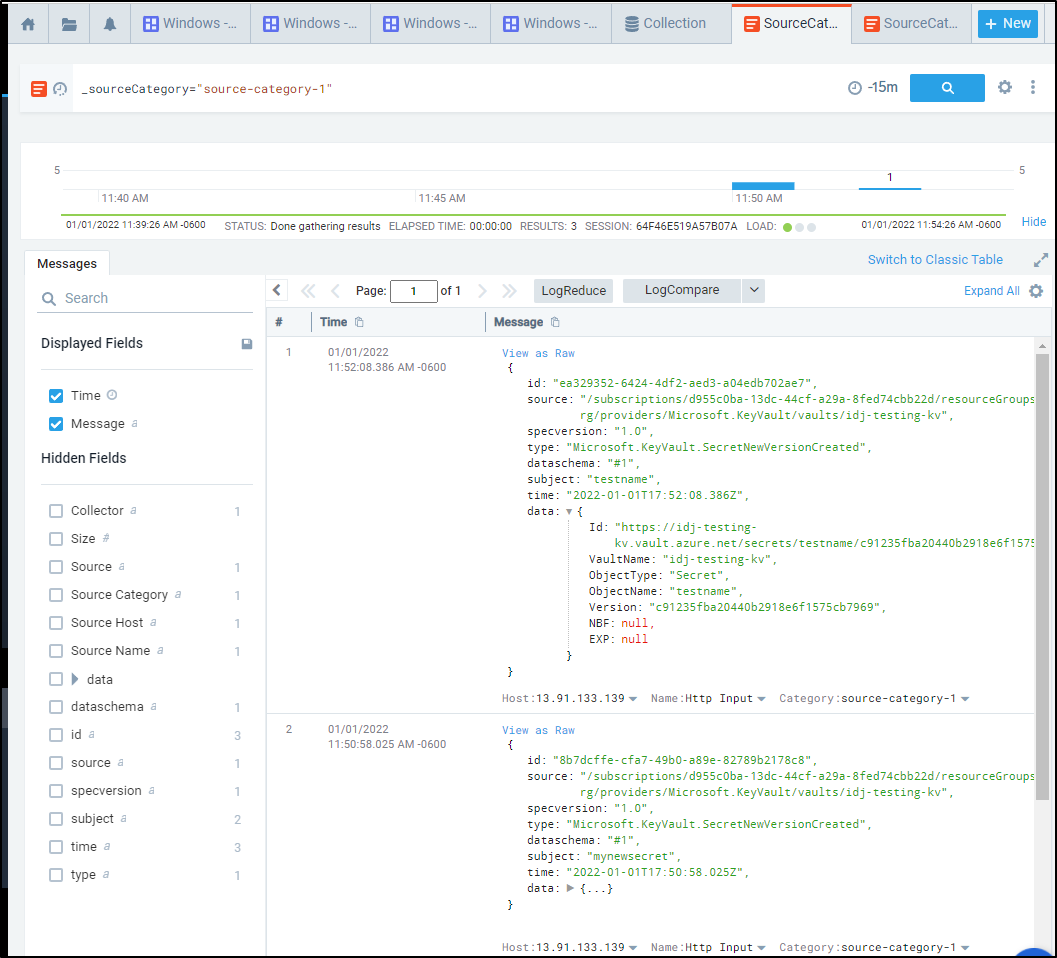
And if I head back to Sumo Logic and view logs on the category, we can see those changes show up
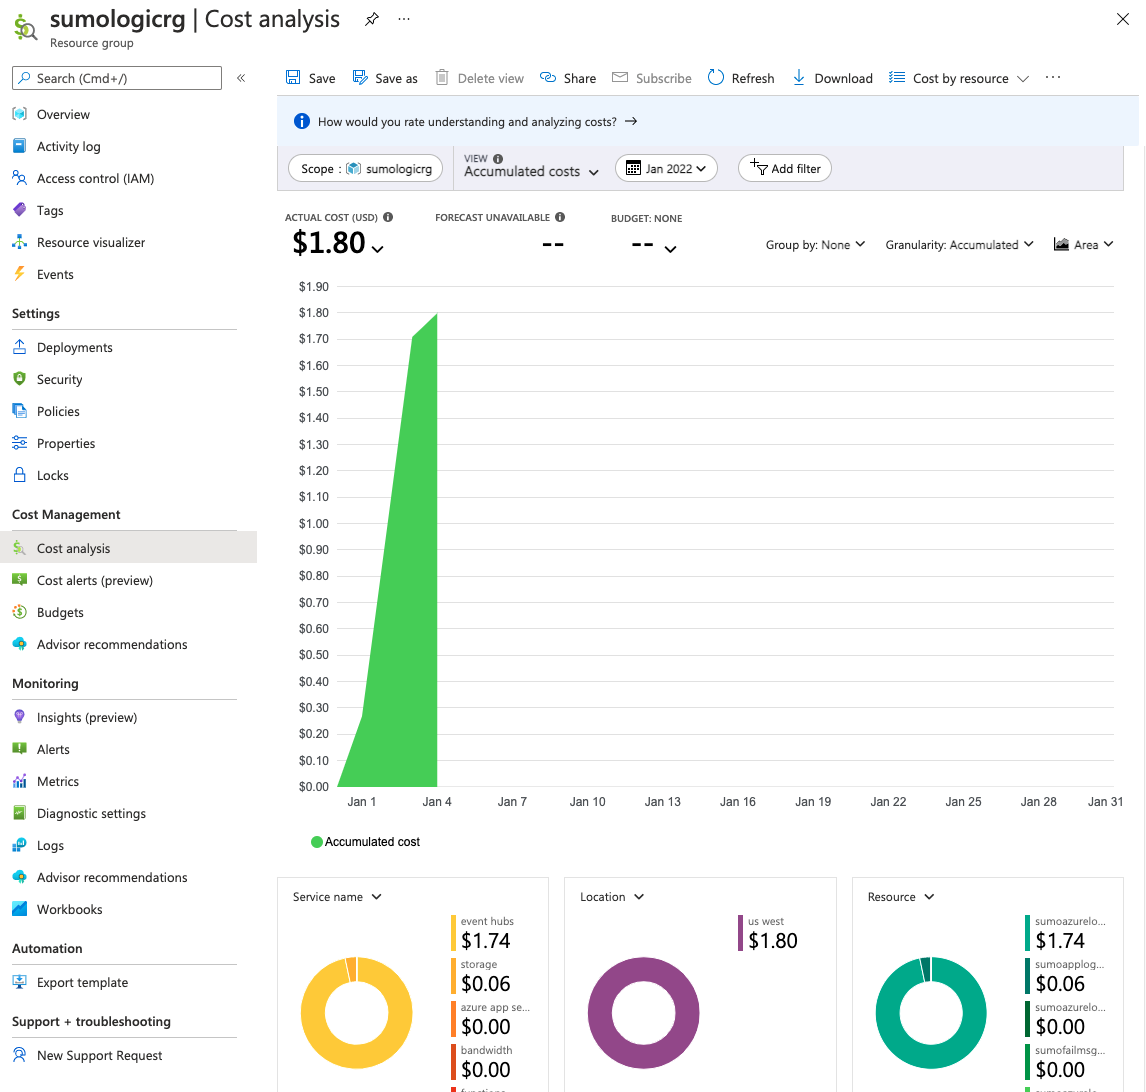
Costs
Running event hub and a function is not free. Judging by current costs it might run me US$20-30 just for this first monitor. The costs certainly are justified if monitoring many things, but that would be a bit much just for AKV.
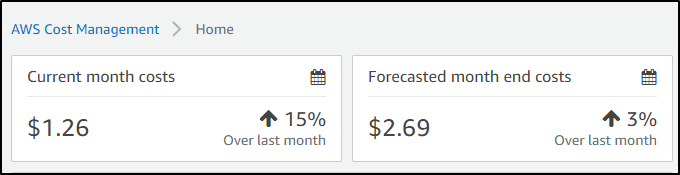
Interestingly, the AWS costs are far cheaper. Since the ingesting from the hosted agent really comes from Sumo Logic’s end. I just have a storage account, it looks like it might just add a dollar or two
Summary
In this first dive into Sumo Logic we explored the history and market position of Sumo Logic. We set up our account and created a simple Linux Installed Collector. We then setup collectors for Kubernetes before moving on to Monitoring, using our K8s cluster as the thing to monitor and for which to alert. Lastly, we looked at Hosted Collectors for AWS S3 and Cloudfront logs. We wrapped by looking at Azure monitoring with Event Hub and touched on cost considerations.
This is just the first in a three-part series. In Friday’s post we will continue looking at Sumo Logic expanding on Monitors to integrate with Pagerduty’s Rundeck, Teams and more. We will revisit the Linux collector and setup a Windows one as well before moving onto monitoring a Github Organization or Repo. Then we will look at topic around Enterprise adoption including the Data Volume App and its usage. We will wrap by exploring users and roles, costs, budgets and cost mitigation strategies. The third part will dive into Tracing data amongst other topics.
Clearly, Sumo Logic has struck a nerve. I don’t go this deep unless I see something really worth exploring. I will admit, it is quirky. Some Observability Suites really focus on the UI, or Integrations. This one does not try to hide the gnarly bits. It’s written for Operations/DevOps. It isn’t perfect, it has fiddly bits. Order of operations matter. Once I started to grok the patterns, it became smoother.
I hope you enjoyed this and come back Friday as I dig deeper into Sumo Logic.