

Published: Nov 17, 2021 by Isaac Johnson
New Relic is a performance monitoring and logging tool that has been around since 2008 when it was founded by Lew Cirne (the company is an anagram of his name). He remained CEO until July of this year until handing it off to Bill Staples who came over from Adobe in 2020.
New Relic is a full observability suite like Datadog and Splunk. They increased their play into containerized tracing and observability when in 2020, they acquired Pixie Labs and subsequently open-sourced it and integrated it into their offerings.
Pixie is a rather unique offering in that it handles eBPF for kernel layer data and telemtry capture and runs on the cluster itself. This reduces how much data has to be transmitted in real time up to a cloud SaaS offering.
Let’s check out New Relic and see how we can use it as well as how it compares to other offerings.
Setup
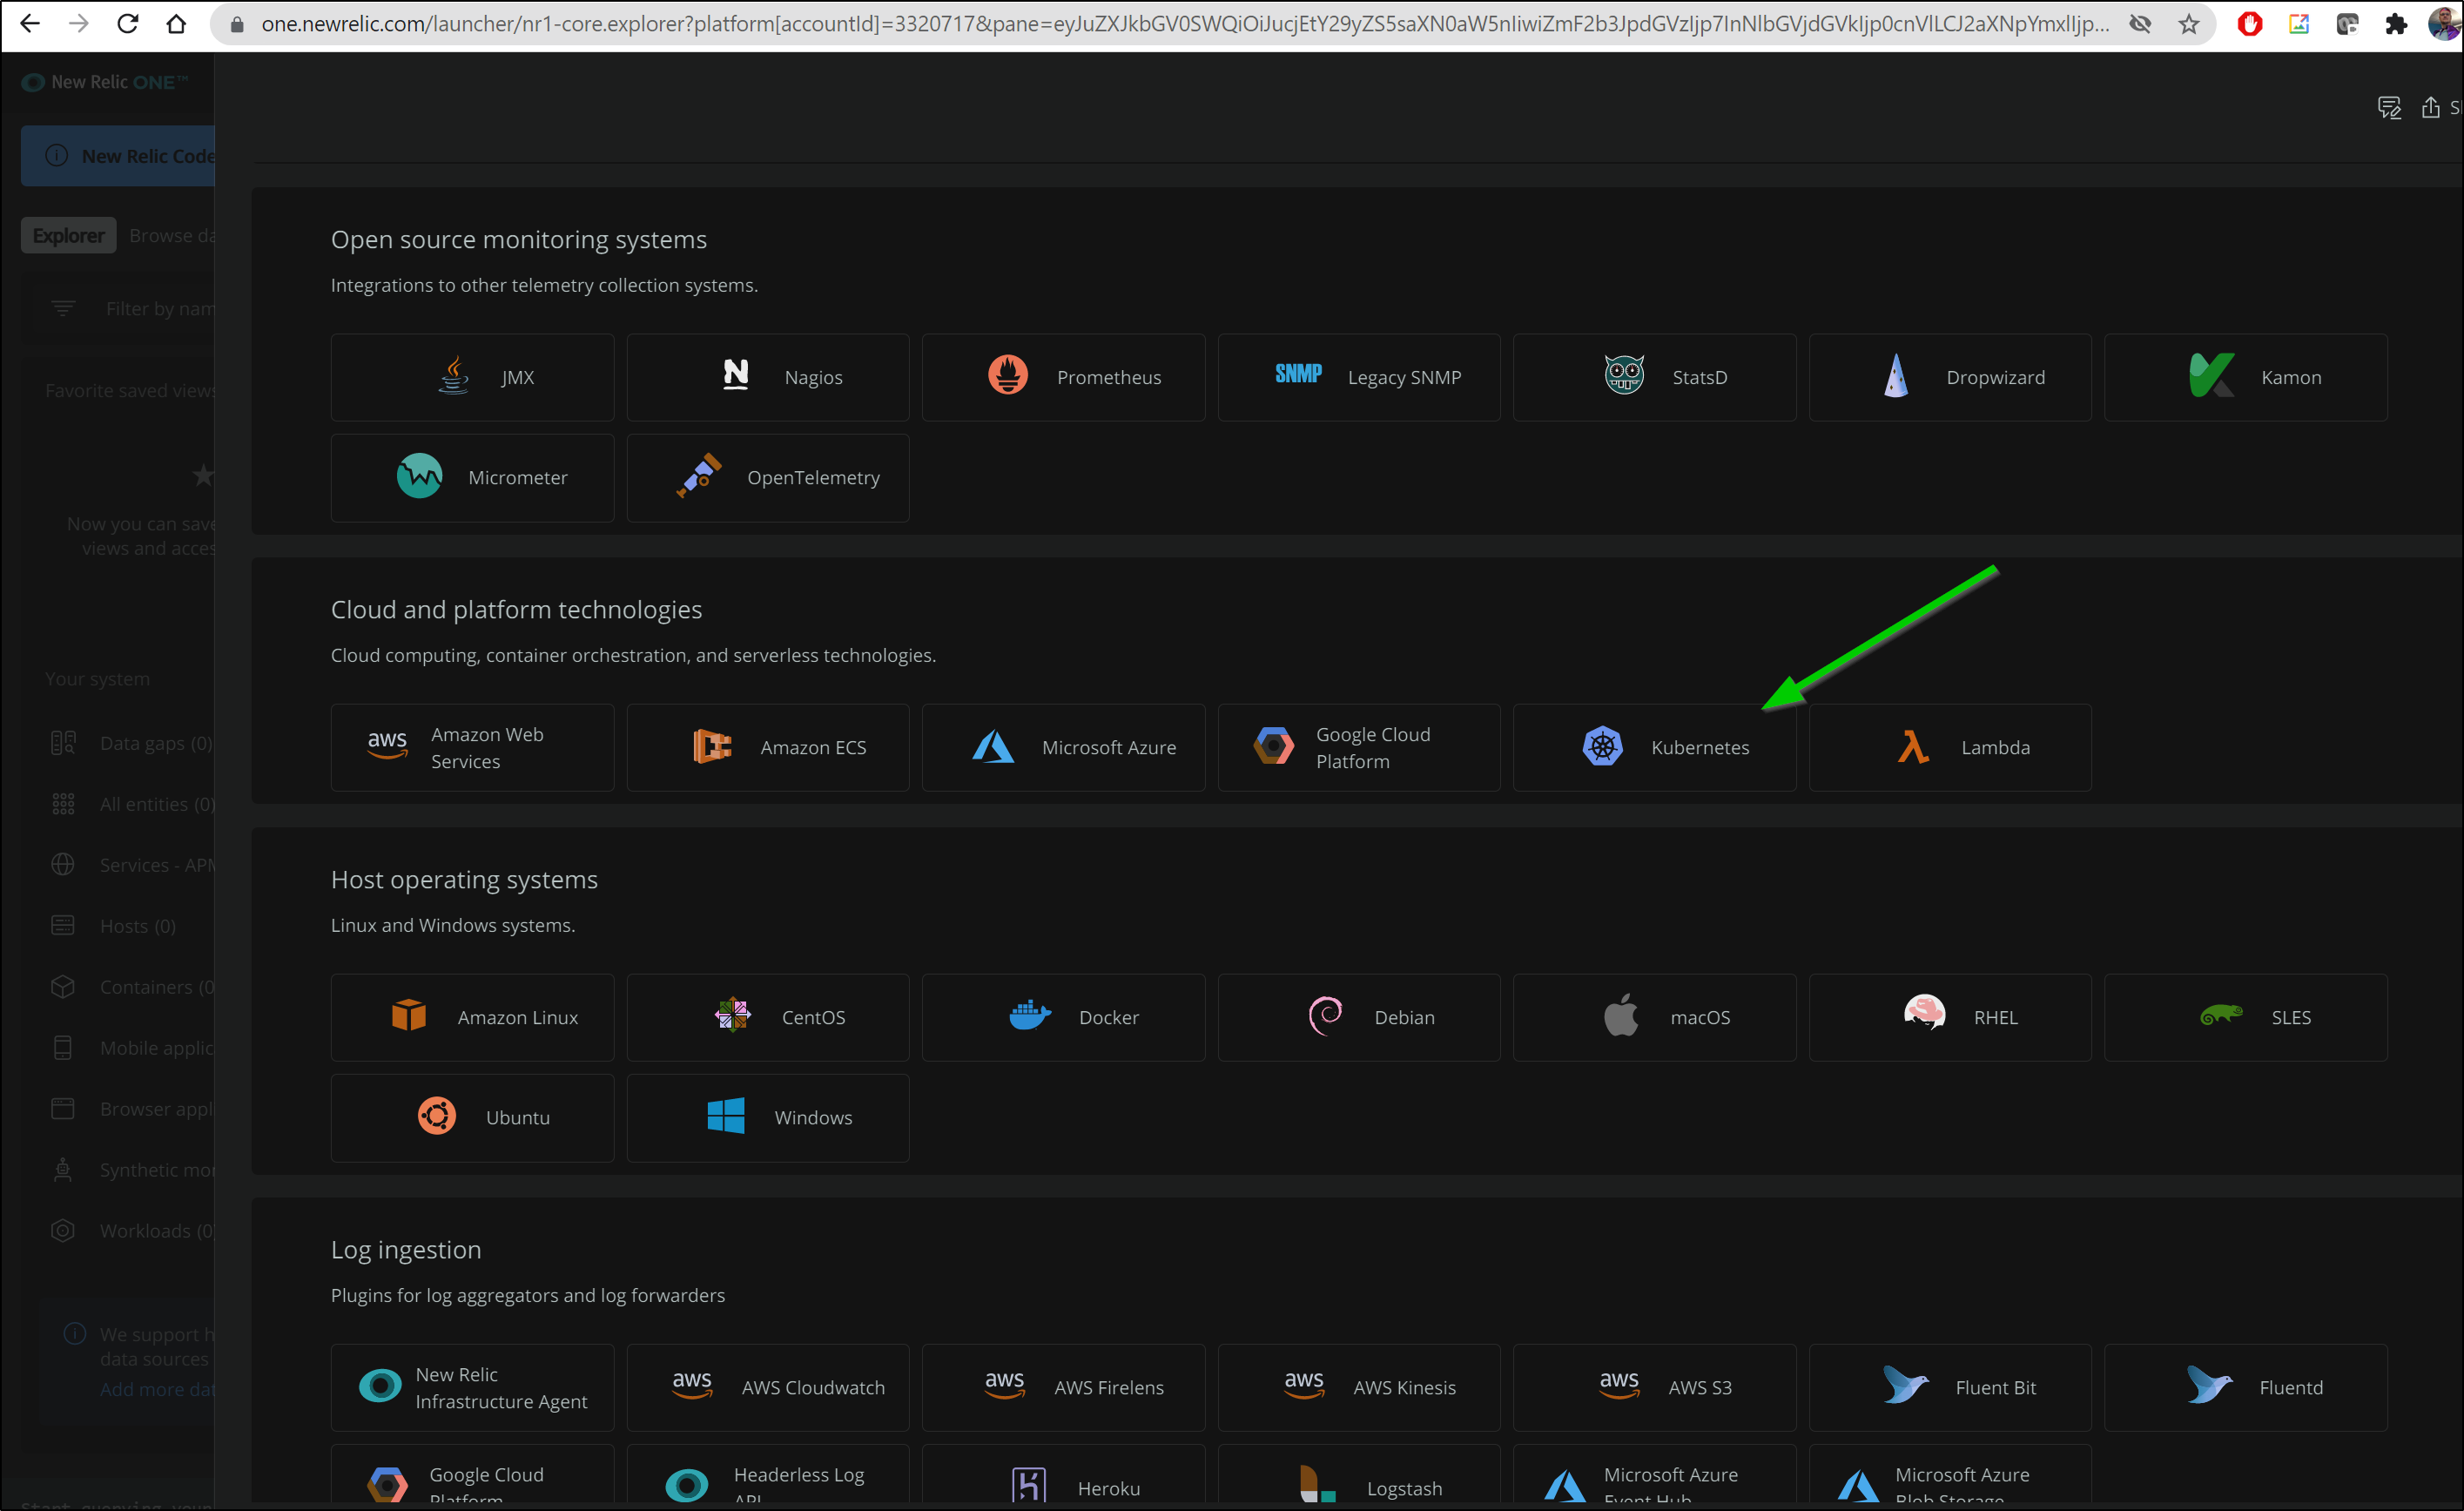
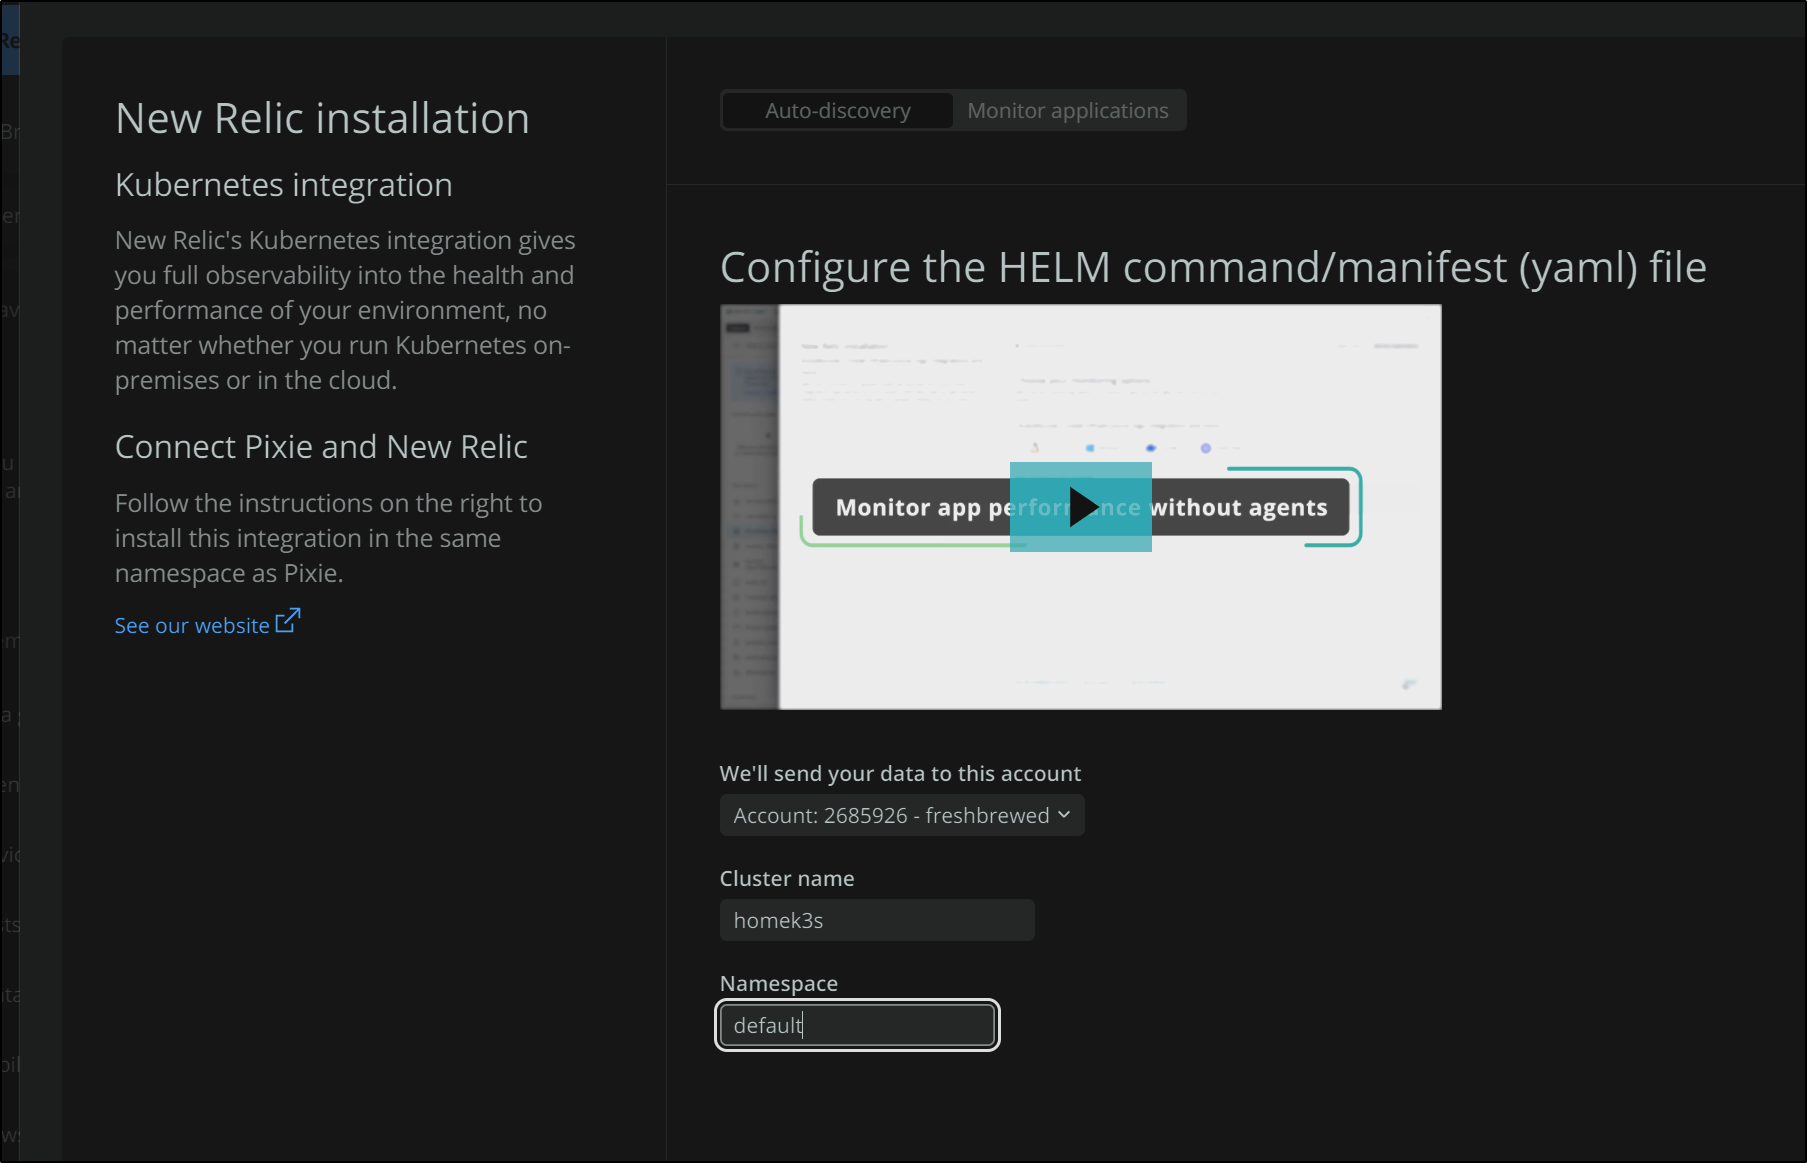
Once we signup for New Relic, we can use the Wizard to “Add your Data” in the upper right to navigate to the Kubernetes data ingestion wizard:
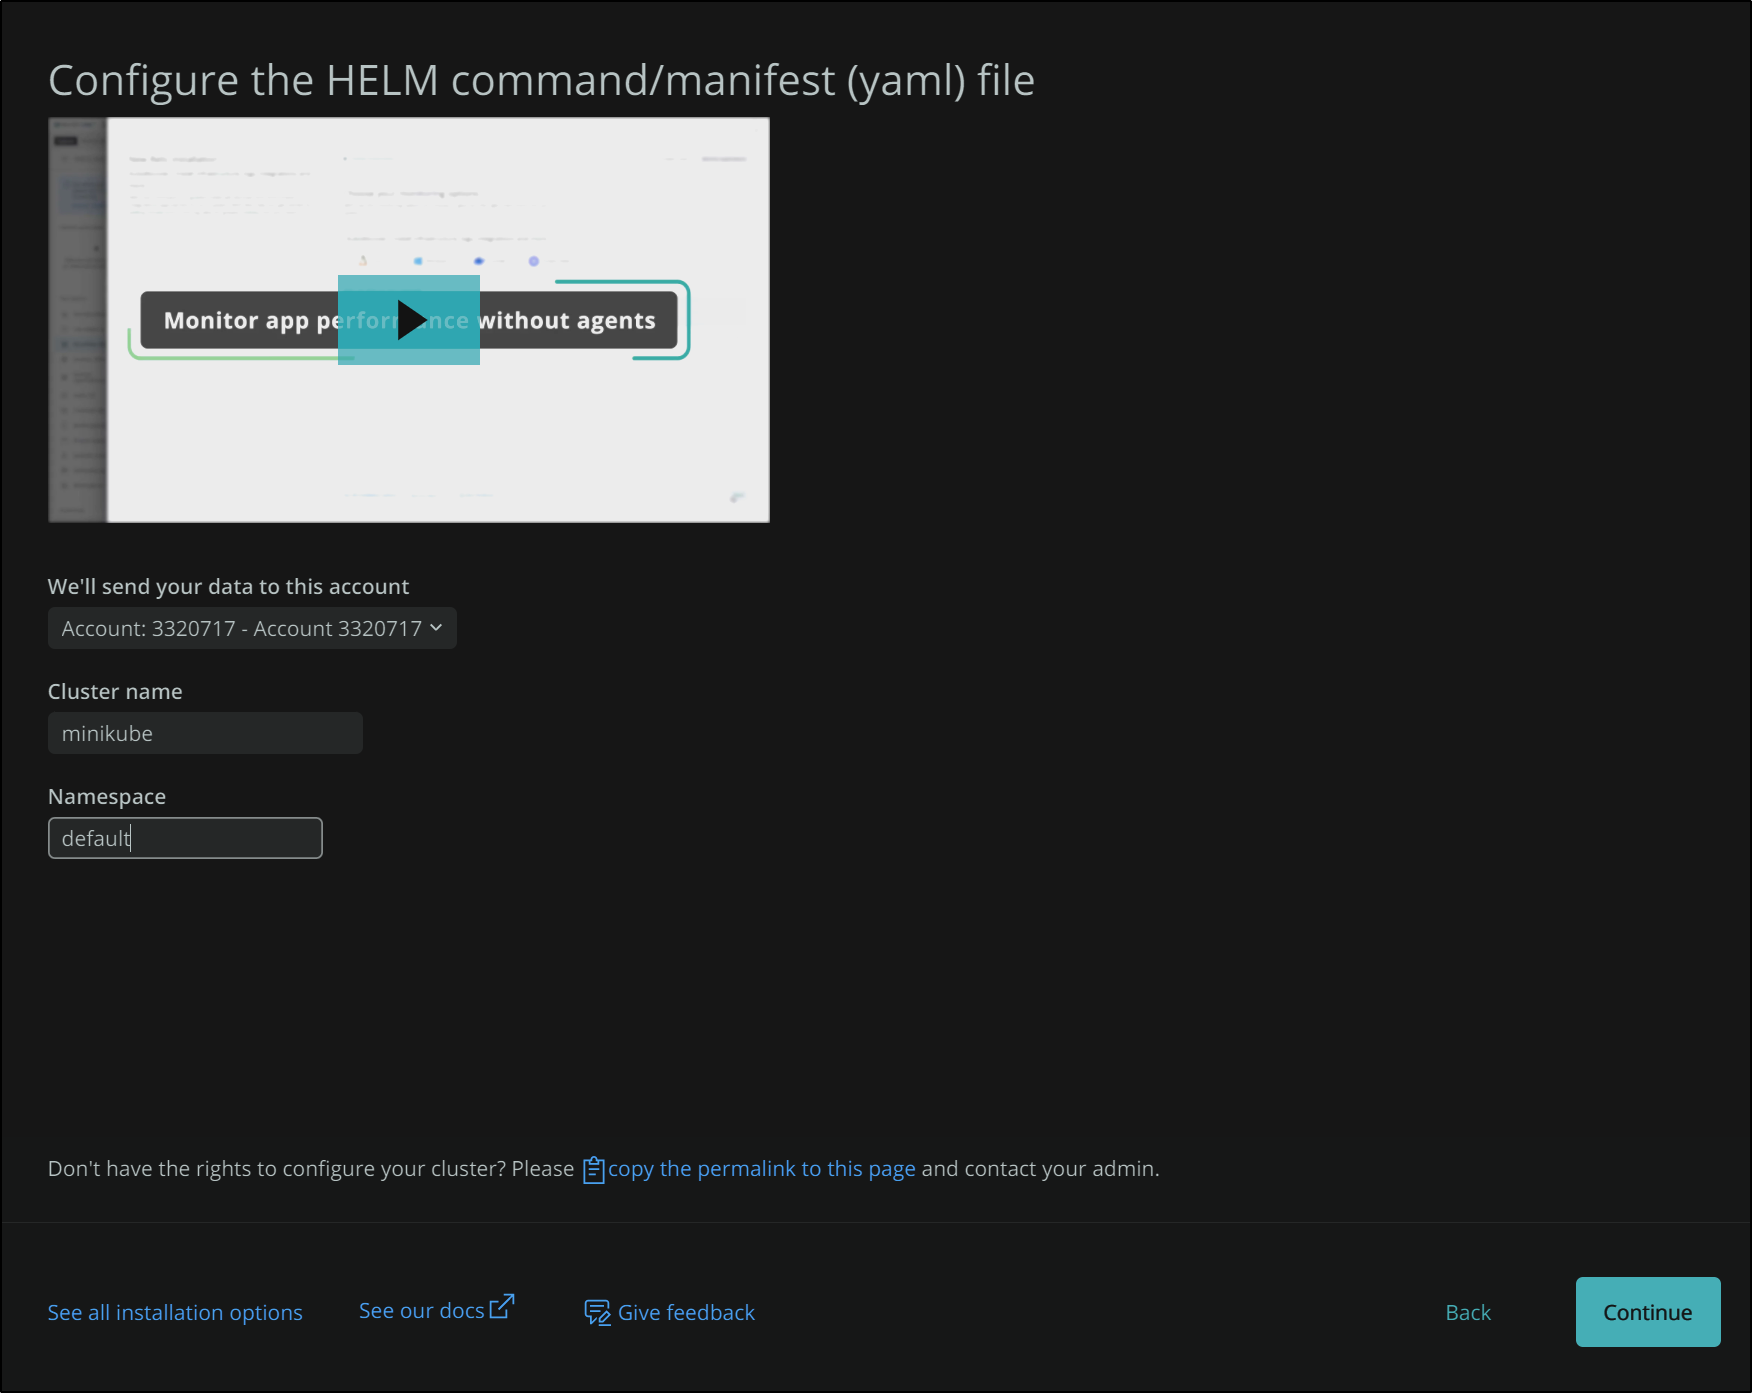
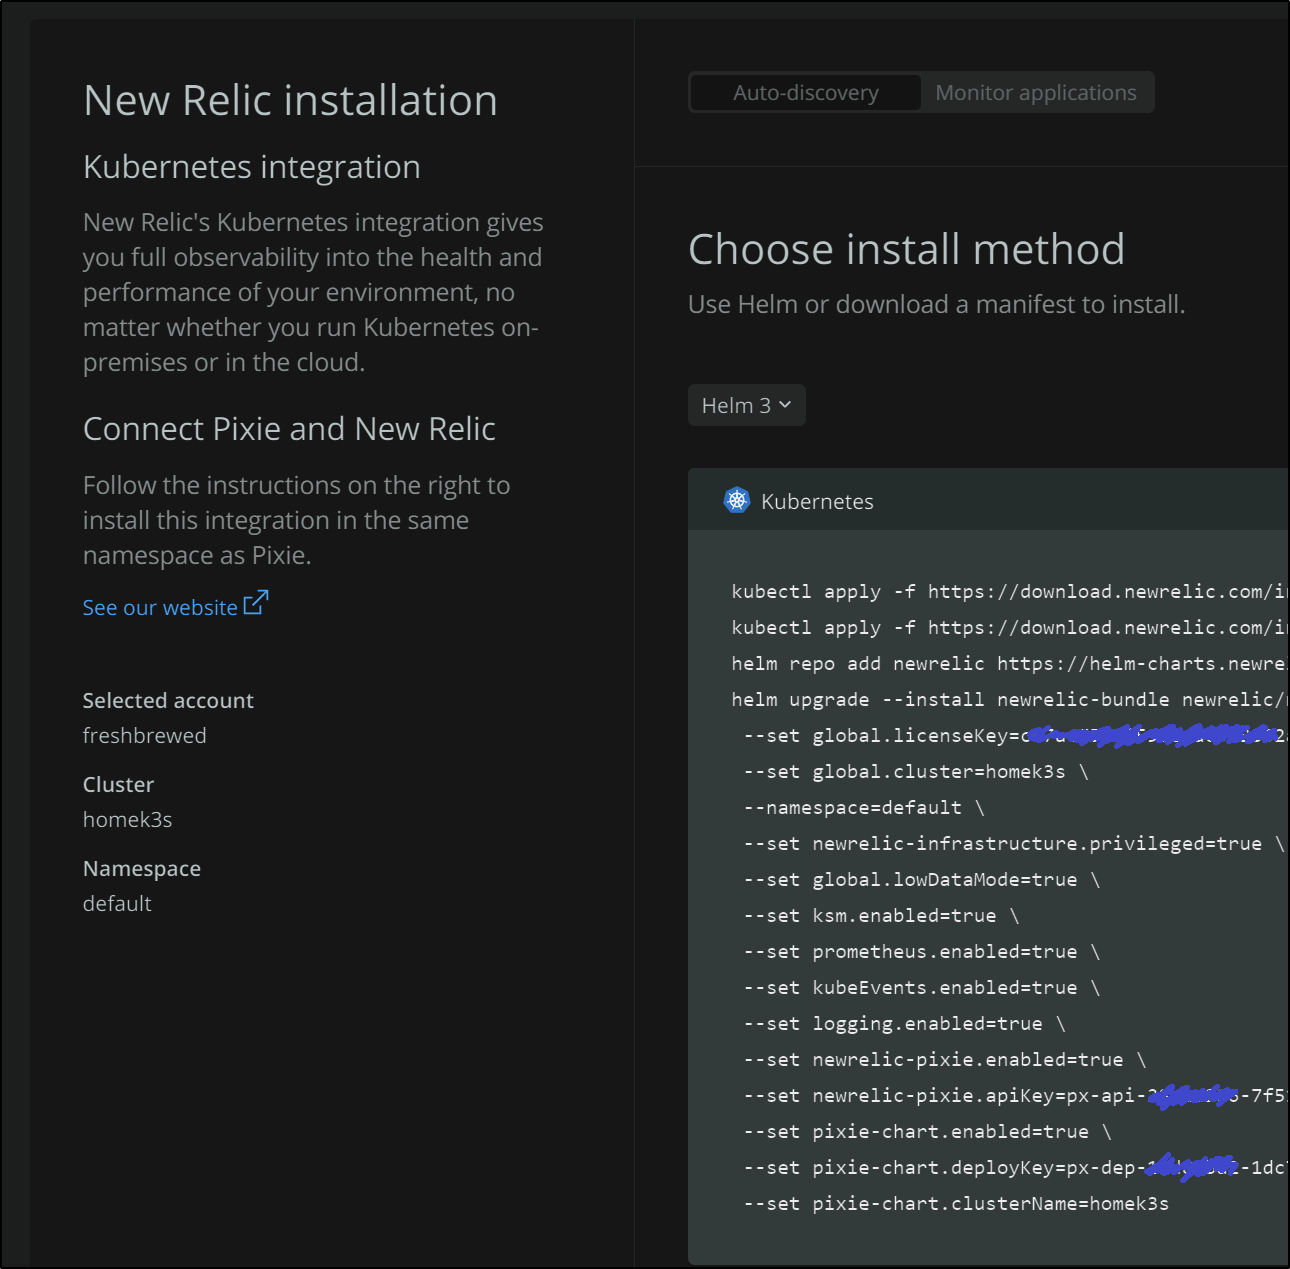
In the next screen we will name our cluster. This will be reflected later in the helm deploy as well as how we identify the cluster in our NewRelic dashboards.
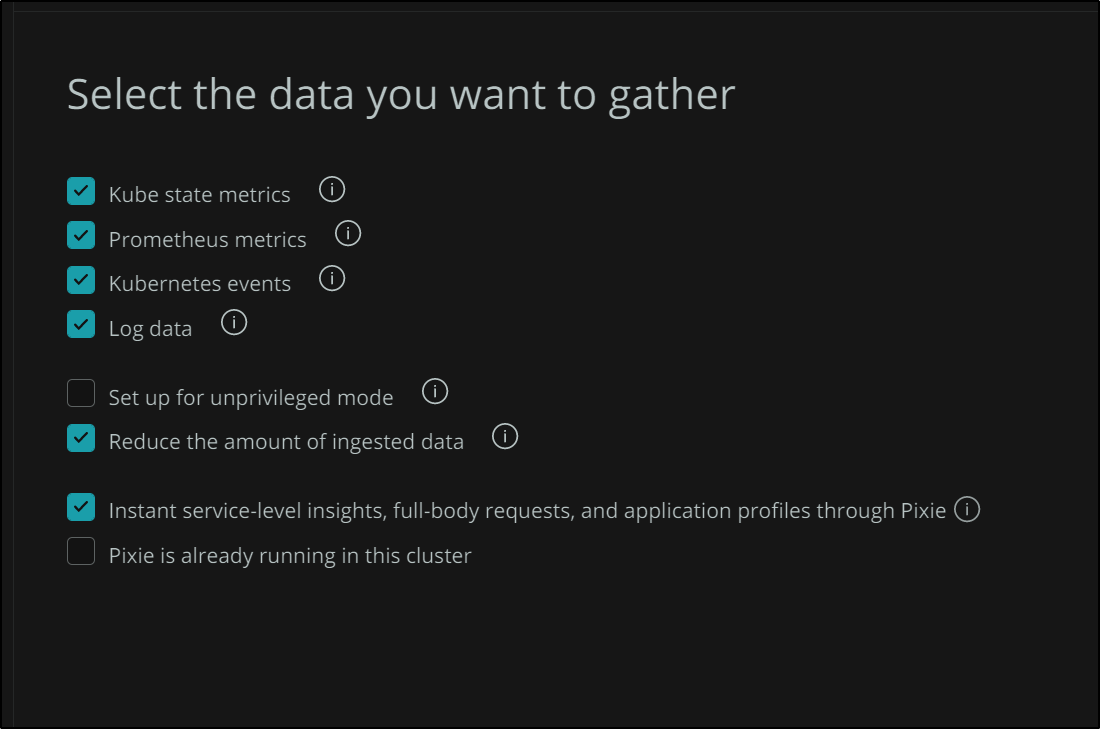
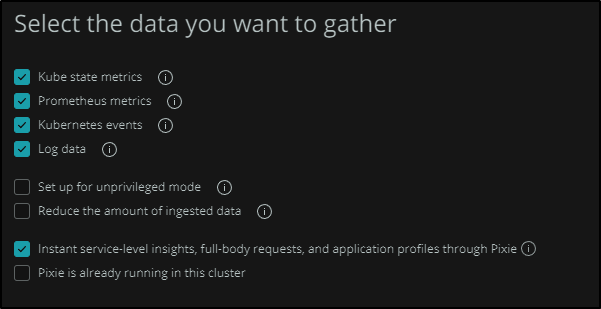
The next options turn on and off optional configurations of the helm chart. For instance, if you are in a shared cluster and really should limit your monitoring to just a specific namespace or you may not have the RBAC rights to monitor all things, then you can “Setup for unprivledged mode”
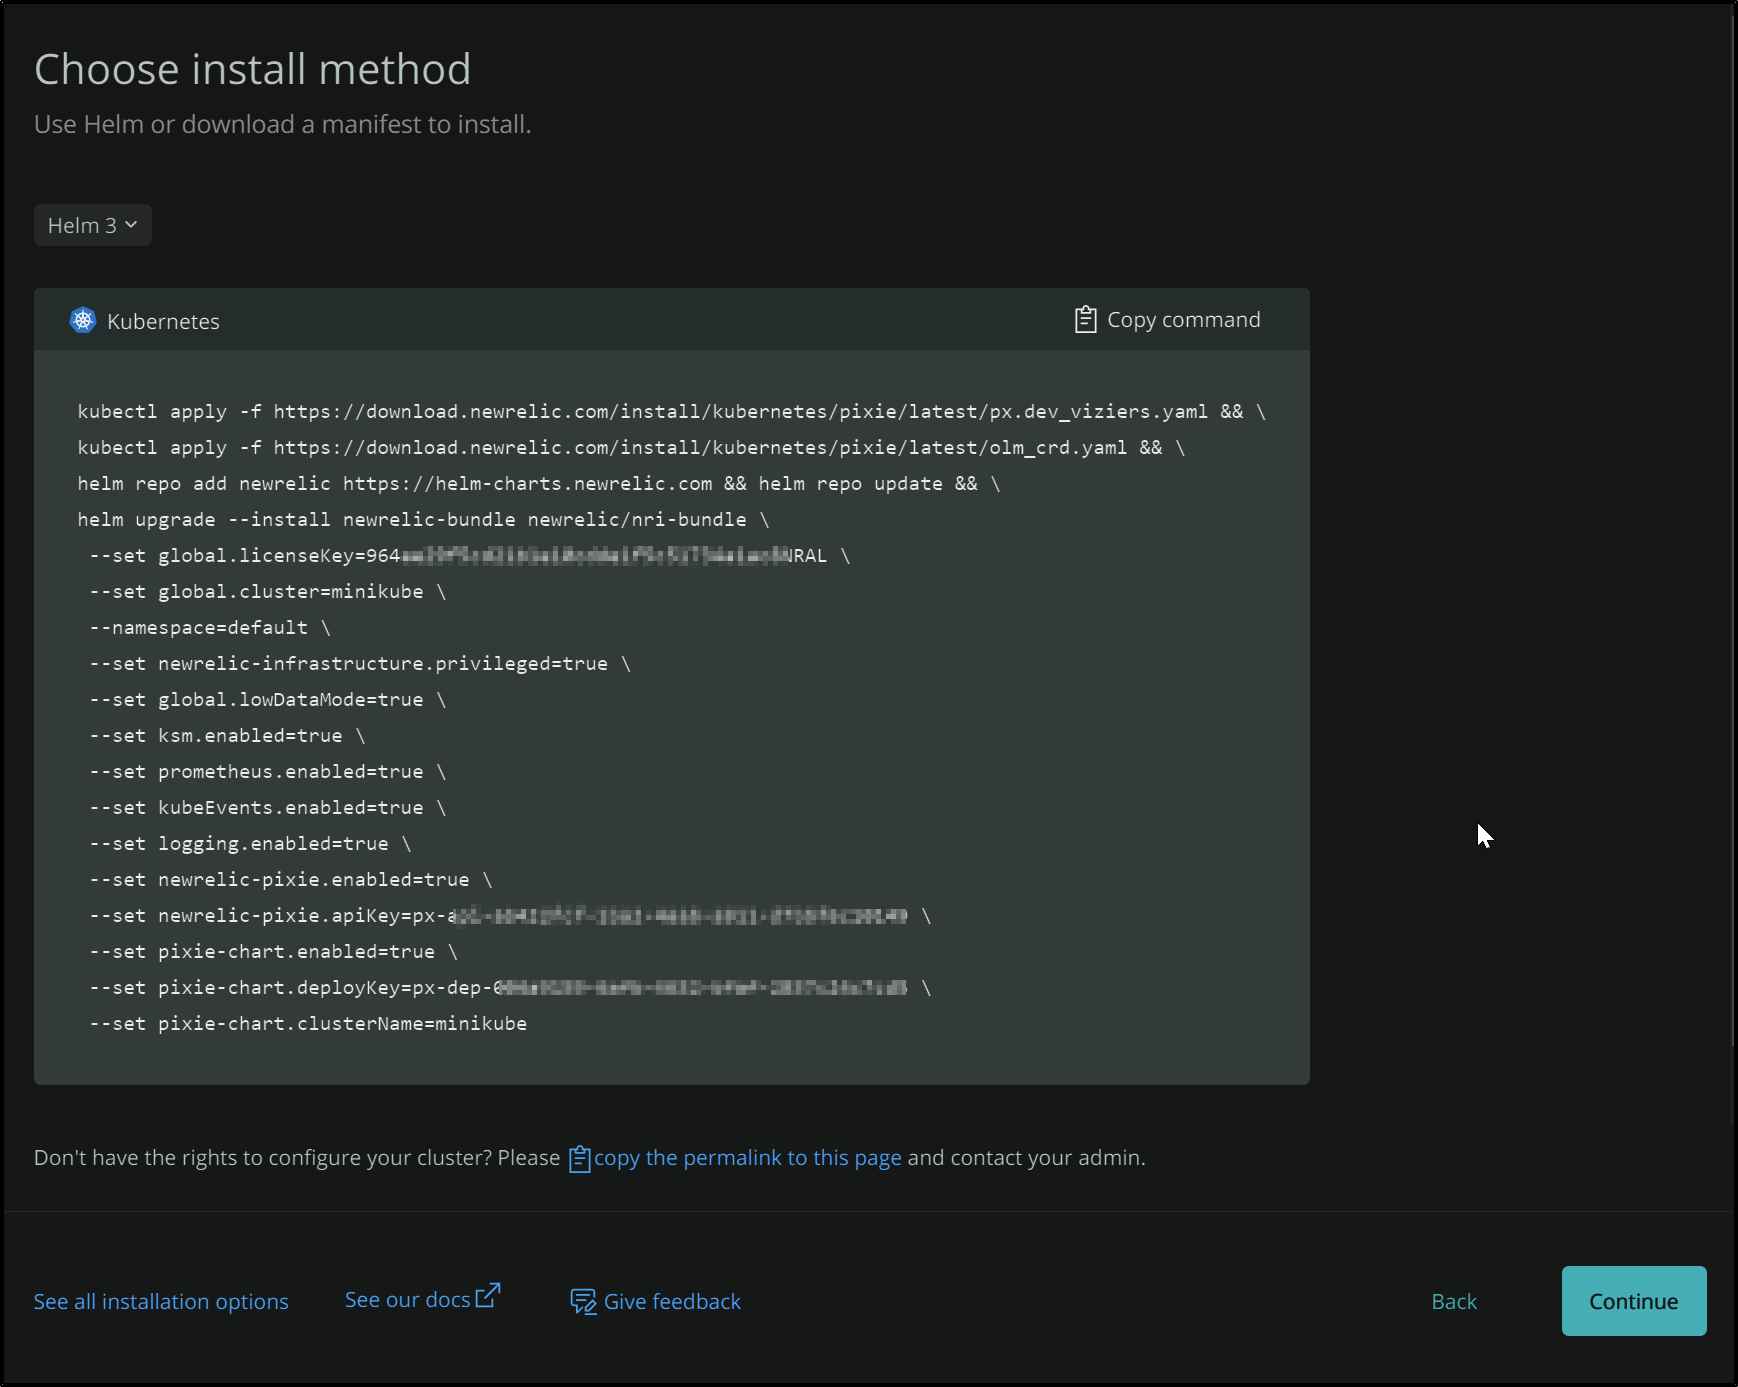
Lastly, we get the kubectl and helm commands to install the NewRelic agent into our cluster.
$ helm list
NAME            NAMESPACE       REVISION        UPDATED                                 STATUS          CHART                   APP VERSION
newrelic-bundle default         1               2021-11-06 21:15:46.3882052 -0500 CDT   deployed        nri-bundle-3.2.4        1.0
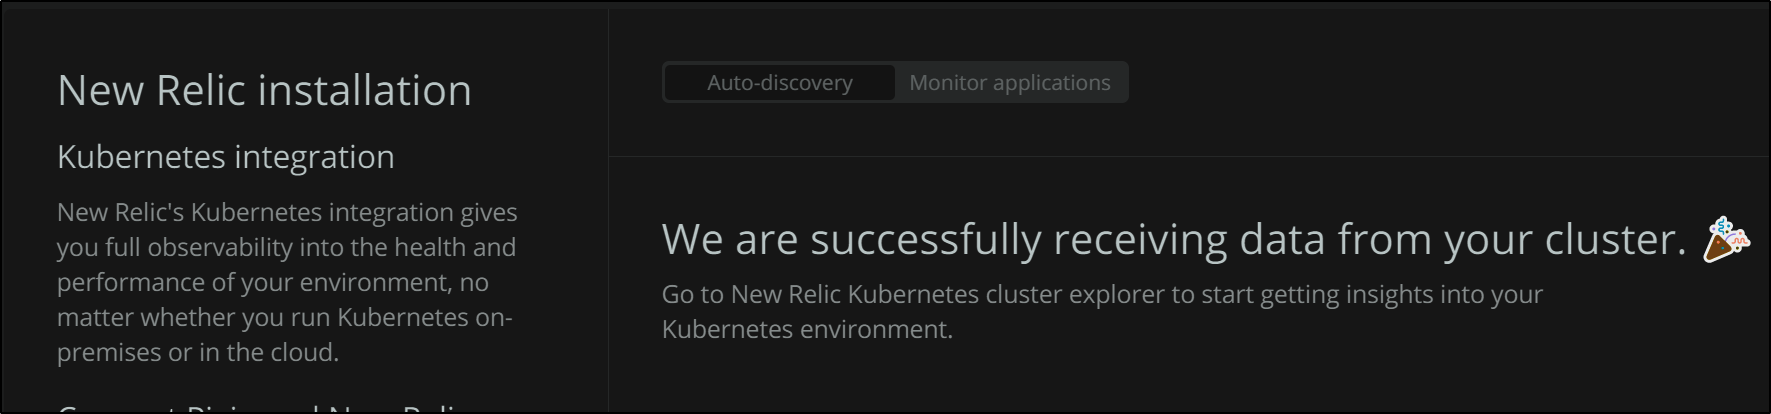
If things go right, in a few minute the page will refresh to indicte that they are indeed getting results from your cluster.
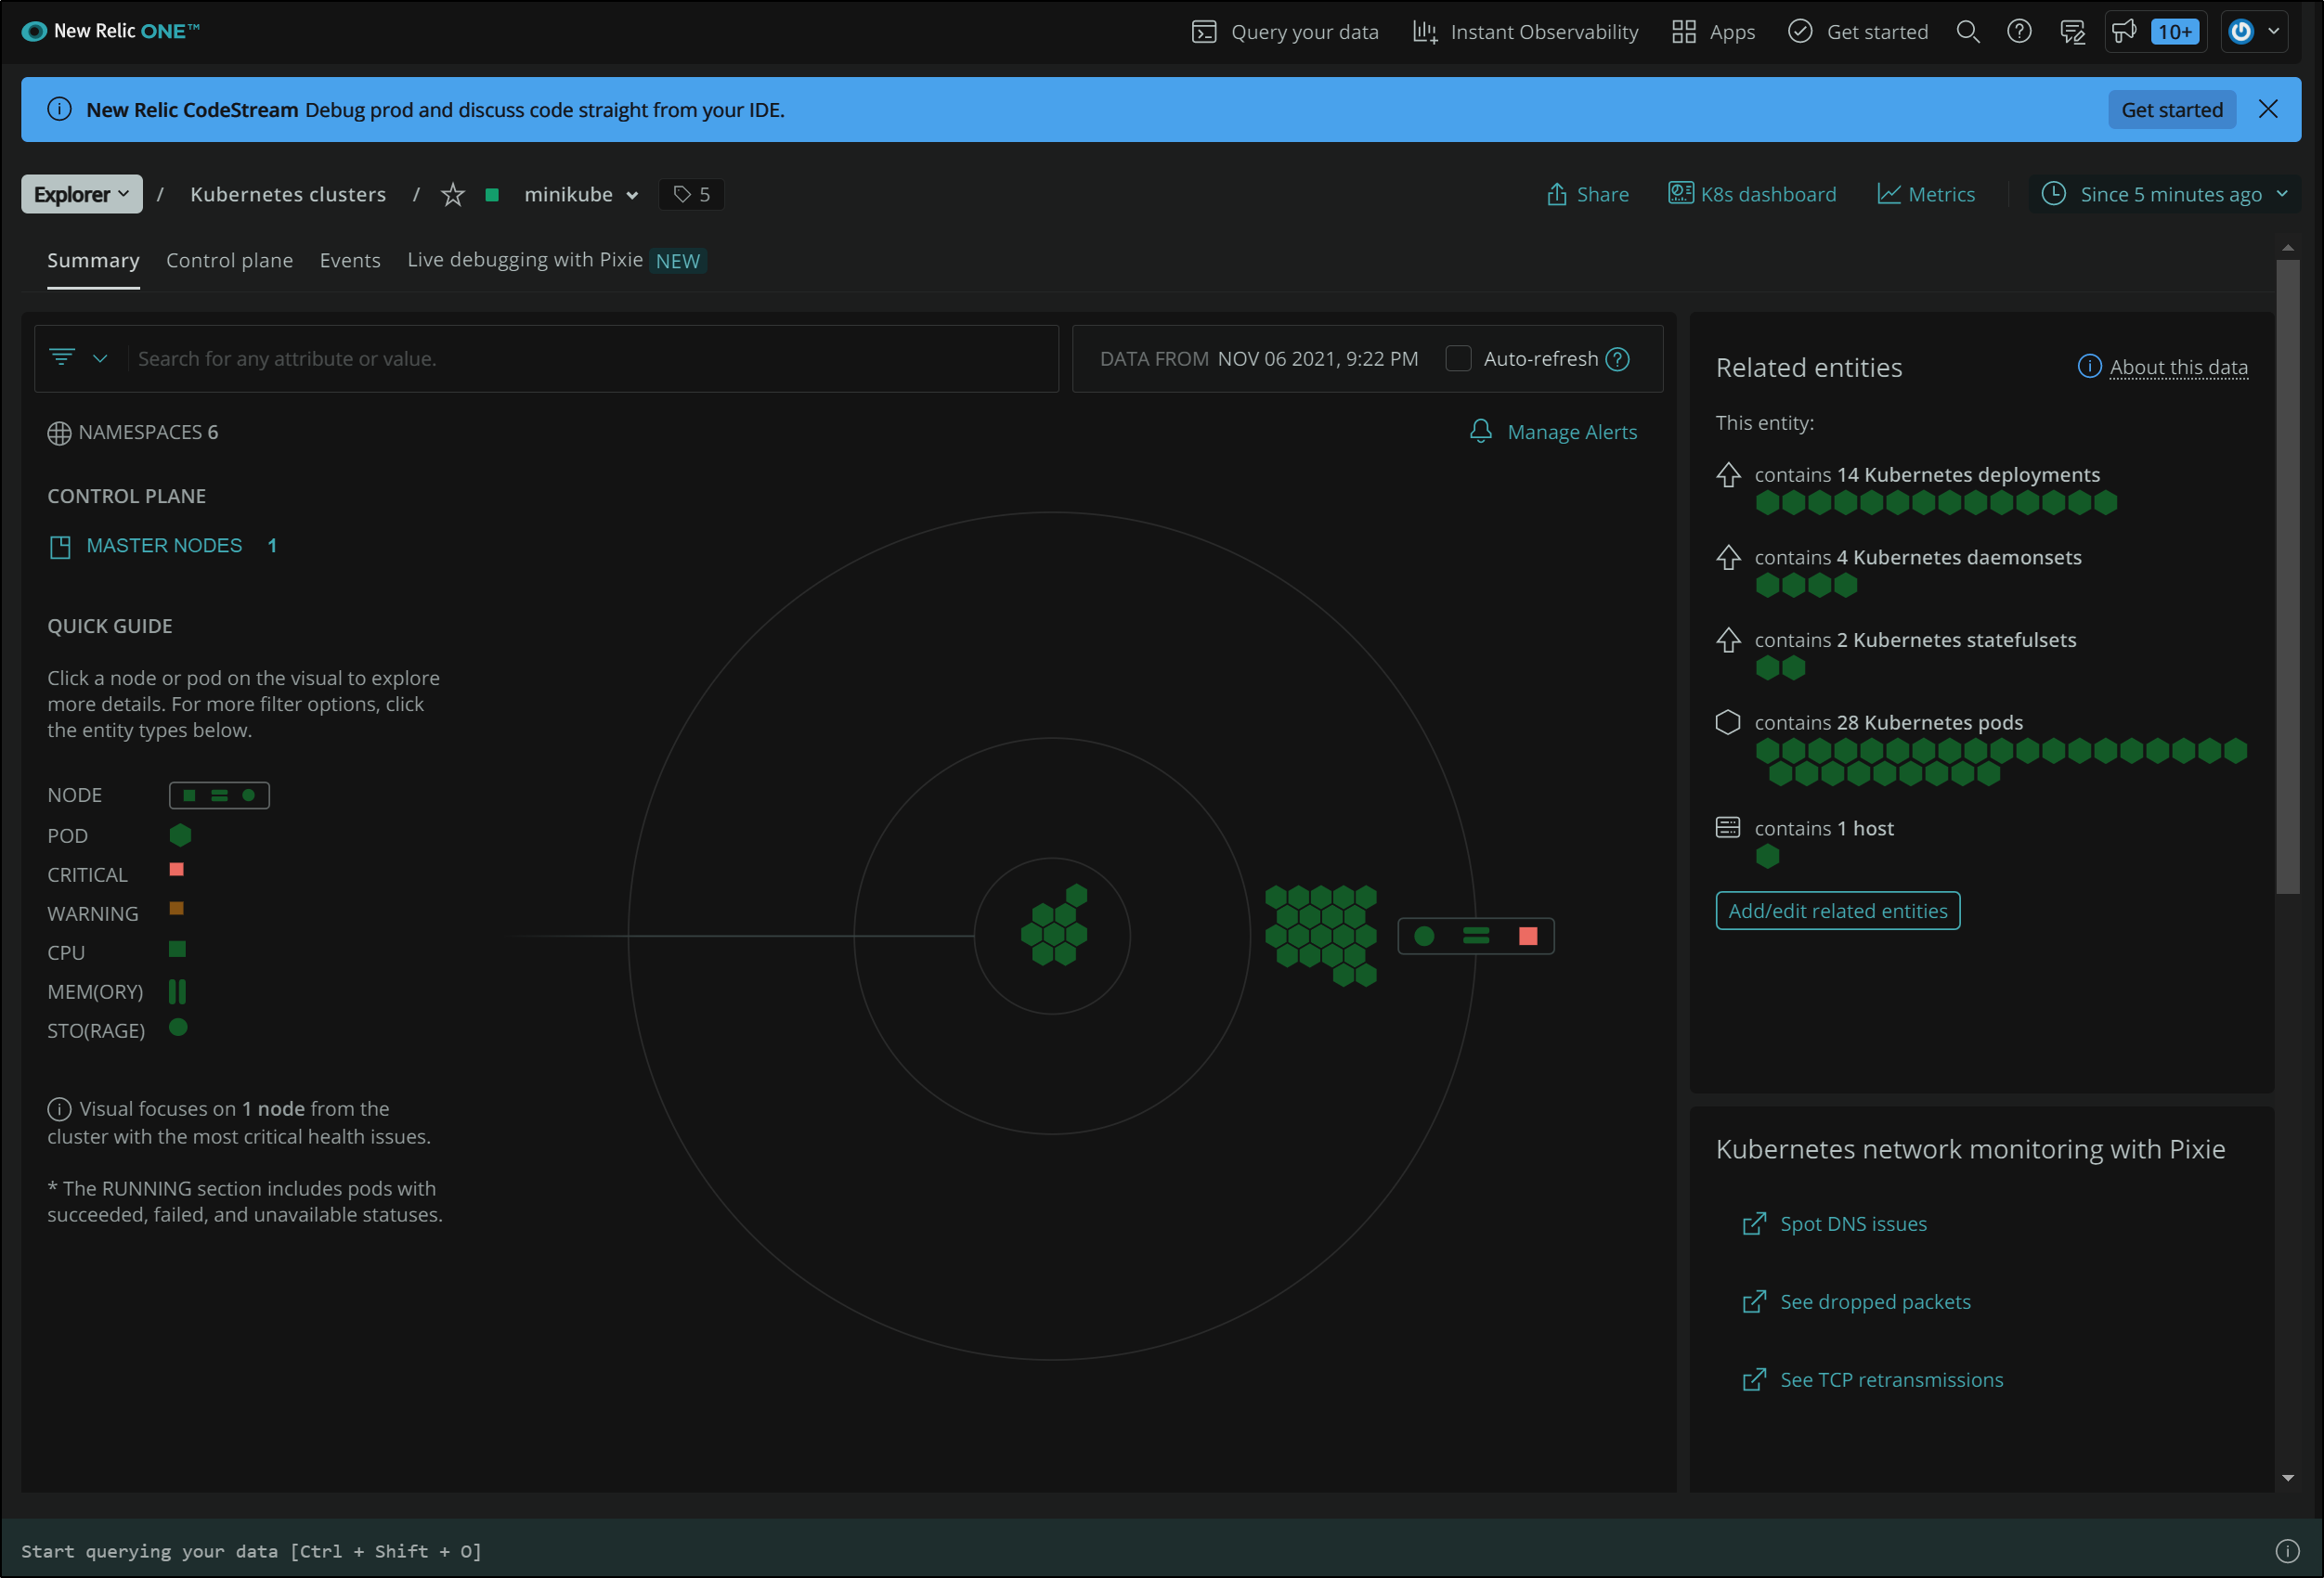
New Relic Kubernetes Dasbhoards
Here we see a nice overview of nodes, pods, deployments and more. Note, this cluster has no content installed. It’s just a fresh minikube.
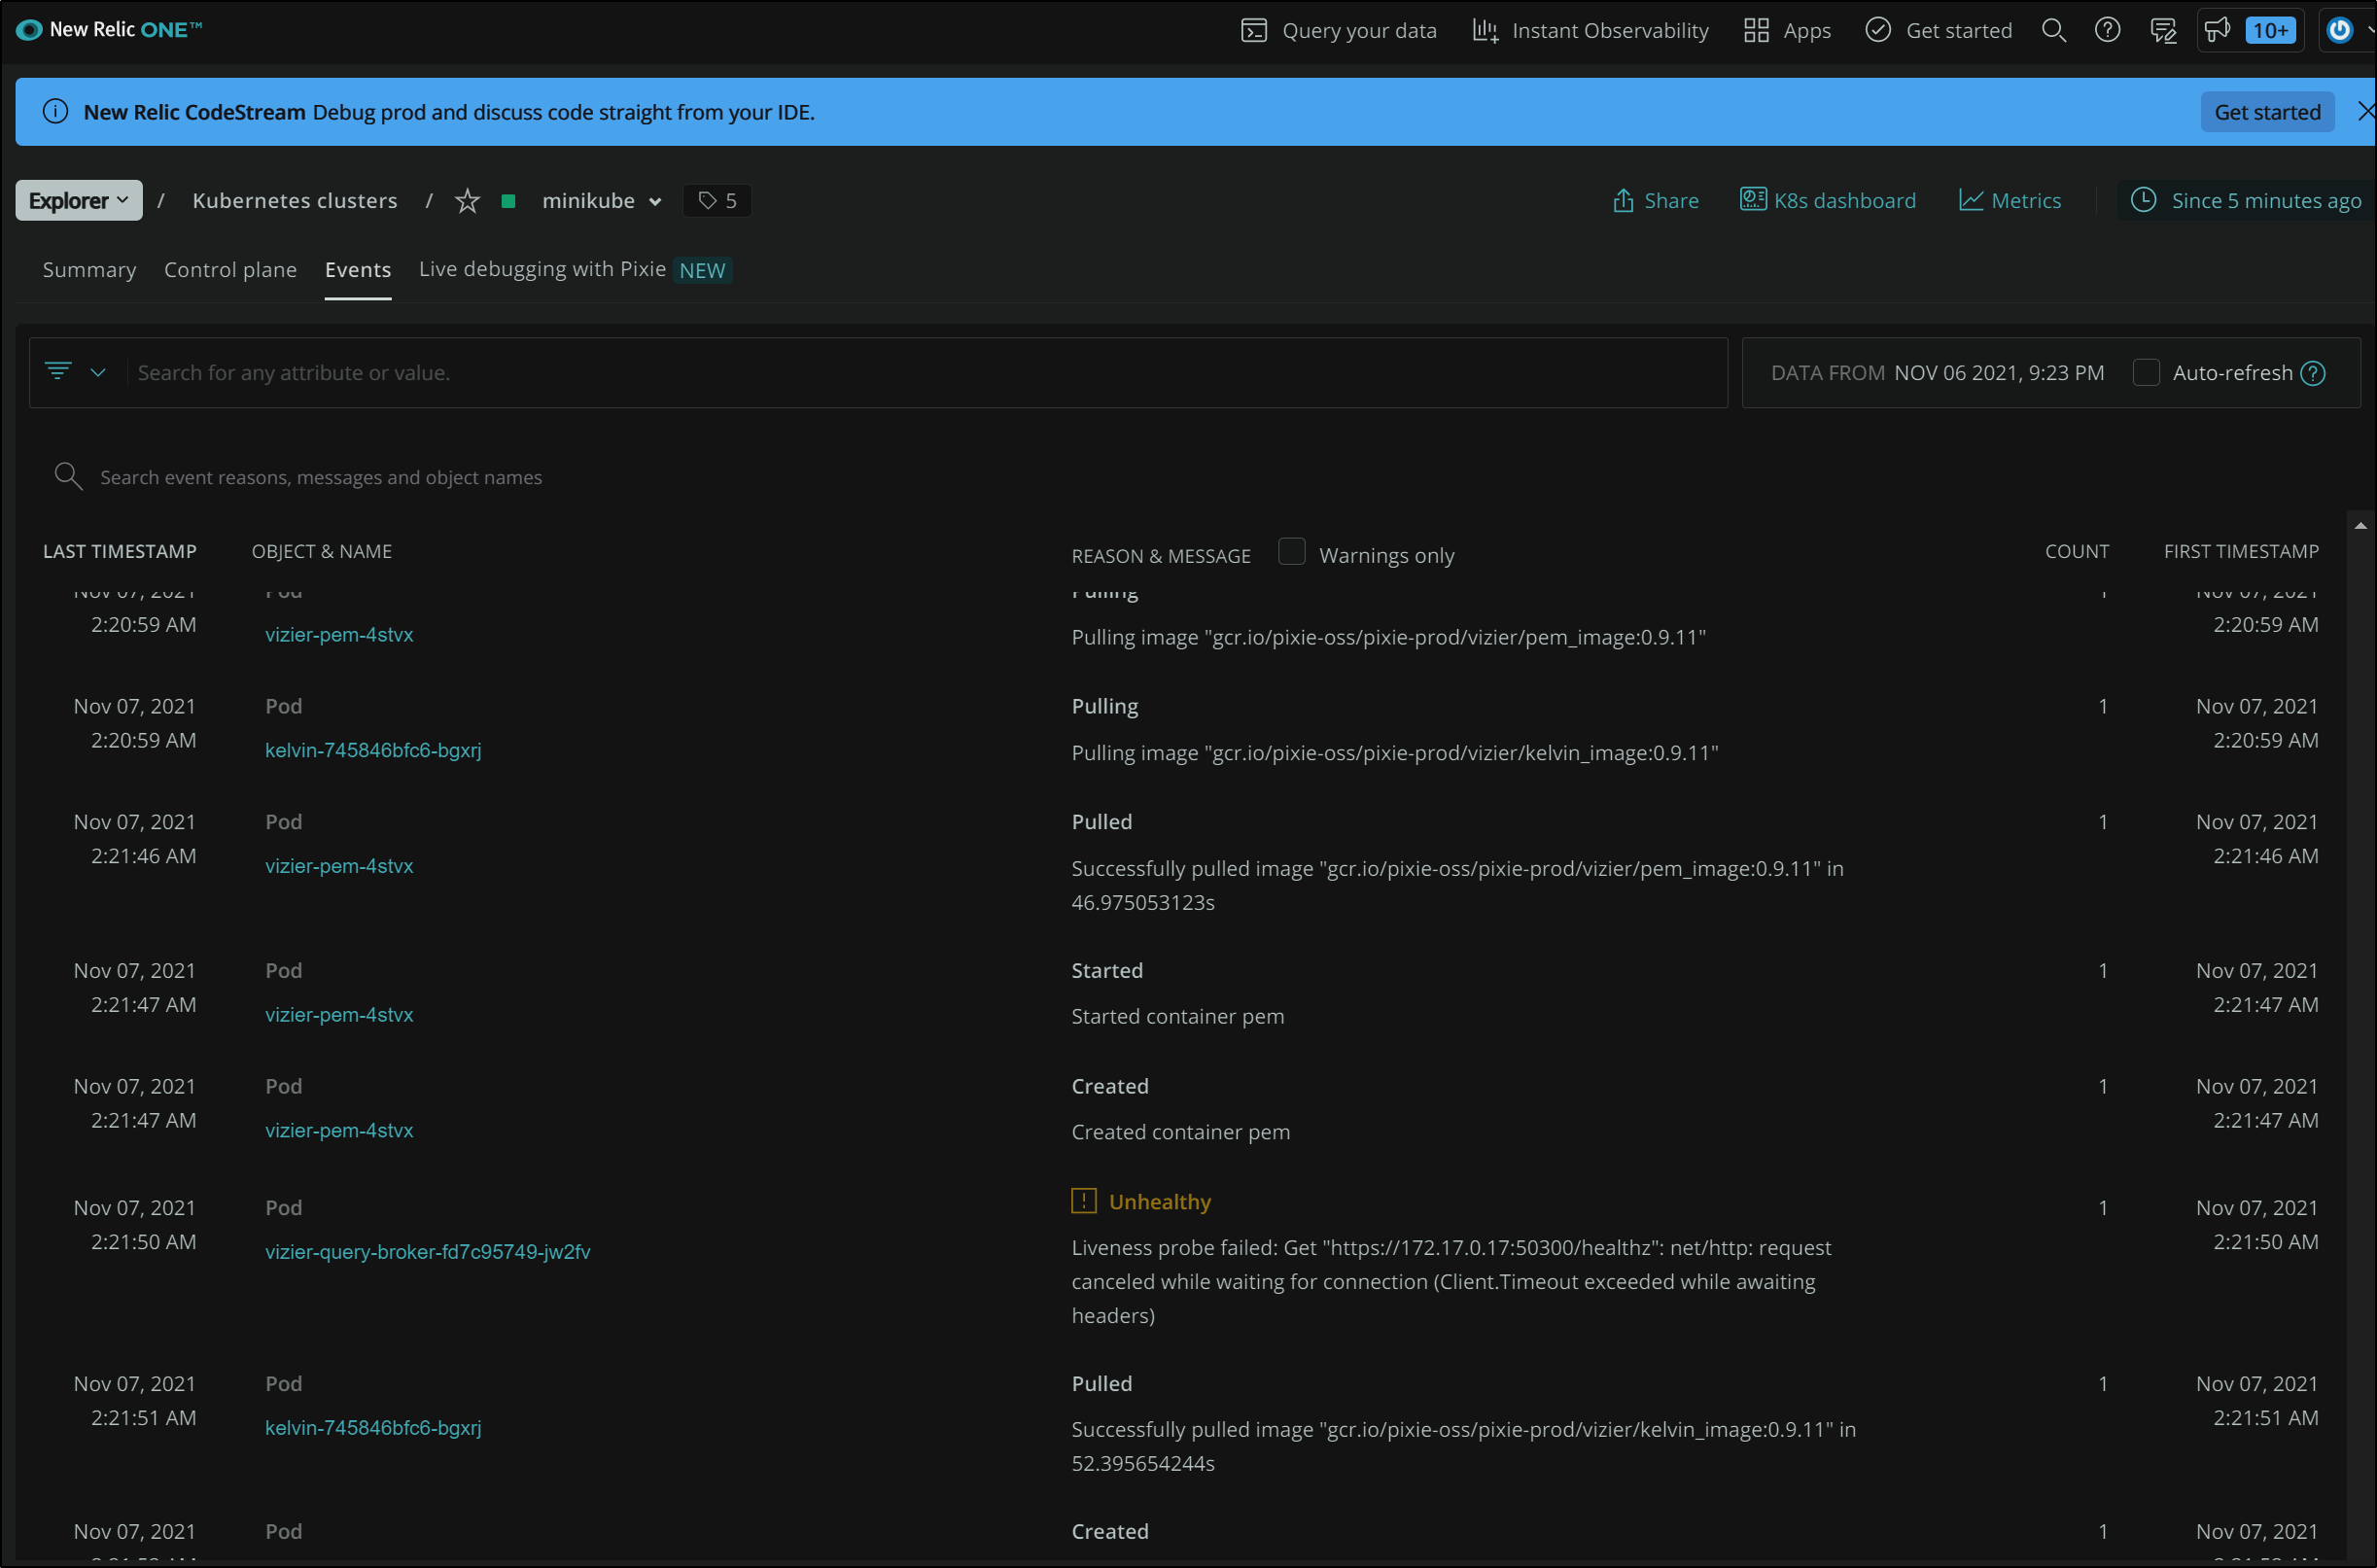
We can then look at events to see a running catalogue of events.
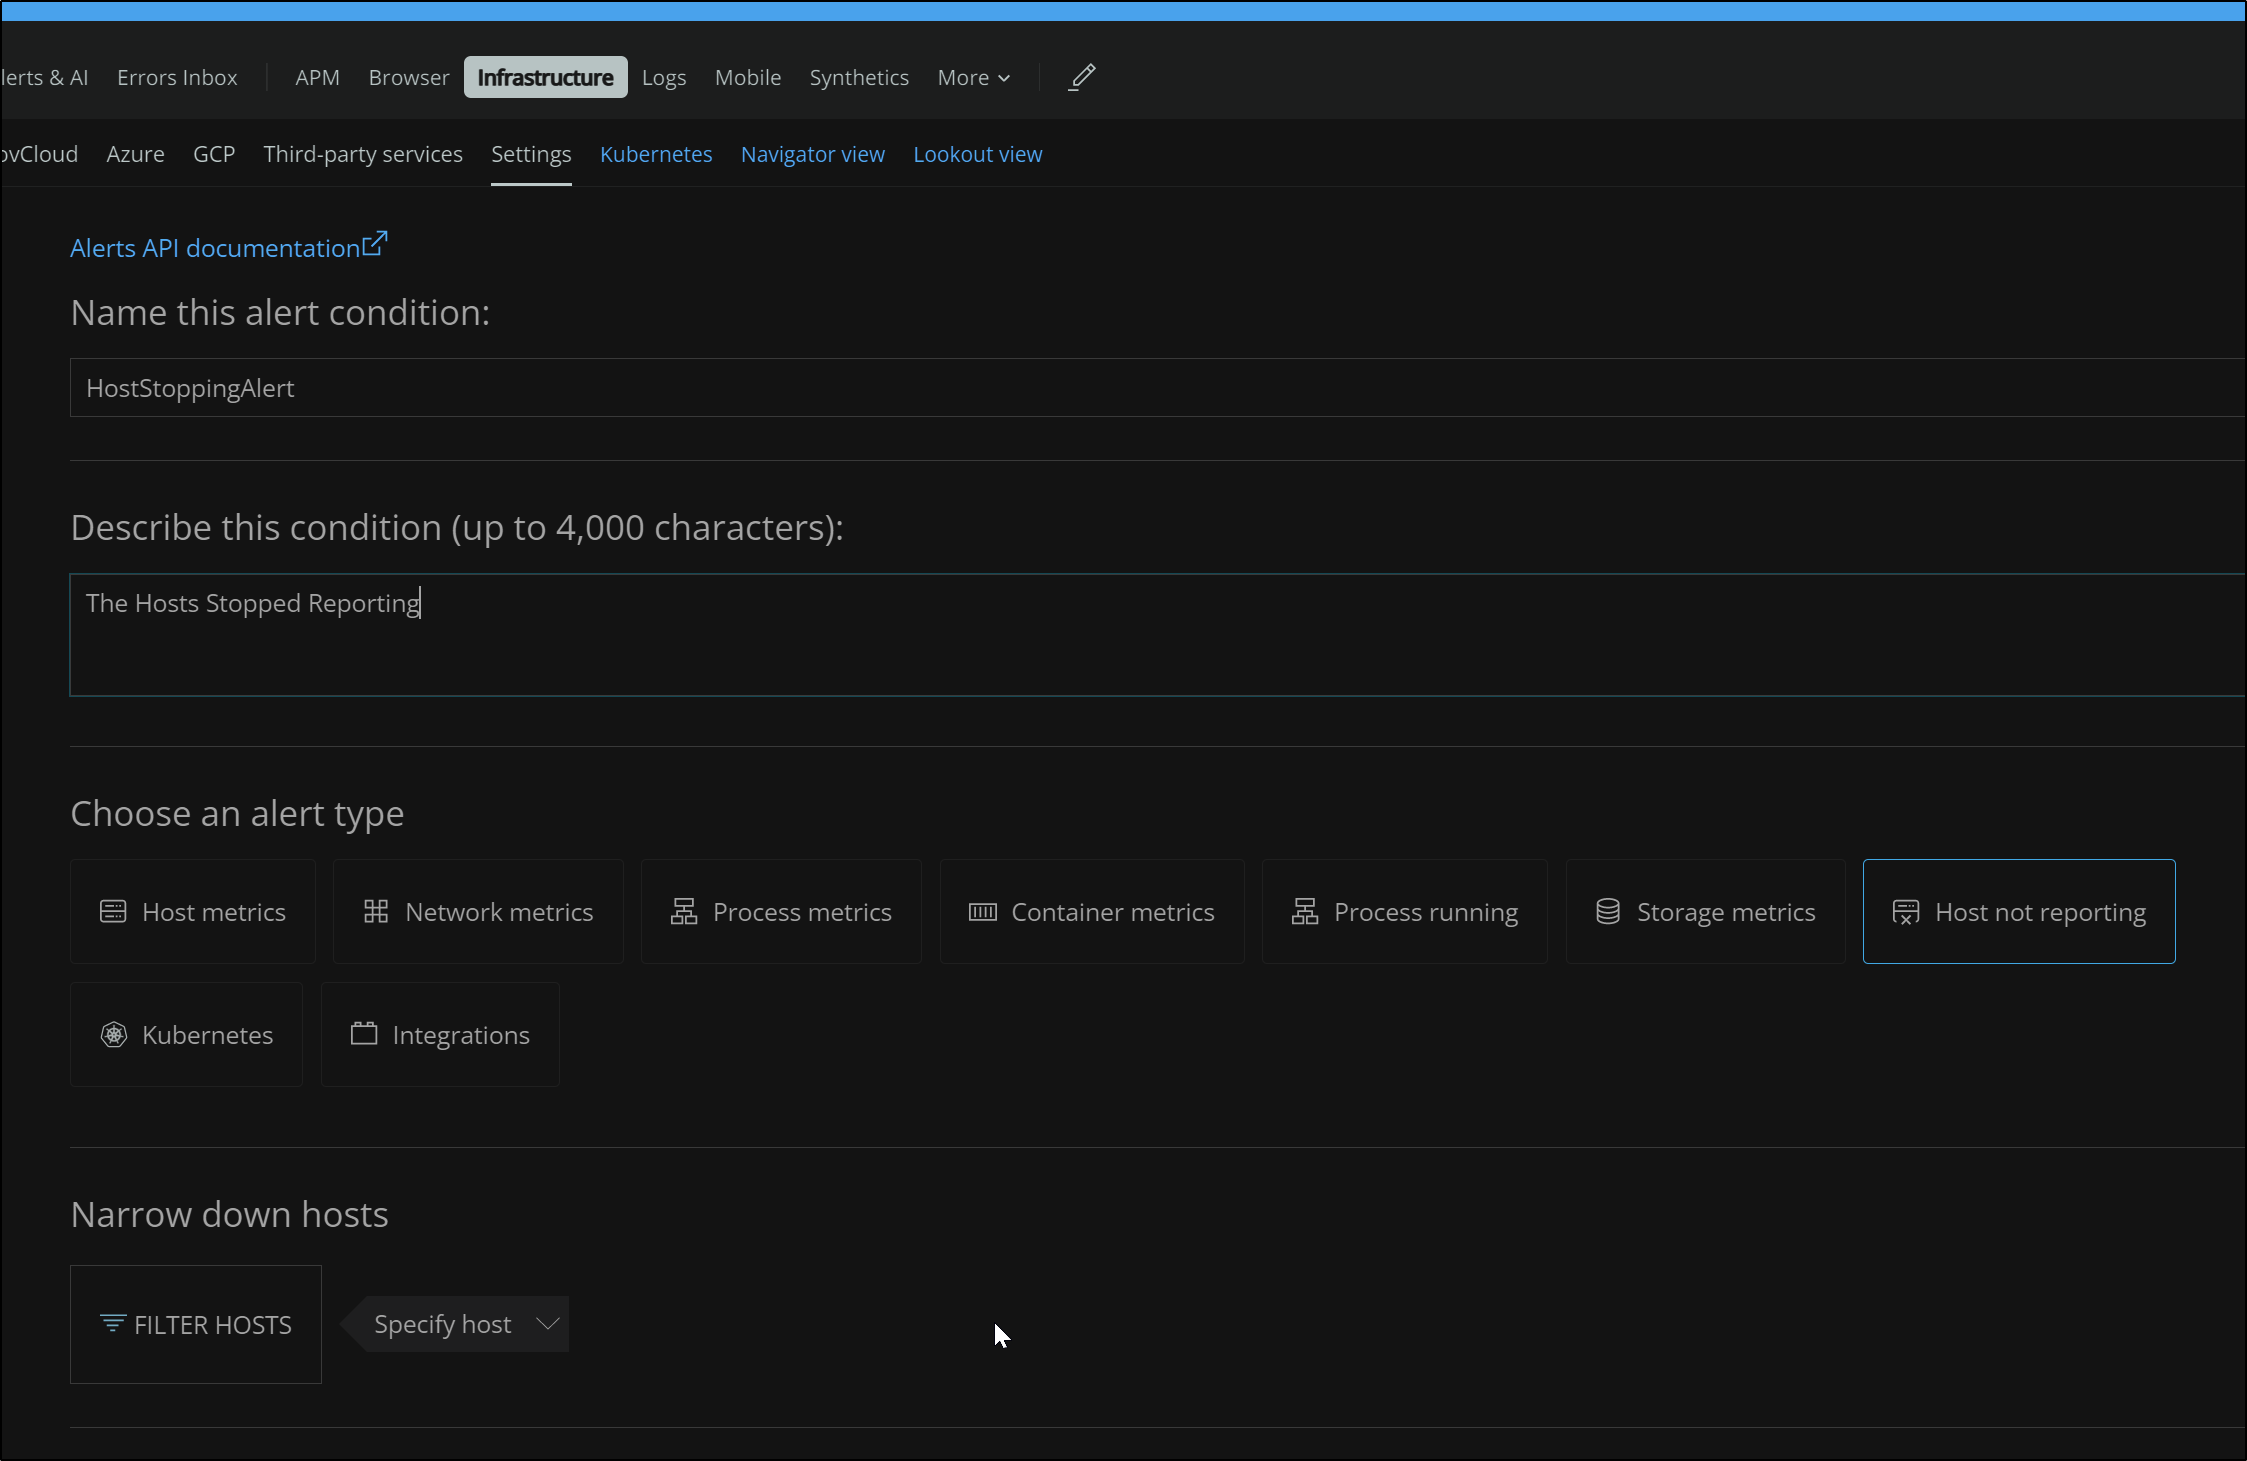
Alerts
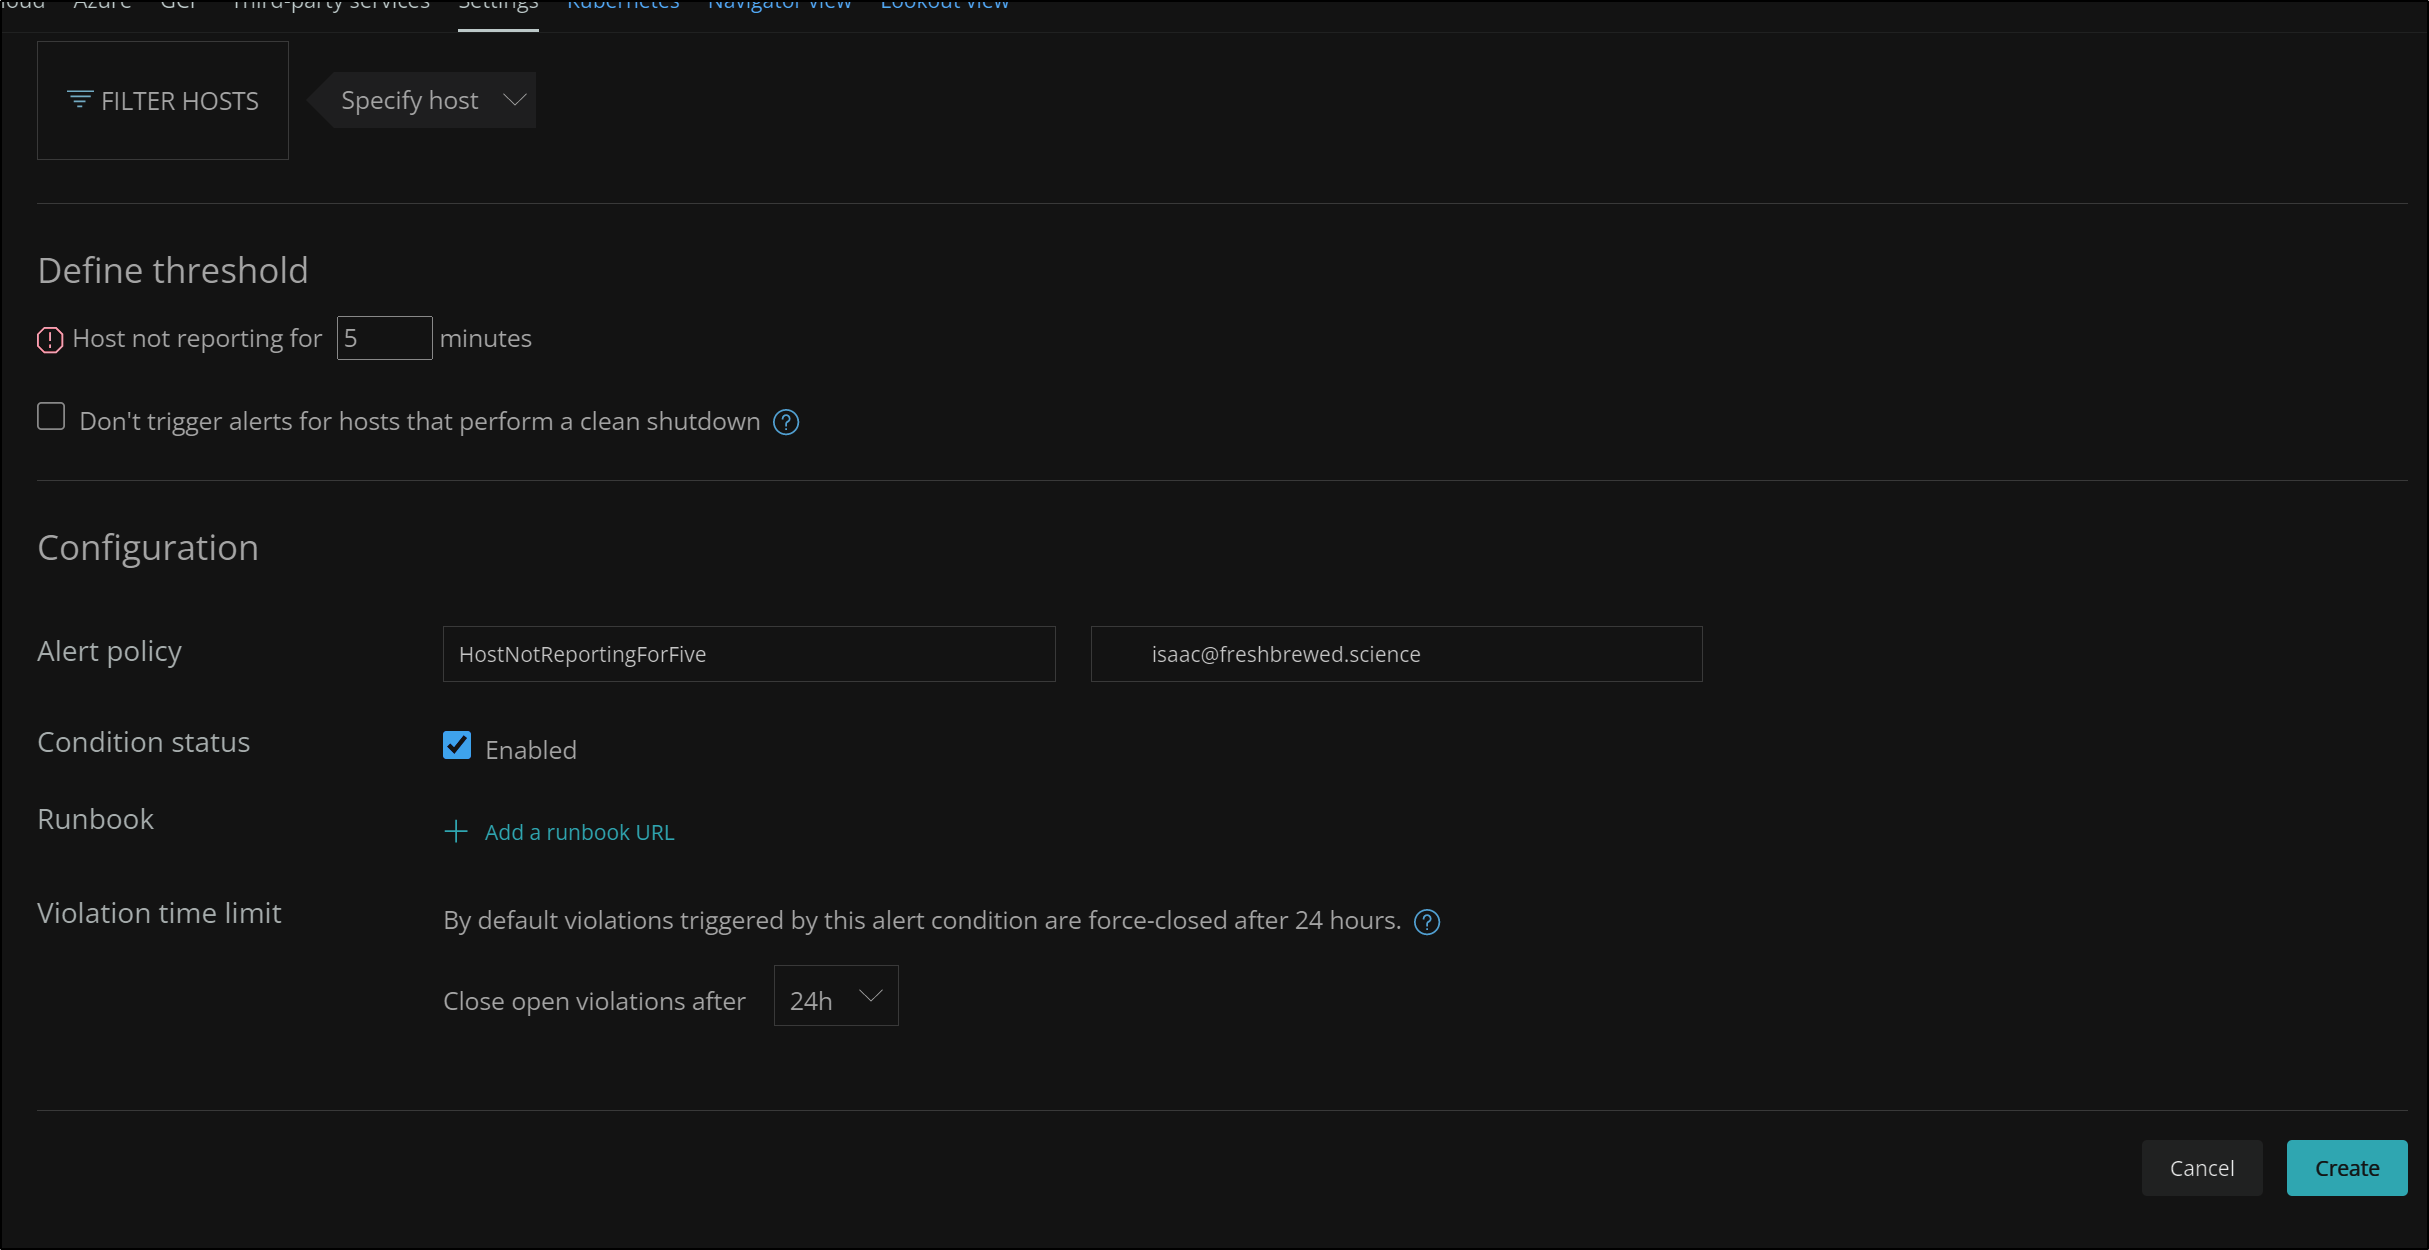
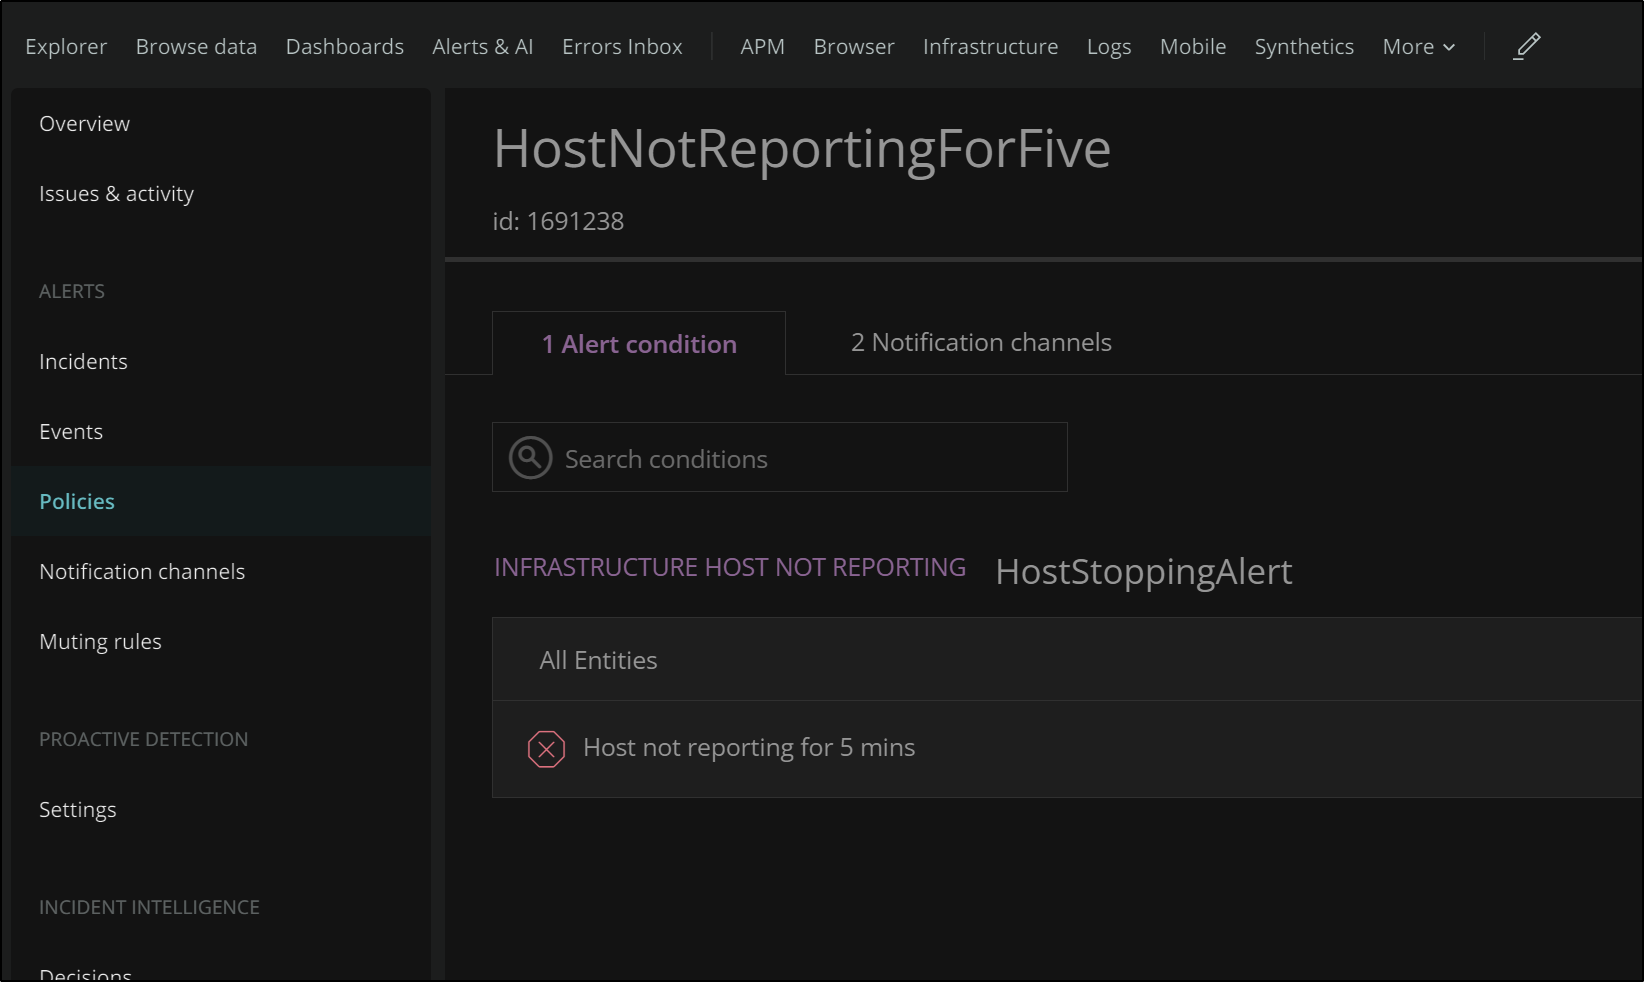
We can set up alerts under Infrastructure settings. There we can create an alert based on a metric like many tools. However, there is a predefined option that covers “Host not reporting” which is was my initial goal.
We scroll down and we can set the threshold and and create an on-the-fly notification policy for email alerts.
Later we will cover sending other kind of alerts.
Once saved, we can see the alert defined in our Alerts page.
Triggering an alert
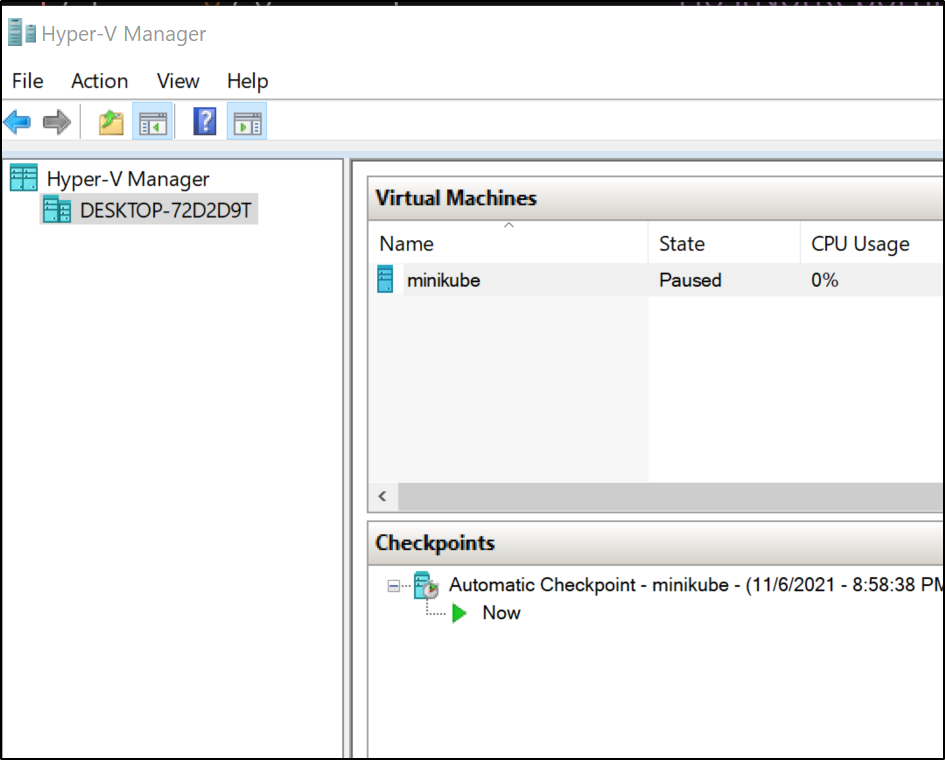
In Hyper-V I paused the cluster VM to force an error condition.
Pretty soon I got an email about the Host Stopping:
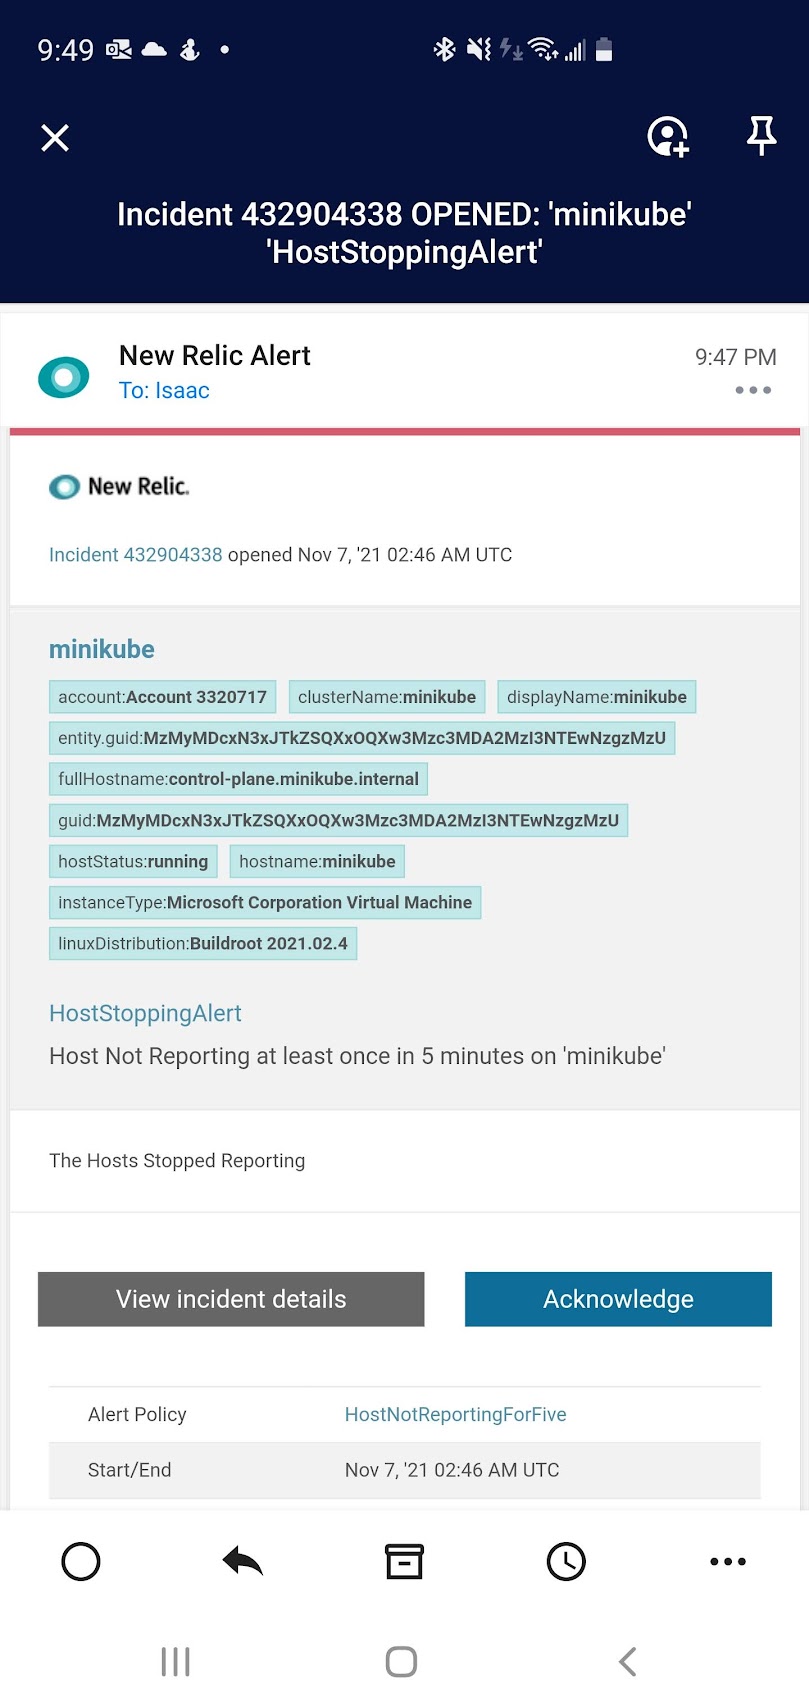
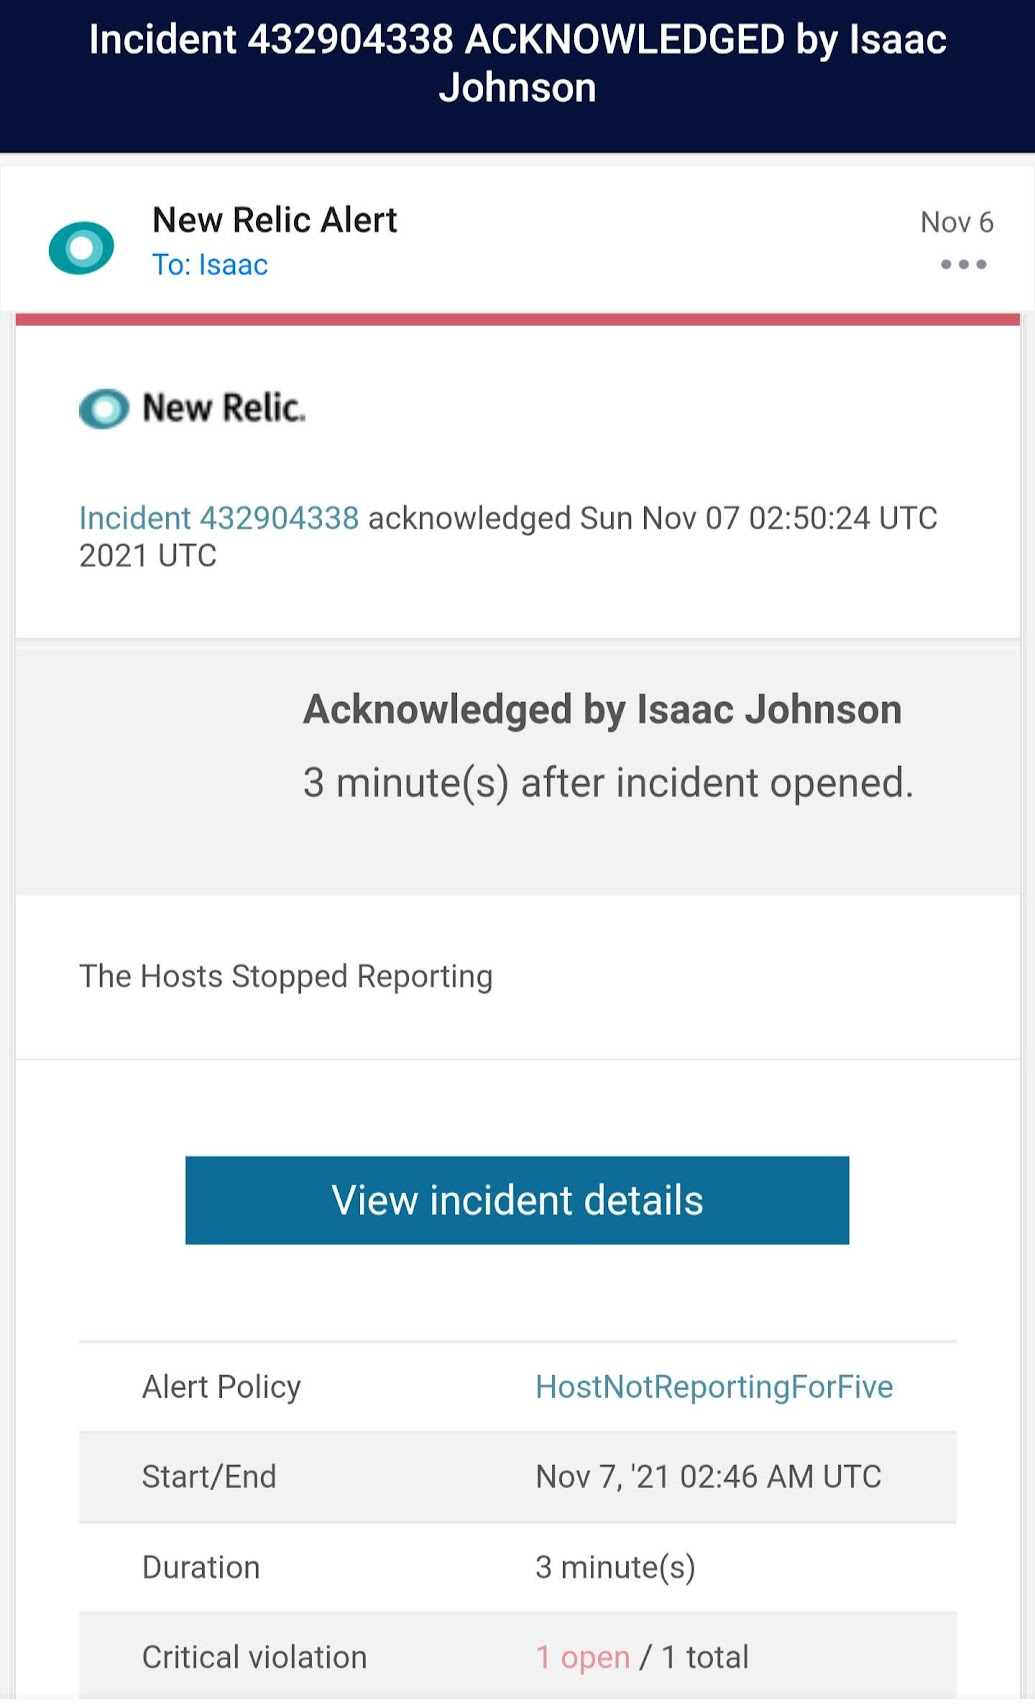
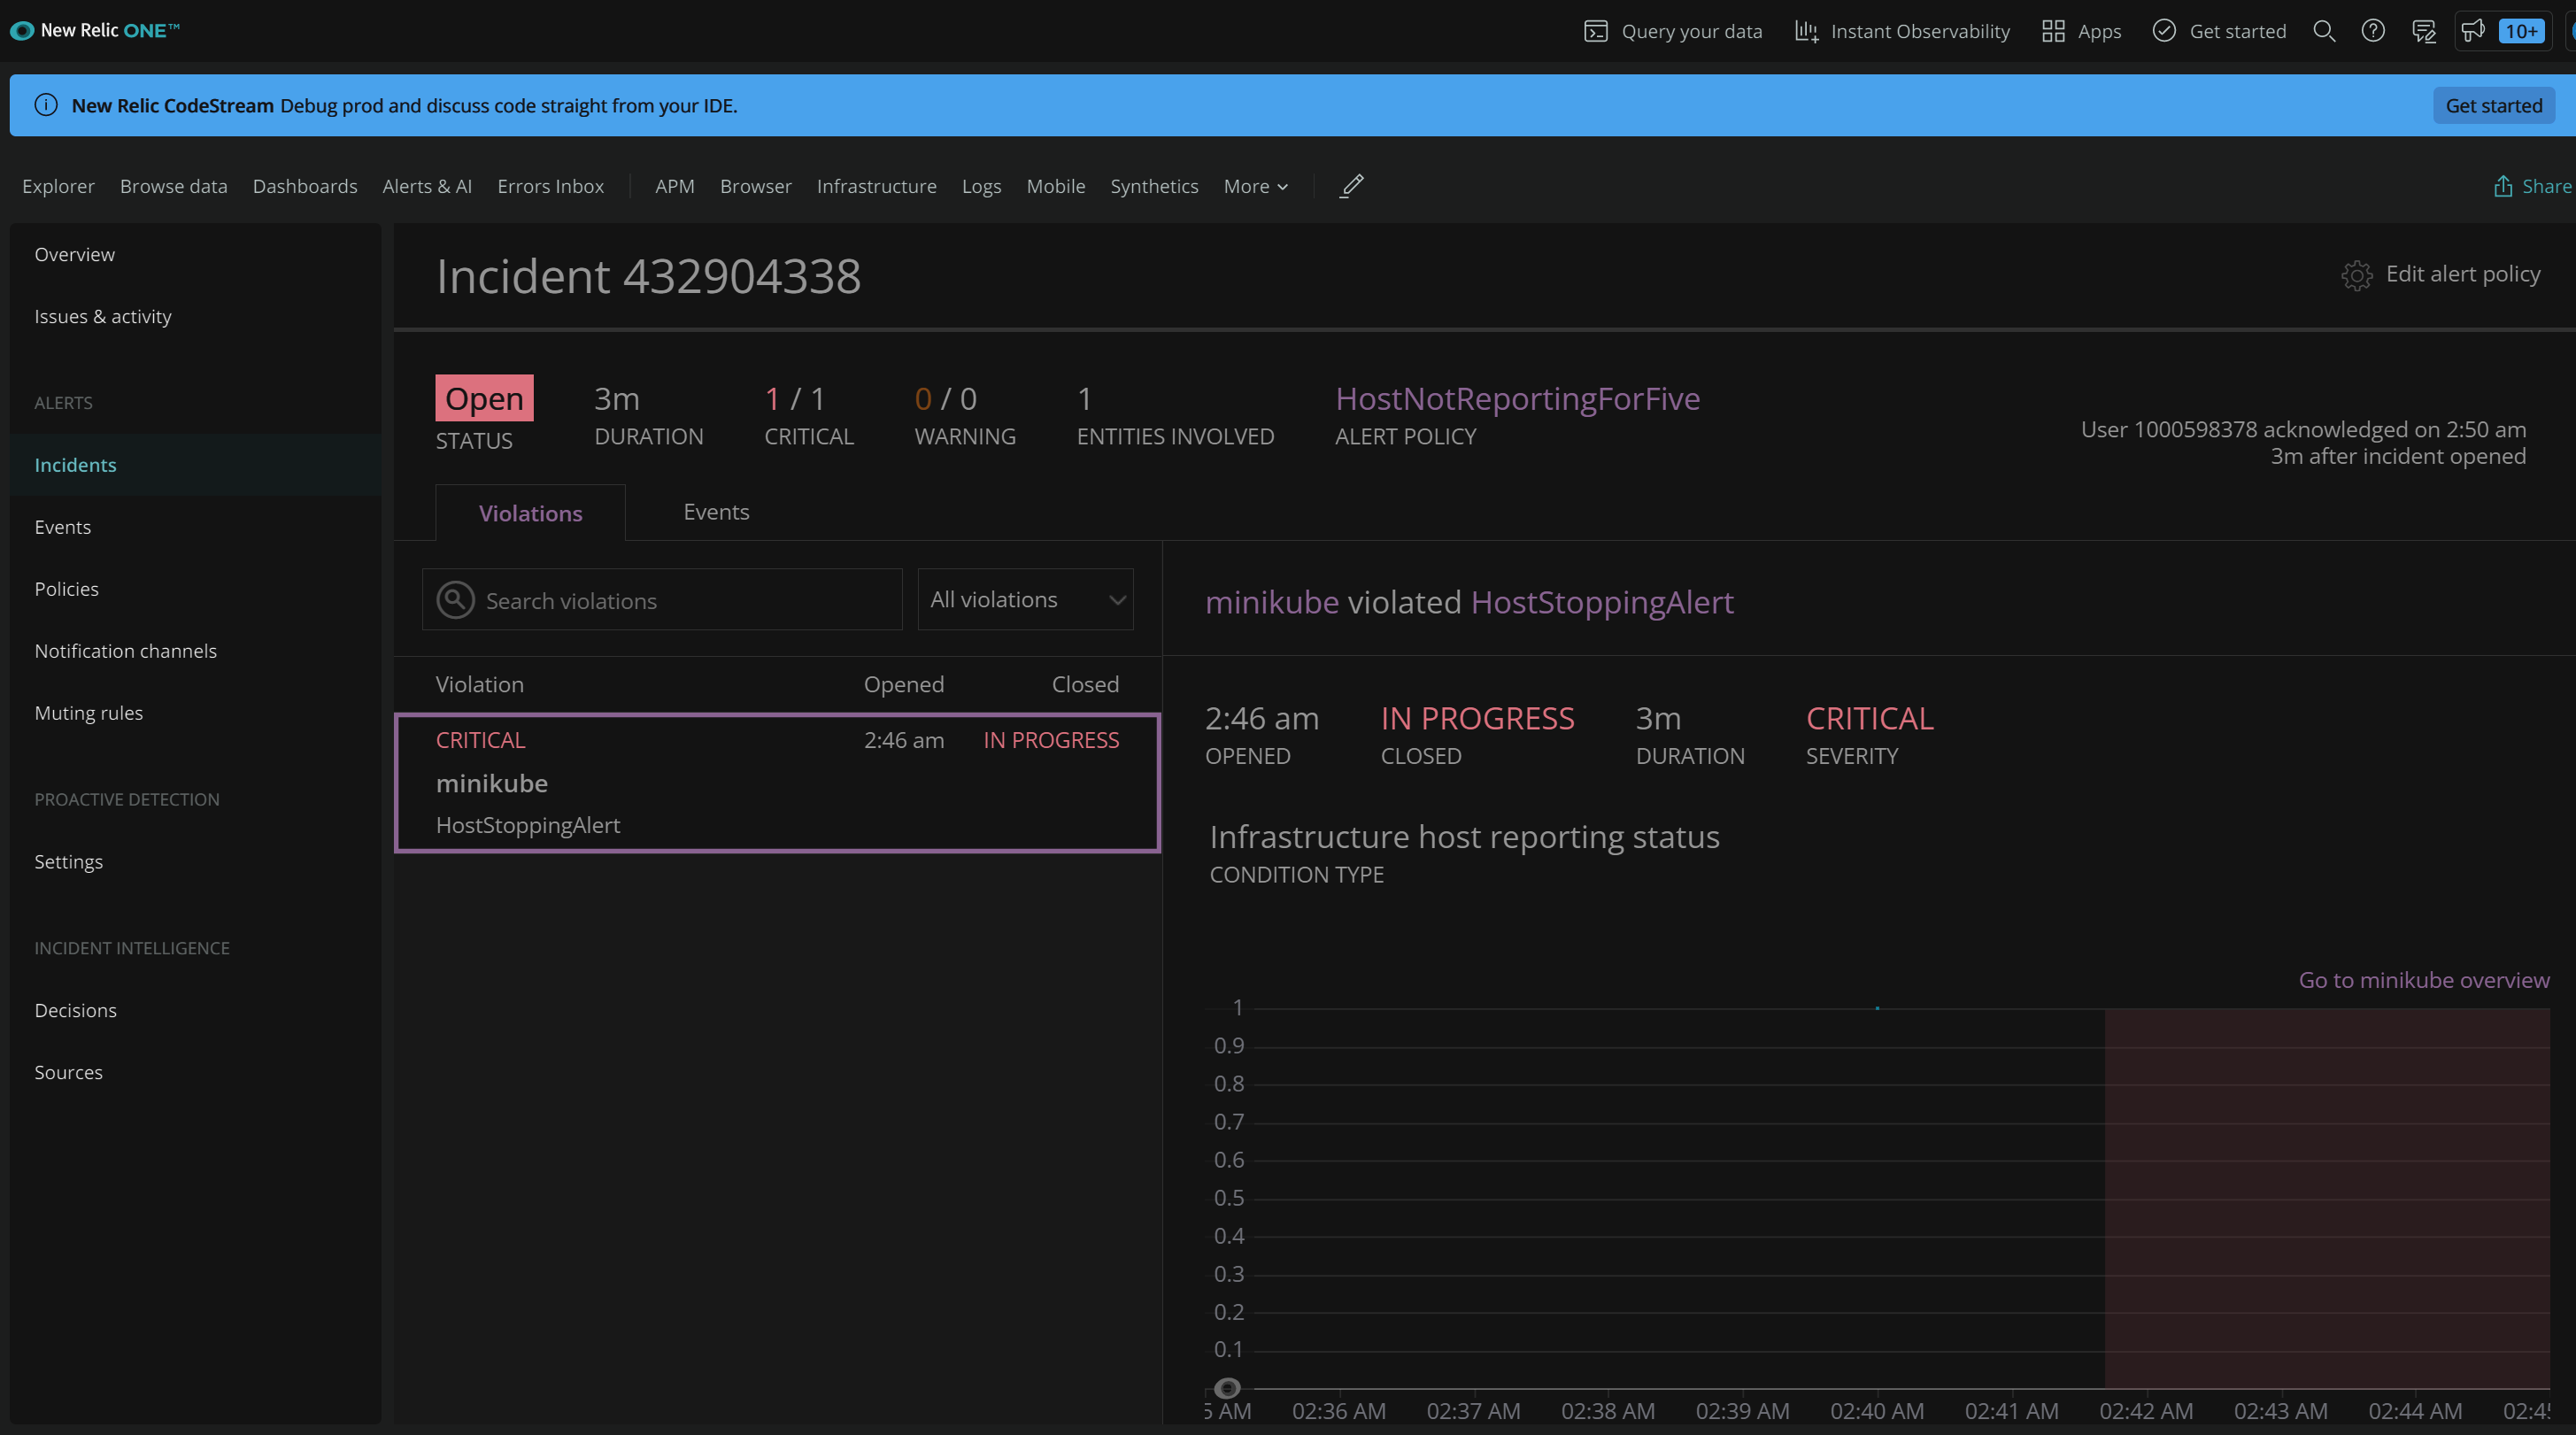
When I got the message I “Acknowledge”d it to indicate I was aware of the condition:
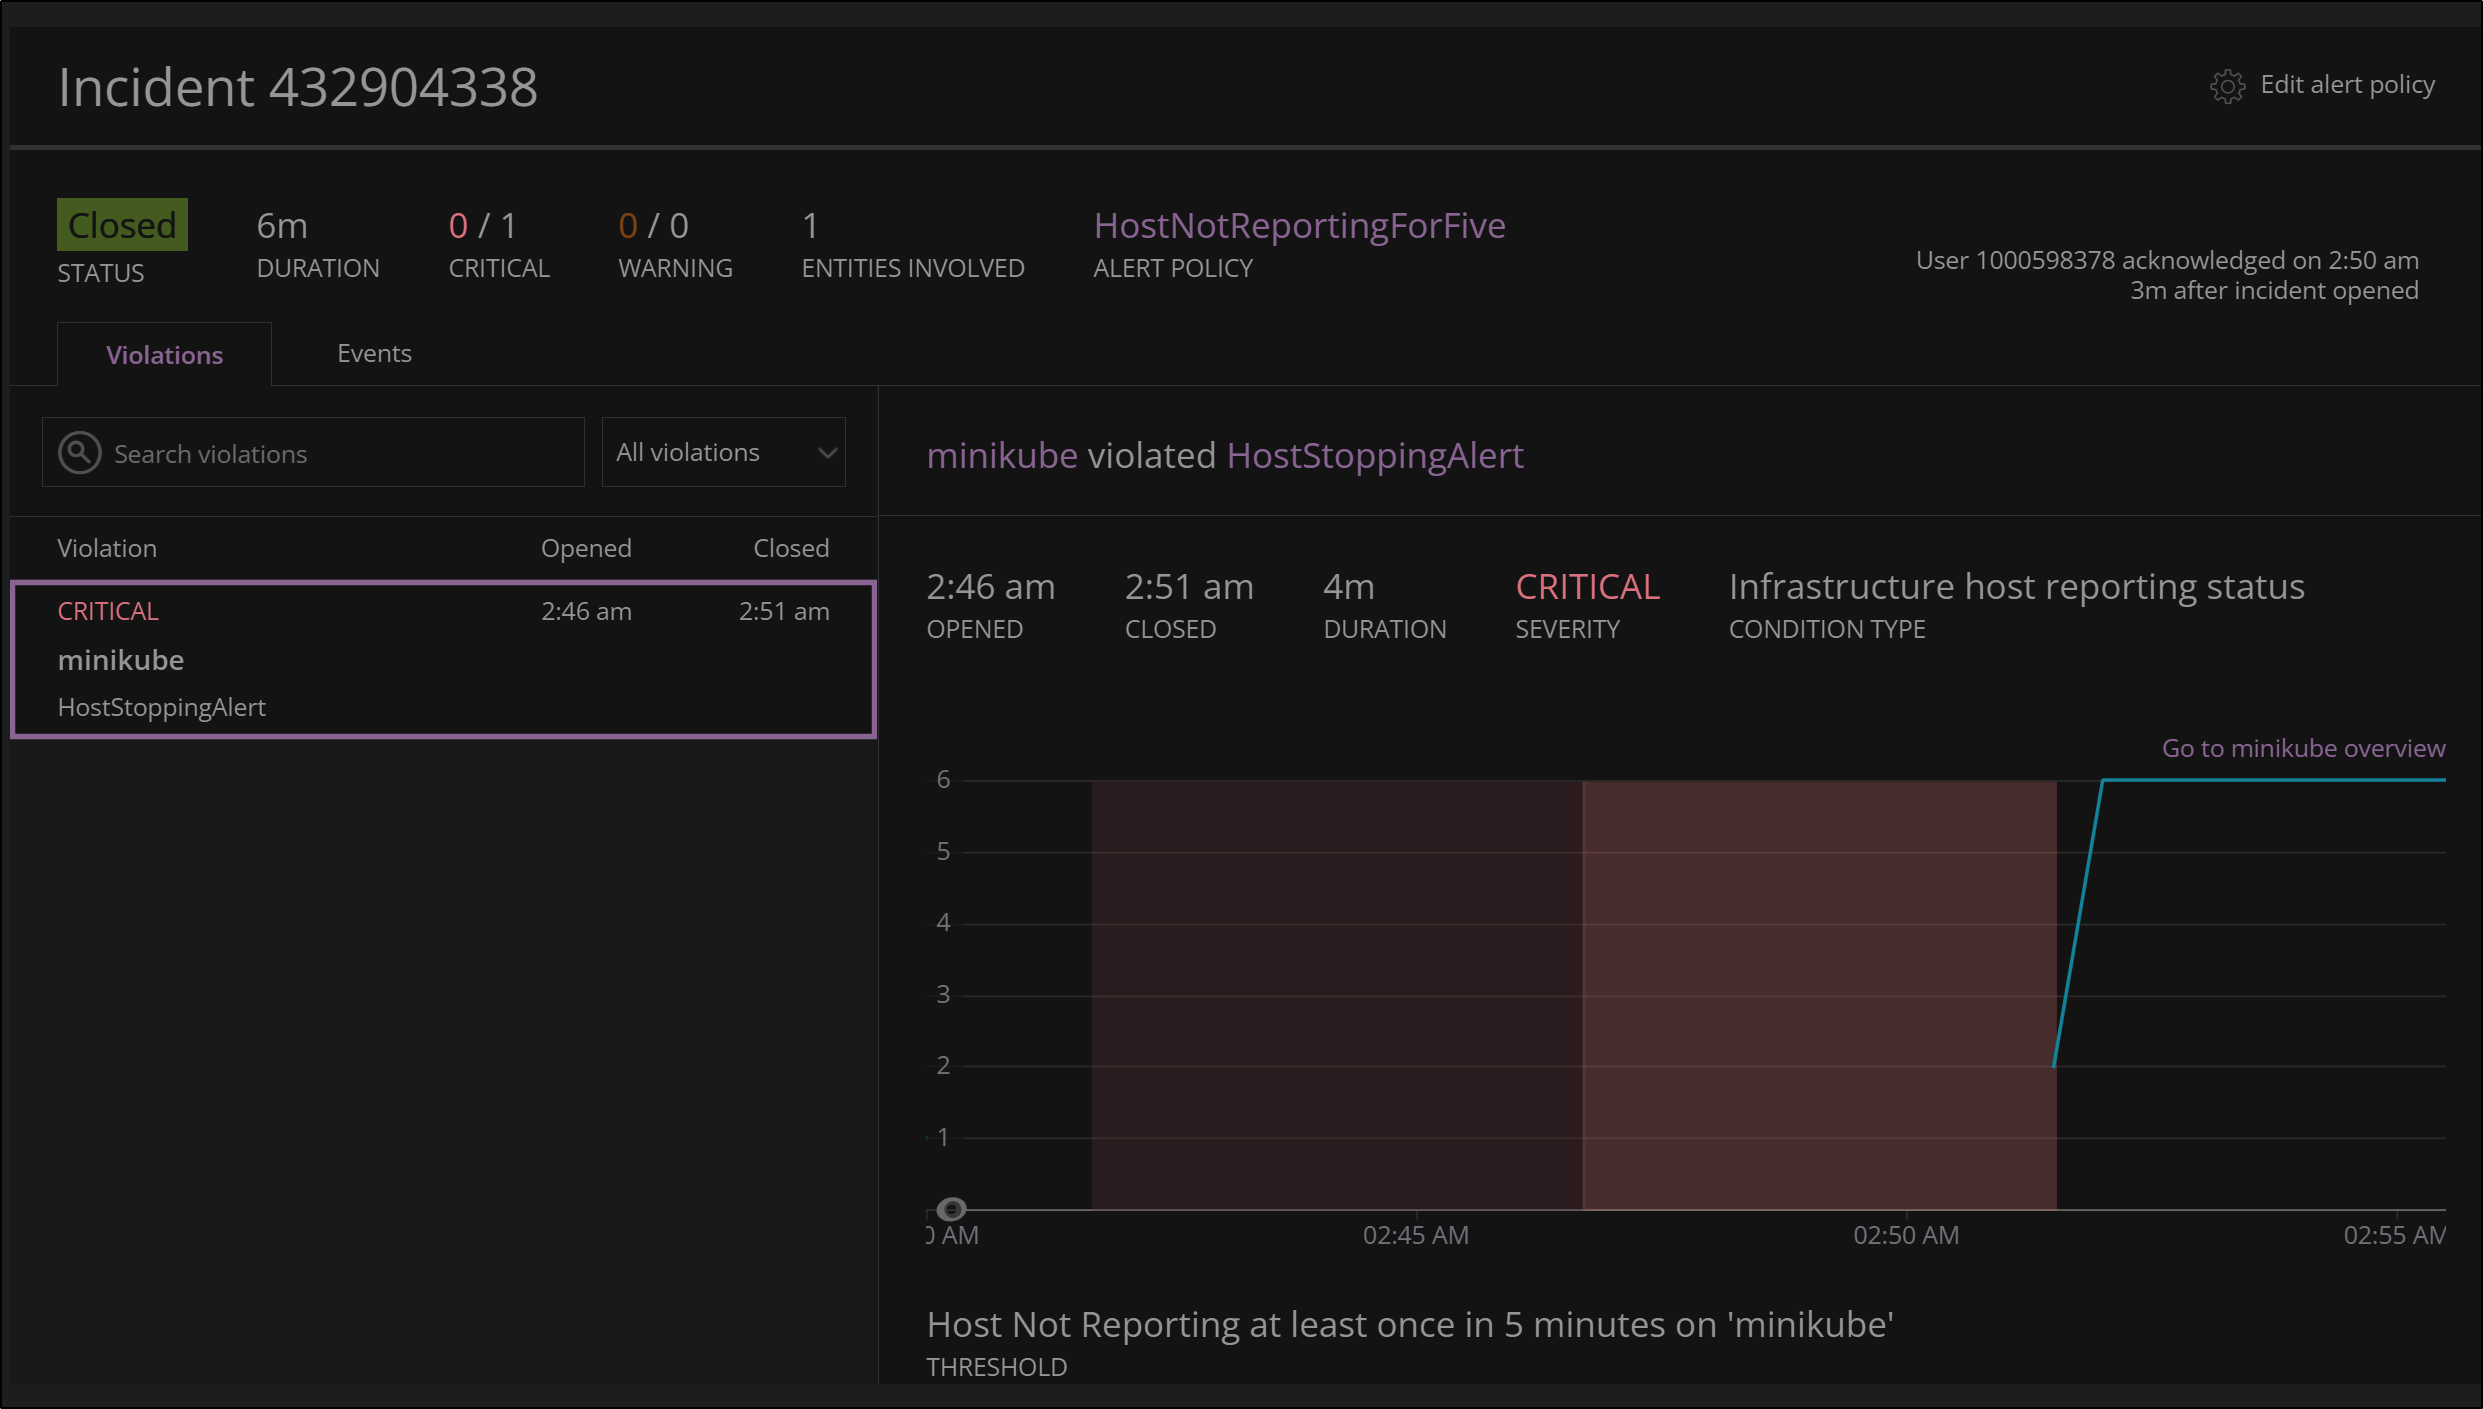
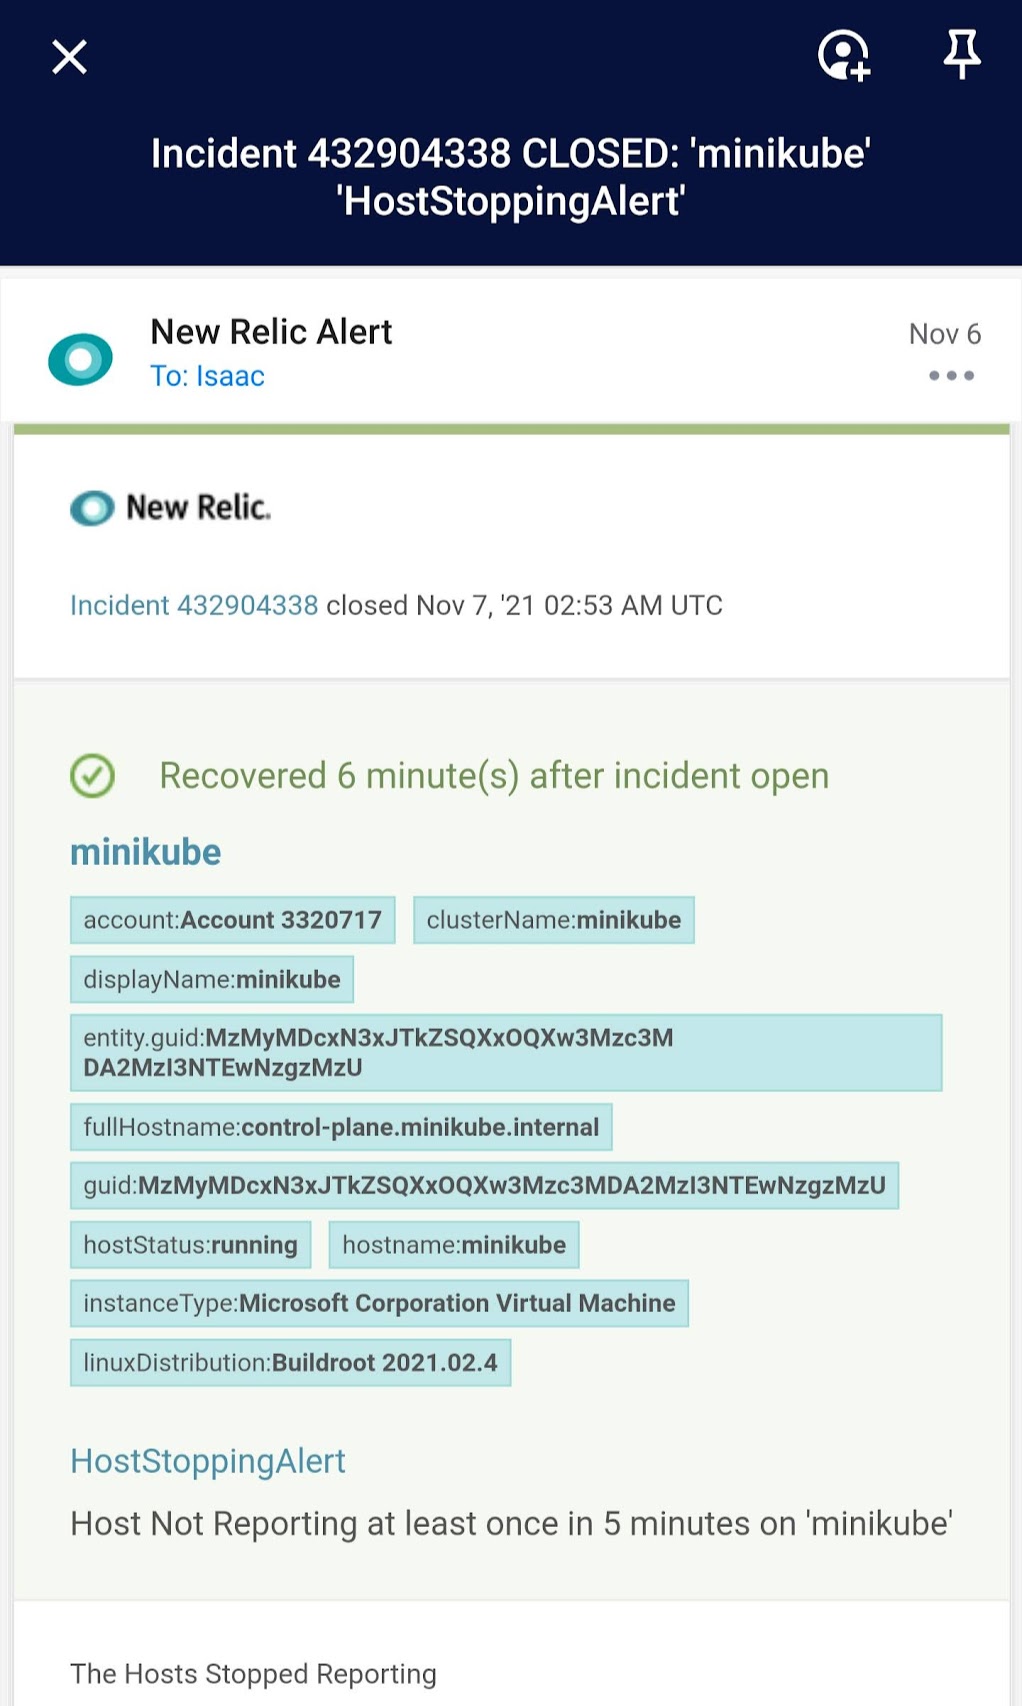
When the condition was resolved, New Relic movedt he Incident to the state of Closed:
And we got an email notification about that as well:
We can then see Incident under Incidents in New Relic
Adding more Notification channels
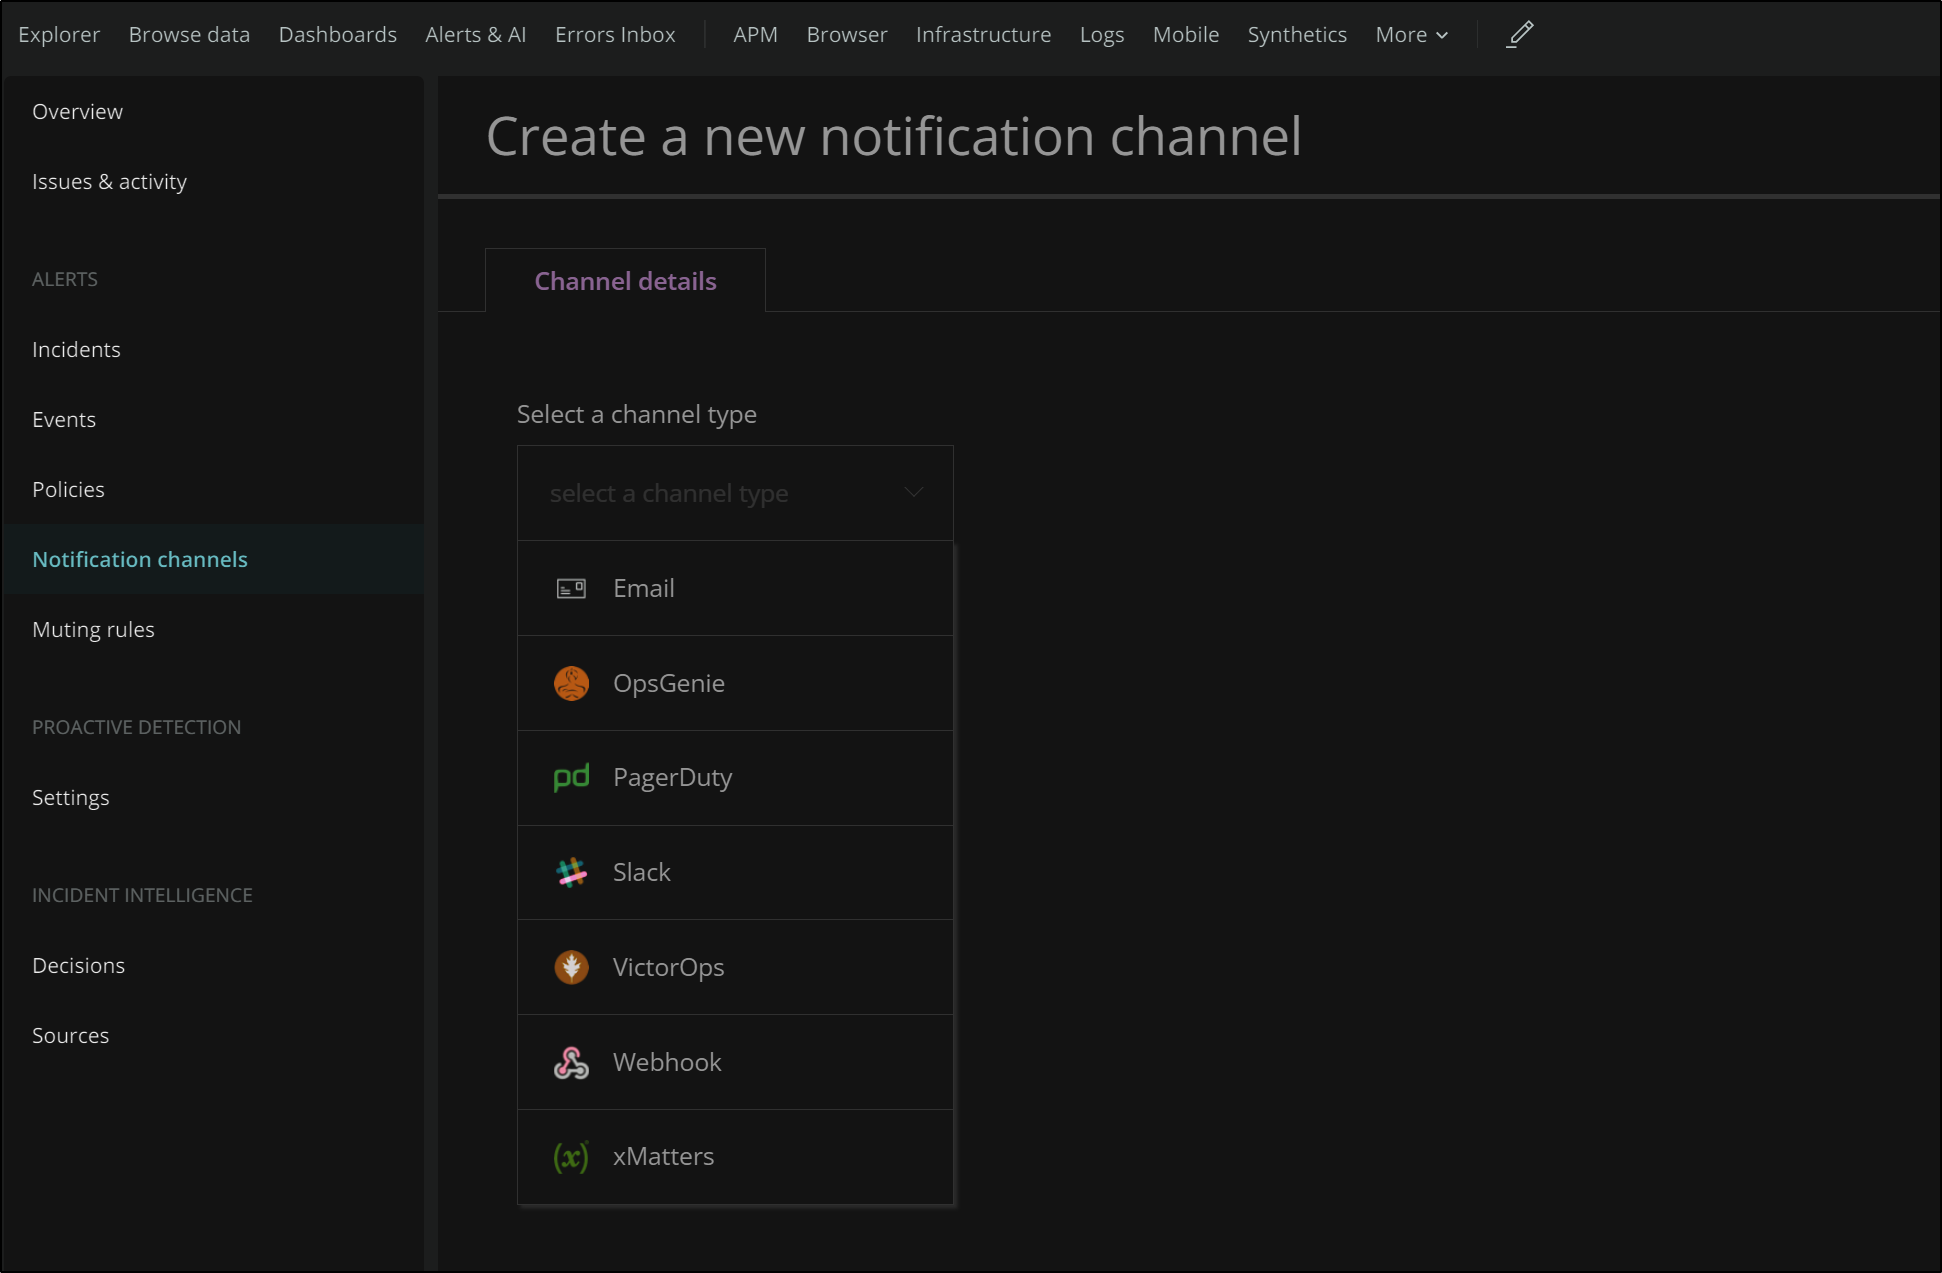
Email might be sufficient in some cases, but what if we want to page our Ops team using something like Pagerduty or OpsGenie?
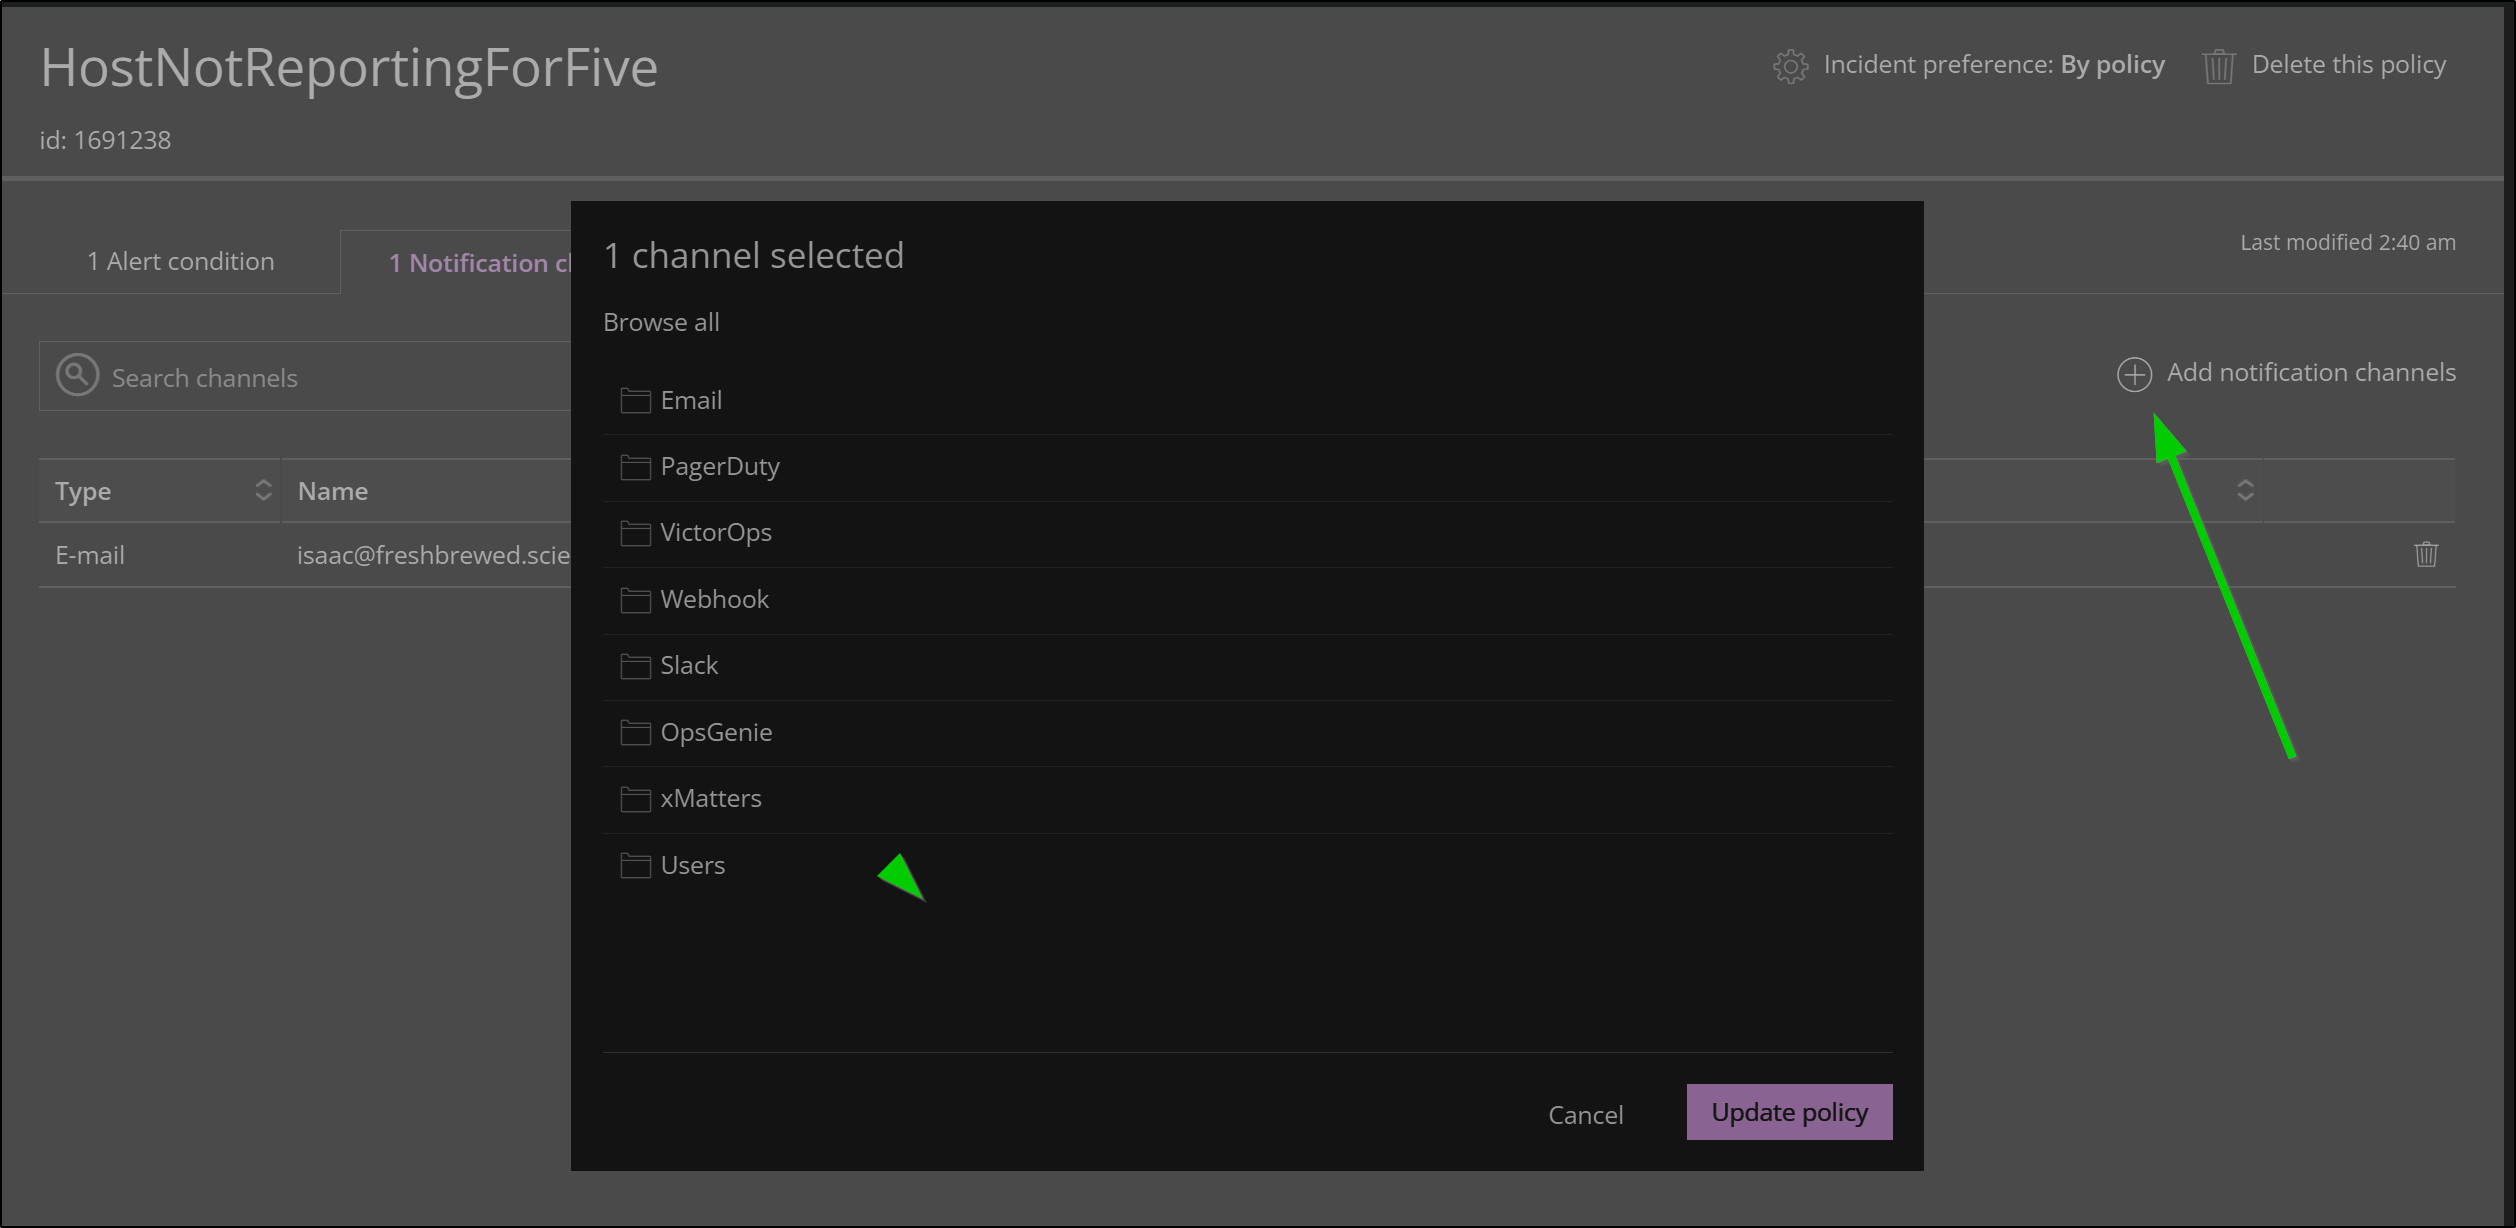
In order to create a new notification channel, we need to select from the list below. In this case we will use OpsGenie
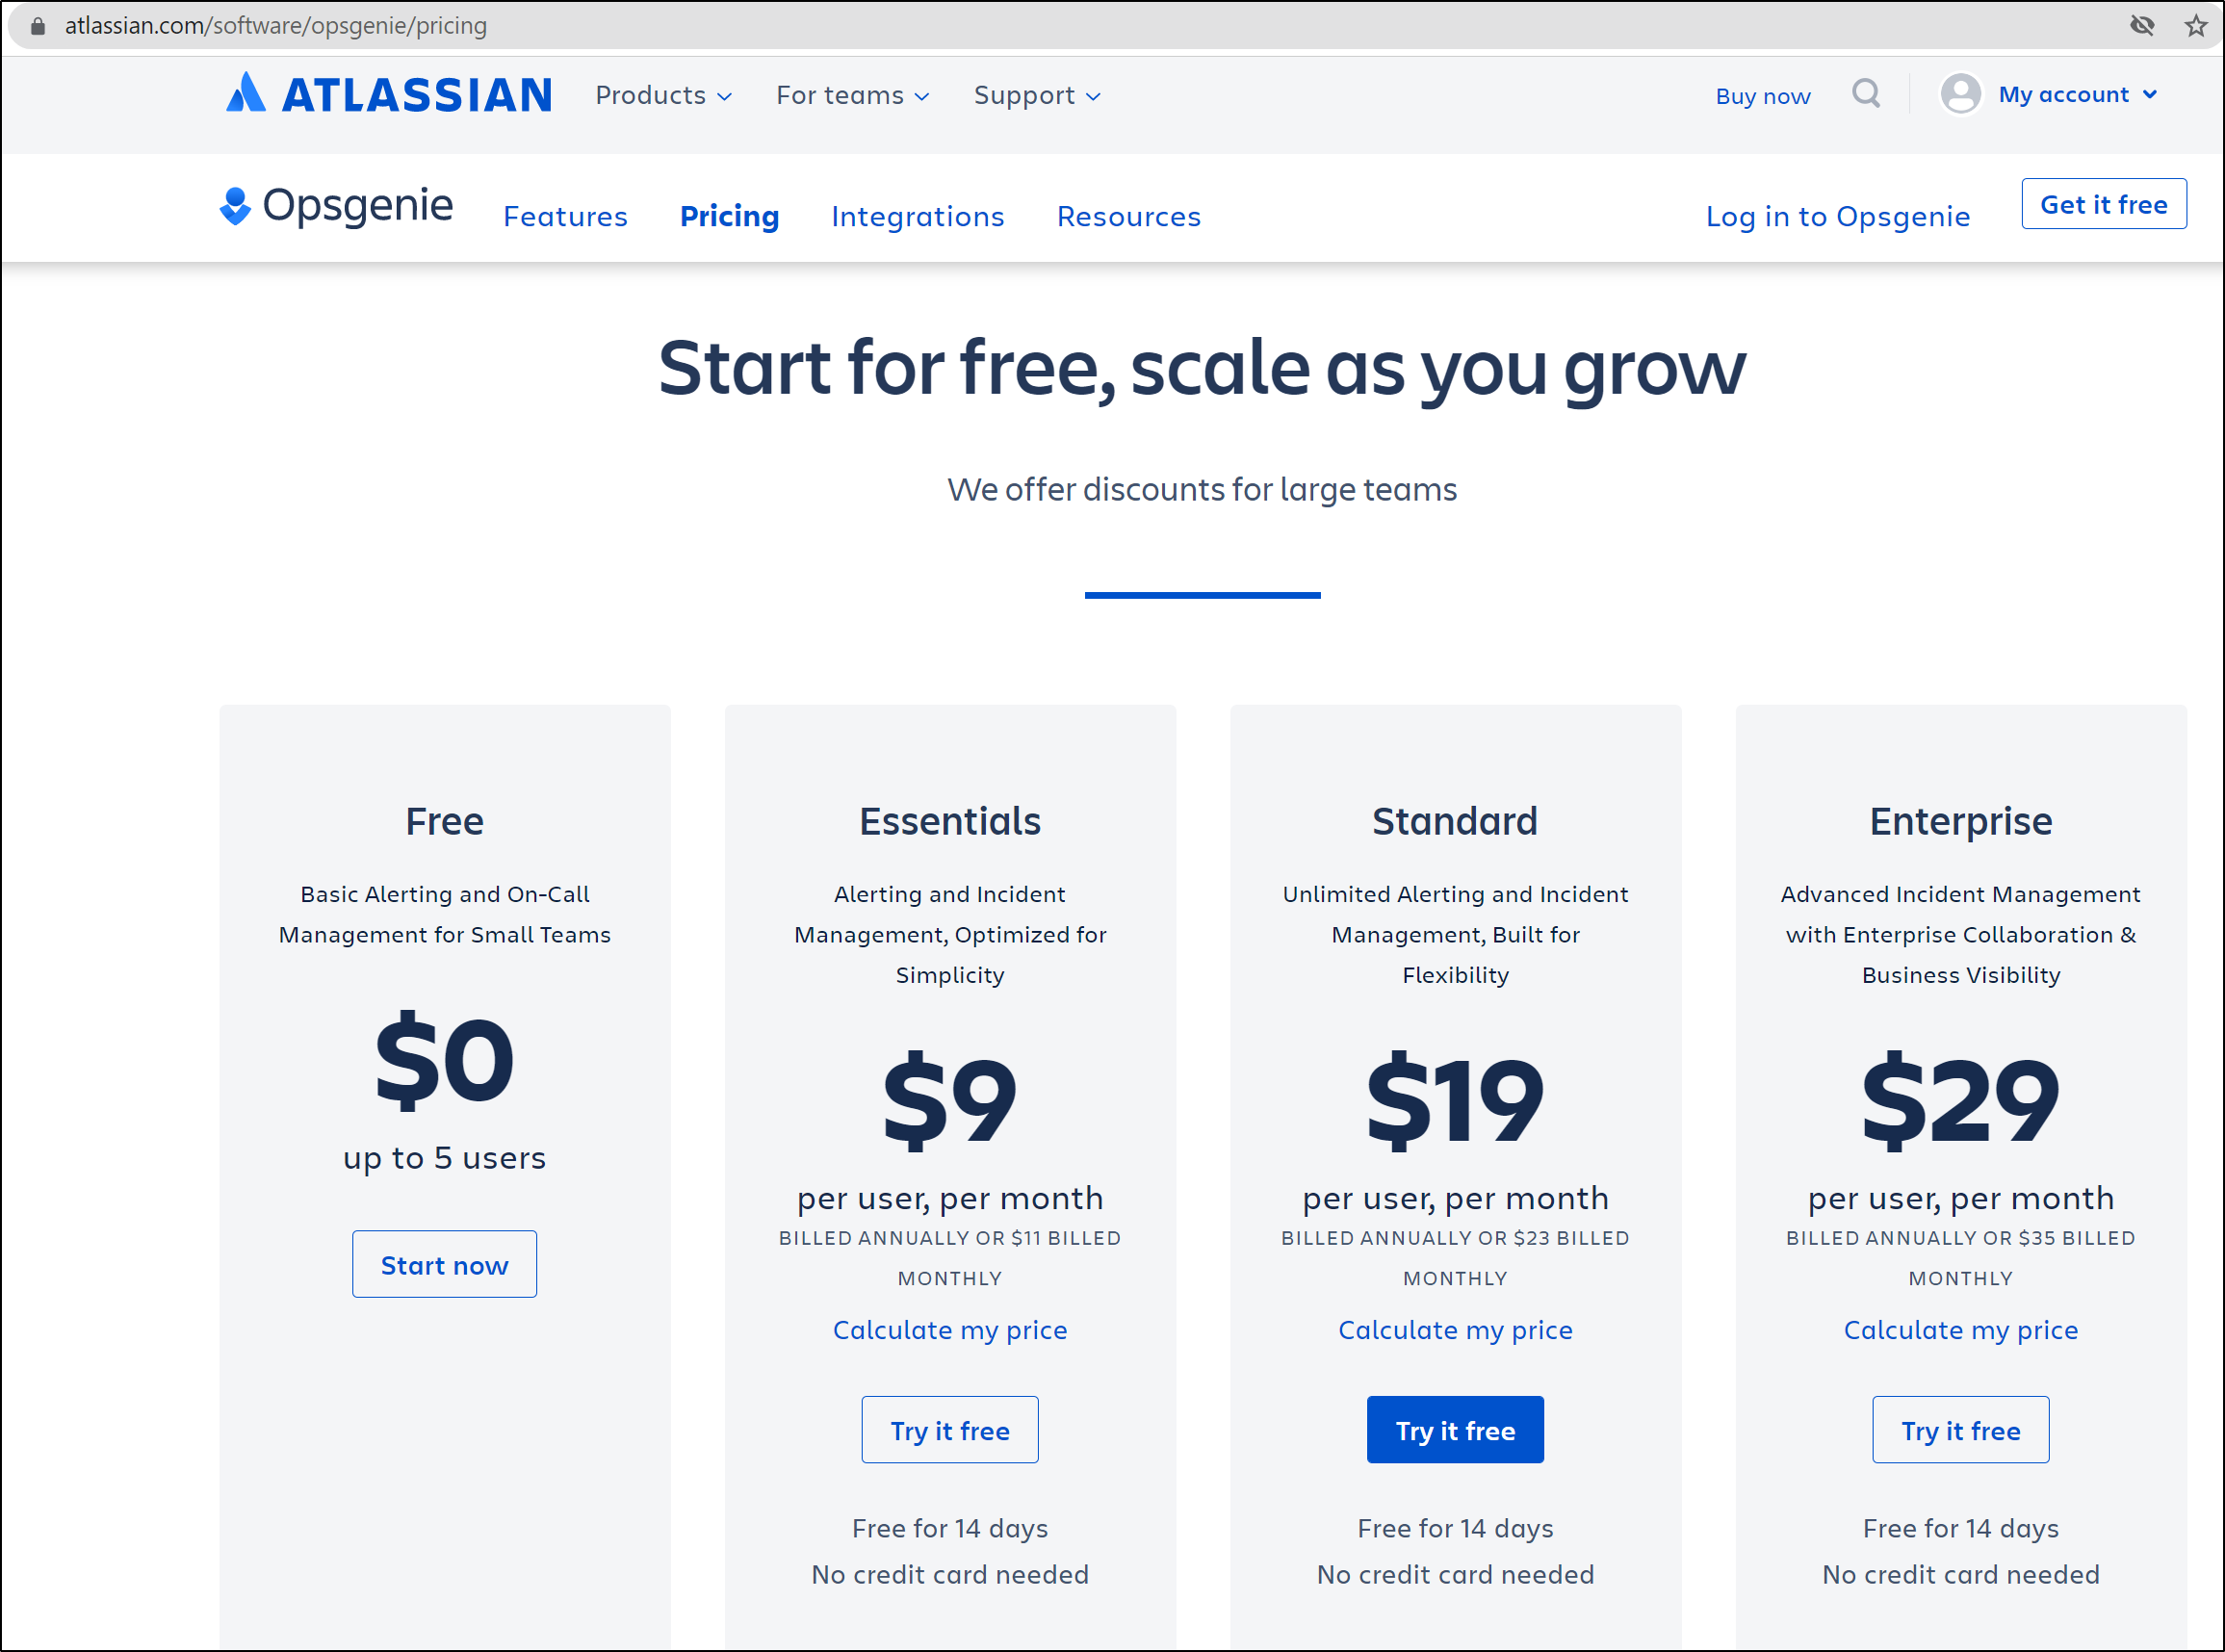
Side-step: creating a basic OpsGenie acccount
One nice thing about Atlassian products, they almost all have a small free tier. In this case, we will create a basic free OpsGenie account.
Back to New Relic, we continue the Notification Channel wizard having selected OpsGenie
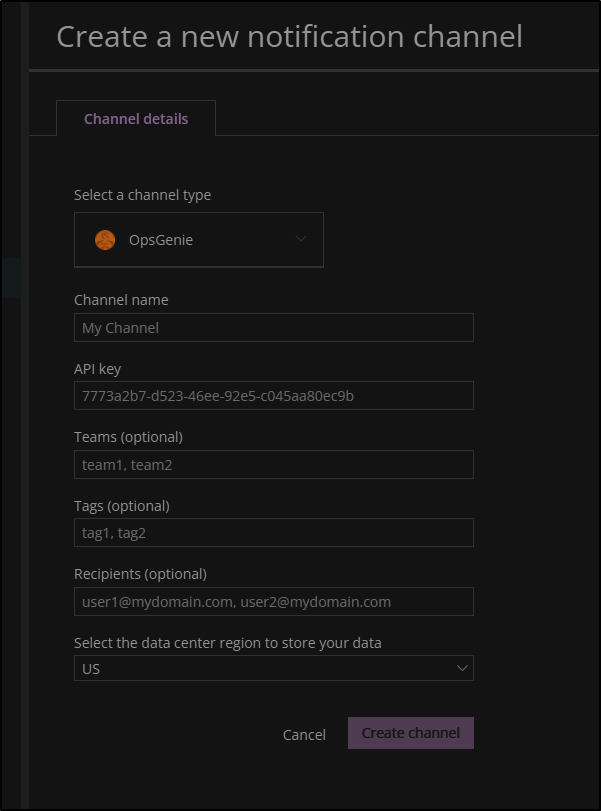
We will use our API key and if we desire, add a team and/or tag on the notification channel.
Now, back in our Alerts, we can select this OpsGenie channel we made.
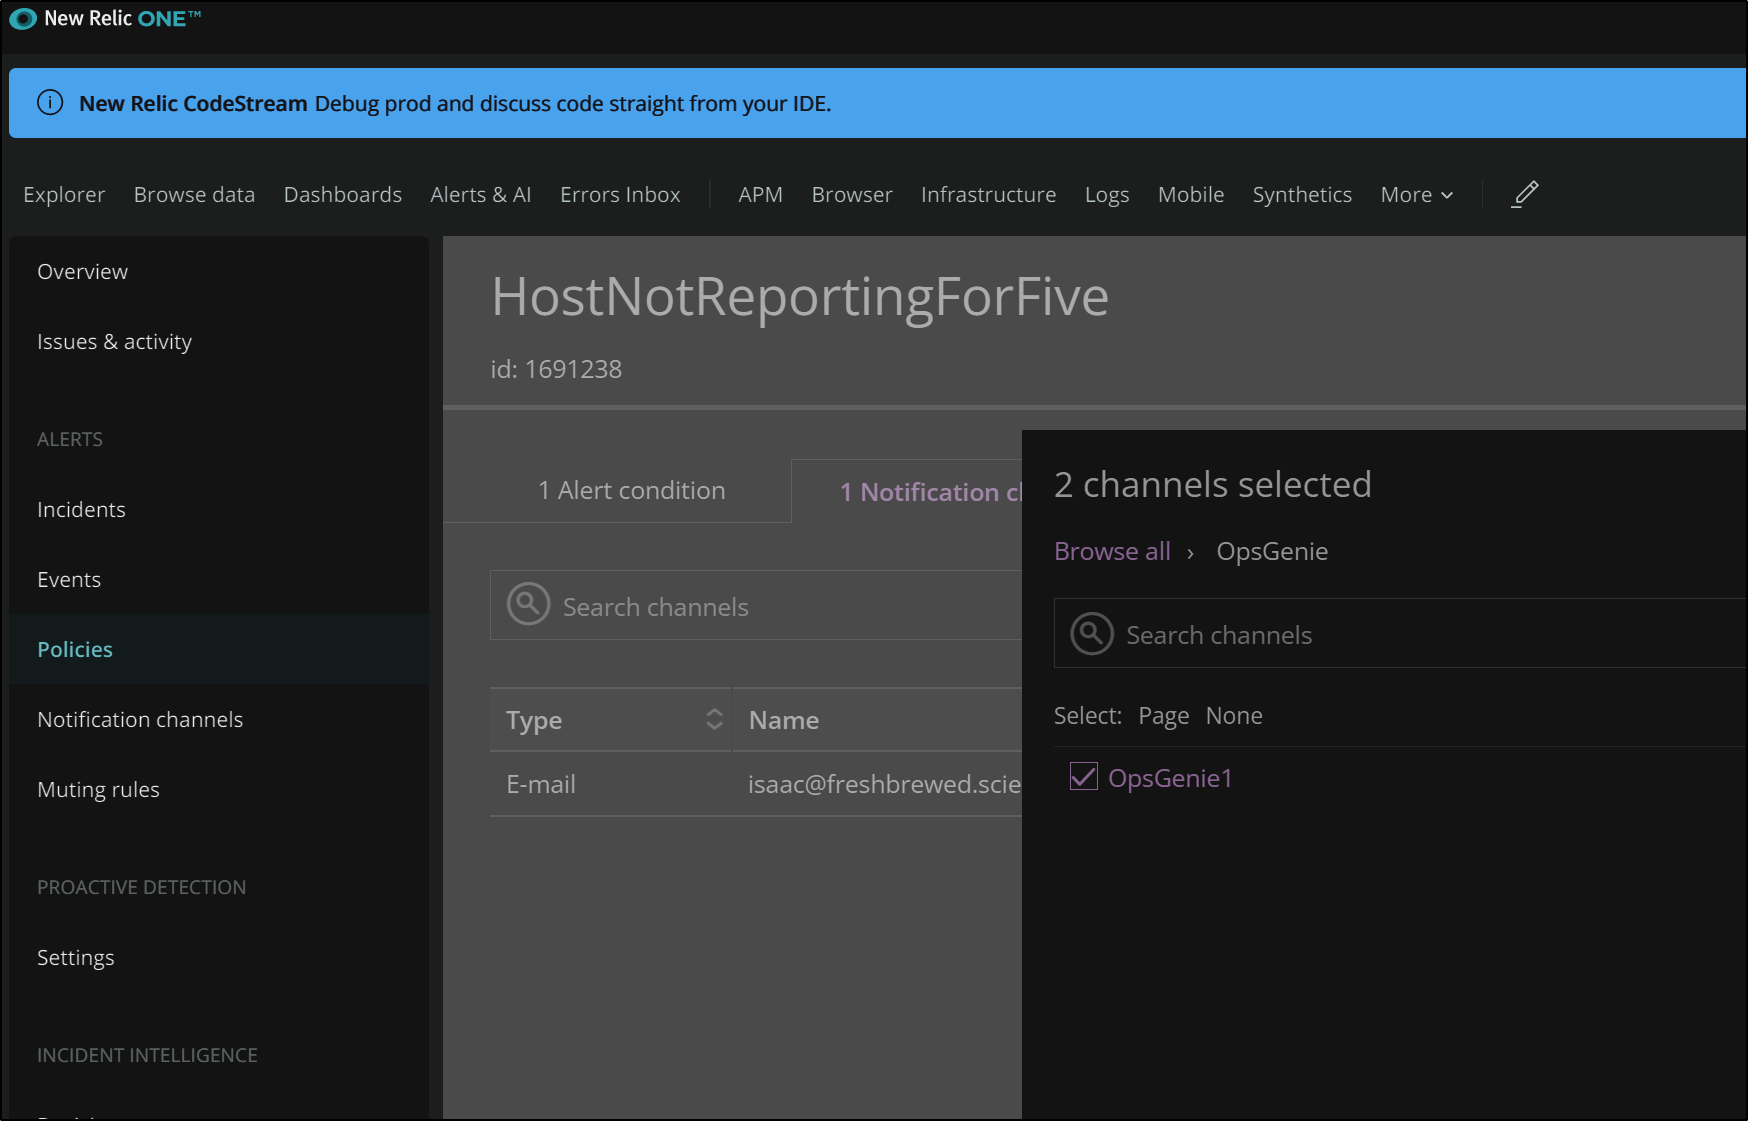
With the host not reporting, we can get an alert
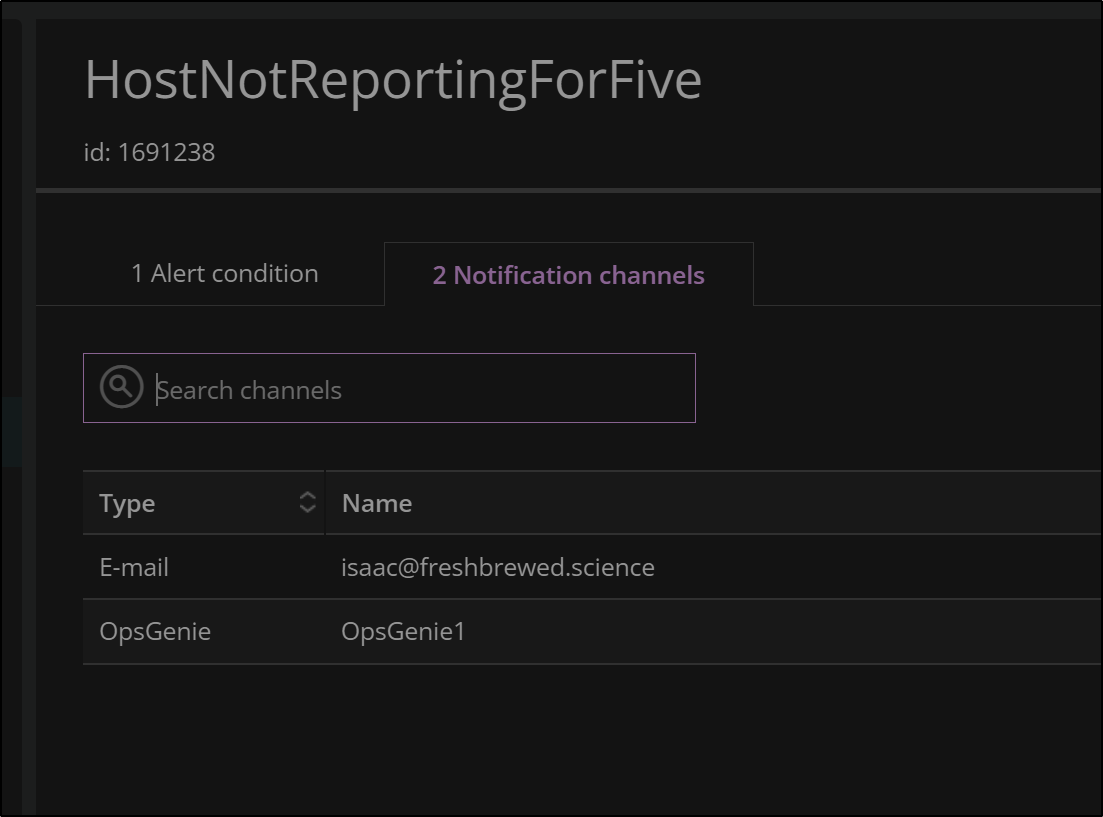
We see we have both email and OpsGenie as our Notification Channels on this policy
We can also exclude that particular cluster from alerts if we determine we would rather not be paged when “Minikube” goes down:

Adding Primary cluster
Now that we experimented with minikube, let’s add our real cluster.
We’ll need to give it a name in add data
Then we can get the helm steps
Verify the right cluster
$ kubectl get nodes
NAME                          STATUS   ROLES                  AGE    VERSION
isaac-macbookpro              Ready    <none>                 317d   v1.21.5+k3s1
builder-hp-elitebook-850-g1   Ready    <none>                 12d    v1.21.5+k3s1
isaac-macbookair              Ready    control-plane,master   317d   v1.21.5+k3s1
hp-hp-elitebook-850-g2        Ready    <none>                 32d    v1.21.5+k3s1
builder-hp-elitebook-850-g2   Ready    <none>                 7d5h   v1.21.5+k3s1
anna-macbookair               Ready    <none>                 205d   v1.21.5+k3s1
and install:
$ kubectl apply -f https://download.newrelic.com/install/kubernetes/pixie/latest/px.dev_viziers.yaml && \
> kubectl apply -f https://download.newrelic.com/install/kubernetes/pixie/latest/olm_crd.yaml && \
> helm repo add newrelic https://helm-charts.newrelic.com && helm repo update && \
elm upgr> helm upgrade --install newrelic-bundle newrelic/nri-bundle \
>  --set global.licenseKey=casdfasdfasdfasdfasdfasdfasdfasdfasdfasdfL \
>  --set global.cluster=homek3s \
>  --namespace=default \
>  --set newrelic-infrastructure.privileged=true \
>  --set global.lowDataMode=true \
>  --set ksm.enabled=true \
>  --set prometheus.enabled=true \
t kubeE>  --set kubeEvents.enabled=true \
>  --set logging.enabled=true \
>  --set newrelic-pixie.enabled=true \
>  --set newrelic-pixie.apiKey=px-api-123123-1231-1231-1231-123123123 \
>  --set pixie-chart.enabled=true \
>  --set pixie-chart.deployKey=px-dep-12312313-1231-1231-1231-123123123 \
>  --set pixie-chart.clusterName=homek3s


...Successfully got an update from the "datawire" chart repository
...Successfully got an update from the "bitnami" chart repository
...Successfully got an update from the "stable" chart repository
Update Complete. ⎈Happy Helming!⎈
WARNING: Kubernetes configuration file is group-readable. This is insecure. Location: /home/builder/.kube/config
WARNING: Kubernetes configuration file is world-readable. This is insecure. Location: /home/builder/.kube/config
Release "newrelic-bundle" does not exist. Installing it now.
W1108 21:45:25.594574     999 warnings.go:70] policy/v1beta1 PodSecurityPolicy is deprecated in v1.21+, unavailable in v1.25+
W1108 21:45:26.099508     999 warnings.go:70] policy/v1beta1 PodSecurityPolicy is deprecated in v1.21+, unavailable in v1.25+
W1108 21:45:33.717699     999 warnings.go:70] policy/v1beta1 PodSecurityPolicy is deprecated in v1.21+, unavailable in v1.25+
W1108 21:45:38.739046     999 warnings.go:70] policy/v1beta1 PodSecurityPolicy is deprecated in v1.21+, unavailable in v1.25+
W1108 21:45:39.339646     999 warnings.go:70] policy/v1beta1 PodSecurityPolicy is deprecated in v1.21+, unavailable in v1.25+
W1108 21:45:54.547808     999 warnings.go:70] policy/v1beta1 PodSecurityPolicy is deprecated in v1.21+, unavailable in v1.25+
NAME: newrelic-bundle
LAST DEPLOYED: Mon Nov  8 21:45:22 2021
NAMESPACE: default
STATUS: deployed
REVISION: 1
TEST SUITE: None
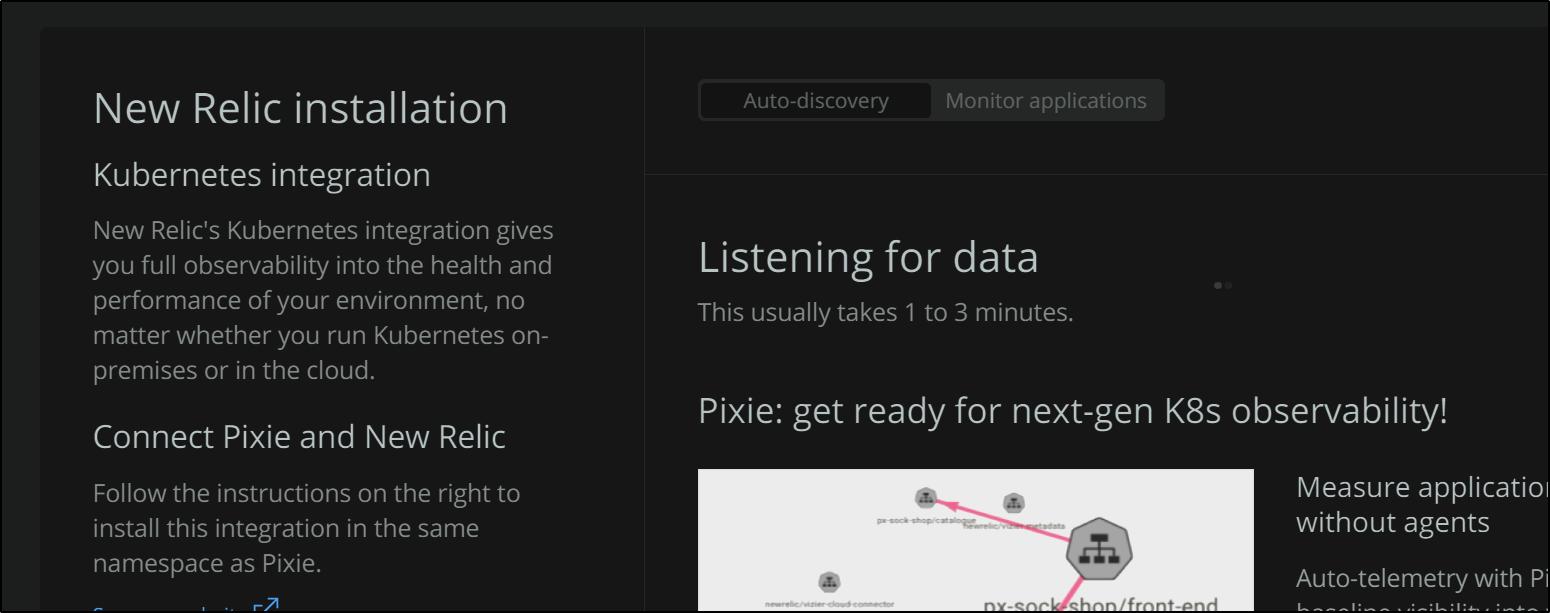
Once launched, we get a window indicating NewRelic is waiting on data
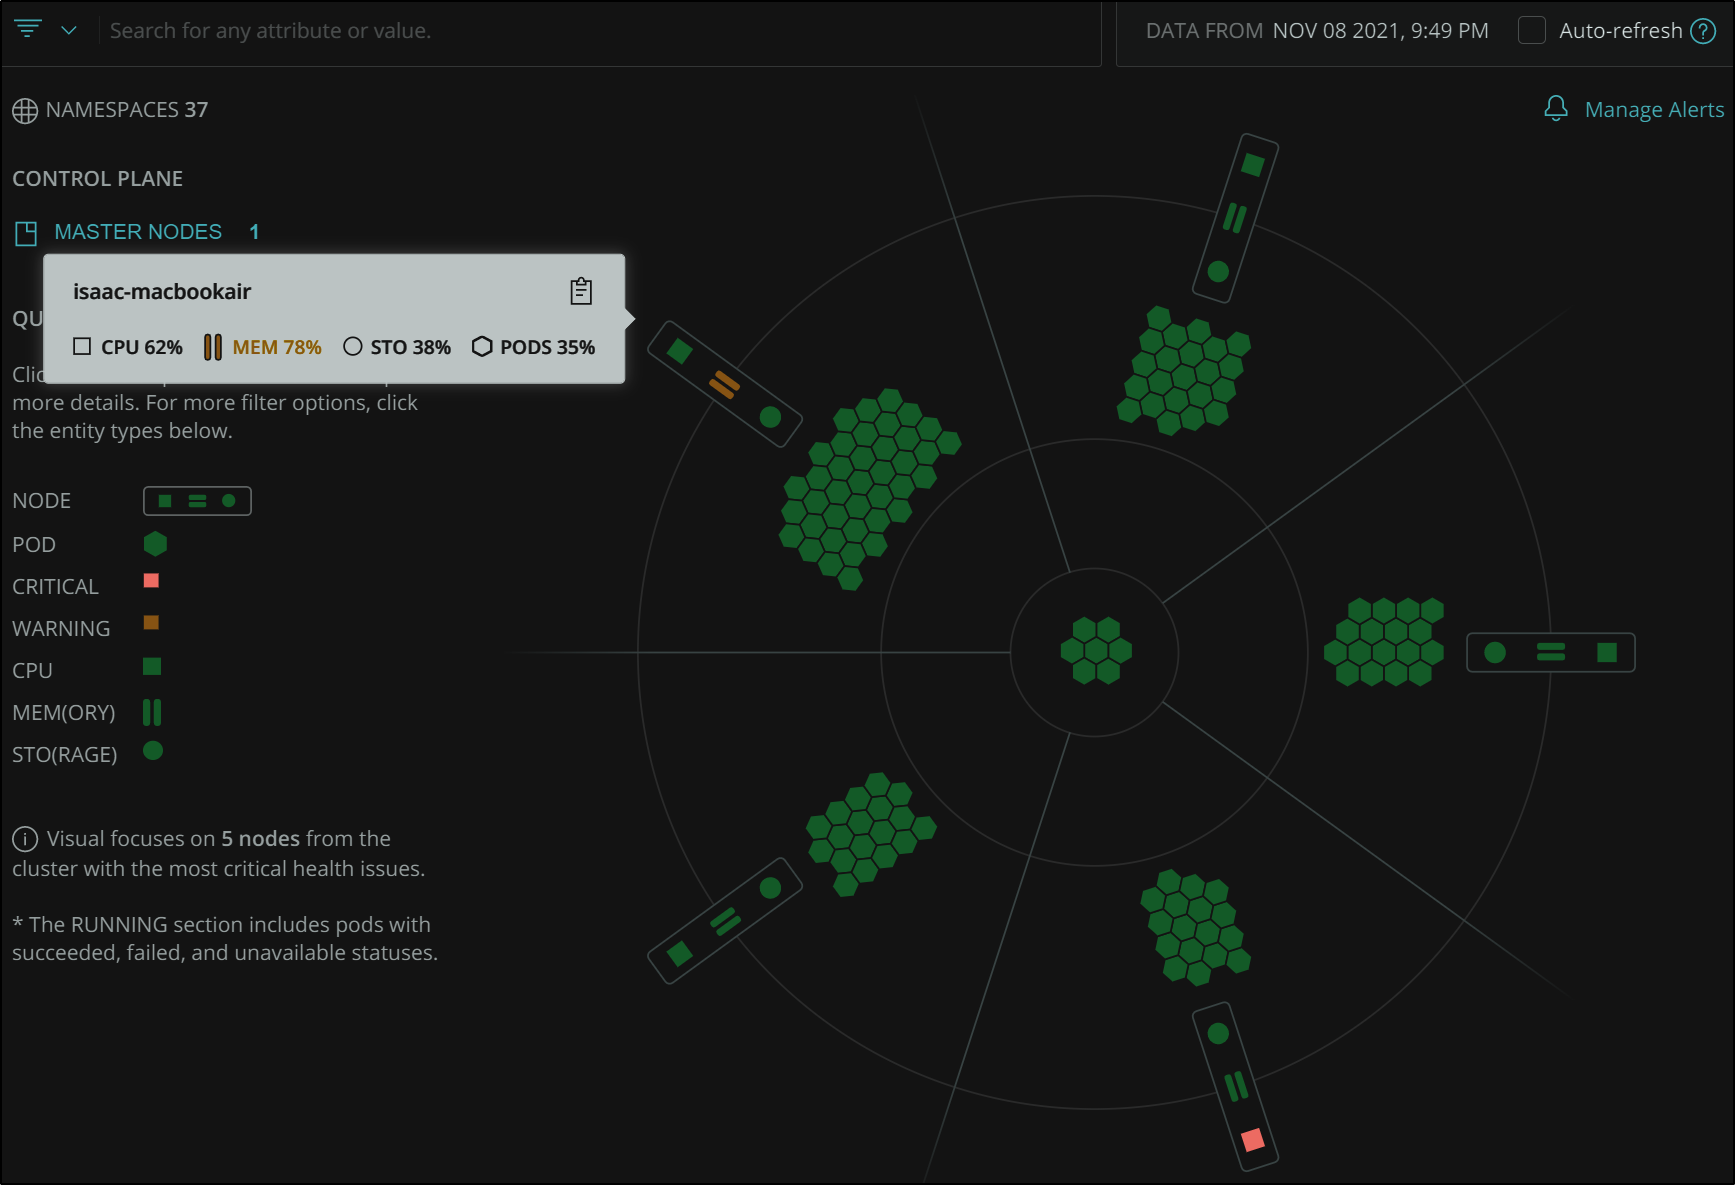
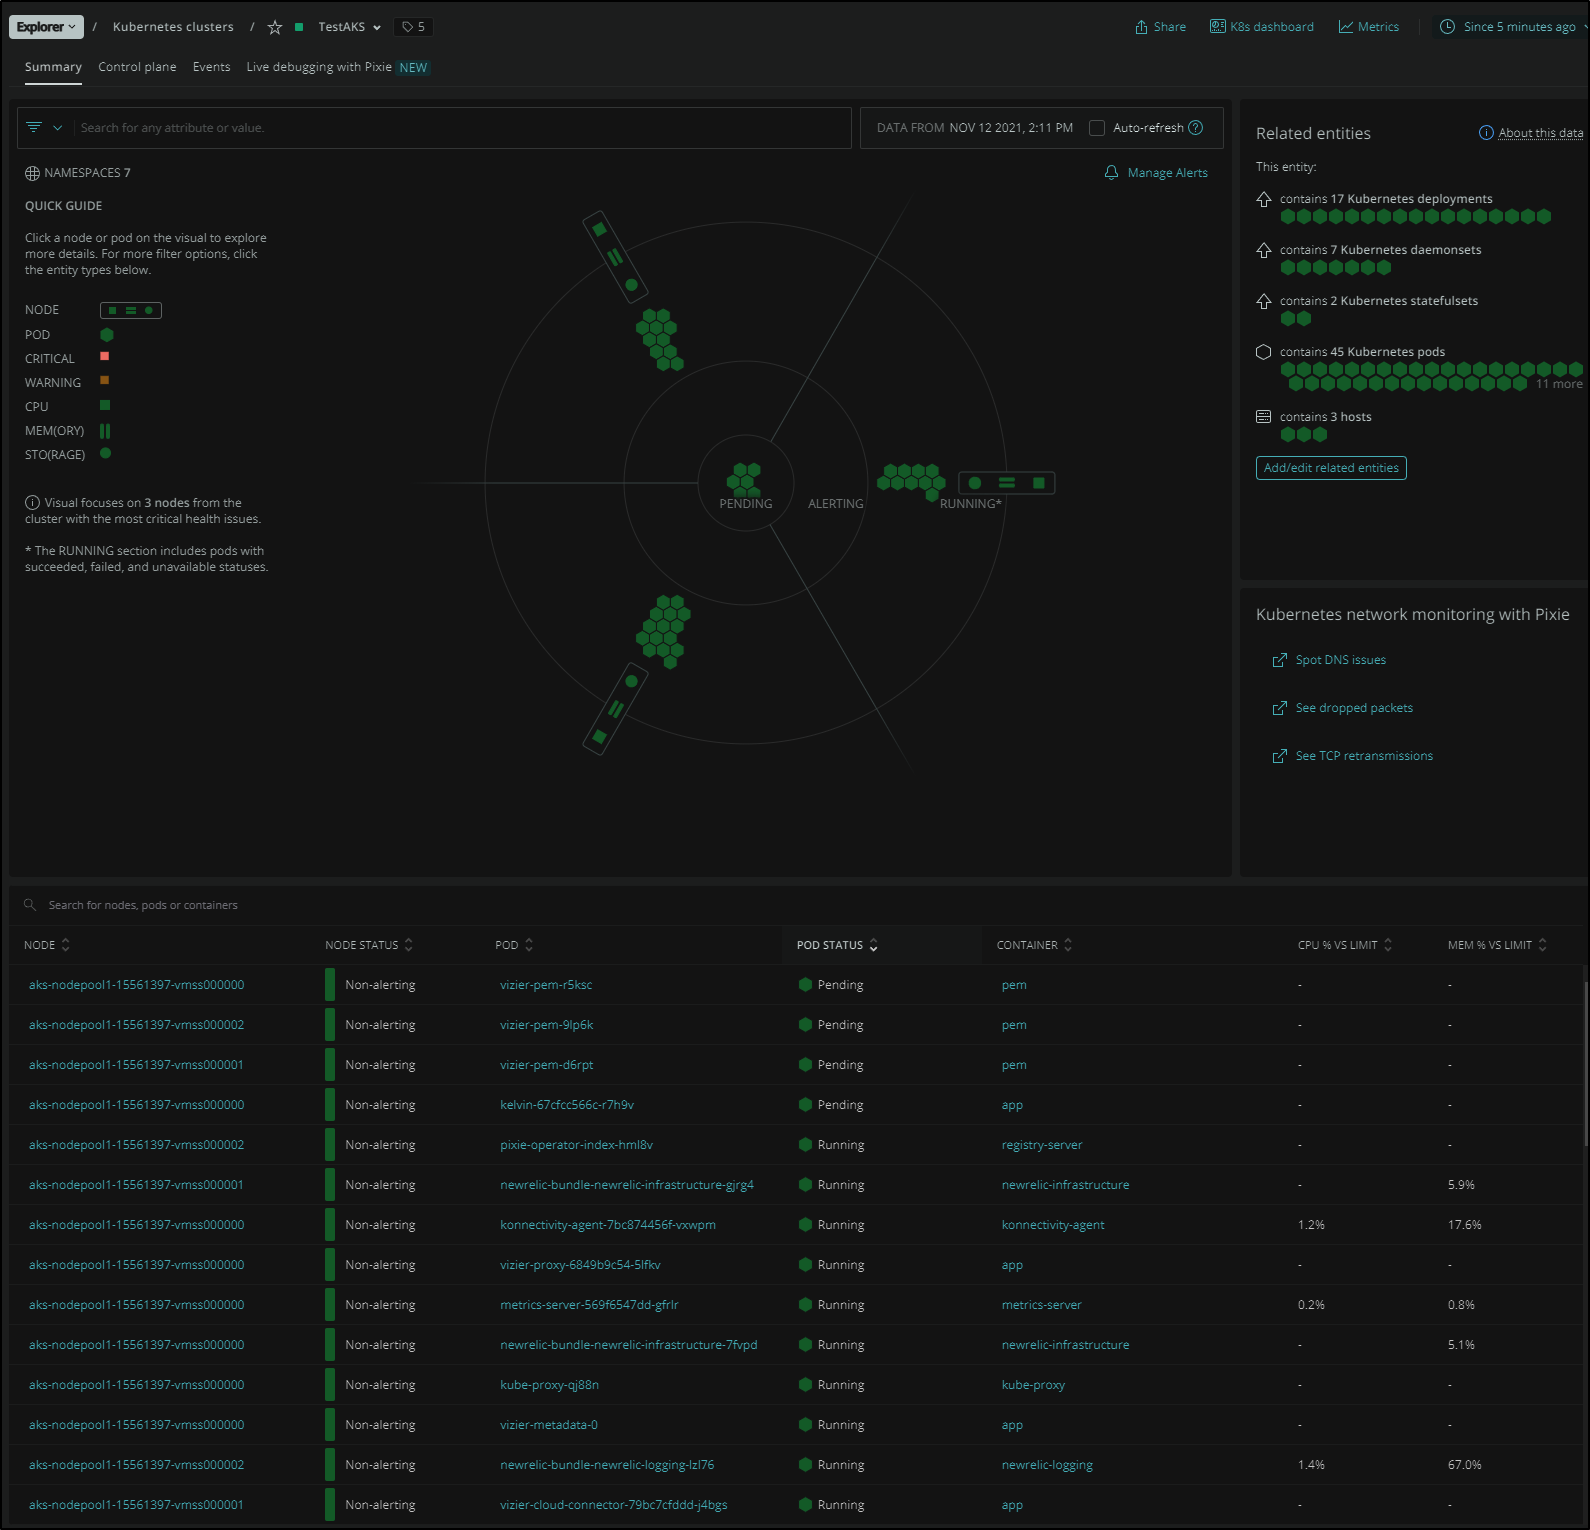
We can see more interesting data with a multi-node cluster.
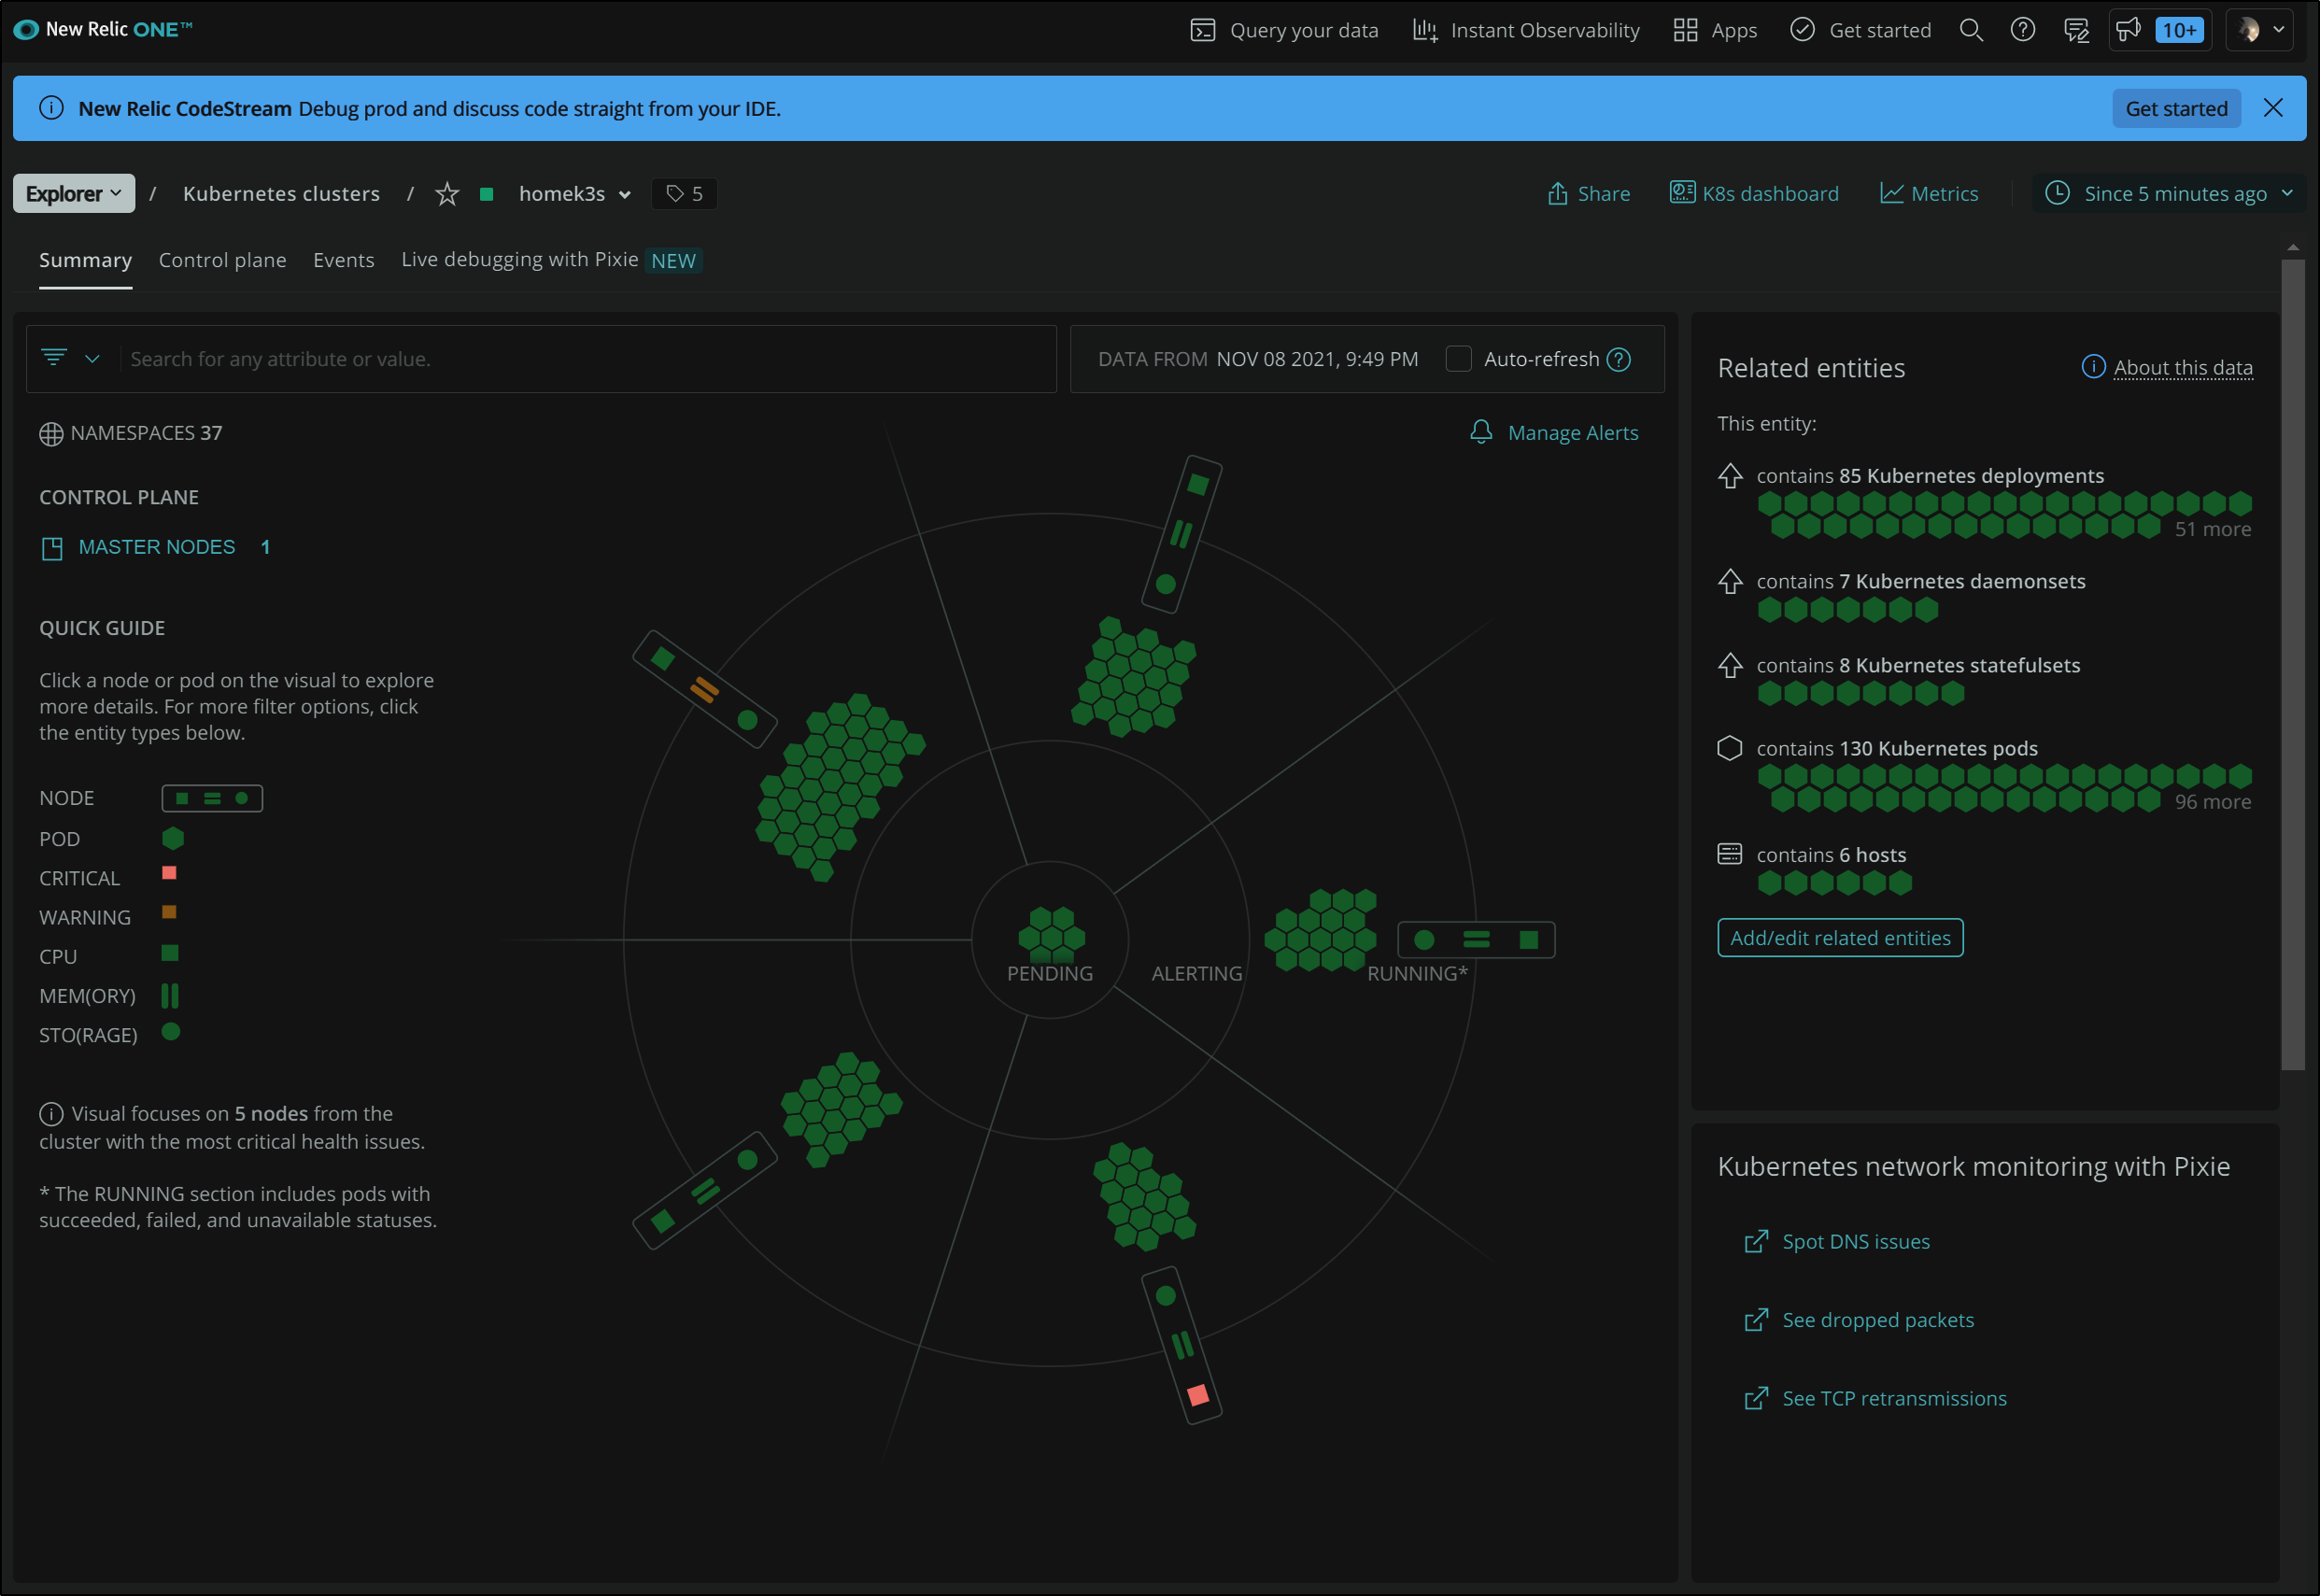
We can see some colours stand out right away. For instance, the bottom square tells us one of the hosts is using high CPU
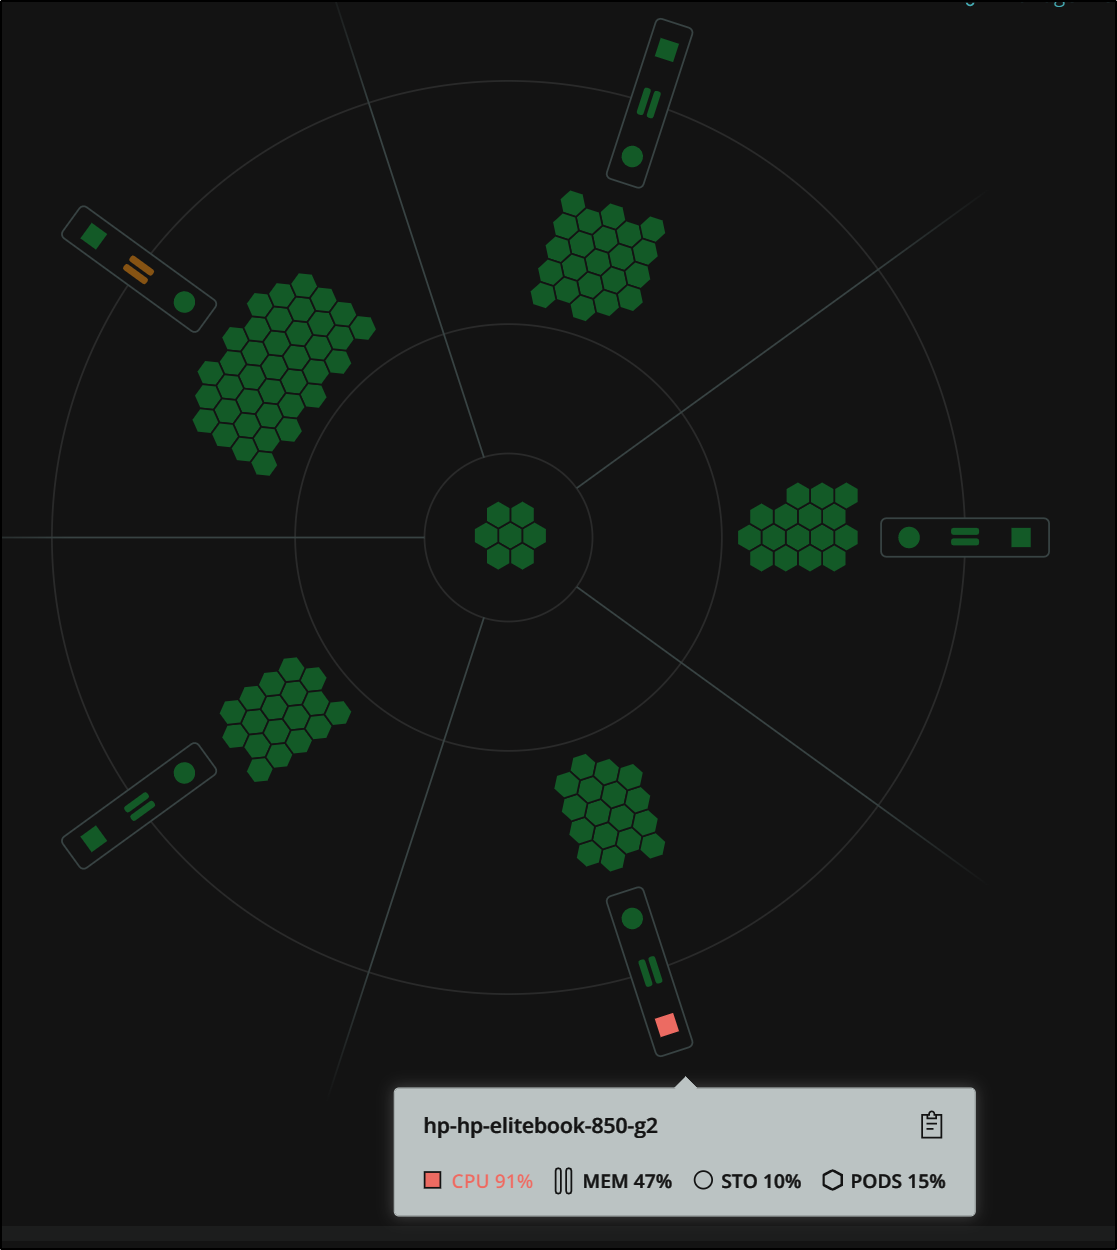
Wheras the orange equal signs show high Memory usage
APM
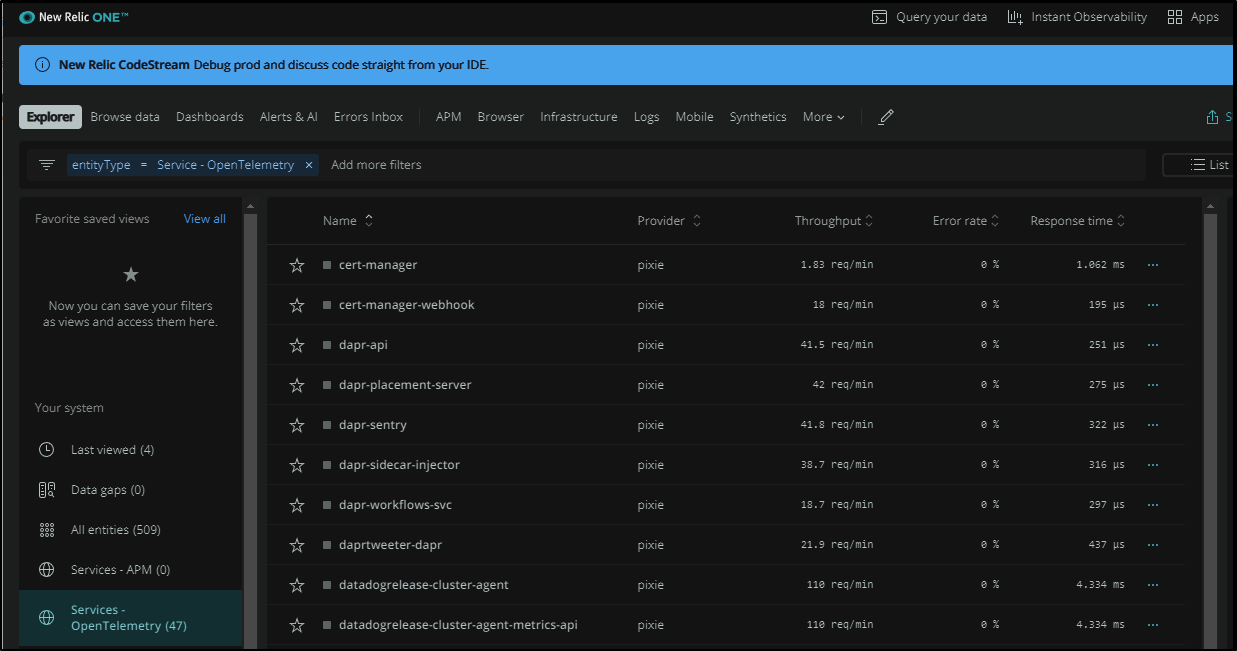
In time, New Relic (Pixie via New Relic) finds our Open Telemetry endpoints and auto discovers our trace data. This caught me off guard.
With Datadog, I needed to redirect my OTel settings to a Datadog endpoint. Here, Pixie automatically started capturing APM data of services:
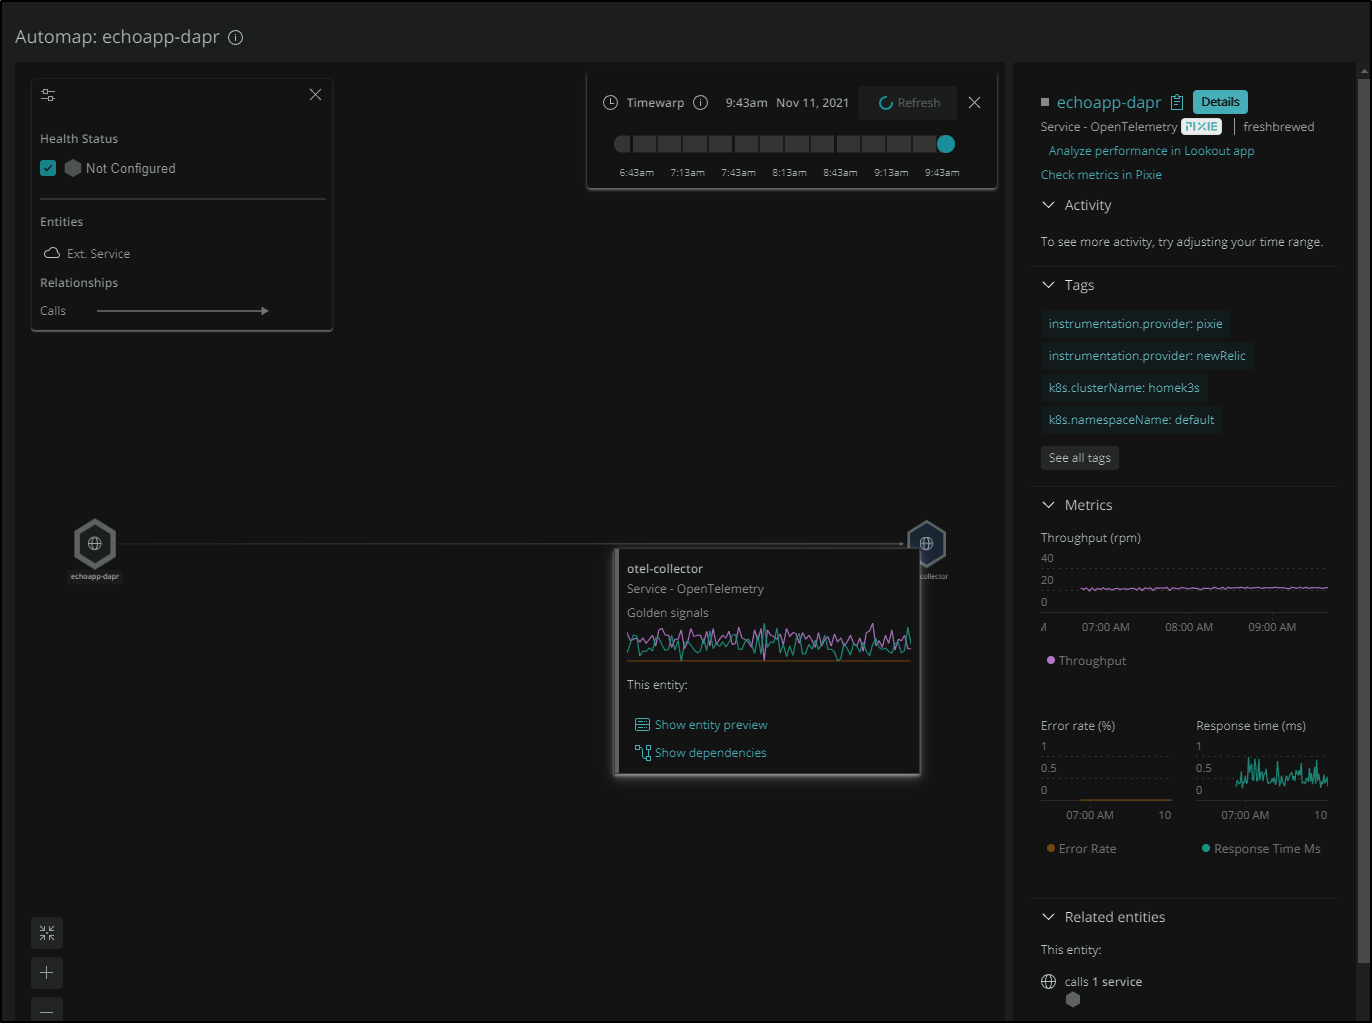
I can pick a service and immediately see Response and Thouroughput. This was captured by Pixie on the cluster.
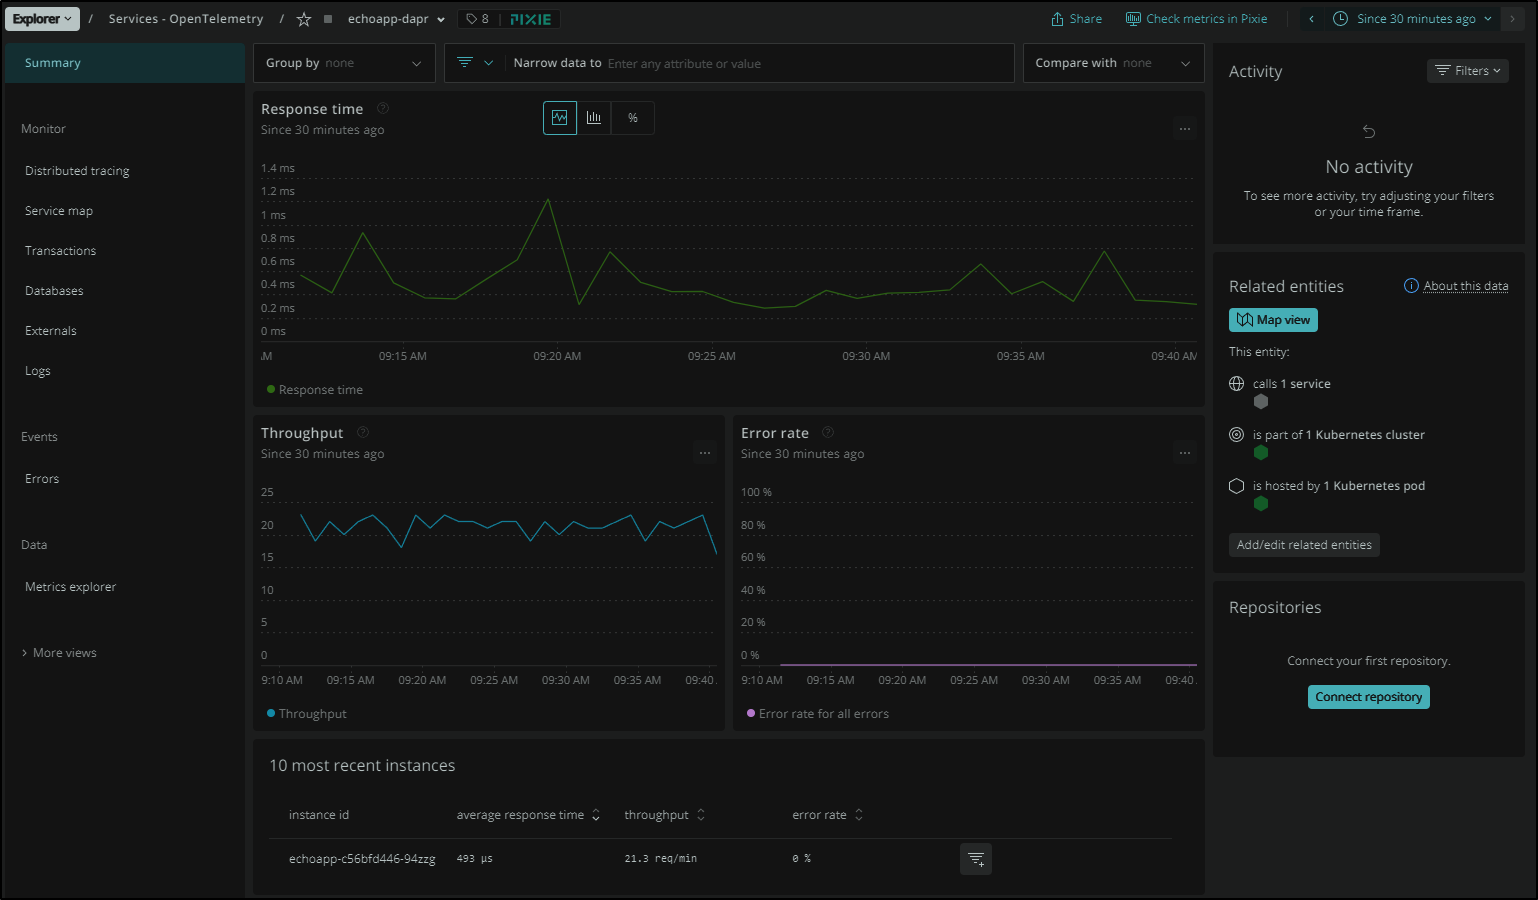
I can of course change the time window on the upper right, but if we click Map View we can see that Pixie figured out this pod, using Dapr, is sending data to the OTel service!
Unfortunately (see FIX below), the “run scripts” part of Pixie, which there are lots of links to throughout New Relic, never seems to work for me. I have no idea why, but i tried many things to get it to work.
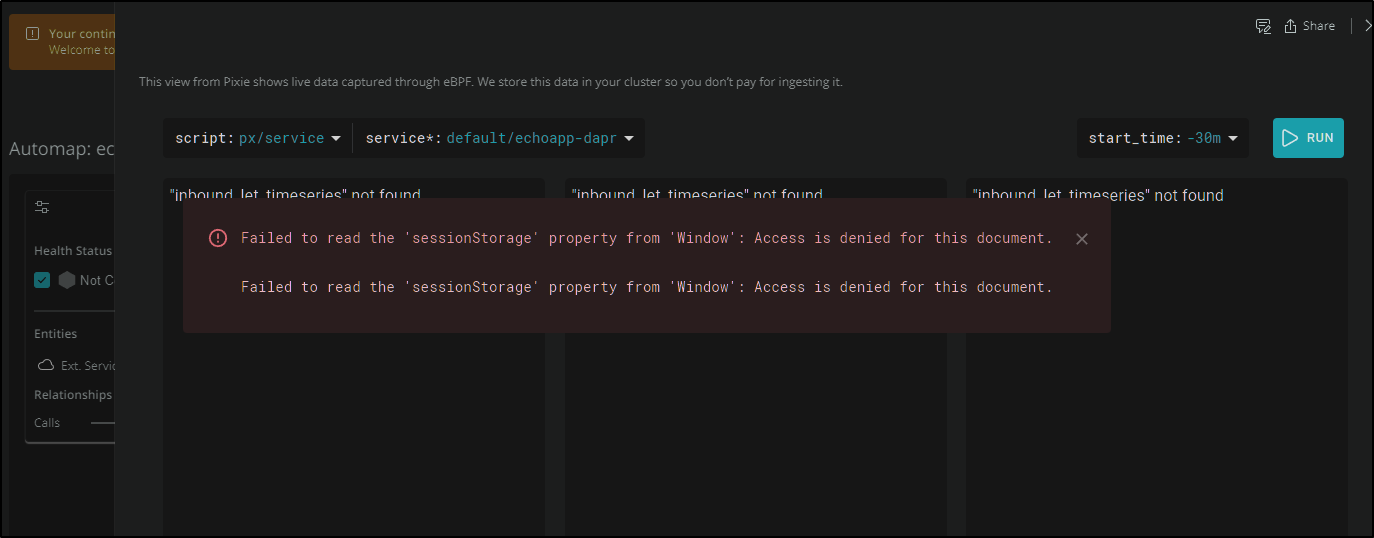
FIX on Pixie Page Errors
This has come up with others.. It has to do with how NewRelic’s Angular libraries are trying to leverage Auth0 behind the scenes. The fact that Chrome (and chromium-based browsers, which are most now) block 3rdParty coookies break the Pixie windows.
To fix, you can set your browser to allow 3rdParty cookies:
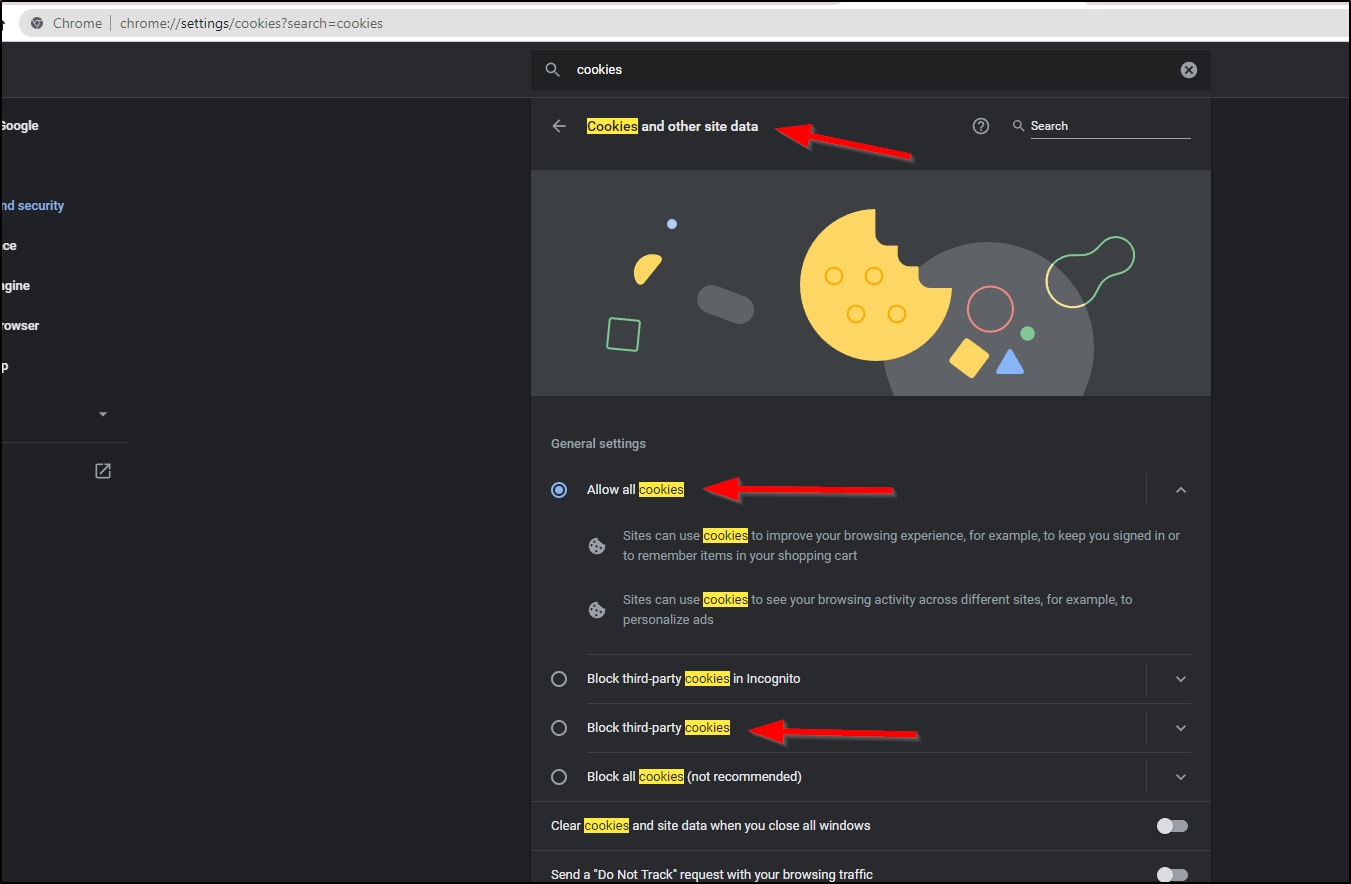
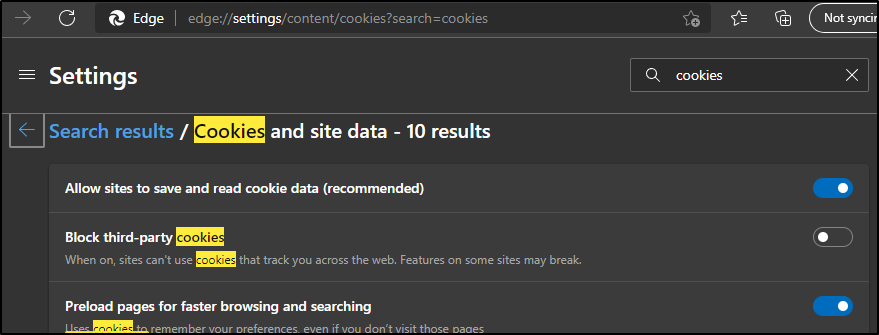
As you see, i just changed from the default “Block” to “Allow” and the Pixie pages started to work!
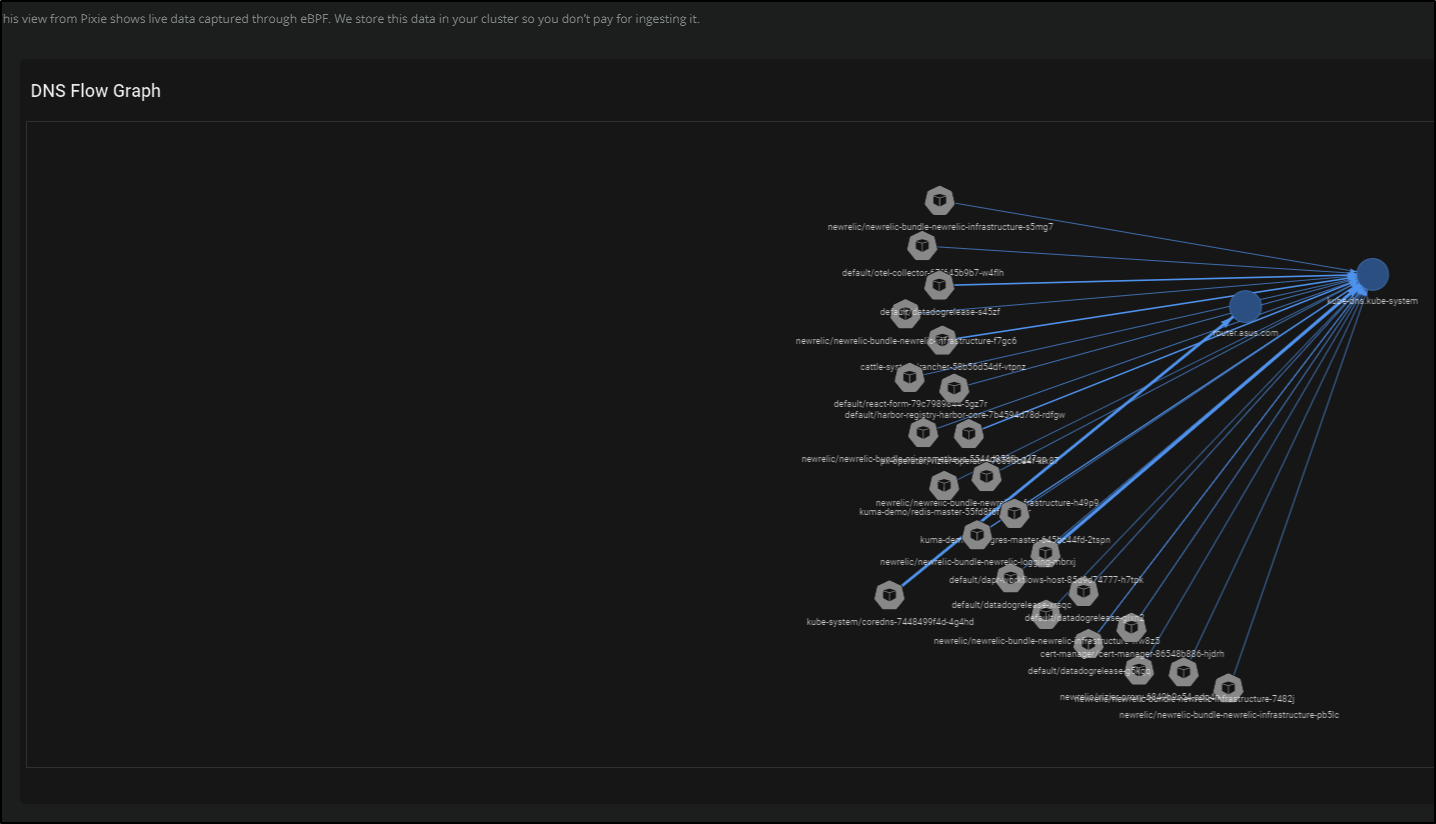
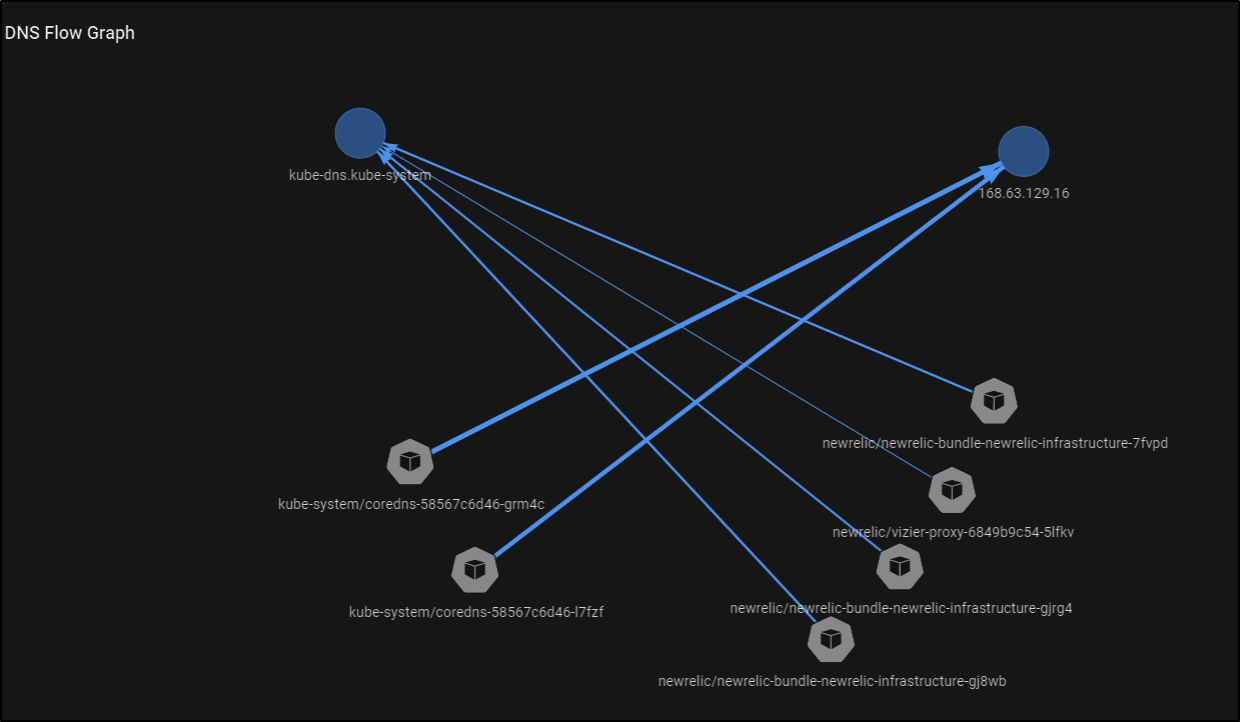
We can now see the Pixie generated DNS graph:
Logs
We saw about that the echoapp was sending data to the Otel collector.
What if we wanted to find it’s logs?
We can use the Logs area to search for logs from a pod and since it isn’t often used, we’ll set the date slider to 7days.
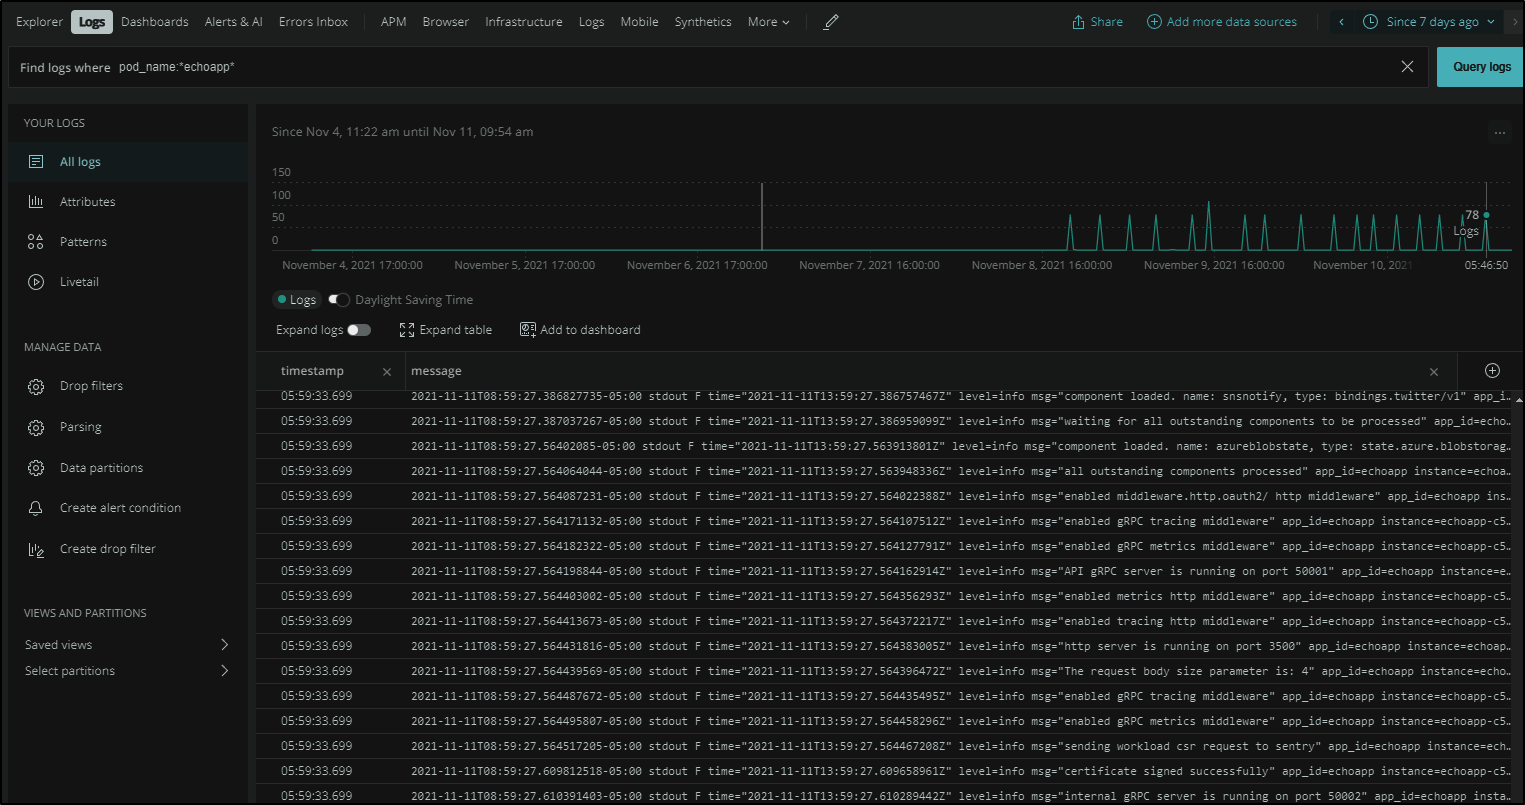
We can select an entry to get more details:
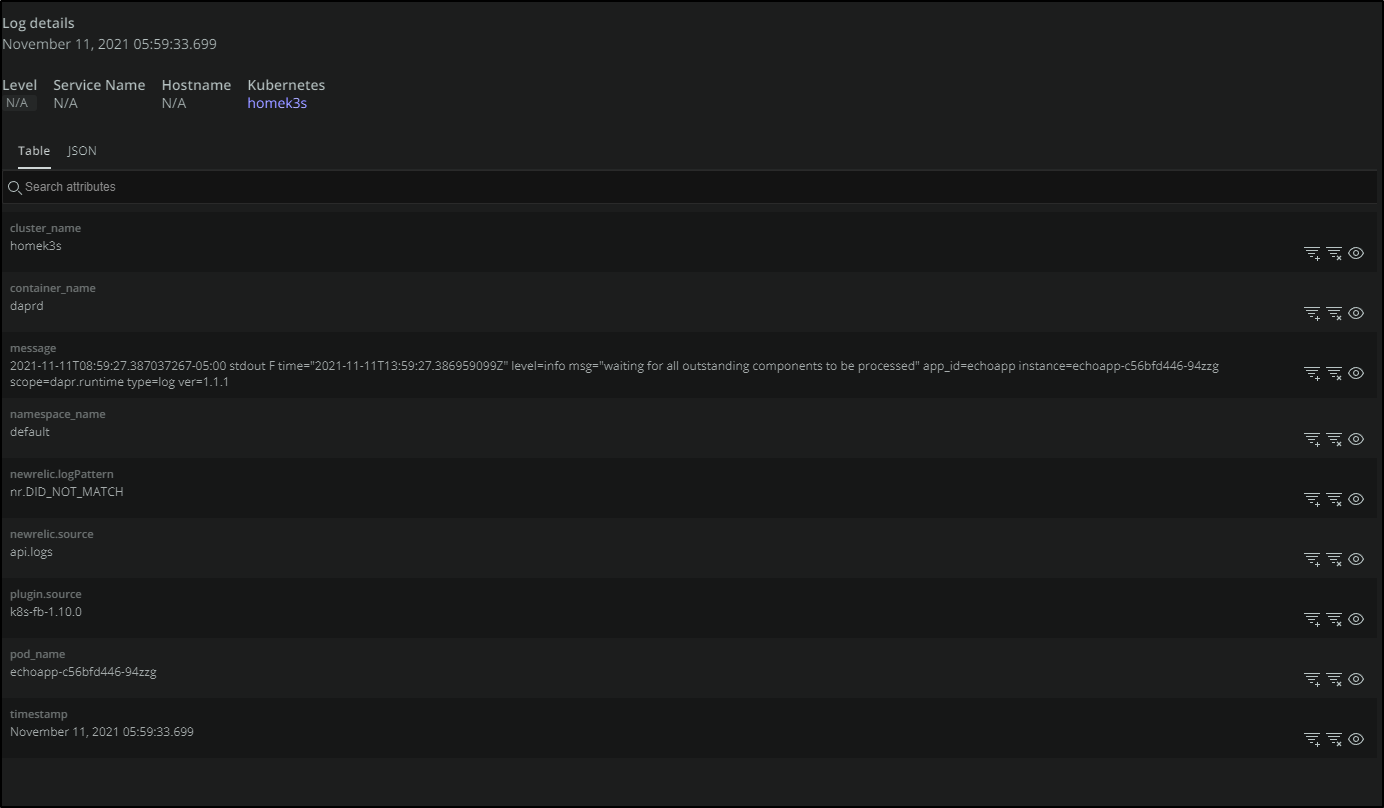
Here we see that it was the Daprd container (not the app container) in the pod generating a message.
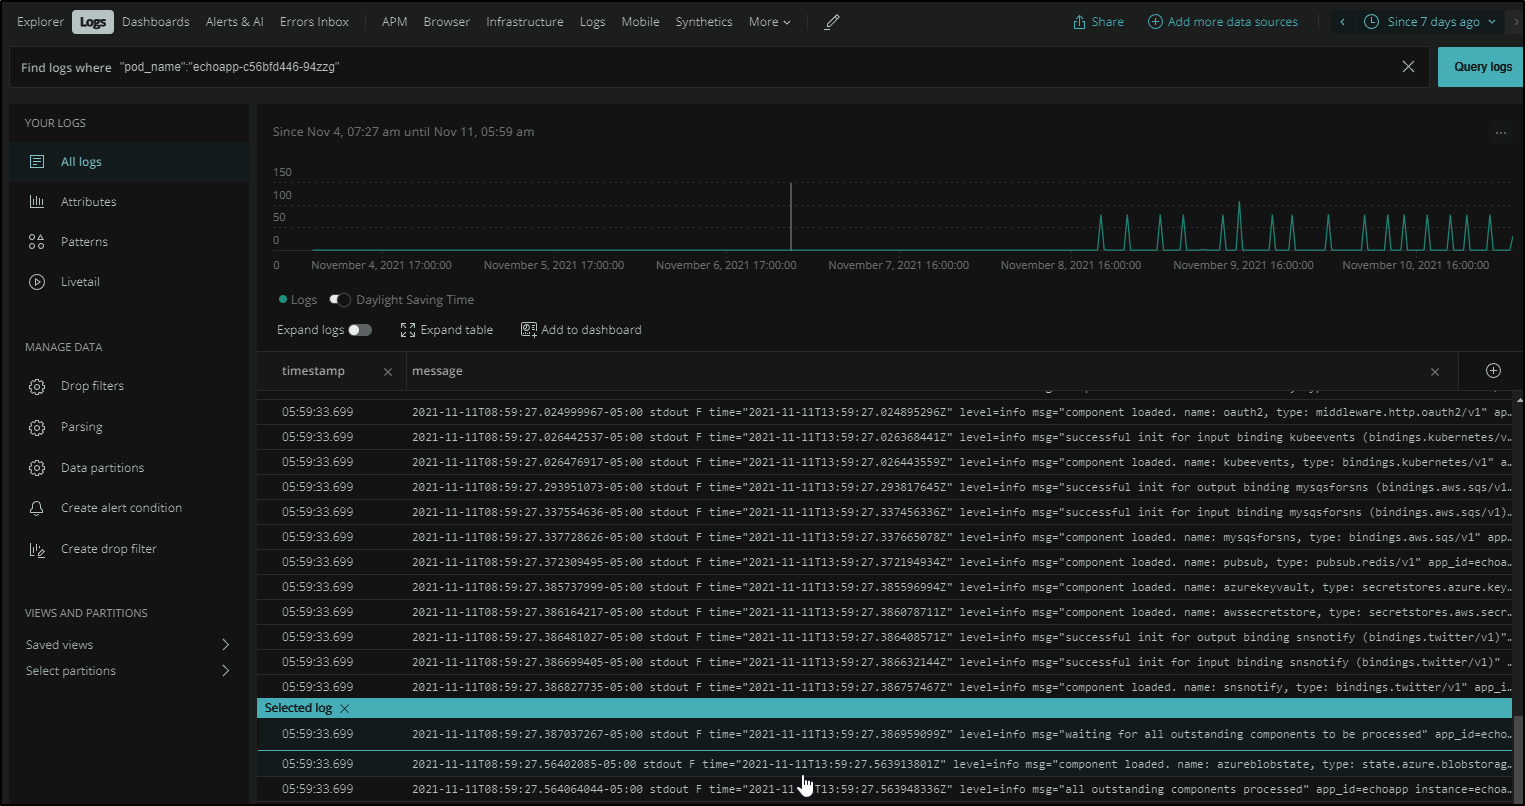
If I click the eye icon by the container, we are redirected to the log query, this time focussed just on that exact pod. Since this is a service with only one pod in the Replica Set, the results look the same.
One of the features I’ve always liked is having the ability to LiveTail logs. Here we can do the same. Once we have something the selector, we can pick Live tail to see a current live report of logs
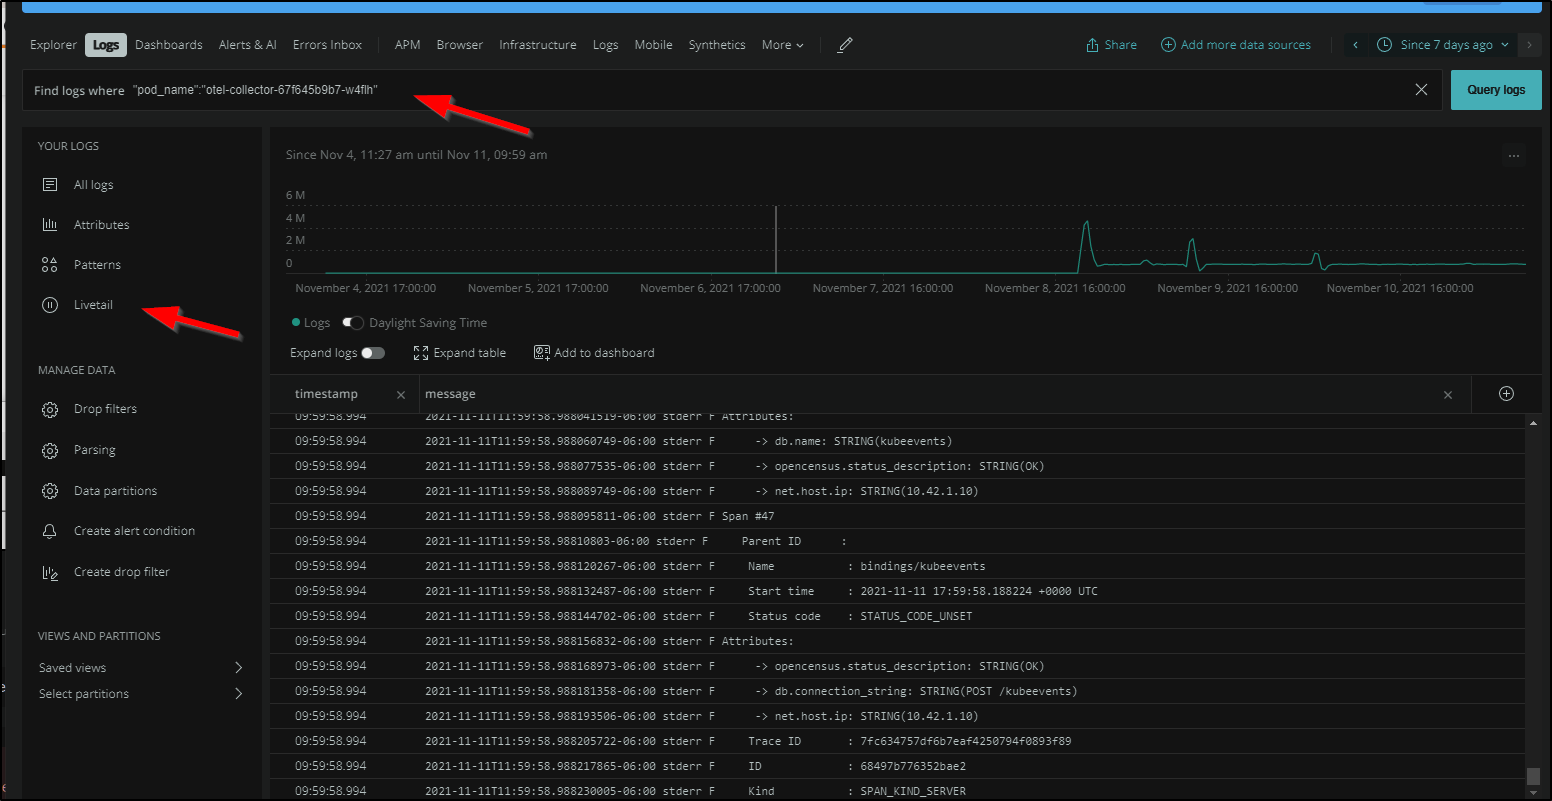
Alerting on Log data
Say we want to alert if our Open Telemetry collector goes down. Yeah, it’s noisy, but the absense of noise might be a failure we need to investigate.
Here we can click the “Create alert conditon” on the left of the above log results.
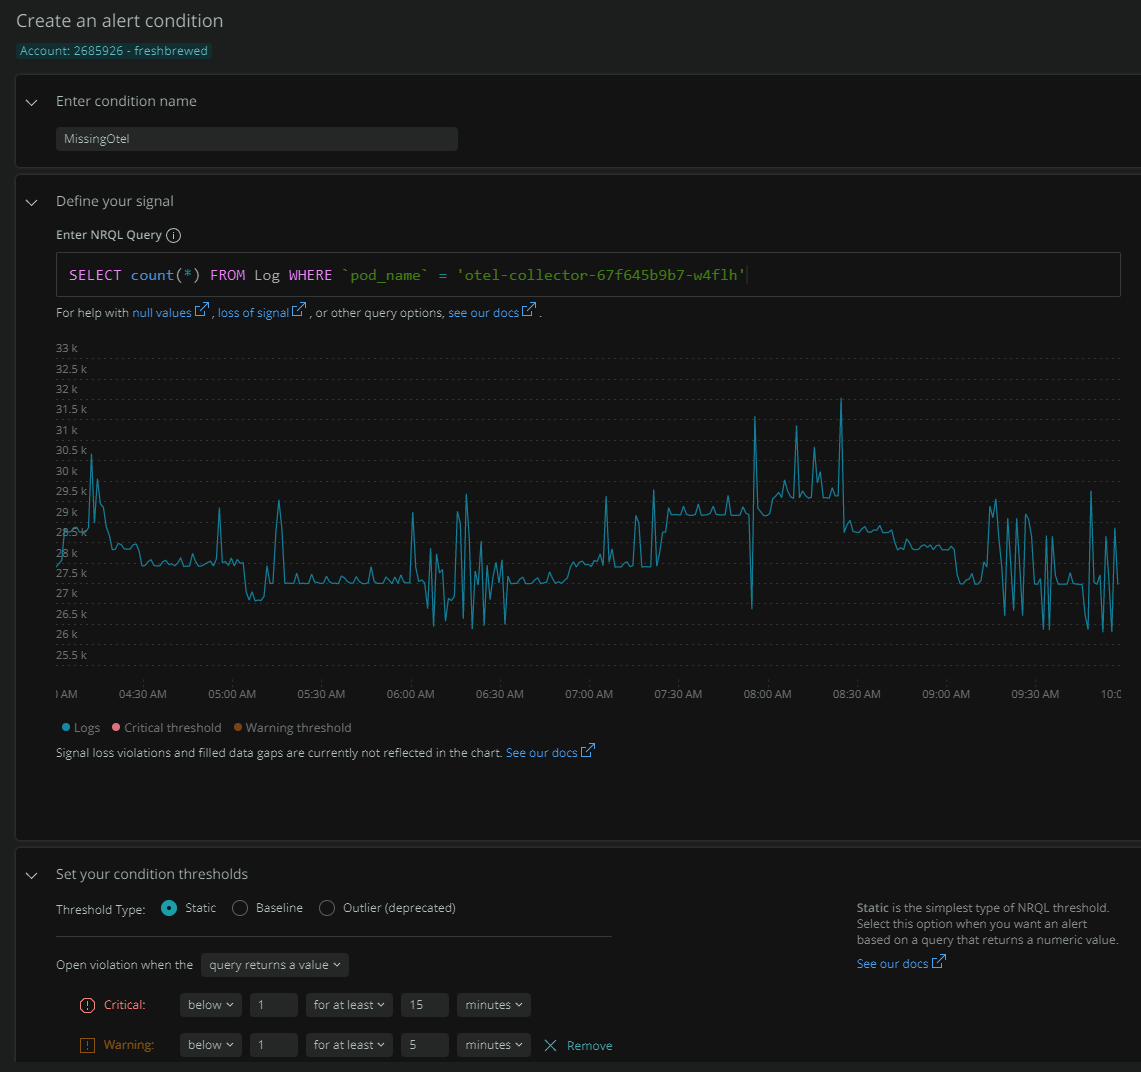
From there we can start to define the Alert condition.
First we will give it a condition name, then sepcify the thresholds. The graph changes colours as we tweak the values in the thresholds (making it easy to see when things would trigger).
Here we are setting a critical error at less than one message for 15 minutes and a warning at less than 1 for 5 minutes.
Next we can define the policy or select an existing alert policy.
In this case, let’s define a new one.
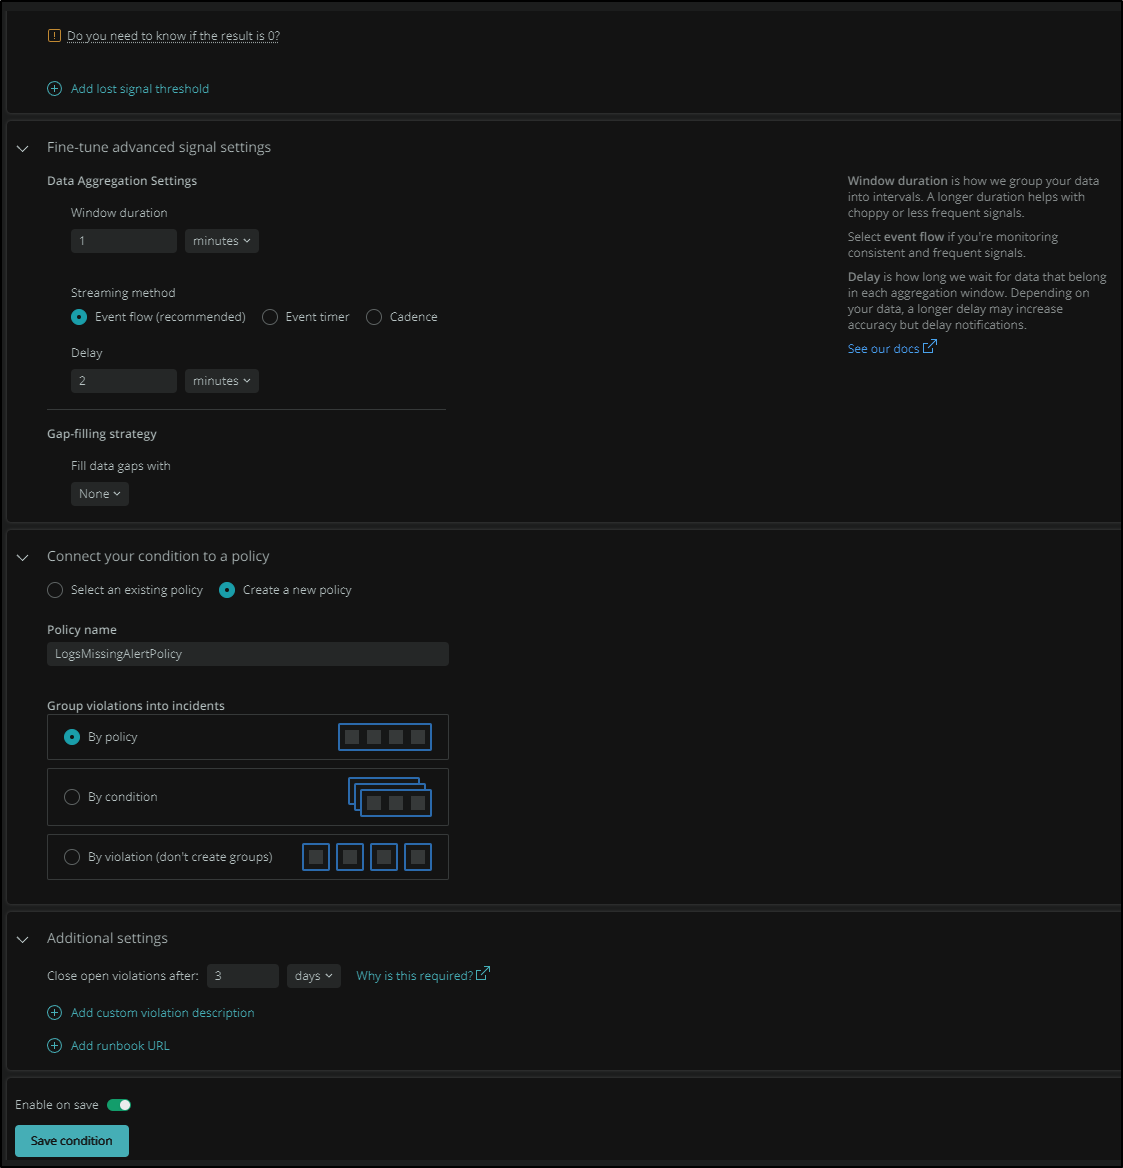
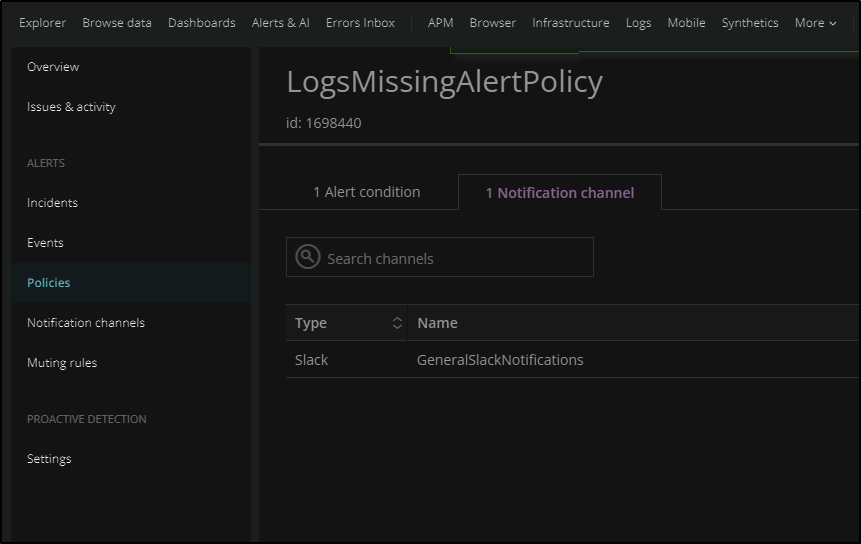
Next, we need to go to “Alerts and AI” to define the Notification Channels for this policy:
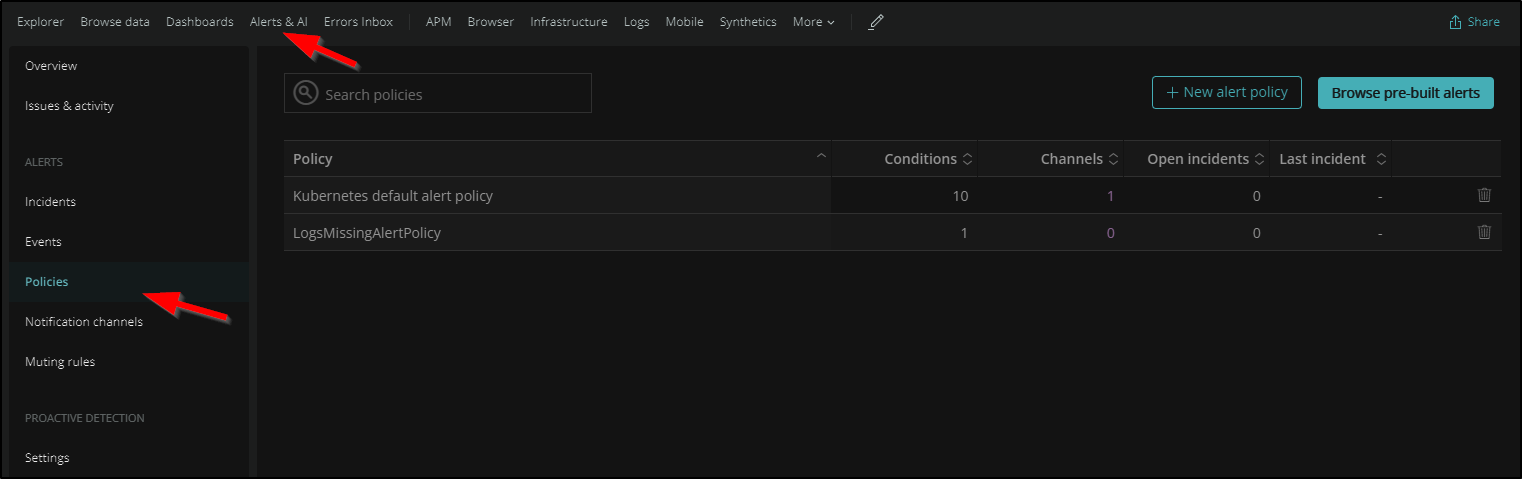
then add a slack notification channel. If you havent created one. You may need to take a moment to make yourself a Slack App to add to your channel (as they don’t let you use generic global webhooks anymore).
Validation
We can test this by changing the condition.
To see what it would really look like, I’ll edit the condition to trigger on “Above” 1 logs.
You can also see how the “warning” and “critical” are highlighted on the graph.
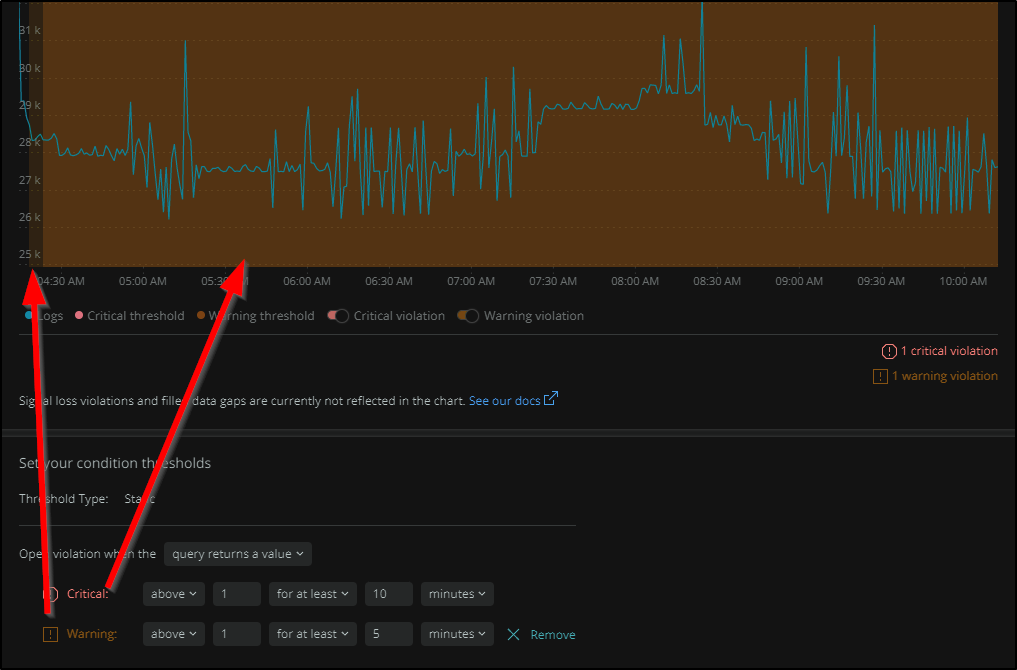
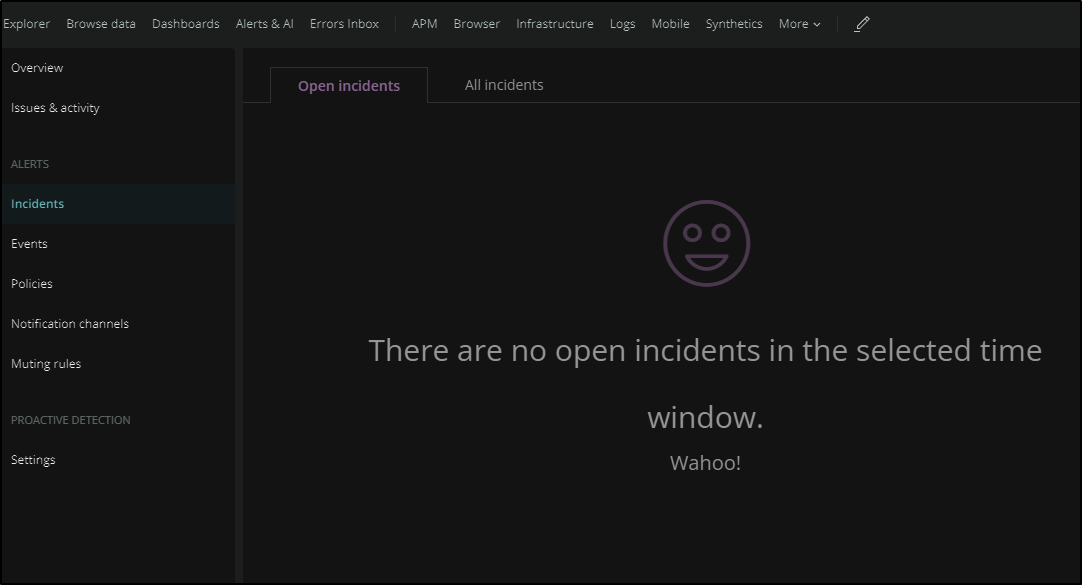
Initially, I have no incidents as we need to see this “bad” condition for more than 5 minutes
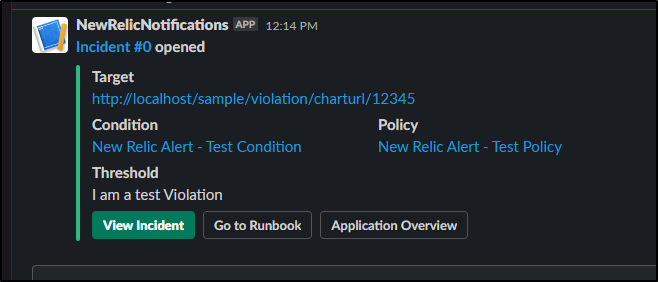
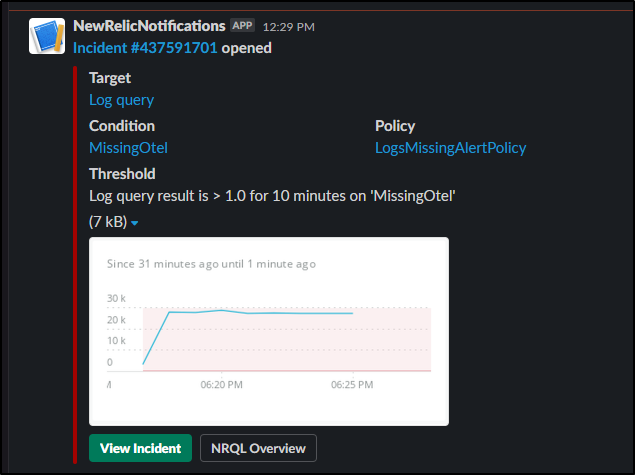
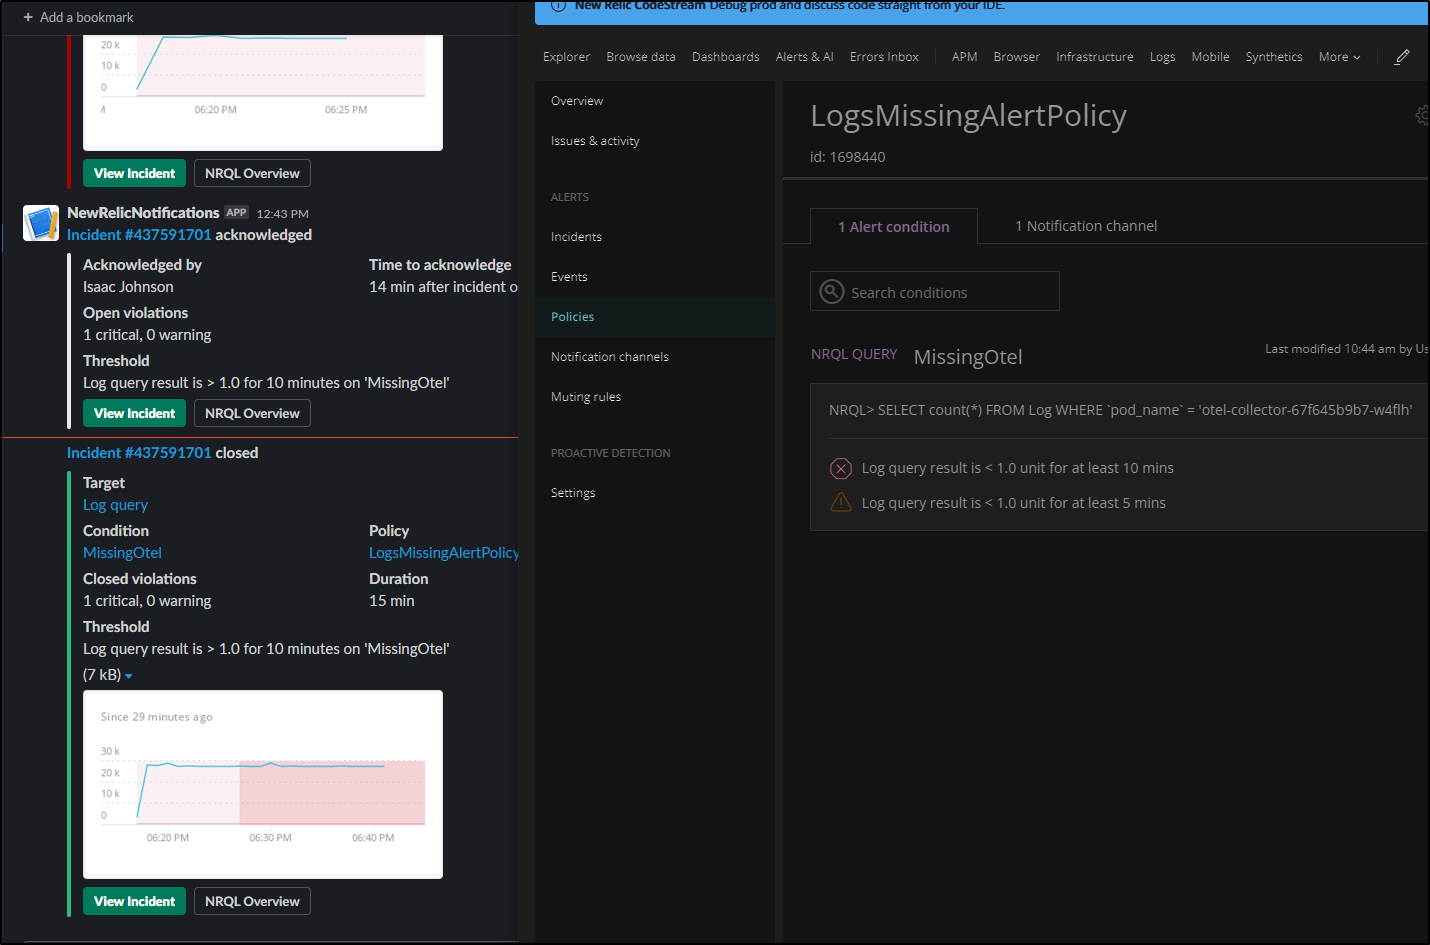
but soon we will see an incident created as well as an alert
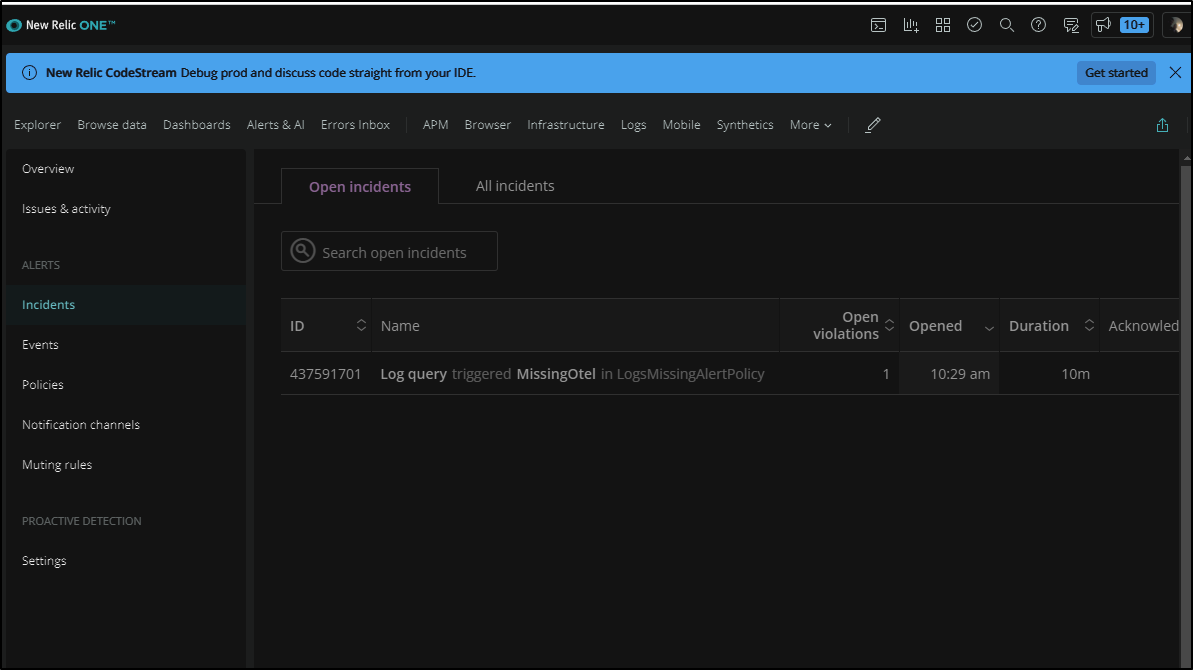
If I go to the incident, I can acknowledge it
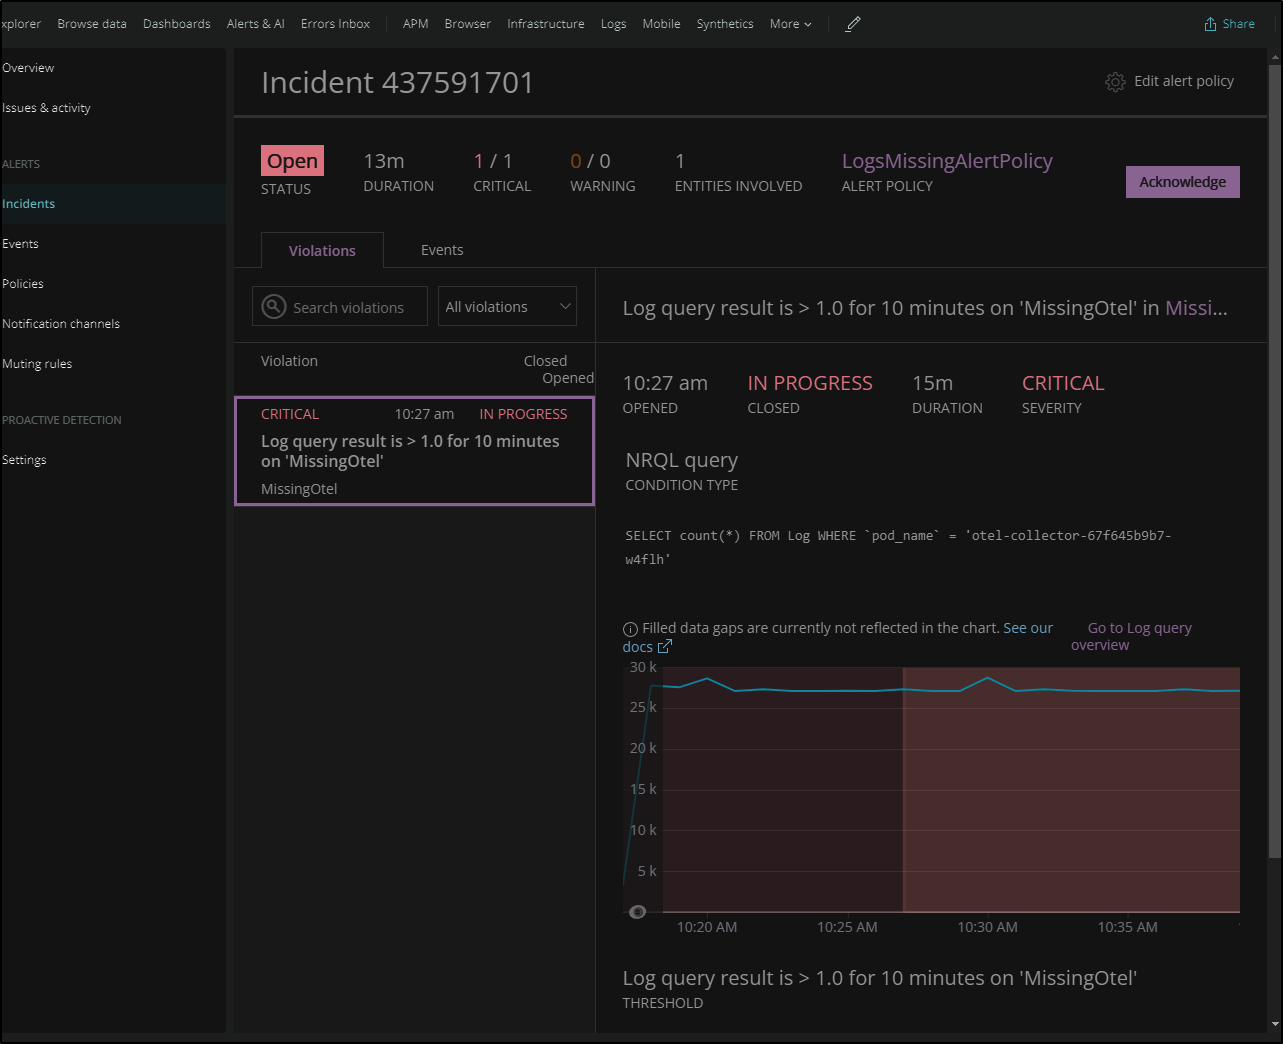
which has the benefit of also updating slack should someone else have gotten the notice and wondered if someone was taking a look already
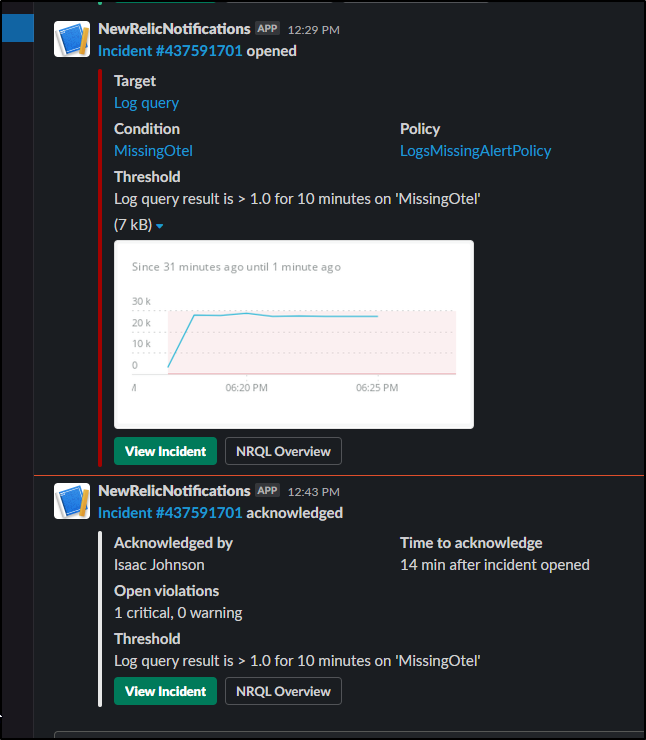
I can save the alert to be “Below” on the condition and immediately I see the Incident is resolved and Slack is updated
AKS
I wanted to do one more test, this time using AKS
$ az group create -n myakstest --location centralus
{
  "id": "/subscriptions/d4c094eb-e397-asdf-asdf-fd877504a619/resourceGroups/myakstest",
  "location": "centralus",
  "managedBy": null,
  "name": "myakstest",
  "properties": {
    "provisioningState": "Succeeded"
  },
  "tags": null,
  "type": "Microsoft.Resources/resourceGroups"
}
$ az aks create -g myakstest -n myakstest1 --location centralus --network-plugin azure --network-policy azure --generate-ssh-keys
{
  "aadProfile": null,
  "addonProfiles": null,
  "agentPoolProfiles": [
    {
      "availabilityZones": null,
      "count": 3,
      "enableAutoScaling": null,
      "enableEncryptionAtHost": false,
      ...
Verification of create
$ az aks list -o table
Name        Location    ResourceGroup    KubernetesVersion    ProvisioningState    Fqdn
----------  ----------  ---------------  -------------------  -------------------  ------------------------------------------------------------
myakstest1  centralus   myakstest        1.20.9               Succeeded            myakstest1-myakstest-d4c094-35eb2884.hcp.centralus.azmk8s.io
$ rm -f ~/.kube/config && az aks get-credentials -n myakstest1 -g myakstest --admin
Merged "myakstest1-admin" as current context in /home/builder/.kube/config
$ kubectl get nodes
NAME                                STATUS   ROLES   AGE   VERSION
aks-nodepool1-15561397-vmss000000   Ready    agent   17m   v1.20.9
aks-nodepool1-15561397-vmss000001   Ready    agent   17m   v1.20.9
aks-nodepool1-15561397-vmss000002   Ready    agent   16m   v1.20.9
This time I’ll not reduce amount of data to see how that affects things
Installing:
$ kubectl apply -f https://download.newrelic.com/install/kubernetes/pixie/latest/px.dev_viziers.yaml && \
ctl appl> kubectl apply -f https://download.newrelic.com/install/kubernetes/pixie/latest/olm_crd.yaml && \
> helm repo add newrelic https://helm-charts.newrelic.com && helm repo update && \
> kubectl create namespace newrelic ; helm upgrade --install newrelic-bundle newrelic/nri-bundle \
>  --set global.licenseKey=c8asdfasdfasdfasdfasdfAL \
>  --set global.cluster=TestAKS \
>  --namespace=newrelic \
>  --set newrelic-infrastructure.privileged=true \
>  --set ksm.enabled=true \
>  --set prometheus.enabled=true \
>  --set kubeEvents.enabled=true \
>  --set logging.enabled=true \
>  --set newrelic-pixie.enabled=true \
>  --set newrelic-pixie.apiKey=px-api-asdfasdf-asdf-asdf-asdf-2fb1b80c78b6 \
>  --set pixie-chart.enabled=true \
>  --set pixie-chart.deployKey=px-dep-asdfasdf-asdf-asdf-asdf-7d5798fe112b \
 --set p>  --set pixie-chart.clusterName=TestAKS
customresourcedefinition.apiextensions.k8s.io/viziers.px.dev created
customresourcedefinition.apiextensions.k8s.io/catalogsources.operators.coreos.com created
customresourcedefinition.apiextensions.k8s.io/clusterserviceversions.operators.coreos.com created
customresourcedefinition.apiextensions.k8s.io/installplans.operators.coreos.com created
customresourcedefinition.apiextensions.k8s.io/operatorconditions.operators.coreos.com created
customresourcedefinition.apiextensions.k8s.io/operatorgroups.operators.coreos.com created
customresourcedefinition.apiextensions.k8s.io/operators.operators.coreos.com created
customresourcedefinition.apiextensions.k8s.io/subscriptions.operators.coreos.com created
"newrelic" has been added to your repositories
Hang tight while we grab the latest from your chart repositories...
...Successfully got an update from the "azure-samples" chart repository
...Successfully got an update from the "datadog" chart repository
...Successfully got an update from the "kuma" chart repository
...Successfully got an update from the "newrelic" chart repository
...Successfully got an update from the "rancher-latest" chart repository
Update Complete. ⎈Happy Helming!⎈
namespace/newrelic created
Release "newrelic-bundle" does not exist. Installing it now.
NAME: newrelic-bundle
LAST DEPLOYED: Fri Nov 12 14:07:46 2021
NAMESPACE: newrelic
STATUS: deployed
REVISION: 1
TEST SUITE: None
We can see it come up in the Kubernetes explorer:
This cluster was set up with Azure CNI for a flat network. I was interested to see how that might look in the DNS Flow Graph:
Now let’s add a basic Vote app
$ helm repo add azure-samples https://azure-samples.github.io/helm-charts/
"azure-samples" already exists with the same configuration, skipping
$ helm repo update
Hang tight while we grab the latest from your chart repositories...
...Successfully got an update from the "kuma" chart repository
...Successfully got an update from the "azure-samples" chart repository
...Successfully got an update from the "datadog" chart repository
...Successfully got an update from the "rancher-latest" chart repository
...Successfully got an update from the "newrelic" chart repository
Update Complete. ⎈Happy Helming!⎈
$ helm install azure-samples/azure-vote --generate-name
NAME: azure-vote-1636748326
LAST DEPLOYED: Fri Nov 12 14:18:46 2021
NAMESPACE: default
STATUS: deployed
REVISION: 1
TEST SUITE: None
NOTES:
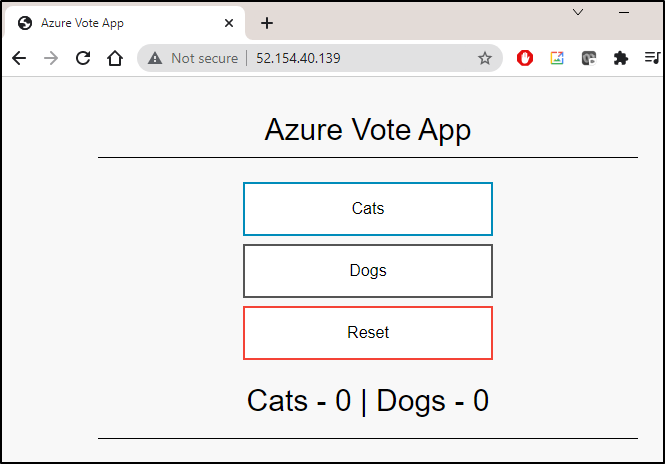
The Azure Vote application has been started on your Kubernetes cluster.
Title: Azure Vote App
Vote 1 value: Cats
Vote 2 value: Dogs
The externally accessible IP address can take a minute or so to provision. Run the following command to monitor the provisioning status. Once an External IP address has been provisioned, brows to this IP address to access the Azure Vote application.
kubectl get service -l name=azure-vote-front -w
$ kubectl get service -l name=azure-vote-front -w
NAME TYPE CLUSTER-IP EXTERNAL-IP PORT(S) AGE
azure-vote-front LoadBalancer 10.0.223.187 52.154.40.139 80:31884/TCP 71s
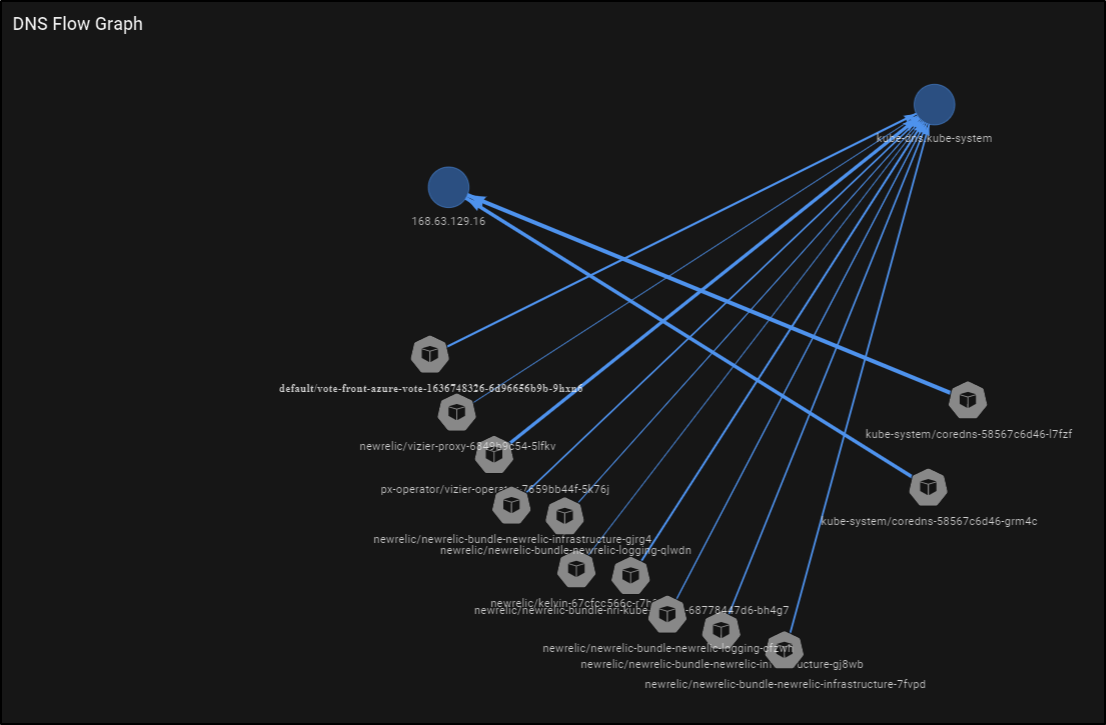
Now we can see the new pods in the DNS Flow Graph
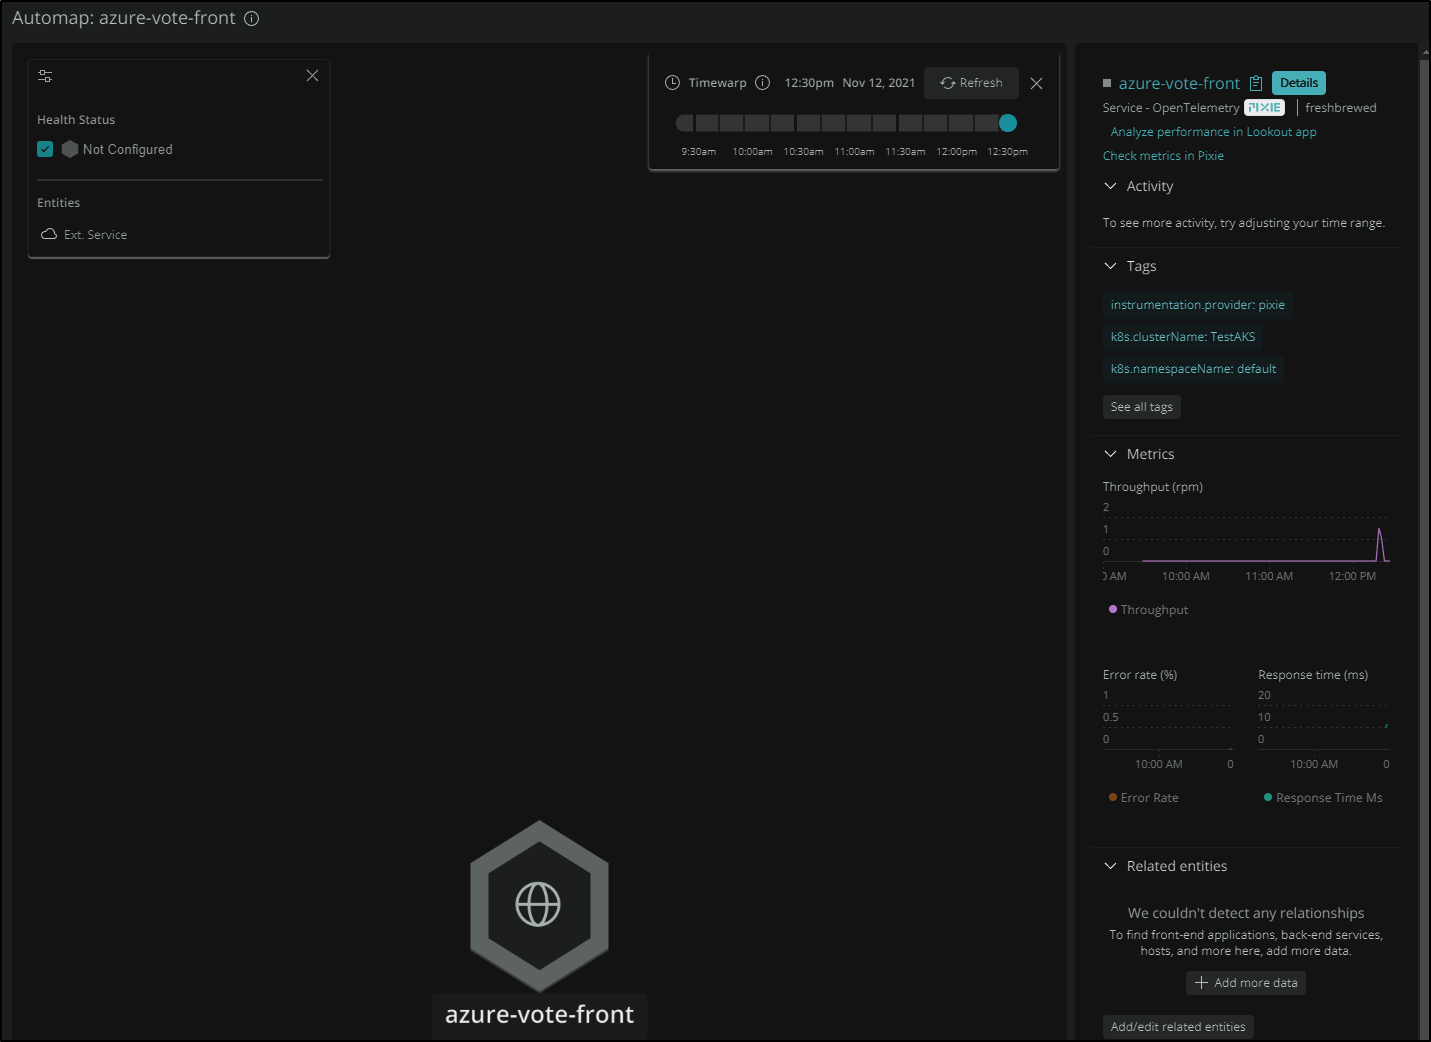
We can see the services under OpenTelemetry. Since I know i didnt setup the OTel connector, it shows it was New Relic that picked it up
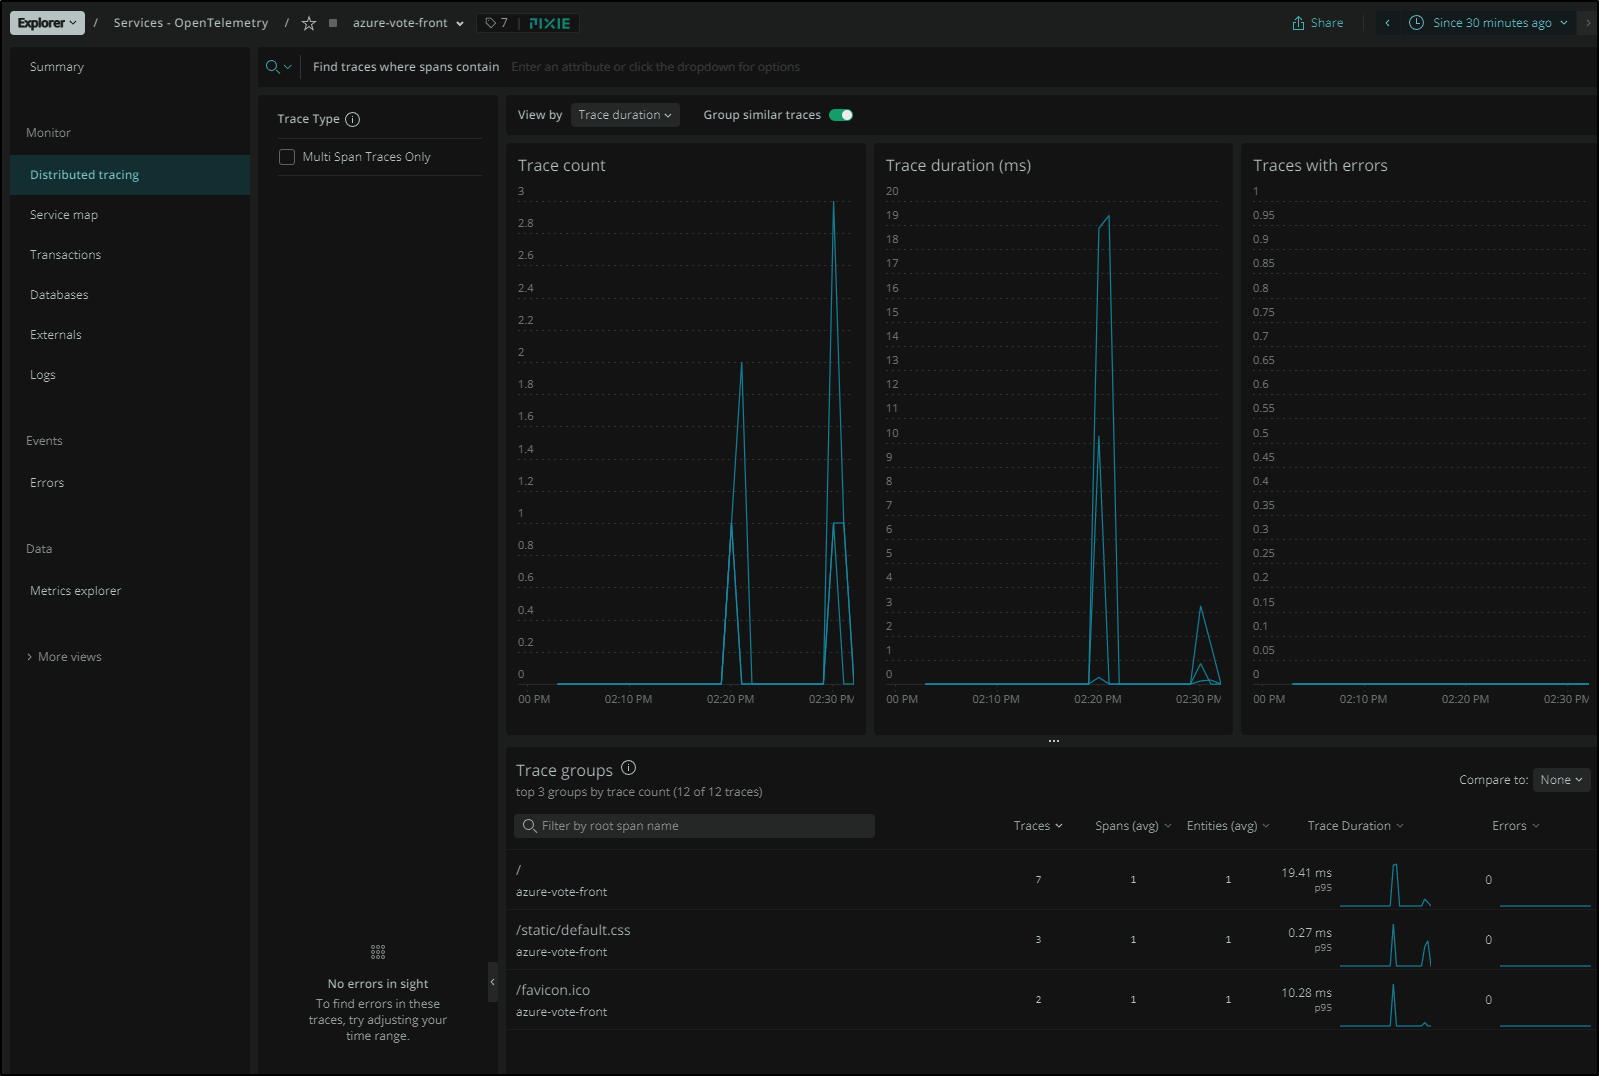
We can also see trace data as picked up automatically:
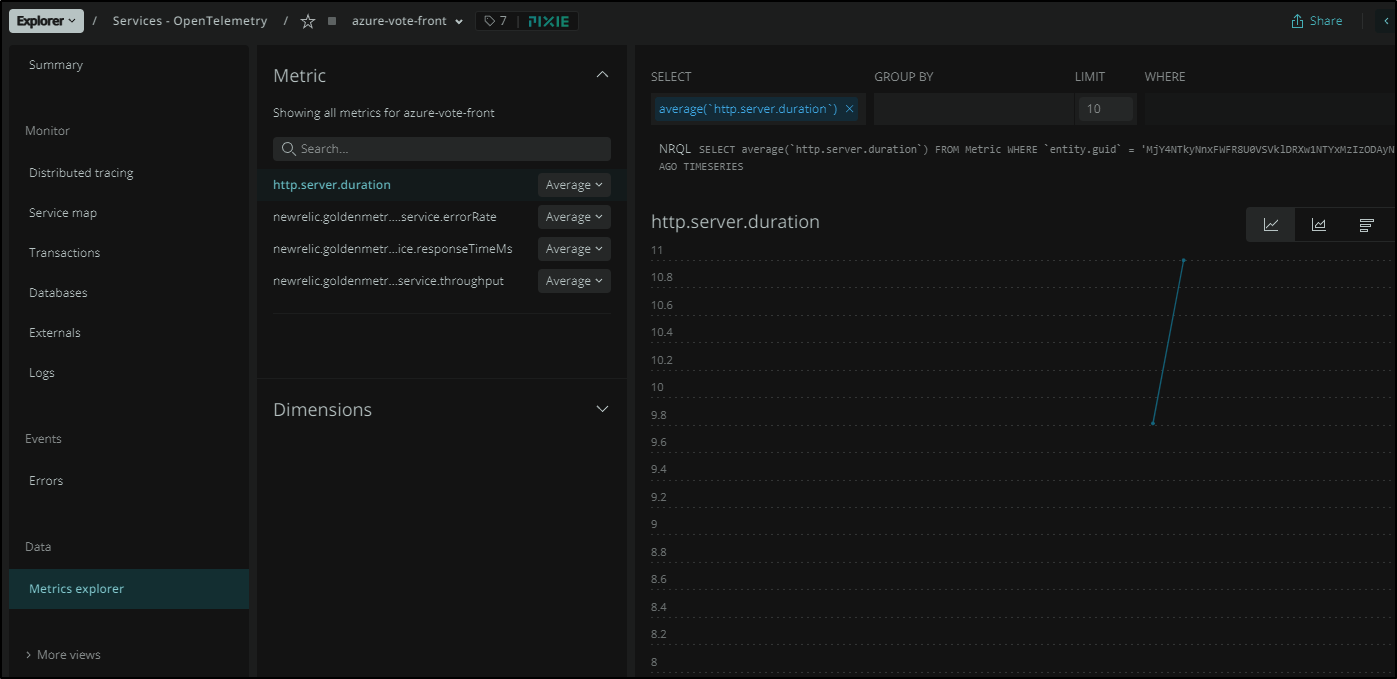
We can also see what Metrics are picked up:
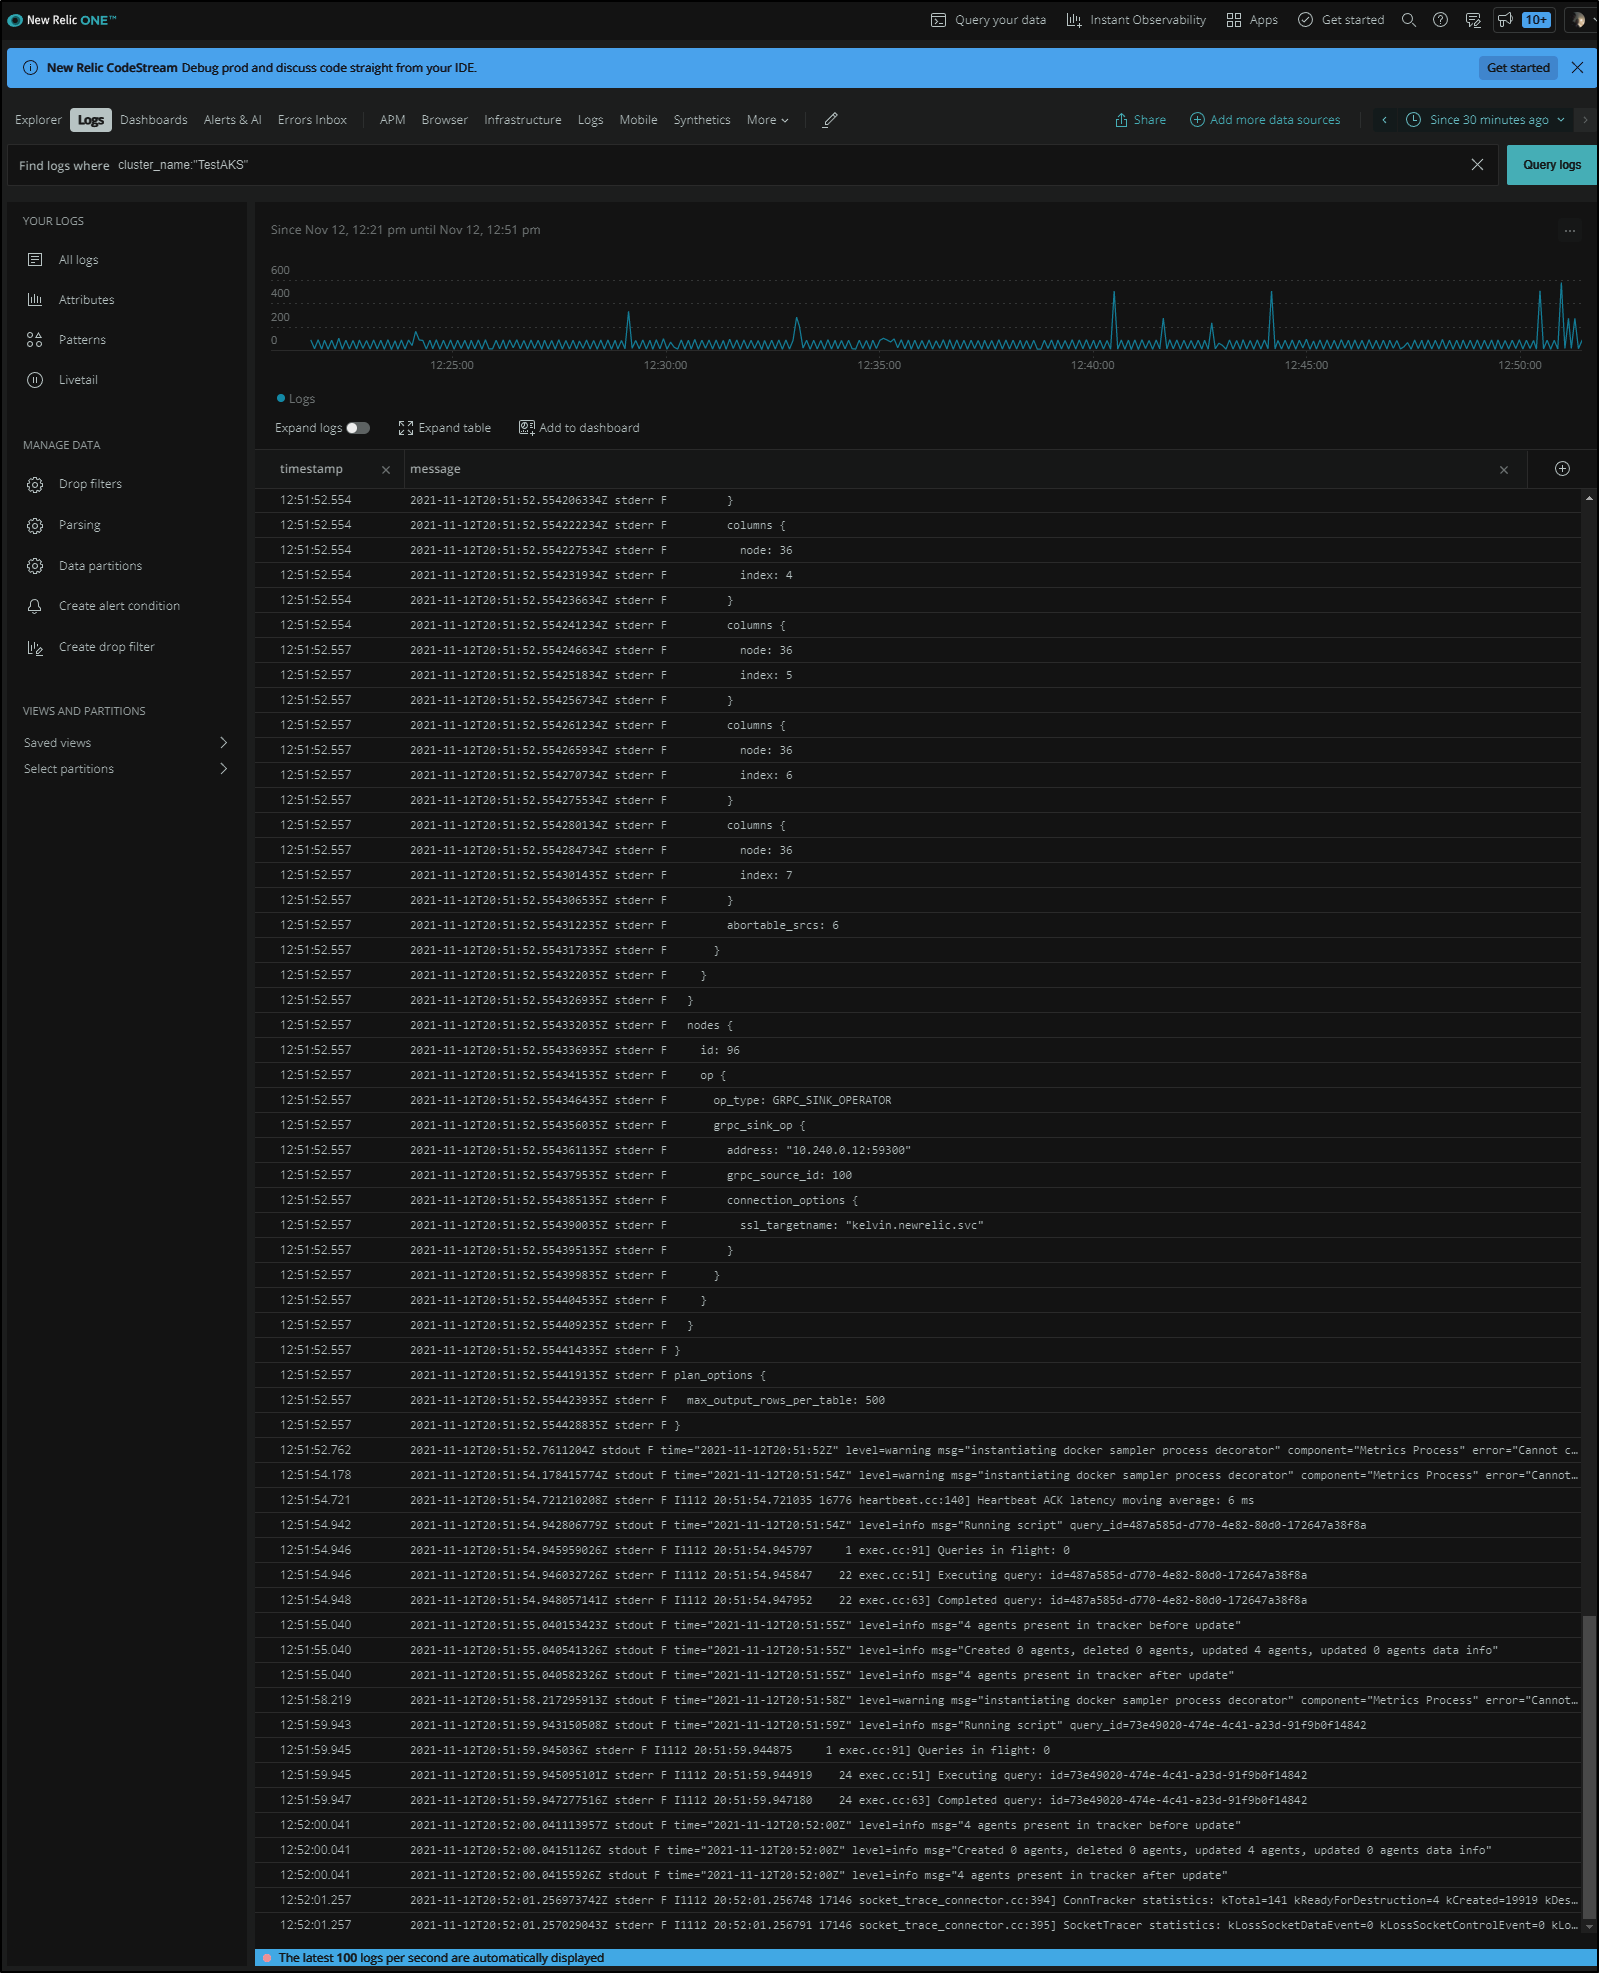
We can also use the selector cluster_name: "TestAKS" to live tail logs from the cluster
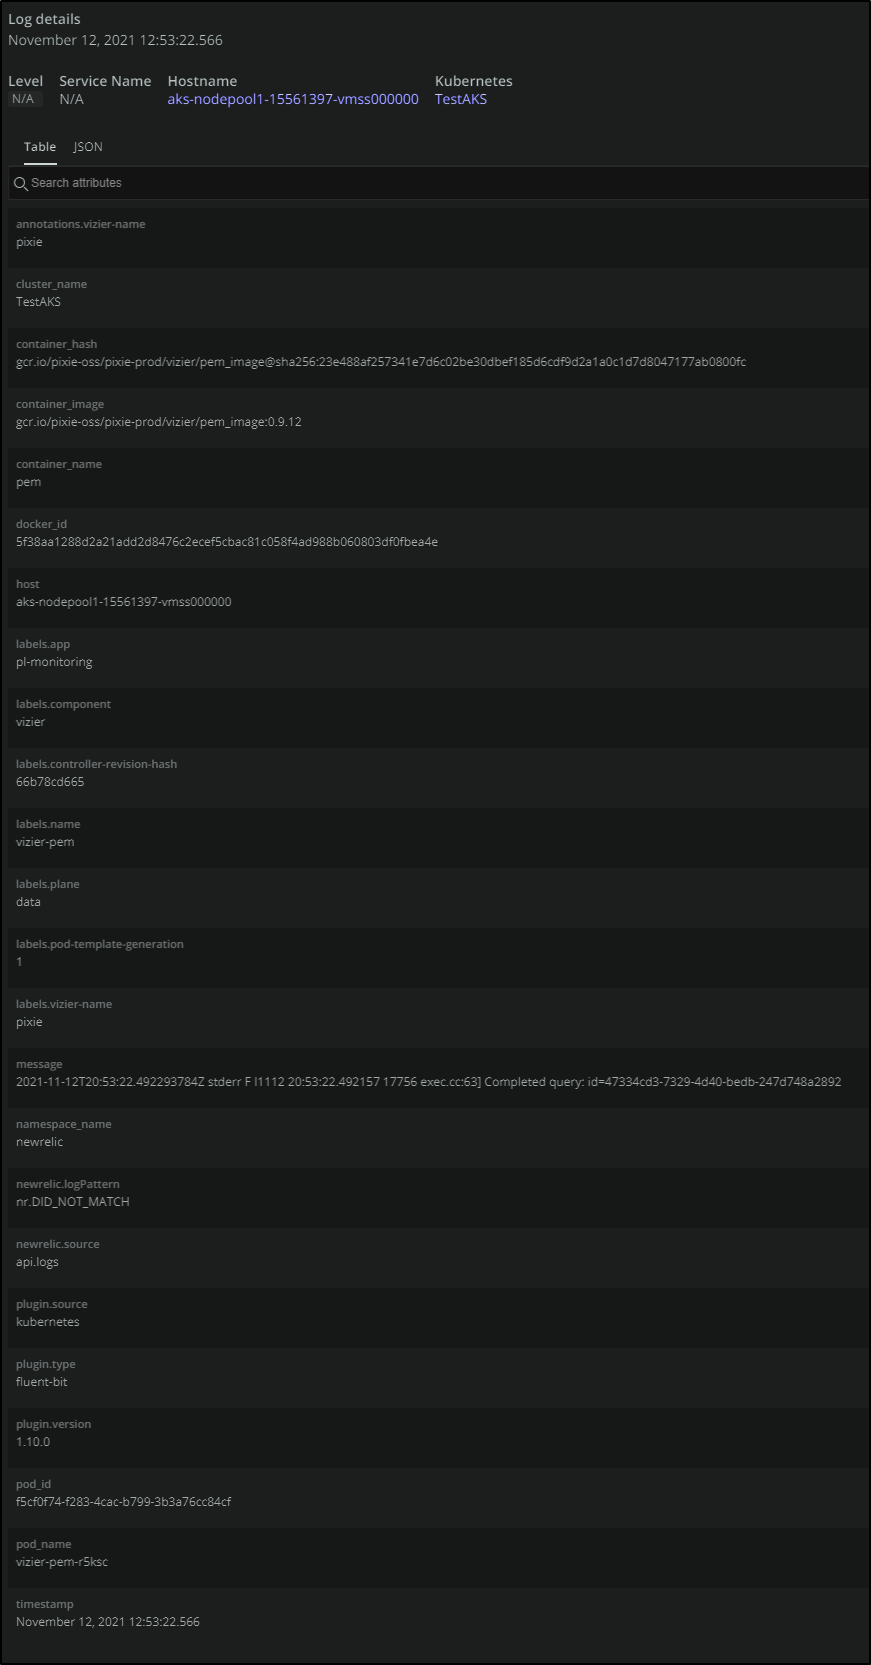
And a log details shows all the metadata collected
Muting Rules
Something I haven’t seen elsewhere that I think is pretty damn nice is the ability to add muting rules.
For instance, I like to know when my on-prem cluster goes down, but I also need my Z’s. I could, of course, work with OpsGenie to mute alerts at night…
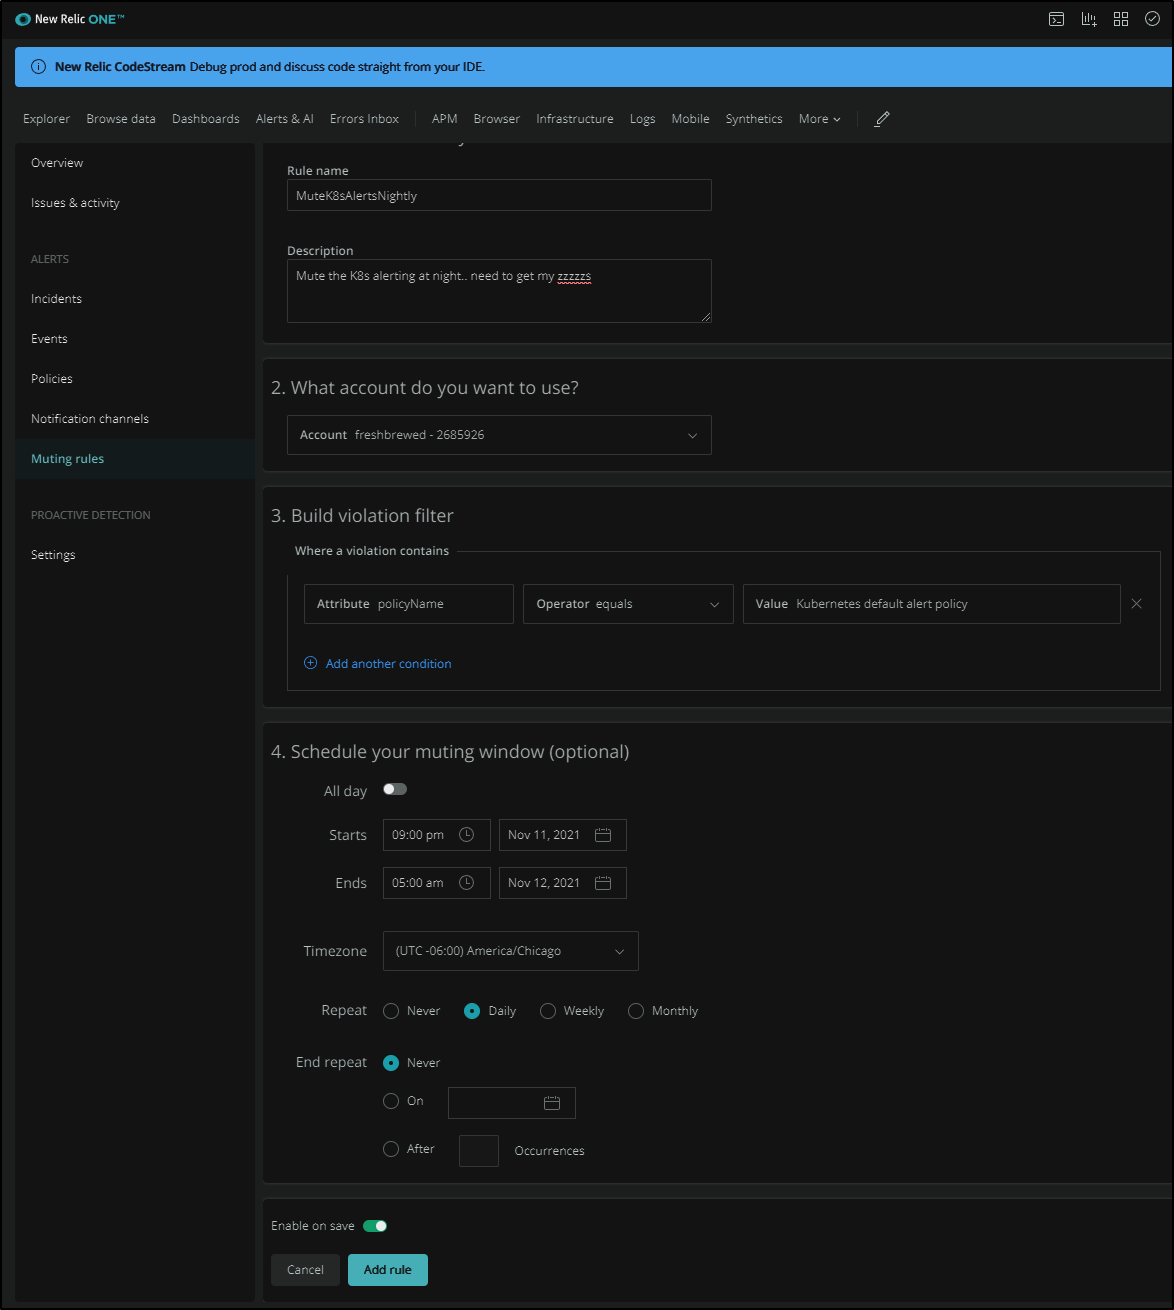
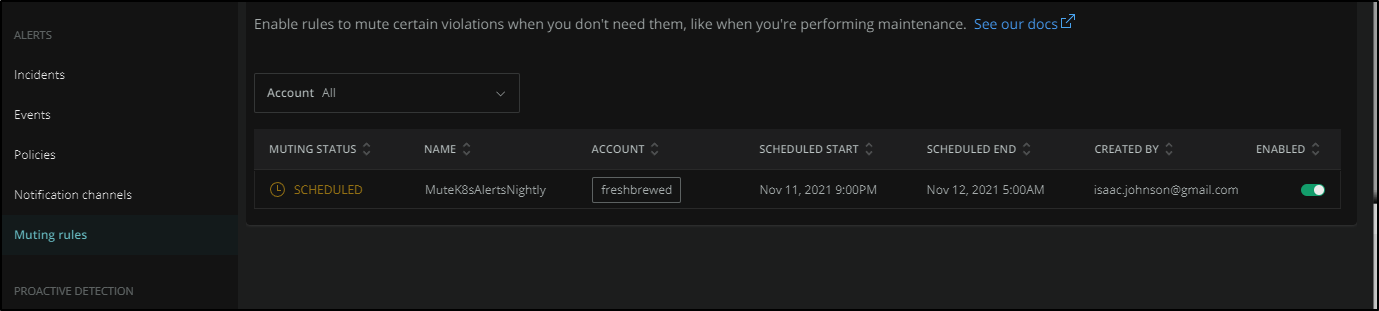
However, New Relic has a “Muting Rule” that we can pick a policy to mute during time windows. Perhaps we want to mute all alerts on the big “Release Night” (one time) or every night (as I do)
Here we can see a Nightly Rule set to mute alerts when I am likely asleep.
Once saved, we can see that it’s “scheduled” for tonight and i could optionally disable it.
Pricing
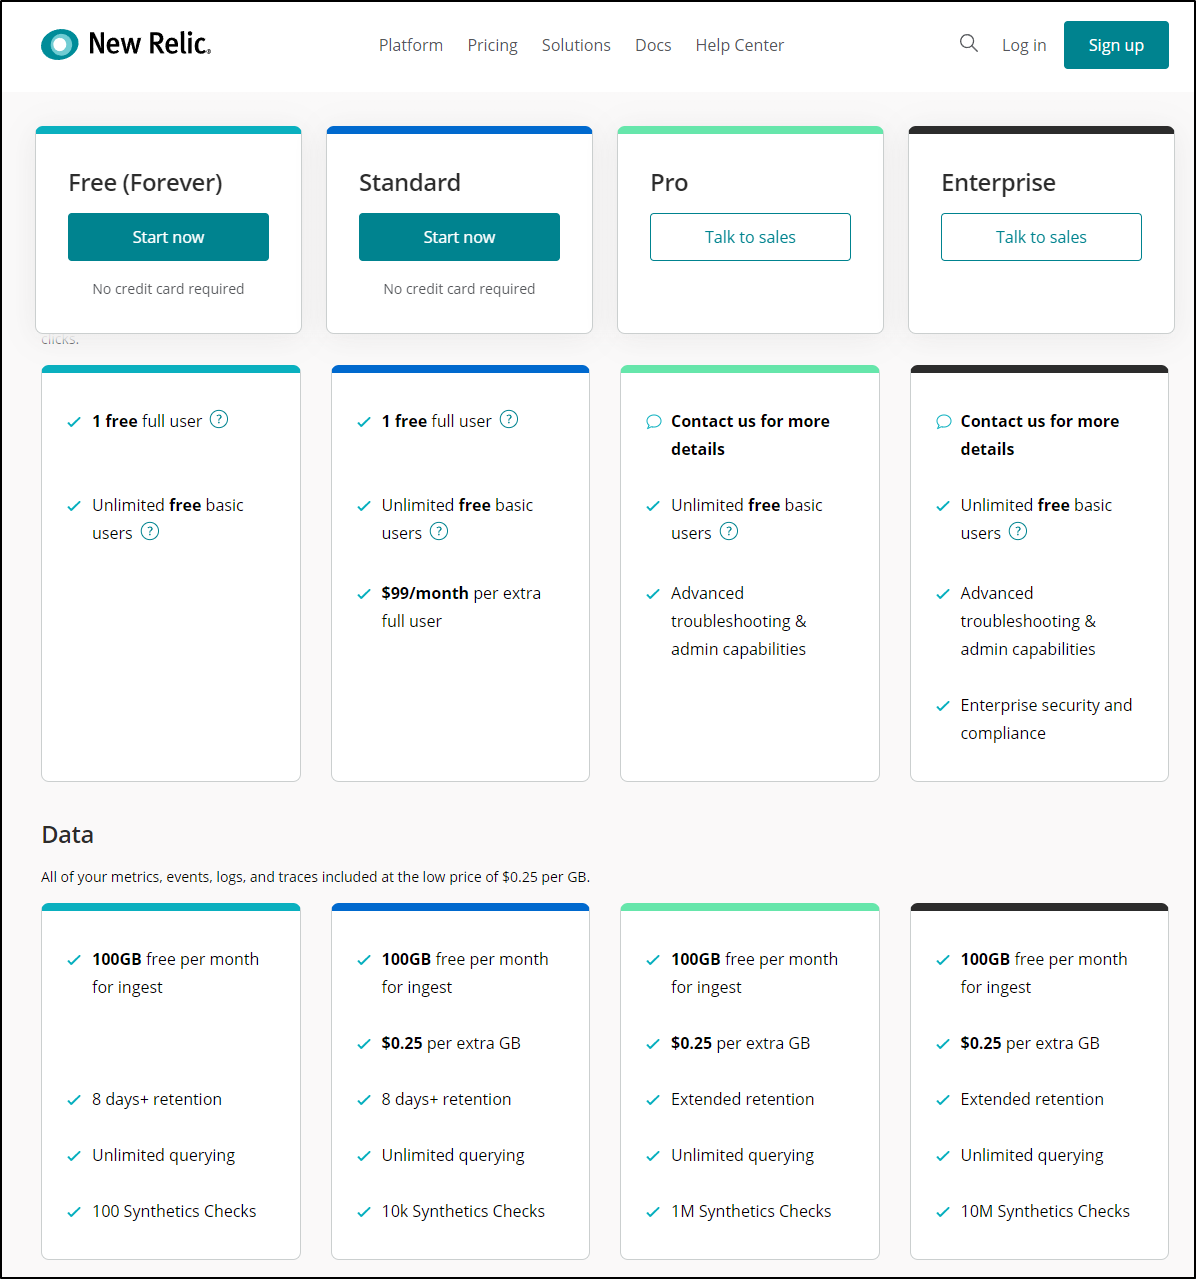
New Relic Pricing is a little different, and frankly something they changed it radically a year ago moving from 3 products to one and pricing on a user model.
Like DD, they have a Free model which gives me 1 free user and 100Gb of ingest a month. Here is where Pixie comes in, in a major way: by only sending the basic data up and letting me use Pixie to query data on my cluster, I greatly reduce cost and am able to do a whole lot while staying in the free tier.
Summary
I feel like I’ve only touched the leading edge of the iceberg on this product. I had not used it since my times at Intuit and even then, only was I loosely aware of it for alerting.
The fact is, I came in thinking I would quickly try and disgard this offering. But the more I looked, the more impressed I became. Features like muting rules and automatic tracing discovery with low level metrics capture.
Once I sorted out that Pixie issues all were due to some (perhaps ill advised) reliance on 3rd Party cookies, I found this to be the most feature rich offering I’ve tried out to date.
The only outstanding question is what features are part of the free 1 user offering and which are only available at the paid levels.